Guest Post by Willis Eschenbach
Sometimes a chance comment sets off a whole chain of investigation. Somewhere recently, in passing I noted the idea of the slope of the temperature gradient across the Pacific along the Equator. So I decided to take a look at it. Here is the area that I examined.

Figure 1. 17-year average temperatures, CERES dataset.
I’ve written about this temperature gradient before, in a post called The Tao of El Nino. If you take time to read that post, this one will make more sense. Here’s the money graphic from that post:

Figure 2. 3D section of the Pacific Ocean looking westward along the equator. Each 3D section covers the area eight degrees north and south of the equator, from 137° East (far end) to 95° West (near end), and down to 500 metres depth. Click on image for larger size.
The main idea put forward in that post is that the El Nino/La Nina phenomena function together as a cyclical pump to pump warm water to the poles. A cyclical pump has two cycles. In the first cycle, the El Nino intake cycle, the pump fills up with whatever is going to be pumped.
This intake cycle is shown in the left part of Figure 2, the El Nino section, you can see the buildup of warm water.
The second cycle of a cyclical pump, the ejection cycle identified as “La Nina”, is where the pumping action actually occurs. The result of this cycle is shown in the right part of Figure 2, where the warm water has been pumped out of the area.
What happens in this second cycle is that at a certain point, the warming of the equatorial eastern Pacific waters makes strong winds kick in. These winds push the warm surface water first to the west, along the equator in the blue zone shown above. From there, the warm water splits and moves towards both poles. Overall, this cools the planetary surface.
Given the effect of La Nina in terms of water movement, let me call the action of the combination the “La Nina Pump”.
I started my latest peregrination by looking at the long-term average slope of the temperature across the area encompassed by the blue box in Figure 1. Figure 3 shows that result for the Reynolds sea surface temperature dataset from 1981 on. Figure 4 shows the same result for shorter the CERES dataset, from 2000 on.


Figures 3 & 4. Long-term average equatorial Pacific sea surface temperatures, by longitude. This is the averages by 1° longitude of the ocean within the blue box in Figure 1. The Reynolds data serves to confirm the shorter CERES dataset … and vice versa.
The right-hand end of the blue box, at ninety degrees west longitude near South America, is the cold end. It’s at about 26°C (79°F) or so. At the other extreme, the left-hand end of the blue box, at a hundred fifty five degrees east longitude near Asia, is the hot end of the box. It’s at about 30°C (86°F). So this was good. I’d graphed out what they had called the “temperature gradient”.
However, this was not satisfying. I wanted to see how that temperature gradient changed over time. In particular, I wanted to see how it responded to El Nino and La Nina events.
So I made up a movie, showing month by month from 1981 to 2018 what the temperatures in that area were doing. However, that movie, too, was not what I wanted, because I couldn’t see what the status of the El Nino was.
As you might imagine, my next move was to add the MEI, the Multivariate ENSO Index, to the movie. Of course, having done that, I also had to add the NINO34 Index, the Oceanic Nino Index (ONI) and the inverted Southern Ocean Index (SOI).
So I made the movie, and I watched it over and over to try to understand what was happening. I realized that a) the various NINO indices all moved as a fairly tight group, and b) it sure looked to me like the NINO indices moved in sync with the average temperature of the entire region in question.
So I checked to see how well the average temperature for that area (8°N/S Latitude, 155°E – 90°W Longitude) matched the other El Nino indices. Figure 5 shows that match. I’ve used the Reynolds OI sea surface temperature dataset, available here, to calculate the average area temperature.

Figure 5. El Nino indices, including the average temperature 8°N/S latitude, 155°E – 90°W longitude. All indices have been standardized. The SOI has been inverted to agree with the sense of the other four indicators.
As you can see by how little of the red line is visible, the average temperature of that blue box area tracks almost exactly with the other indices. So I added the average temperature to the El Nino indicators, and here’s what that final movie looks like.

Figure 6. Movie showing the month-by-month changes in the cross-Pacific equatorial temperature gradient. Southern Ocean Index is inverted. All El Nino indices are standardized to a mean of zero and a standard deviation of one.
I was greatly encouraged by a couple of things in this movie. One is the similarity of this action to that of an old-time fireplace bellows. It looks like a pump. Doesn’t mean anything … but I liked it.
The second encouraging thing was finding out that the average temperature of the area is an excellent indicator of the state of the El Nino phenomenon. It tracks very closely with all of the other El Nino indices. This brings up an interesting possibility, that I can do something I’ve wanted to do for a long time. This is to estimate the total amount of energy moved by the La Nina Pump. I’ll get to that in a minute.
Using the average temperature of the blue box area as an El Nino index, here’s what happened in that region over the past 37 years regarding the La Nina Pump.

Figure 7. Repeated cycles, El Nino and La Nina, as shown in average equatorial Pacific temperatures.
After pondering and examining this graphic for a while, I realized a most curious thing. The oddity is that in all cases, the temperature drop associated with the La Nina phenomenon began in November, and ended in the following November. Figure 8 shows all of the drops in the record that match that criterion. The shaded areas go from one November to the following November.

Figure 8. Highlighting the 13-month temperature drops associated with the La Nina Pump.
I like this graphic because it gives what seems to be a novel and very clear and unambiguous way to identify the intermittent operation of the La Nina Pump—it starts in November and ends the following November. It’s also quite curious, in that the one-year drop happens with both large and small El Nino/La Nina combinations.
Let me note that this is quite a different interpretation than the normal one, where a warm equatorial Pacific Ocean temperature is called “El Nino” and a cool ocean is called “La Nina”. This is a functional definition of the La Nina Pump, seen as starting when the ocean is warm and ending when the ocean is cool.
So finally, let me look at how much energy is transported by the El Nino Pump. Temperatures generally don’t change much vertically in the “mixed layer” of the ocean. This is the top 10 – 100 metres (33 – 330 feet) of the ocean which is constantly being mixed by the action of wind, currents, and nocturnal oceanic overturning. See here for details. Figure 9 shows the long-term average mixed layer depths.

Figure 9. Average mixed layer depth, metres. Allow me to digress a moment regarding the mixed layer. In the great Southern Ocean surrounding Antarctica, the latitudes from 40°S to 49°S are called the “Roaring Forties”, after the nearly continuous storms there. Heck, I just looked, it’s storming there right now. No surprise. And the latitudes in the next band south, from 50°S to 59°S, are called the “Screaming Fifties”. I always figured that “screaming” referred to the sailors, not the wind, so I’ve never taken a boat there. My point is that you can see how these insanely strong and constant winds, combined with cold, generally sinking surface waters, result in a mixed layer a hundred metres deep and more. We now return you to your regularly scheduled programming.
In the area of the Pacific in question, the mixed layer depth averages about 50 metres. However, it’s shallower in the eastern Pacific where the largest temperature swings are, so I’ll use 40 metres as a weighted average.
Now, I can estimate the amount of energy moved by noting that it takes about 4.1 megajoules of energy to raise a cubic metre of water by 1°C. And since we’re assuming that the mixed layer is approximately the same temperature from the top to the bottom, it takes about 4.1 * 40 metres deep ≈ 165 megajoules/square metre/degree to warm a one square metre X 40 metre deep column of the mixed layer by one degree.
Next, to calculate the total amount of energy lost, I looked at the total of the temperature drops during the shaded times in Figure 8 above. This was a total of 16.5 degrees of direct La Nina temperature drop over the period of record. I multiplied that by the 165 megajoules per degree and divided by the number of years, giving 74E+ joules/square metre/year. Then to convert joules to watts I divided by seconds per year, giving a final average constant energy loss of 2.4 watts per square metre.
What does this mean in more intuitive units? Well, over the period of record, the area shown in red above ended up 16°C cooler than it would have been without the La Nina cooling episodes shown in Figure 8.
Ruminations on the Equatorial Temperature
The first thing that strikes me is the total absence of any temperature trend in the last 37 years in this large region of the equatorial Pacific. This supports the idea that the El Nino Pump is part of the global thermoregulatory system. When warm tropical water builds up in the eastern Pacific, the La Nina winds spring into existence and they blow all that warm water first west to Asia, and thence to the polar regions. It is this La Nina Pump action, removing the warm water so it can be replaced by colder water from underneath, that prevents the equatorial Pacific from overheating.
In addition, the La Nina Pump does not just prevent overheating. This kind of threshold-based emergent phenomenon serves as an active thermostat. To do that in a lagged system, it must have “overshoot”. This means that at the end of a La Nina pump cycle, the temperature must be below, even well below, the long-term average … see Figure 8. From there it warms up until the next La Nina pump cycle, and so on. Net result?
Thermostatically controlled Pacific tropical temperature.
Anyhow … that’s what a chance reading of the idea of the “Pacific equatorial temperature gradient” led me to.
Best wishes to all on a sunny summer afternoon. 
The coastal fog burned off a couple of hours ago, and the plant-based solar collectors in the forest that surrounds our house are working overtime, soaking up CO2 and using sunshine to convert it to O2 …
w.
Mother Nature knows what she is doing, so the “Green Machine ” must be sexist !!
CO2 is being converted sugars, usually glucose first.
H2O is being converted to O2.
The O’s in CO2 do not make free oxygen.
Thanks, Joel. I know, but the net effect is CO2 in, O2 out … I thought about including the internal dynamics but decided it was too much information.
w.
O2 may keep us alive, but…
CO2 makes sugar,
sugars make ethanol.
ethanol makes us happy.
Life without happiness is not living.
CO2 is our friend.
O2 is simply a waste byproduct of photosynthesis.
IMO it’s wrong to concentrate on the waste product and to ignore the important product, which is sugar:
6 H2O + 6 CO2 –> Light –> C6H12O6 + 6 O2.
Because the light (photon-driven) reactions involve water being split, the waste O2 is entirely from oxygen in the water.. And the sugars use the CO2 molecules in the dark reactions.
I recall seeing a poster once that (supposedly, I am not a biochemist to validate it) showed all of the chemical processes going on inside a “simple” phytoplankton. Fairly large poster, with just the chemical formulae and compound names.
Thank you for not giving us about fifty more pages of actual explanation…
The latest research on photosynthesis shows that plants use quantum tunnelling in photosynthesis — explaining how a structure/organ in the plant can transfer near 100% of captured photons to the reaction center although the excitons only last ~1 ns.
Turns out that biologic organisms are likely shaped from quantum effects. The old adage of puzzle piece organic chemistry is even being overturned, as it has been found that it’s actually the vibrational frequency of the molecule that our bodies are using, not the shape of the molecule.
https://www.researchgate.net/profile/Franco_Nori/publication/233923372_Quantum_biology/links/0deec53c9030171813000000/Quantum-biology.pdf
Yay – string theory lives!
I’m with joel and Khwarizmi on this one. It is sad how often we have the misconception that the oxygen gas released by plants during photosynthesis comes from the chemical conversion of carbon dioxide when in fact the free oxygen comes solely from the chemical breakdown of water molecules.
If we study the process of oxygen gas formation by considering the issue of chemical bonds then the likely source of the oxygen gas becomes more apparent. CO2 molecules have double covalent bonds between the central carbon atom and each oxygen atom whereas water molecules have single covalent bonds between the central oxygen atom and each hydrogen atom. Molecules of carbon dioxide and water are both present in the free atmosphere, but carbon dioxide is photo stable, whilst the water molecule can photo dissociate in the presence of UV light in the upper atmosphere. The greater stability of the carbon dioxide molecule is due the double covalent bonds so it is reasonable to hypothesize that in biological photosynthesis the energies require to dissociate the hydrogen and oxygen atoms in water are less than the energy required to break the double covalent bonds of CO2.
I wonder if one of the reasons for the persistence of this false idea that the oxygen gas is sourced from the CO2 comes from the fact that we call sugar molecules “carbohydrates” that is “hydrated carbon” or “carbon water” when instead sugar molecules can more accurately be described as polymers of methanol (H3COH) – the simplest possible alcohol. Consider a simple six carbon hexose sugar, the four central carbon atoms within the body of the chain have the structural formula HCOH, at one end the formula is H2COH and clearly relates to methanol (H3COH) while at the other end of the chain the chemical structure relates to an aldehyde HCO with the oxygen atom bound to the carbon atom by a double covalent bond (just as in the original CO2 gas).
“The O’s in CO2 do not make free oxygen.”
They do Joel. First step of sugar photosynthesis is glucose. The equation of chemistry is the following:
6 CO2 + 6 H2O = C6H12O6 + 6 O2
As you can see water can provide only the half of the O2 (3 O2) made free by this process, the other half (3 O2) comes from the CO2, because 6 H2O contains only 3 O2.
In this process CO2 also must lose oxygen not only water.
Of course, the real process more complicated. First, CO2 gives oxygen to hydrogen resulting in water then this water will be split to make free oxygen.
The real equation is 6 x CO2 + 12 x H20 ==> C6H12O6 + 6 x O2 + 6 x H20
For a balanced shorthand version, you can remove 6xH2O from both sides of the equation – which is what you usually see in print. But 12 water molecules are used to produced each glucose molecule.
And the oxygen emitted by plants does comes from water – quote:
=======
“One of the first clues to the mechanism of photosynthesis came from the discovery that the oxygen given off by plants is derived from water and not from carbon dioxide. The chloroplast splits water into hydrogen and oxygen. Before this discovery, the prevailing discovery was that photosynthesis split carbon dioxide and then added water to the carbon”
– Biology (5th Edition), Campbell, Reece & Mitchell, p.171
======
addendum:
” One of the first uses of an isotopic tracer in biology was in the determination of the source of the oxygen produced by photosynthesis. Using a heavy isotope of oxygen, 18O, to label one of the two reactants in the photosynthetic process, Samuel Ruben and collegues at UC Berkeley were able to determine that the oxygen gas came not from carbon dioxide, but from water. ”
the source of oxygen in photosynthesis
Great explanation. Thank you.
“Of course, the real process more complicated. First, CO2 gives oxygen to hydrogen resulting in water then this water will be split to make free oxygen.”
You’ve got this backwords, which is why you get confused. First the water gets split, from which you get molecular oxygen (waste product), and nitrogen in the form of high energy electrons (H-, and the resulting reduced derivatives), and protons (H+). The H+ and H- ultimately are used to form reduced nicatinamides (NADPH) and chemical energy (ATP). The NADPH and chemical energy are then used to fix CO2 to ultimately produce glucose, as well as some water. All of the oxygens emitted as O2 come from water, but there is no requirement that any of this water comes from the fixation of CO2 as there is plenty of water as “bulk solvent”.
Sorry Peter Tari.
You are wrong. Go get a good biochemistry book and study it.
One must remember RUBISCO which is the 1st compound that is formed from the CO2 (in competition with O2) in photosynthesis. If I remember correctly the break even point is 27% O2 at ~300 ppm CO2 (it been a long time) so we have a ways to go before all plants die esp. with rising CO2 levels.
Anyway, it’s all good and getting better!
RuBisCO stand for Ribulose-1,5-bisphosphate carboxylase/oxygenase. It is an enzyme that catalyzes the first step in the conversion (reduction) of CO2. CO2 and O2 both compete for the reaction site in RuBisCO.
RuBisCO catalyzes the addition of the CO2 molecule to ribulose-1,5-bisphosphate to make two 3-phosphoglycerate molecules in the Calvin-Benson cycle.
“It is this La Nina Pump action, removing the warm water so it can be replaced by colder water from underneath, that prevents the equatorial Pacific from overheating.
ENSO neutral conditions also remove warm water (move it westward) so upwelling in the east goes on.
La Nina is just 1/2 the pump.
The El Nino cools and dries out the Western Pacific.
Cold water upwelling in the East Pacific is greatly reduced during El Nino’s. Replaced by an eastward moving warm Kelvin wave(s).
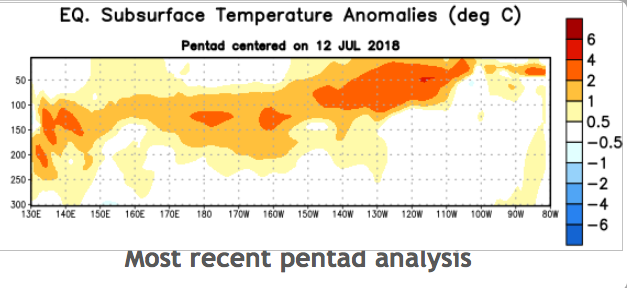
From December 2017 to May 2018, successive Kelvin waves contributed to the eastward shift of positive and negative subsurface temperature anomalies. El Nino conditions are currently forming.
During La Nina’s, cold water upwelling is simply enhanced in the eastern equatorial Pacific.
It is surface water advection-driven evaporation by the Easterlies (trade winds) of the equatorial Pacific that are what keep the equatorial Pacific from overheating.
Your convection equatorial SST regulatory hypothesis is more on the right track Willis, IMO.
Excellent post, as usual, Willis!
Suggestion: Fix the sentence beginning with “in addition “
Thanks, Robert, fixed.
w.
” It is this La Nina Pump action, removing the warm water so it can be replaced by colder water from underneath, that prevents the equatorial Pacific from overheating.”
The colder water from underneath comes from the poles?
“The colder water from underneath comes from the poles?”
Yes.
The whole idea that there’s a “La Nina pump” that “replaces” the warm surface waters with colder, polar-origin waters “from underneath” throughout the equatorial Pacific is groundless fantasy. The surface layers are not replaced, as such, but are transported in corpore by wind-driven currents throughout the entire ENSO cycle. (The replacement at any location is overwhelmingly by mixed-layer waters from adjacent locations. ) What little subsurface water upwells to the equatorial surface is the result of shallow horizontal Langmuir vortices that develop mostly in the eastern reaches due to the mass convergence of cooler surface currents. They are part of the great hemispheric gyres that do not extend into polar waters.
Hi Willis. Thanks for a clear description of the Pacific thermostat.
.
.
I have three questions.
.
1. When the Western flowing equatorial currents split and go north and south some of the warm water oozes pass the Philippines into the Indian Ocean. Is this negligible?
.
2. On some diagrams showing the Western equatorial current they show a small East flowing counter-current. Is this negligible?
.
3. 7 billion people moving around working even sleeping are generating heat constantly. Has anyone calculated the temperature increase due to population going from 1 billion to 7 billion?
.
.
Sandy,
Minister of Future
Approximately 1.83 x 10^19 Joules additional per year, assuming 2,000 dietary calories per person per day converted to waste heat. Putzing with Willis’s figures (and if my calculator-foo is working this late at night), that’s about enough to warm 10,000 square kilometers by one degree. Or the entire ocean by a bit less than 0.00003 degrees (to Willis’s depth of 40 meters).
I think we can keep just living without much worrying.
Don’t forget the Calories regarding human food consumption are actually KCal, or 1000 Calories per 1Kcal. In other words, the 2,000 calories we’re used to seeing is actually 2,000,000 calories. We need a lot to sustain us each day.
“1. When the Western flowing equatorial currents split and go north and south some of the warm water oozes pass the Philippines into the Indian Ocean. Is this negligible?”
No. It is known as “The Indonesian Throughflow”. It has a considerable effect on both temperature and salinity in the Indian Ocean.
7e9 people are producing heating power of about ~500 GW. While this is lots of heat to be produced per unit of time, much more than a nuclear power station generates in use, it is neglible in what the Earth gets and dissipates. CO2 forcing is said to in the order of 1W/m², which is in the magnitude of a million GW. Also, to note. Human power is joules that has been first sequestered by plants, so it is energy that is coming from the Sun, so land-use is the effect humans have here.
Interesting presentation, Willis.
In your animated fig 6, the left end of the graph at 155E sits mostly between about 29 and 30.5C, often about 29.5, contrary to an expectation that it might show a more pronounced temperature build-up prior to big El Ninos like 1998 and 2017.
The moving image that I get is that the west 1/3 of the region gets a little hotter (by comparison) then releases as a pulse that moves east, being anomalous down to 250m or so as your figure 2 indicates, as is known. The big question is the source of anomalous heat. It is a self-contained system that re-distributes heat, or is it anomalous because of exogenous effects? There might be an indication if you take the area under the curve each month from fig 6. Thanks Geoff.
The La Nina Pump Willis
in all cases, the temperature drop associated with the La Nina phenomenon began in November, and ended in the following November. “”
I guess you cannot show it now, too early, but there should be a new shaded area starting last November 2017 under way with the last La Nina?
Good news for me as I keep telling JCH there will be a lag and continuing fall in temps for a few months.
The other thing is that there always could be be a third La Nina starting this November?
Is in November melts the ice in Antarctica? Does this have an impact on the speed of the Humboldt Current?
No. Very little if any melting at that time. The Humboldt current is essentially a part of the circumpolar current that is deflected by South America.
The temperature of Humboldt’s Current falls from the beginning of winter in the southern hemisphere.

Very cool. The only time the west-east temperature gradient really flattened out was 1997. Of the other two supaaare ninos, 1983 made a decent effort, but 2016 not so much; despite very impressive overall temperature spikes.
SOI is a completely different animal.
Willis,

This is an intriguing analysis! I’ve watched your Nina/Nada/Nino ‘movie’ several times… and I’m going to watch it a few more times. It is an interesting ‘oscillator’. The temperatures in the 150E – Int’l Date Line region remain relatively constant, with the area from the Int’l Date Line to 90W having the greatest temperature change during the ‘fill and flush’ cycle. To this old farm boy, your movie reminded me of the long-handled hand pumps that stood atop the old hand dug wells on both my grand mothers and parents farm. A La Nina Pump, indeed!
Why November? Some people think it’s the tides which are driven by the orbital geometry of the Earth, Moon, and Sun. link, link, link FWIW
As the Eastern Pacific cools, pressure increases over this area and the speed of the western wind increases at the equatorial Central Pacific.
I suppose that due to the solar minimum, ENSO will remain neutral, on a small minus.

The ‘pump’ concept is consistent with my previous suggestion that ENSO develops due to there being more oceans in the southern hemisphere such that more solar energy is absorbed into the oceans of that hemisphere.
Consequently. a thermal imbalance across the equator develops and periodically discharges into the northern hemisphere via El Nino events.
However, that still begs the question as to why there is apparently a global thermostatic mechanism underlying all Willis’s observations in the first place.
For that, one must look to the weight of atmospheric mass bearing down on the oceans which determines the energy cost of the evaporation process which in turn sets the amount of energy the oceans must absorb in order to supply enough evaporation to help keep the mass of the atmosphere suspended off the surface in hydrostatic equilibrium.
Water vapour, being lighter than air, reduces the vigour of convection that would otherwise be required to maintain hydrostatic equilibrium in the absence of water.
Water therefore does not set the global thermostat but does affect the average speed of convective overturning for the planet as a whole.
All one needs to set the thermostat at any given level of insolation of a sphere is gravity and atmospheric mass. An isothermal atmosphere can never occur since convective overturning around a sphere lit from one side cannot be suppressed due to the inevitable density differentials in the horizontal plane arising from uneven insolation.
Convective overturning always leads to a temperature decline with height due to conversion of surface heat in the form of kinetic energy to potential energy at height which does not register as heat until the molecules descend once more. GHGs are not required to cause the decline in temperature with height and have no effect on surface temperature since convective changes always neutralise radiative imbalances.
Interesting thoughts. Willis once graphed how evaporation and thunderstorms went ballistic with ocean surface temperatures around 30 or 31 C. (a huge observation imo). Air pressure, ie, air density, controls this set point. The higher the pressure(density), presumably the higher the set point would be. ( In the book Posture, Locomotion, and Paleoecology of Pterosaurs it is theorized that they were able to fly due to the oxygen-rich, dense atmosphere of the Late Cretaceous period…. thus explains the warmer earth?)
At a specific air density, the pump frequency would be driven by average insolation levels.
What drives average insolation levels? Clouds? Or is it the other way around? Are ocean oscillations, such as the NAO and ENSO driving clouds? (I note that even Dr William Happer was unsure of whether CO2 physics or clouds are the driver. ). Or is it random within a range controlled by Willis’s thermostat, as we slide back into another ice age?
Clouds certainly do affect average insolation levels since they influence average atmospheric albedo.
The oceans also affect clouds from the bottom up but only after solar energy has got into the oceans already.
Ultimately the driver of average global cloudiness appears to be a solar effect on the gradient of tropopause height between equator and poles which I have described previously.
Changes in that gradient alter jetstream meridionality/zonality which affects the length of the lines of air mass mixing and thus global cloudiness.
OK.. you have a mechanism.. but it is still random noise between a temperature range as we slide back into the next ice age. (cycles within cycles, 600 years, 100 years, 60 years, 11 years, etc etc.)
At what point do we accept that Willis has described the thermostat and then move on to examining the size of the control band? 1C? 2C? 3C? 4C? Random cycles, each interacting, each with memories? What is the role of CO2? Maybe next to zero as compared to clouds.
Good points! I suppose when we examine phenomena such as el Nino as parts of the greater climate system we are actually constructing models of pieces of a larger model. Not to be confused with the models used to explain and “prove” global warming, our models are being built from the ground up and assume we need to define the inputs much, much better before we start saying what future climate will look like.
I think that’s how science is supposed to work.
The stand out for me was 1997, that year the heat on the right of the graph rose very quickly to actually go above the left hand side.
That must have been a massive amount of heat in a very short space of time.
PS a great piece of analysis.
Agree. I thing the animation puts to bed the claim the 2015 Nino was the strongest ever. 1997 was by far stronger, basin wide and had far more significant regional impacts.
This article reminded me of a lecture by David Dilley which was originally published in 2014 (at least that was the earliest publication I have found). In this lecture he predicts the warm bump we just had which I found quite impressive; there are few accurate predictions in climate research. He is talking about the 18.5 year earth/sun/moon gravitational interaction and the exceptionally high tides that occur on this cycle due to the moon lining up with the sun on closest approach. This event is more generally known as the super moon.
He describes a pump action where the unusually high tide draws water away from the arctic and then, when the tides restore to normal, there is a pulse of warm water into the arctic which takes over a decade to circulate and dissipate. It just so happens that super el nino tend to occur around an 18 year cycle. This cycle is evident in the data presented in this article.
It is interesting from this article that although there looks to be a gravitational component involved, there is also a seasonal affect on the precise timing of the pump action.
Here is a link to the lecture. It is worth it just for the accurate prediction. https://www.youtube.com/watch?v=w4hbKF5-qUE
Thanks, David. First, there is no 18.5 year moon cycle. The actual number is 18 years 11 days 6 hours.
Second, there is no evidence of a “super El Nino” on an 18-year cycle, nor is there any 18-year cycle of “closest approach”.
Finally, the largest tides do not recur in 18+ year cycles.
w.
Thank you Willis for this very interesting post!
I think it touches the most important factor that contributes to the global climate.
The official global average energy chart, that famous incoming/outgoing energy chart, calculates the average temperature only based on the atmosphere and the greenhouse gases in it, ignoring the oceans.
Not one degree of the ‘warming anomaly’ is considered to come from the oceans. Everything there is due to greenhouse gases, what in my view results in an overestimation of the greenhouse gases effect.
I always thought that this was a wrong oversimplification.
Looking at the Earth’ energy balance, much more energy is stored and transported through the oceans compared to the atmosphere, the oceans do intake heat from the sun in depth up to 100 meters but lose heat only at the surface. That is a tremendous greenhouse effect completely ignored in our climatologists calculations.
Yes it is true all that energy leaves the Earth through the atmosphere, but what would be the situation without oceans? I doubt it would be comparable with what we have now.
As long as we use weather models and not models that calculate the net energy flows we have no chance of getting an understanding of the climate.
I think you are doing valuable work in helping better understanding how the oceans contribute to the energy balance, I wonder how many decades will pass until a proper energy balance will be calculated?
Hello Willis and thank you for this interesting article!
You’re writing: “The second cycle of a cyclical pump, the ejection cycle identified as “La Nina”, is where the pumping action actually occurs. The result of this cycle is shown in the right part of Figure 2, where the warm water has been pumped out of the area. What happens in this second cycle is that at a certain point, the warming of the equatorial eastern Pacific waters makes strong winds kick in. These winds push the warm surface water first to the west, along the equator in the blue zone shown above. From there, the warm water splits and moves towards both poles.” What causes these winds to occur and is there a mechanism that links high temperature to strong wind?
Might it be that after some very strong El Nino with very high temperature you’re getting very strong winds, blowing the water to a high wave crest west of South America, this in turn meaning a big quantity of cold water to well up in the center of the Pacific? All other things being equal, a large quantity of cold water needs a longer time to warm up for generating the next wind to blow it towards the coast of America. So the hight of the El Nino Peak and the depth (and perhaps the integrated area underneath some intermediate line in the diagram) of the La Nina trough could be interconnected to the duration of the El Nino period?
Regards
Michael
“From there, the warm water splits and moves towards both poles. Overall, this cools the planetary surface.”
In principle, I don’t see why increased poleward heat transport should cause overall cooling. It strikes me that the major warm pulses to the AMO peaking around 8-9 months past the peak of El Nino episodes would be driven by atmospheric teleconnections rather than by pumped water.
“When warm tropical water builds up in the eastern Pacific, the La Nina winds spring into existence and they blow all that warm water first west to Asia, and thence to the polar regions.”
How does that compare to what is known about the Pacific thermohaline flow field?
“The oddity is that in all cases, the temperature drop associated with the La Nina phenomenon began in November, and ended in the following November.”
That is an unusual way to describe the timing of the peak of El Nino episodes in the Nino 3.4 region. In the Nino 1 region they peak several months earlier.
http://www.bom.gov.au/climate/enso/monitoring/nino1.png
With all the chaos and feedback mechanisms running in the tropical Pacific, its pretty amazing to me that it can all fit together to regulate the water temperatures on a macro level.
Tides, currents, daily thunderstorm development, trade wind intensities, cloud coverage and albedo effects, changes in solar radiation (intensity and wavelength), volcanic aerosols, warm and cold water pools adjacent to the tropics creating massive highs and lows, solar and lunar cycles and of course, the most important: CO2.
The other amazing thing is we can have someone like Willis (a non-Phd sailor and wayfarer) sit down and with a computer, internet connection and a six-pack and come up with a piece of knowledge that is easy to understand and certainly competes with all the papers coming out of our climate science community.
Willis
What event or elements might effect the La Nina pump?
Willis,
Very good post. You propose the mechanism by which El-Nino translates into the ‘Permanent ‘El-Nino Effect’ on global atmospheric temperatures that has been described by Bob Tisdale and others on this site.
However, I think that your estimate of the amount of energy ‘pumped’ is underestimated. Your calculations seem to suggest that you are determining the energy change of the volume of water in the affected region. However the energy that is ‘pumped’ by your ‘La Nina Pump’ is determined by the flow of water through this region, i.e. the volume multiplied by the number of volume changes. As you do not estimate the flow of water through region, the amount of energy that is pumped cannot be determined. However, I suspect that this flow is many times more than one volume change per episode.
Willis
Very good “peregrinations”.
Now, will you join me in a small but determined movement?
Originally, I called it “Stamp out sesquipedalianism.”
But upgraded it to “Eradicate sesquipedalianism.”
Bob Hoye
🙂
Willis
Does the La Nina Pump synchronize the Stadium Wave?
My compliments on your insightful explorations, clear communications, and great discoveries.
Your November timing discovery prompted me to wonder how this might tie into the Wyatt & Curry Stadium Wave findings of about 64 year synchronized global weather cycles. See Wyatt’s Overview
Your figure 7 shows about 16 years between major pulses, giving 4:1 pulses to the 64 year cycle.
Could your La Nino Pump with its November timing be the synthronizing and triggering pulses that synchronize the 64 year Wyatt/Curry Stadium Wave?
http://www.wyattonearth.net/thestadiumwaveoverview.html
cc Wyatt & Curry
I like your functional definition of ENSO, much more useful than the arbitrary +- 0.5 for three months criteria. But it’s the tradewinds that are controlling the pump, not the temperature gradient. The winds are in turn controlled by the dominant east Asia and Pacific pressure systems.
Keep an eye on the current warm pool in the central Pacific. If it begins to move west in November then let’s see if it is indeed followed by 12 months of cooling. But my guess is the heat will move west before then.
When the climate changes either through a climatic shift or to a different climate regime what has been used as some kind of a standard will probably not hold up.
The climate is not going to stay in the same regime it has essentially been in since coming out of the Little Ice Age.
I expect at the very least a climatic shift which I think has already began.
Because of all the multiple lags in system response, lags that have phase delays of days to weeks to months to years to decades to centuries to millennia, the climate system is never at equilibrium.
Apologies – no time to provide references now – will do later if anyone is interested.
Equatorial average air temperature and humidity follow Equatorial Pacific Ocean temperature – about 3 months after the Nino34 SST Anomaly and about 5 months after the East Equatorial Upper Ocean Temperature Anomaly.
Global average air temperature follows Equatorial average air temperature and humidity about 1 month later.
Global average air temperature (and the Equatorial Pacific Ocean SST’s) have a natural temperature cycle averaging about 36 months peak-to-peak. For example, see the red line in the UAH LT plot, which averages 36.3 months peak-to-peak.
http://www.drroyspencer.com/wp-content/uploads/UAH_LT_1979_thru_June_2018_v6.jpg
Here are my questions:
Why ~36 months? What drives this number? Is it essentially a “natural period” of the Equatorial Pacific Ocean?
Hypothetically, if the Pacific Ocean were narrower, would the period be less, say 24 months?
Regards, Allan
My recent Hypo:
The aforementioned ~36 month period in the equatorial Pacific ultimately drives the ~9 month LAG in atmospheric CO2 trends AFTER global temperature trends – that I published in 2008, as re-stated by Humlum et al in 2013.
https://www.facebook.com/photo.php?fbid=1551019291642294&set=a.1012901982120697.1073741826.100002027142240&type=3&theater
This is the LAG of CO2 after temperature that few climate scientists want to acknowledge. I believe it proves that climate sensitivity (TCS, etc) to increasing atmospheric CO2 is very low, such that TCS may not even exist in measurable quantities.
Ergo: CLIMATE CRISIS CANCELLED.
“Cogito, ergo sum.”
[I think, therefore I am.”]
– René Descartes
“Cogito, ergo sum, ???”
[I think, therefore I am… I think.”]
– The Moody Blues 🙂
Wonderful work Willis.
As someone who has monitored ENSO closely for the past 2 decades, I have come to the conclusion that the La Nina Pump you refer too remains in place most of the time even through designated weak to moderate El Ninos. It only shuts down properly in Super Ninos.
Trade winds may weaken but not shut down for any length of time unless strong Ninos. I believe we are entering one of the weaker events and it will result in minimal regional impacts other than the shift oscillation West and East of the normal location of the Asian monsoon.
Regarding the November cut off I think this is a function of the south Pacific normally being colder than the north side of the equatorial Pacific and this cold anomaly ends after the SH winter in Oct/Nov before warming for the SH summer. You can see this right now. Look at Nino region SST anoms are increasing but actual SSTs are continuing to cool due to seasonal cooling outweighing any warm anomalies.
Also note the trade winds continue to be robust. No sign of weakening.
http://www.cpc.ncep.noaa.gov/products/analysis_monitoring/enso_update/ugdas_c.gif
Willis wrote: “Given the effect of La Nina in terms of water movement, let me call the action of the combination the “La Nina Pump”.
Any pump must have a source of fluid and an outlet. You assert (quite reasonably) that the warm water pumped away from the equator in La Nina years head towards the poles. Where does it come from?
I’ve always assumed that the Eastern Equatorial Pacific is so much colder than the Western because two possibilities: surface currents flowing northward from Antarctica along South America OR upwelling of deep ocean water off the coast of Peru and Ecuador. (Nutrient-rich upwelling allegedly is the reason fishing is so good there in non-El Nino years.)
If upwelling could be the source of cold water at one end of your pump, then downwelling must occur at the other end of the pump.
https://en.wikipedia.org/wiki/Humboldt_Current
There are two sources of the cool water, both upwelling from cooler deep water caused by wind friction on the sea surface inducing ekman pumping. 1. Humboldt current causes continental upslope flow. 2. Either side of the equator in the Nino region, ekman pumping induced flows away from the equator allow upwelling of cold deep water again driven by strong persistent tradewinds.
The reason why the eastern tropical Pacific warms often rapidly is the Tradewinds shut down and sometimes reverse which stops upwelling of cool deep water and instead pools surface warm water near the equator plus with no cold upwelling solar heating takes over.
I really, REALLY like this. Because you have discussed heat transfer. There is a reason alarmist papers do not mention thermodynamics. And your time-sequenced analysis is compelling.
Thanks Willis. What surprised me was the 2-3 degree swings in temperature, with most of the swings happening in the east, very little change in the west, compared to the 0.1-0.2 degrees per decade that we are told is happening because of rising CO2. It would be interesting to now see the temperature changes away from the equator as the “pump” pumps.
Our world is a wonderful thing.
This brings refreshing clarity to the old ENSO chestnut – and as such questions some well-established assumptions. Great post Prof Essenbach!
For instance dogma has arisen which is wrong – that El Niño brings warmth and La Niña cold. Further, that there are “el Nino dominated” warmer periods and “La Nina dominated” cool ones. Willis shows here that this idea makes little sense if the little boy and girl are two phases of the same pumping cycle.
The pumping cycle described relates to one sort of El Niño event, the classic type driven by the Bjerknes feedback in which there is an excursion of the Peruvian upwelling to trade winds positive feedback. It is this excitability and feedback that is the fuel and energy that moves all that warm water poleward. In this case, it makes no sense to say the first El Niño half of the cycle is a warming event while the second La Niña half is cooling. No – the combined cycle has an overall warming effect globally by moving more ocean heat poleward.
The other kind of “el Niño” (that really shouldn’t be called El Niño) is the “Modoki” kind. It could be called the “everything but the girl” kind. In this ENSO event the mid equatorial Pacific surface warms, not the east off Peru. Most crucially there is no run of the Bjerknes feedback. The trades and Peruvian upwelling both may falter but neither is really ever interrupted. The mid equatorial Pacific just gradually warms then gradually cools back down again. There is no real La Niña after it. A cooler east Pacific equatorial region returns that might look like a La Niña, with robust trades, but it isn’t, there is no engagement of the Bjerknes feedback so no resonant energy to pump water poleward. So everything just gradually dissipates. (That’s where we are now.)
So the Modoki kind of El Niño – like the latest 2016 one – is not followed by a true La Niña and there is no enhanced pumping of warm water poleward. All the energy slowly dissipates and the net effect is global cooling.
It would make more sense for alternate warming and cooling periods to be characterised by classic type and Modoki type ENSO cycles, respectively, than by El Niño and La Niña.
And yes – it’s not surprising that features of the classic El Niño-La Niña cycle always happen in the same months, since the ENSO is annually forced.
Willis – would it be correct that say that there are two competing routes for climate to move excess heat away from the equatorial region? Poleward ocean water pumping (heat goes to Arctic), and thunderstorms (heat goes to space)?
An excellent post, based on real-world data and not just theory and models!
I did notice something in your “movie” of the west-to-east temperature gradient.
During La Nina or neutral conditions, the highest temperatures are at the west end of the box, and the lowest at the east end, while the El Ninos tend to increase the temperatures at the east end.
But during very strong El Ninos (especially 1998 and 2015-16), the peak temperature seems to push eastward to somewhere between the International Date Line and 150 degrees West longitude, with lower temperatures near Asia (155 to 180 degrees East), almost like a “heat wave” pushing to the east from Asia to the mid-Pacific.
Do you have a theory or an explanation for this apparent eastward movement of heat (or warm water) during El Ninos?
Looks like a unanimous response by all. Great post. Looking at the chart, figure 8, showing Nov – Nov grey zones, should there be another around 2003/2004?. Seems to show a reasonable temp drop around that time too. Cheers. Macha
Willis: excellent post and interesting ideas, as we have come to expect from you. One part I didn’t get was when you said:
“Well, over the period of record, the area shown in red above ended up 16°C cooler than it would have been without the La Nina cooling episodes shown in Figure 8”
The temperature ranges in figure 8 (and elsewhere in the post) are from 26°C to 30°C. That’s 4°. Where’s the other 12° of cooling?
Thanks, Rocky. The area has repeatedly warmed and cooled. The total of the cooling cycles due to the La Nina pump is about sixteen degrees C.
w.
Not a pump but a grand cycle caused by who knows. My theory is a connection to the poles. La Nina favoritism in the North Pacific is an expression of the cold phase of the Pacific Decadal Oscillation. It appears to me to be related to low ice extent in the Arctic. The last long period of La Nina favoritism probably kicked off from the low ice conditions in the Arctic from the late 1930’s into the 1950’s when the first one summer transit of the NW passage occurred. La Nina record only goes back to 1950 and that’s backcast as it is. La Ninas were favored through the 50’s, and 60’s and maybe into the 70’s. The mechanism by my guess is ice extent retreats, stripping insulation off the top of the ocean. Then winds over this newly open water in some kind of decadal scale super cool surface waters, creating polynyas and all sorts of slush ice and other precursors to the freezing. Freezing saltwater squeezes brines out of the water that descend to the bottom of the ocean. That moves water, perhaps along the thermohaline currents at the bottom of the ocean. On the Peruvian coast you have prevailing offshore easterly winds. Offshore winds cause cold water upwellings. Those offshores are fed by the large mid ocean clockwise rotating gyres influenced by the Coriolis Effect. Theory has the Peruvian coast as an upwelling point of the thermohaline system along with one down in western antarctica. This creates a push of water off the Peruvian coast towards the western Pacific, with surface waters being warmed by the sun. Off California the water is relatively cold because of the Coriolis Effect and its influence on winds and currents. So during La Ninas, southern California in particular experiences anomalous cold water conditions as an enhanced circulation somehow connected to La Nina. Cold water down the coast. High ice conditions in the Arctic are associated with the warm PDO and a favoritism to El Nino. Seems most scientific thinking doesn’t believe much influence travels the Bering strait out of ENSO and that high and low ice in the Arctic are more likely in the Atlantic with the Gulf Stream pumping a lot of warm water into the Arctic. This whole system has a strong association, albiet over a short period of time with global mean temperature variation creating the warming peaks somewhere around 1878, 1944, and somewhere between 1998 and 2016. The amplitude of this oscillation has approached .8C. 18 years according to the apparent cycle would be a 1/4 cycle or represent variously a valley bottom, a hilltop, a cooling slope, and a warming slope. The warming slope was identified by Ben Santer for IPCC AR3 as a 17 year warming period quite conveniently tucked between a cool valley and the recent hilltop. I am betting on no effects from CO2 so the next 18 years should be interesting again keeping in mind there is no reason except the prognostication of 72 year full cycles based on the orbits of the planets circling the sun from astrometeorologists who at least some of are currently predicting cooling for the next couple decades starting this past winter (a prediction made at least a couple of years ago). http://solarcycle24com.proboards.com/thread/2403/global-cooling-nears-2017-2053
In relation to La Nina beginning and ending in November…
The LRC (Lezak’s Recurring Cycle)
A unique weather pattern sets up every autumn between October 1st and November 10th.
An apparent connection between the annual pattern of La Nina and the LRC which is tool aimed at forecasting weather features months in advance.
Thank you. This is an intriguing addition to your series on the pump and thermostat. Aside from the November onsets, are you able to make any predictions about future la Ninas?
Terrific informative work. Thank you Willis.
Query please.
In Fig 5 it is stated that the Southern Ocean (Oscillation?) Index is inverted to agree with the sense of the other four indicators.
It’s also stated in Fig 6 that the SOI is inverted, but is it?
In 1997 it indicates a La Nina (in Fig 6) while the other dots indicate correctly an El Nino.
Would it be better to have the yellow dot move in the same direction as the rest “to agree with the sense of the other four indicators”?
Willis: A fascinating analysis. In the days when I was studying electrical engineering (I am a mechanical engineer) the mechanism you have been described would have been known as a ‘bi-stable multi-vibrator’ aka ‘flip-flop’. The next thing is to establish the nature of mechanisms which trigger the flips and flops.
I think you may also describing part of what may drive glacial-interglacial cycles. A hot object gives off more heat than a cool one and the hotter it is the faster it looses that heat, so when incoming, solar energy exceeds that leaving the atmosphere, the planet warms, this increases the amount of heat leaving until the energy leaving the planet exceeds that coming in and the planet cools.
At peak glaciation the very little energy is given off and the incoming radiation easily exceeds the outgoing, but not enough to warm the planet until a Milankovitch trigger produce sufficient insolation to start warming and the glaciers retreat into an interglacial. Then as heat loss increases more is leaving the planet than is coming in from the declining insolation, and the planet begins to cool into a new ice age. Having high CO2 during an interglacial has never prevented a new ice age cycle from starting.
This implies that the IPCC’s much feared runaway global warming can never happen as the hotter the earth gets, the more heat it will loose and when losses exceed gains the earth will cool – a very slow seesaw like process of self correction, of which the la Nina pump is one example?
Remarkable design. Are we allowed to mention God?
What would the reason be for this design?