40-year veteran meteorologist Joe Bastardi at WeatherBell’s Saturday Summary shows how the Earth’s surface has cooled dramatically over the past three years and that Arctic sea ice is piling up.
Hurricane threat to East Coast due to natural factors
First at his most recent Saturday Summary, the 40-year meteorologist first warns that in-close developing hurricanes of the sort seen in the 1930s are a risk to the US East Coast this year, due the current Atlantic temperature pattern. The reason has nothing to do with CO2 in the atmosphere, but because of natural sea surface temperature cycles.
Sea surface temperatures see “pretty dramatic turnaround”
Next Joe Bastardi illustrates the stark sea surface cooling the globe has seen over the recent years. The following two charts show the “pretty dramatic” cooling that has occurred over the past three years, 2015 vs 2018:


Cropped from Weatherbell Saturday Summary.
The two images above show the surface temperatures of the globe for the years 2015 – 2018. Note the profound cooling that has taken place from 2015 to 2018.
Bastardi calls it “a pretty big flip” and “a pretty dramatic turnaround”.
Arctic turns frigid
As sea surface temperatures around Greenland and in the Arctic are currently below normal, they are having an impact on Arctic surface temperatures this summer.
Joe Bastardi notes that according to the Danish DMI, Arctic temperature has been below normal over the entire summer:


Moreover, Arctic mid-summer temperatures, north of 80°N latitude, have dipped to near freezing over the past days. This is likely in large part linked to the cold North Atlantic sea surface temperatures we’ve been witnessing. All this suggests ocean cycles, and not CO2, are the real Arctic drivers.
Snow and ice climbing past decade
The cold polar temperatures are naturally having an impact on Arctic snow and ice.
Japanese blogger Kirye tweeted here that Arctic sea ice volume is currently at the 4th highest level since 2003, thus defying the dire alarmist predictions of Arctic sea ice disappearing by now.


Arctic sea ice volume (m3) has eased off from third place and is now at the 4th highest level since 2003, and showing an upward recovering trend over the past decade. Chart: Kirye.
Also at the 11:50 mark of his Saturday Summary video, Joe shows that Arctic sea ice extent is well above the levels seen over the previous years.
More at No Tricks Zone
You can see more about the Arctic at the WUWT sea-ice page
UPDATE: In response to Mr. Bastardi’s comments in the thread for this post, the title was changed to be more reflective of what his briefing points were. – Anthony
Thanks Joe!
It’s good to know I’ve been watching the right metrics. I’m not sure it will help preparedness in a region that blames all on CO2 in order to feed its political and advocacy objectives, but the minority that does appreciate accuracy can learn and make adjustments.
It is globally cooling. I am sure you all remember hearing it from me first?
See, those taxes have worked and reversed the warming. Now we need new taxes to stop the cooling. Please note that the existing taxes need to remain in place to ensure that warming doesn’t return.
All the recent ENSO indicators are also for a moderate El Nino this winter, maybe a Modokai El Nino. So a warmer tropical Pacific feeds moisture and cut-off Low Pressure systems into the SW US and Texas with colder air coming in from the NorthEast and Atlantic.
Is that a formula for Big Snow Bomb Nor’easters for the Atlantic Coast and lots of snow this winter for the Mid-West and even South? We’ll see.
I would question that any type of El Nino will form after the end of this summer. Note how much of the Pacific waters on either side of the Equator are barely above the zero trend temp. My forecast is that by the end of next month large areas of the ocean will go blue, and the ENSO regions will go negative and stay negative for the next several years afterwards. …https://earth.nullschool.net/#current/ocean/primary/waves/overlay=sea_surface_temp_anomaly/orthographic=-148.60,2.80,672/loc=-171.523,6.677
I should restate that forecast as “after the end of August ssta conditions globally will steadily go blue over the next 1 to 2 years.”.
I made a prediction around 2 years ago that by the end of this spring that global ssta conditions would be over 50% cooled. The second part was that over the next several years after this spring (2018) the global ssta condition would be predominantly cooled (blue). I came very close to the first part of the prediction as the oceans were very close to being 50% cooled by June 21st.
Can’t wait to see how Nick and Steve spin this into a “GLOBAL WARMING” disaster caused by CO2 !!..!
Can’t wait to see how Nick and Steve spin this into a “GLOBAL WARMING” disaster caused by CO2 !!..!”
Women and Minorities Hardest Hit!!!
Dang, why didn’t I think of that…
and Children! Don’t forget the children! And puppies! And, and baby ducks!
ya’ll swallowed DMI hook line and sinker. the bobbers on your lips!
Me? I realize that arctic volume data is Actaul model outputs, so I would not hang my hat on any given month or any given year.
I would look at ALL the models
I would not put too much faith and any ONE of them.
I would look at the overall trend.
Hint; last validation DMI ran was in 2013: they made a major change to the model in 2016
and I have not found any paper validating their latest version.
is the volume big this year? Dunno. wrong question since we dont have consensus on what the best model is for estimating ice volume
What? you though people actually measured the volume?
silly skeptic, you believed a graph because you liked the story. not because you understood how the “data” was produced.
Volume? this year? again. Dont know, I’m too skeptical to just believe one model
from one institute
What for are models needed when you’re told
“Moreover, Arctic mid-summer temperatures, north of 80°N latitude, have dipped to near freezing over the past days.”
You have no thermometers north of about 83N
THEREFORE, the only thing you can do is estimate the temperature
where you have no thermometers.
You can do this two ways
A) a statistical model
B) a physics model
DMI uses a physics model. One of many
When you have to use models to estimate you have to compare various models to get an idea of the structural uncertainty in the models and also the possible biases in the model
Skeptics never do this.
A) if the like the model results, they “forget” to mention its a model
B) if they DONT LIKE the model results, they attack modelling.
The reason they do both of these is they have no intellectual integrity and because
they never question what they like.
“Skeptics never do this.”
True skeptics do this. So do true scientists.
Calling out self labeled skeptics who buy into the same confirmation bias the ‘alarmists’ do is in general a good thing – but I think you are conflaguating a ‘Position’ on an argument (Skeptic/Alarmist), with skeptics who actually are skeptical of all arguments.
A true skeptic, by definition, does do that. It ah, is in the name…
Also, using an absolute like ‘never’ means if I find one example (including myself) your point is moot. One example ruins a ‘never’ claim. I am glad you brought this up though, to remind me to treat it as a model and not a measurement. Dang, I think I just ruined ‘never.’
I do enjoy your contrarian position here, I think it keeps things healthy to a point, but insulting people is still bad form. A better statement would have been, for example:
“Those on the Skeptical Side of the argument can fall into the same confirmation bias that Alarmists do, and it in this case you have to realize that you are following a model in much the same way as Mann, Gore or the IPCC.”
See? That would turn most of us off. But hey, you be you. 😉
It was alarmists who asked us to look at volume, not extent, when the extent numbers were not signaling “correctly”, and volume decreases fit the narrative better. Now that volume is not looking good for the alarmist case, it’ll be something else, can’t wait to see what.
Even PIOMAS (another volume model) is looking higher than the trend, and Neven is working hard to spin that. Net, net, if there’s no real data (as you correctly suggest) and the models don’t agree (as you correctly suggest), then how in the world is the “science settled” (as your cohort often suggests)? When is some real science going to happen around this topic, and the CO2 hand wave relegated to one of a number of conjectures, vs. the “way, truth and light”?
It would be nice if an international consortium, perhaps led by the US, recreated the buoy network that used to give us some real data on the arctic situation – how about championing that, Steve?
Arctic temperature has been below normal over the entire summer”
Well, that’s absolute proof of Global Warming – because Global Warming is tricky that way! It WANTS you to think it’s going away!
“It WANTS you to think it’s going away!” Do the models capture that? Asking for a friend.
When did the average over some arbitrary period become “normal” ?
This is simply to adopt the alarmist dialogue, where nothing should change from some arbitrary average. Deviationns from the “normal” are thus “anomalies” ie abnormal : =OMG
If you mean below average ,why don’t you say below average, instead of below”normal” ?
Language is a funny thing.
An anomaly can be simply a deviation from an average value over a specified reference period (normal).
https://www.ncdc.noaa.gov/monitoring-references/faq/anomalies.php
If the temperature anomalies are within 2 standard deviations of the reference value, they aren’t really “anomalous.” In this case most anomalies aren’t anomalous.
Or an anomaly can be something that sticks out like a sore thumb and is truly anomalous.
https://www.merriam-webster.com/dictionary/anomaly
wws
…Arctic temperature has been below normal over the entire summer”…
Good starting point for a return of global warming perhaps?
Getting to the bottom of it is a bit like the stock market.. are we at the bottom yet? time to buy? Come to think of it has anyone correlated Arctic Ice or Climate change to, say, the price of Facebook stock? Everything else from Polar bears to butterfly populations seems to be Climate correlated!
cheers
When you look at the graph, the arctic doesn’t look much cooler than normal, only a degree or two. The thing is that if you look at the DMI site you see that the melt season temperature usually tracks the long term average very closely. That’s because the arctic sea ice melts and keeps the temperature pretty constant. It’s much like a picnic cooler in that regard.
It’s also important to realize that the ocean is above freezing. That means the sea ice will continue to melt even if the air temperature is near, or below, freezing.
North of 80°N, in the melt season, a small difference in temperature can be the result of a very big difference in energy flow.
Thats the point…The whole CAGW panic is based on…”only a degree or two” ..
Less than that. It’s only warmed by about 0.7C since the end of the little ice age.
The Arctic Ice melt season ends on average around day 230, that is Aug 18th. That is due to air temps rapidly falling below freezing as the night time lengthens quickly and the long sun-lit days are over. The sea ice starts building in some higher latitude areas then, but the minimum still won’t occur for another month because the lower latitude Arctic is still getting enough sunshine to keep the melting going until the autumnal equinox.
The SST open water temperature changes little during that time. It is the air temps right over the water that changes quickly driving the freezing of the surface layer.
But according to the Cowtan and Way study, the polls should be warming at 8 times the rate of the rest of the planet. If the Arctic is actually cooling, even if only a degree or two, it shows that climate studies based on models, temperature estimates, and infilling are bogus.
The Democrat reaction to the polls was pretty heated right after the last election.
Here are the DMI results:
http://ocean.dmi.dk/arctic/plus80n/anoplus80N_summer_winter_engelsk.png
But according to the Cowtan and Way study, the polls should be warming at 8 times the rate of the rest of the planet.
Which is exactly what DMI say:
“The Arctic region has witnessed a rapid increase in mean temperatures since the beginning of the millennium; Arctic winter temperatures in particular have been up to 8ºC above normal during recent years. This temperature increase is much higher than the global average,”
And that’s exactly the point about the alarmist claims. WINTER temperatures are up (like say -20C vs. -25C), which is relatively immaterial with respect to the ice gain or loss. It’s summer temperatures that might make a difference, and for the past few years, those are below the long-term average, at least per DMI. That, along with ocean cooling, and Greenland Surface Mass Balance increases (some above the all time records the past few years), are what’s concerning in the trend.
And that’s exactly the point about the alarmist claims. WINTER temperatures are up (like say -20C vs. -25C), which is relatively immaterial with respect to the ice gain or loss.
It is certainly not “relatively immaterial with respect to the ice gain”, the rate of ice growth is directly related to the Freezing Degree Days during the winter, for example:
Thickness (cm) = 1.33 * FDD (°C)^0.58
https://nsidc.org/cryosphere/seaice/processes/thermodynamic_growth.html
Compared with the ERA40 mean used by DMI the last two winters have been ~750 FDD below average.
It’s summer temperatures that might make a difference, and for the past few years, those are below the long-term average, at least per DMI.
The temperature in summer when the ice is melting will be close to the melting point of ice, that’s why you put ice in a drink after all. In previous years that melting ice has been mostly MYI which is close to freshwater, therefore melts at ~0ºC, recently much more of it is FYI which is more salty and has a freezing point of -1.8ºC. If the surface melts at a slightly lower temperature it’s quite possible that the DMI model would yield a lower 80+ temperature.
Major drivers of the sea ice melt during the summer are insolation and melting from below due to warmer sea water.
The DMI chart covers 80n
NOT THE ARCTIC, in fact a time portion of the arctic that is temperature limited
(as long as there is ice to melt)
That is the 2m temperature north of 80 will remain in a very narrow band during the melting season, because…….
the ice is melting and the air above the melting ice will always tend to track the melting temp.
The interesting thing is that the summer temperatures have been slightly but consistently below the long-time average for more than 15 years now.
“It’s also important to realize that the ocean is above freezing. That means the sea ice will continue to melt even if the air temperature is near, or below, freezing.”
Not necessarily true, if seawater temperature under the ice is below zero fresh meltwater from multi-year ice can re-freeze and cause the ice to thicken even in summer. This was discovered already by the Fram expedition in 1893-96.
“It’s also important to realize that the ocean is above freezing. That means the sea ice will continue to melt even if the air temperature is near, or below, freezing.”
Very happy with the rest of your comment, added something similar in blog further down.
This comment is a bit awkward in the way that it has to be expressed or interpreted.
Looks like a cooling trend….
Global temp anomaly for 1-14 July 2018 is just 0.117C now. Greenland is adding snow and ice. The arctic is colder than summer normal. And the folks in Labrador are wondering if their children will ever know what summer looks like again…. Brrrrrrr!
JMac, could you give the link for your observation about global anomaly for 1-14 July?
Wilt,
I don’t have a direct link to that info. It was shown on the top of a slide in Joe Bastardi’s ‘Saturday Summary’ (7/14/18), at about 2:10 in. The slide references NCEP CFSv2 2Meter Temperature Anomaly [C] 00Z 01July 2018 —->06Z 14July 2018. Global Anomaly 0.117C. CONUS Anomaly 0.798C.
The link to Joe’s Saturday Summary is as follows:
https://www.weatherbell.com/
Click on ‘Premium’, on the top menu bar.
Click on ‘Saturday Summary’ video displayed there.
JMac, thanks for the info
Currently, there is no possibility for the development of El Niño.

I just noticed today that it looks like +ENSO recently peaked out and is going to fizzle. The trade winds are strong and bringing cooler than average water from south of the equator.
That headline is not a quote from me, it is a quote from the person that watched it ( who is a someone I know and admire, btw) but I want to be clear. I am pointing out the cold/warm configuration in the northwest Atlantic like that promotes higher than normal surface pressures as per the Euro seasonal idea over Southeast Canada into the north atlantic, which is something I look for for landfalling higher impact storms What is vastly different is the Main development region from last , so not near as much production there, But I think you will see and I point this out in the video ( please watch so I am not taken out of context) is what storms there are more intense relative to averages further north than south. The current rotation of the MJO ( into strong 5 and 6) is not unlike 1981,1984,1989,1996 Dennis, Diana, Hugo, Fran and Eduoard all had later season impact on the east coast. I showed on the video this morning how close the current pattern is with July 1960 ( so much so I am concerned about a hybrid on the east coast this weekend ala Brenda July 27-30 1960 ) Donna came later ( I always loved Brenda cause she gained tropical storm status while inland. How do I know about Brenda? Cause my dads senior thesis at Texas A and M in 1965 was on hurricane Donna, so I knew all about the 1960 season growing up and Brenda was in it) In addition, such enso seasons as 1976 Belle, and 1991 Bob are in the mix. The falling SST’s though were more a reference to the difference between this year and last, Even that has to be looked at in context and I posted on that this morning, While a widespread big drop ( warm areal coverage smaller and cooler larger and largely unforecasted to the extent it is) It is stil the warmest 2 year super nino look we have seen with UAH temps and SST. My take on that is that this past el nino was a 2 year event with a weaker run-up, and the amount of WV launched into the atmosphere where minute increases spread out even over a long period of time would skew arctic and dry cold area winters and hence affect temps. I am on a Quixotic mission I guess to make the climate community look at quantifying mixing ratios as the metric of choice, but then again if that would be the case, it would considerably lessen the hysteria and render this what I believe it is, something fun to discuss, but not the climate control knob, BTW the blog this morning also opined on the difference going forward between having a certain pattern that got that way from cooling, as opposed to the same pattern at the time, but getting there by warming, IMO studies on feedback on such things, throwing in affects on the MJO or affects by low solar carry far more interest for the field than mega millions thrown at Sea level rises a hundred years from now. In any case, thanks for putting this on, and giving me a chance to participate in the conversation, WUWT is the best!
Joe,
Thanks for adding to the conversation. Do you have anything to read to help us understand what you’re talking about with regards to mixing ratios, and why they matter?
Thanks in advance,
rip
If I may give Joe a plug…
More Evidence Water Vapor Is The Big Climate Kahuna –
Written by Joe Bastardi, guest post on June 14, 2018. Posted in Climate, Latest news, Oceans, Science, Weather
https://climatechangedispatch.com/more-evidence-water-vapor-is-the-big-climate-kahuna/
A friend of mine who is a physicist uses to say that climatology is a science that studies the phase-changes of water on a unilaterally heated rotating spheroid.
When one looks at the mixing ratio tables, one notices that minute increases in water vapor and their relationship to temperatures are greatest where its cold and dry. We must remember temperature is measure of energy. The lower the temperature, the less energy it takes to change temperatures. Take a very cold morning, Temperatures over short distances can vary wildly, depending on exposure. I used to map temperatures on the PSU golf course and combined with taking instrumentation you look at temperatures in a different way, as what they are, not hot or cold, but measures of energy. So it is much easier to warm where its very cold and dry ( as in arctic winters) than where its hot and humid. Now lets think about mixing ratios, The idea of a tipping point where temperatures are just going to go through the roof is counter intuitive, Nightime lows for instance wil and have come up, but daytime highs have not responded nearly as much. if anything the argument is that we are lessening variations, and in terms of the planet, lessening zonal potential energy which would then mean less, not more extremes. That is a gross oversimplification but it can make my point. Now to the
Saturation mixing ratio. Saturation mixing ratio (Ws ) is the theoretical maximum amount of water vapor that air at a specific temperature and pressure can hold. When air is saturated, it cannot hold any additional water vapor. So here is a for instance Look at this:
-40 0.12
-30 0.21
At -40, the air can only hold .12grams/kg of water vapor. Inject only .09 gram/kg and it would have it a -40 , That is a 10 degree rise, assuming no advection of cold air and constant input of increased WV, So what is going to happen at those very cold temperatures, Well there is going to be more cloudiness, more precip So it snows more, but its not as cold, When has that been happening, In the winters in the northern hemisphere. Where does the water vapor come from? The culprit should be the warmed oceans, Has anyone stopped to think how much water vapor the last super nino contributed to the globe. Suppose its all evenly distributed over a period of x years, Lets say the entire planet winds up with an increase of .05 grams/kg? 3 years down the road Where are you going to see the biggest difference, In the arctic winters, In fact if you actually look at the global temperatures, you will see the distortion of the warming. There is much more warming where its driest and coldest during those seasons, and it skews the temps, What does .09gram/kg give us in the tropics . Well lets look at the difference between 85 and 90 in WV with saturations mixing ratios
85 26.48
90 31.16
The same increase of .09grams/kg is not even a factor really, So we are left with a globe that is warmed, but largely in a distorted fashion where it does not mean that much, The increase in snows you are seeing is the natural cyclical process of nature, to counter the warming, How so. more snow, more melt, More melt it cools the ocean, But its not all going to melt, certainly not because of co2 In fact you are seeing a flip in the NW atlantic SST now, This is not a new concept, I read about this when I was only 8 in a book my dad gave me there was chapter on natural climate change, why the oceans were natures great thermostat, and that warming would be met by more snow, The lag means there is overlapping and nature is trying to react cyclically. Throw in solar variations, stored heat in the oceans from years of strong sunspots, its why I am a disciple of Gray( oceans) and Soon ( Sun) with their theories. But the Mixing ratio idea is from Dr John Cahir, who about 10 years ago said that we quantify the wrong metric in climate in temperatures, we should quantify mixing ratios Here is the problem, It would show this is all no big deal. Which attracts more attention the arctic 10 above normal in winter, or .09grams’kg, But understanding the nature of temperature and water vapor and how important their links are, so much so we have tables for them and NOT FOR CO2 says it all. As far as arctic summers, they were much warmer back around 1960 and especially in the 90s than they are now, We can argue all we want about the DMI site, but against itself all one need do is take the time to go over every year and you will find that arctic summers over the past 5 years have gone the opposite way of the 2012 hysteria, I can see what the concern was in the 90s, there were some summers well above normal, but again we had cold oceans in the 70s and 80s and so chances are WV was lower. But you can see all the warming in the arctic is during its cold season, where again slight variations in wv (not co2) have links to temperatures, In any case hope that helps peace out
Joe,
Thanks! This is fascinating, and really helped me fill in a couple of missing pieces in my understanding.
Actually, this gives a physical explanation to the mathematical understanding that “average temperature” is a meaningless metric. Total system energy is obviously more relevant, and the WV ratios are directly related. Makes sense.
Thanks again!
rip
Yes, not only is “average temperature” a meaningless metric, but it is also applied in a nonsensical fashion, when the dupes talk about the “average” increase in temps occurring everywhere evenly, which is absolutely NOT what is going to happen from ANY source of temperature rise.
“Dropping ocean temperatures may increase East Coast hurricane risk”
Yes it is Joe.
Glad that headline didn’t come from you. I was wondering how such a profoundly ignorant climate alarmist statement as “Dropping ocean temperatures may increase East Coast hurricane risk” could be attached to a good article. It’s well known that WARM waters drive the heat engines of hurricanes.
If you remember I have called for overall sea surface temperatures to fall over a year ago.
El Nino not looking likely .
The cooling has just started with year 2018 being the transitional year.
My two solar conditions needed for cooling arriving in late year 2017. Although the transition to sub solar activity in general took place in late 2005. Lag times have to be accounted for.
My two solar conditions being 10+years of sub solar activity in general followed by a period of time of very low average value solar parameters, which we now have.
Gee Sal, you seem to have forgotten that just the other day you stated “…Ian’s predictions have been better then anyone else. …”. Ian’s prediction is “…I have been predicting a moderate to strong El Nino event starting around July 2019….”. So 4 days ago Sal thought that Ian had the best prediction of anyone in the world.
Nice job at swiftly changing hats Sal. You are one remarkable guy. Nice job hunting up what other people think, and then claiming that for yourself, which you have been doing for years.
https://wattsupwiththat.com/2018/07/12/conditions-for-formation-of-super-el-ninos-determined/#comment-2403555
Ian has been good with predicting ENSO events. I simply said that.
Then I concluded the data for this year does not look that good for El Nino.That was not a prediction,but an observation.
Ian prediction was for year 2019.
You have called for no El Nino this year goldminor, which is a prediction.
I think my website has put your claims to rest goldminor.
Have to disagree, The cold eastern indian ocean means higher than average surface pressures through the fall, there, dropping SOI’s in late summer and fall and the warm water is there for the taking, In any case we shall see Peace out
Thank you Joe Bastardi for all your highly competent work. I believe that you and your colleagues at WeatherBell are the best in the weather forecasting field, as measured by your strong predictive track record.
Best, Allan
For the record:
http://notrickszone.com/2018/06/10/new-hell-climate-change-gets-certified-schellnhuber-prophesizes-end-of-civilization/
Hi Pierre,
Hope you are well.
These fanatics will believe in catastrophic global warming until Hell freezes over.
For the record, I predicted that natural global cooling would commence by 2020 to 2030, in an article published on 1Sept2002 in the Calgary Herald. I am now leaning closer to 2020 for cooling to start.
I hope to be wrong. Humanity suffers during cooling periods.
Best, Allan
PDO PDO PDO…
..ignore the AMO at your peril……it pumps directly into the Arctic
The low temperatures in the north increase the sea ice in the Arctic.
http://masie_web.apps.nsidc.org/pub/DATASETS/NOAA/G02186/plots/4km/r00_Northern_Hemisphere_ts_4km.png
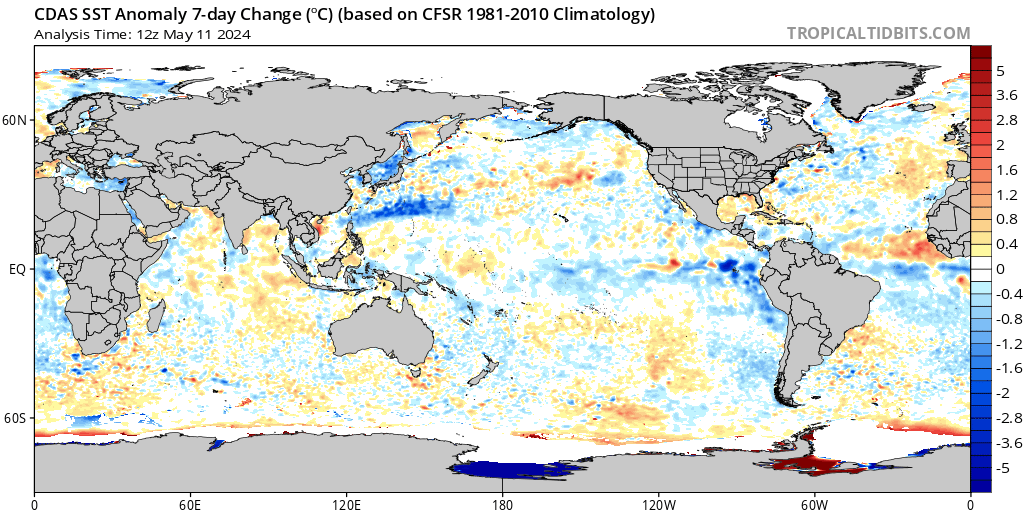
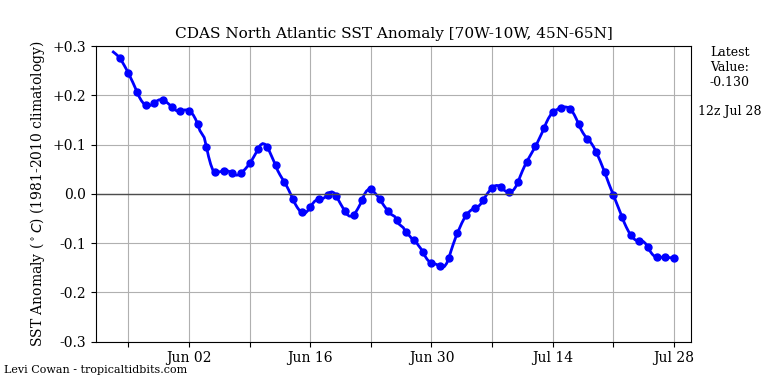
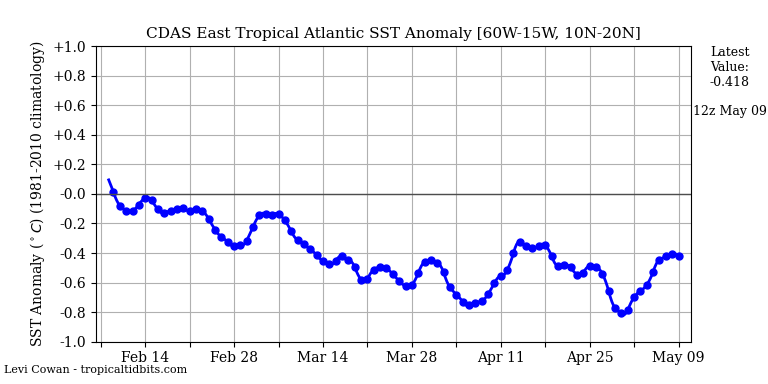
The temperature of the northern and tropical Atlantic has fallen last week.
My thoughts are that it won’t increase hurricanes unless we have strong Ferrel Cells pulling the cold air to the central US like we did last year, which isn’t indicated cooler temperatures in the Arctic. Cold water surface temperatures in the Atlantic/Caribbean would mean lack of Hadley Cell circulation decreasing hurricanes. So far it seems to me to mean weak and not so many hurricanes. My 2 cents.
That’s not how hurricanes work. Reduction in surface temperatures of the ocean combined with increased atmospheric temperatures = fewer and weaker hurricanes.
Joe – anyone? The 2015 vs 2018 SST maps above. Is there a specific date range associated with either? Also – they are anomaly maps, correct? Want to share with someone (a warmist reporter) and want to get it accurate.
PS – enjoyed your reviews of the 1821 (cat 3-or 4) and 1938 (strong cat 3) hurricanes which both struck Long Island, etc. Sad show from the media, in following TS Sandy’s hit, they were all over the man-made bit, and almost nobody ever mentioned these historical storms. What an opportunity missed by them to educate idiots like these:
LAT’s quoting NY Gov Andrew Cuomo (Father of the subprime fed housing bubble):
LAT’s quoting NY City major De Blasio:
same day Actually I liked the one from last year best cause it was quite dramatic over a year All this is on the weatherbell.com site
http://models.weatherbell.com/oisst/oisst_previous.php
A question for clarity. Is the northward movement of warmer tropical sea surface temps the reason cyclonic storms could intensify, or will it be an effect of slower moving storm systems drawing more energy from tropical waters? Trying to read this on smartphone screen and it is a bit choppy.
Okay, but let’s not say “below normal” when we really just mean “below average.” One degree deviation from the average temperature for the date is not abnormal.
Thank you, Dave! The whole use of “normal” to describe weather is false. Normal is what to expect, or what is the required sum; 98.6 F is normal body temperature, which has been shown from countless observations and experiments. It isn’t an average, or a mean, but a norm, from which deviations of more than (say) 5 degrees either way can injure, and deviations of 10 degrees will (not can, will) kill you. Weather has no conditions like that. We can establish averages over the period of accurate records, but there is nothing normal about them. Average rainfall here is a bit over a tenth of an inch a day. If no rain falls today, is that an abnormal day? If we get an inch of rain today, is that abnormal? Certainly not; it is simply a departure from average such as occurs virtually every day. So far this year I have recorded one (1) day where the high and low temperatures equaled the long-term average. Are all the other days abnormal? Ridiculous.
Here is the article. It was behind the paywall, and then I shared it with the Patriot Post, It is to show why I am concerned this year and it has nothing to do with co2, nor did the other great storms referenced in the article
https://patriotpost.us/opinion/57114-the-past-is-a-reason-to-worry-about-high-impact-east-coast-hurricanes
Joe,
Thanks for that very relevant historical perspective on patriotpost.us !
It’s an eye opener…
Jet stream cools the eastern tropical Atlantic.

I’d like to see 500ppm if it meant EVERYONE on Earth had access to clean, safe, abundant and reliable electricity. No more dung or trash fires to cook. No more deforestation for the wood and charcoal trade in regions that can not environmentally safely provide it. Air conditioning where it is desperately needed. This could be accomplished by 2040…if nobody organized against it.
Another fctor may be the large blocking high stuck over the NE Atlantic. This has given the UK a wonderful warm and dry summer thus far, but it has also blocked all the Atlantic lows that normally spiral up into the Arctic. Those lows, perhaps one or more a week, normally transport an enormous amount of heat energy to the Arctic, but this year there have been none. No wonder the Arctic is cooler…
And what of rhe Pacific? Has this been supplying energy to the Arctic this year?
R
The SH is certainly cool this winter season. I think that it is showing what the NH will face with this upcoming winter season. I would also bet that Europe is going to get hit hard this winter. That will be the first of many more to come, with future winters becoming ever colder.
The West Coast will be spared for a few years from the drop into colder weather patterns. The East Coast will feel the effects of the cooling along with Europe.
“ 40-year veteran …”
How about describing Joe as fascinating, compelling, riveting, . . . or enchanting. Or ‘usually right’ or ‘The Best’.
Those of us of a certain age are not impressed with youngsters, even when expressed in the manner of a career span.
“Joe Bastardi notes that according to the Danish DMI, Arctic temperature has been below normal over the entire summer:”
To be fair this pattern has been on repeat for the last 5 or so years. There was an episode of above normal ? 6 and 7 years ago that stirred up the alarmists. What concerns me is that the summer temps cannot change much but the winter temps are prone to much more variability since a hint of warmer air blown in provides enough energy to give large alarmist movements up and down, as shown by the desperate comments earlier this year.
What concerns me is that the summer temps cannot change much but the winter temps are prone to much more variability since a hint of warmer air blown in provides enough energy to give large alarmist movements up and down,
Indeed, most of the area north of 80ºN (which is a relatively small portion of the arctic) at present is melting first year ice so you’d expect the temperature to always be close to the melting point (~1.8ºC). In the winter there is no such physical limit but recently the winter temperatures have regularly exceeded the average, excursions of 10-20ºC being common.
They dont get that
of course we get it – see Joe’s comments on WV for a plausible explanation. The point is that global warming that only affects temperatures in the winter is not necessarily a bad thing – all the alarmist projections are about global warming in summer (pushing the peaks too high), which is not happening, at least in the Arctic, and not many other places I can detect.
If it’s only getting warmer in the winter, then the planet must be stabilizing, which would seem to me to imply less dramatic weather, savings in energy use, expanded croplands, and lots of other good stuff. The danger, of course, is that winter peak warmth goes away, the summers stay cool, and we wind up heading in a bad direction (bad for the planet, and really bad for alarmists).
I found the drought of heat waves interesting during the 60s and 70s interesting. Well away from the Arctic but if it reflects lack of warm currents going north in summer, Arctic ice is down recently from an unusually high extent, regardless of any modeling by Kinnard.
I have been calling for overall sea surface temperatures to drop BEFORE it happened due to very low solar activity .
No one else was calling for this.
My solar theory repeatedly states that very low prolonged minimum solar conditions will result in overall sea surface temperatures falling (less UV light/Near UV light )and also calls for a slight uptick in albedo.
Albedo increase due to more cloud/snow coverage and an increase in major explosive volcanic activity.
All this moderated by the geo magnetic field.
Sal I love you but a) they had to drop off the el nino b) they are still the warmest they have ever been 2 years removed from an el nino. So are global temps, I am pointing out a dramatic drop really over the last year. but part of that is because it remained so warm, however after meeting with Dr Soon I see where you are coming from overall, and I believe the problem is rushing it. We have to account for the heat in the oceans, Guys like me believe its the sun from 2 centuries of high sunspot activity, That does not go away overnight, Look what is going on now, already a new el nino is developing. the physical drivers, unlike last year which were not there, are there in abundance, notice what is going on in the west pac with the typhoons already unlike last year. And there is the problem with a sudden drop ala lia, Low solar means weaker trades in the pacific and more enso events until that is cycled out, Interestingly enough what could happen is a sudden drop, I think its more than a decade away though and the last super nino may mean a new higher pause point is developing with the amount of extra WV it put into the air overall, which will be supported by coming enso events until the sun can take over, peace out dear friend
I don’t see an El Nino developing. The models may see but the data is not that supportive of late.
On another note the overall sea surface temperatures right now are only +.12c above the 1981-2010 means and are still falling.
I say the drop off is due to low solar. The recent very weak short lived La Nina having nothing to do with the overall sea surface temperature decline. Zero. If it did have something to do with it why is it you, the models ,and no one else was calling for a drop off in overall sea surface temperatures? I was the only one saying it last year.
I also think the North Atlantic is a climatic player unlike ENSO which is transient and short lived. The North Atlantic undergoing drastic cooling over the last several months.
I had said last year that oceanic and surface temperatures this summer would be approaching 1981-2010 means which seems to be occurring.
It is early and let’s see where we go from here.
“I don’t see an El Nino developing. ”
Well, I do. The beginnings of it are emerging in the SST data.
Tropical Tidbits has a different picture to show. How can there be so much difference between the two sets?
Different baselines goldminor. Tropical tid bits baseline is 1981-2010 while the one Anthony showed, the satellite one has a baseline of 1984- 1993 .
Seems odd that they would use a 9 year base line. Anyway TT has the 3.4 region steadily moving back to zero.
office of satellite sea surface temp. anomalies website will show the baseline info.
Weatherzone also shows a plot very similar to what TT has.
http://data.theweather.com.au/access/imageserver.jsp?image=grads/sst/sstanom_hires.latest.global.png
Children are just not going to know what “davidvinerism” is.
Adults with memory of these days will know it’s a synonym for hyperbolism, however.
Here we can see the local peak ice volume in years: 2004 , 2009 2014 . This is the circa 5y periodicity I noted in Arctic sea ice variations in 2013 , which got Grant Foster in a hissy fit.
https://climategrog.wordpress.com/category/intolerance-in-scientific-debate/
This pattern would suggest that next year will see another local peak and be higher than this year. Before dropping back somewhat in the following year. The two panic years in summer ice minimum , 2007 and 2012 were also five years apart.
It now seems pretty clear that the supposed “tipping point” effect caused by a positive feedback from open water absorbing more sunlight was alarmist speculation, based on conjecture which can no longer be backed up by observation.
The sustained recovery since 2012 OMG minimum is simply not compatible with the hypothesis that this positive f/b is a dominant factor. The actual behavior is much more supportive of negative feedbacks leading to a recovery or a much longer term cycle of about 60 years, of which our satellite data is just a snip.
As I noted in Sept 2016 : THE DEATH SPIRAL IS DEAD.
https://climategrog.wordpress.com/2016/09/17/the-death-spiral-is-dead/
Just in case that Twitter account gets deleted for propagating non approved facts, here is the source link to the DMI data, which seems to come from ERA interim.
http://ocean.dmi.dk/arctic/icethickness/txt/IceVol.txt
DMI temperatures and volume are not data. They are model outputs.
Not data: MODELS
models
with a M
http://polarportal.dk/en/sea-ice-and-icebergs/sea-ice-thickness-and-volume/#c23717
http://ocean.dmi.dk/models/hycom.uk.php
The volume model is based on Hycom model and it is currently diverging from the model it is based on.
because DMI volume is based on a model, because ALL arctic ice volume data relies on models
it is vitally imprtant to:
1. Compare and present ALL the models? why? because the biggest uncertainty is structural
2. Investigate past attempts to “validate’ the model using what little validation data there is
( like from icestat, cryostat, and actual insitu spot measurements)
http://gfzpublic.gfz-potsdam.de/pubman/item/escidoc:1504406/component/escidoc:1577914/polfor.2016.006.pdf
Bottom line: its far too uncertain to say anything definitive about volume, basically you can talk about the long term trend. Anything else and you will likely fool yourself
Also, DMI north of 80 does not do proper area averaging, so take it with a grain of salt.
Arctic looking cold.
Then why was it so darn warm in the 90s, and the last 5 years its not, Lets put it this way, comparing DMI to DMI and also looking at ACTUAL SURFACE AND 5 K TEMPERATURES OVER THE ARCTIC this summer, its colder than average, And given its near the top of the averages, where variations at the warm time of the year are not that great, it is significant, But go back and look at the 1990s, I can actually see why there was so much concern when its peaking 2-3 C above the mean, But the same system that measured that, is measuring it now so you cant have it both ways, BTW I dare anyone to go back and look at every single year and it will reveal precisely what I am saying about summers not warming compared to before, Winters yes, Seems to work fine then
I agree with Joe.
Note what DMI themselves say;
“Since the data are gridded, it is straight forward to deduce the average temperature North of 80 degree North. However, since the model is gridded in a regular 0.5 degree grid, the mean temperature values are strongly biased towards the temperature in the most northern part of the Arctic! Therefore, do NOT use this measure as an actual physical mean temperature of the arctic. The ‘plus 80 North mean temperature’ graphs can be used for comparing one year to an other.”
Emphasis mine, although they do put an exclamation point in there.
“But the same system that measured that, is measuring it now so you cant have it both ways,”
Actually DMI say:
“In the plot, the red curve is based on the average 2 m temperatures north of 80 degree North, from the twice daily ECWMF analyses. These are gradually becoming better and more detailed, as the NWP model system at ECMWF is improved with time. That is why the name shift with time (e.g. from T799 to T1279 in year 2010).”
Re: “BTW I dare anyone to go back and look at every single year…”
About 4 months back I did just that, Joe. Actually went through them a couple of times to confirm/deny my initial impressions.
The last 5 years, arctic summers have been colder than average. In the 90s’ they were warmer than average. The trends are as plain as an AGW proponent’s dissembling.
AGW warnings should concern us about conditions for our great grandchildren.
People are always looking for something conclusive happening today or in the recent past or the distant past. Even the physicists I brief on our projects think like this.
I guess it’s here to stay, it’s just stupid human nature.
Excerpted quote from article:
And it appears to me that the Mauna Loa maximum yearly average atmospheric CO2 ppm measurements began to reflect the aforesaid ……. “pretty dramatic” [sea surface] cooling ….. in 2016 with only a 1.95 ppm increase …… and continuing thru 2017 with only a 1.59 ppm increase.
To wit:
Mauna Loa yearly max CO2 ppm + yearly increase
2013 5 2013.375 399.78
2014 5 2014.375 401.78 +2.00 ppm increase between 5-13 and 5-14
2015 5 2015.375 403.96 +2.18 ppm increase between 5-14 and 5-15
2016 5 2016.375 407.70 +3.74 ppm increase between 5-15 and 5-16
2017 5 2017.375 409.65 +1.95 ppm increase between 5-16 and 5-17
2018 5 2018.375 411.24 +1.59 ppm increase between 5-17 and 5-18
If the aforesaid ….. “pretty dramatic” cooling of the sea surface continues, then the yearly average ppm increase between 5-18 and 5-19 will be somewhat less than +1.59 ppm, ….. and I will predict it to be +1.03 ppm.
Here is an interesting spot which I have been watching of late. The temp anomalies have been running close to -12 F for some time now in the eastern section of Hudson Bay. Today the anomaly rose into the -8 F range. …https://earth.nullschool.net/#current/ocean/surface/currents/overlay=sea_surface_temp_anomaly/orthographic=-42.79,45.42,1107/loc=-78.606,59.683
Look at the 700mb flow straight from due north.
Meanwhile, UK and much of Europe swelters now for nearly two months, and hardly any rain at all, grasses all burned brown. Big ridge (high) in mid Atlantic and across UK. Part of coming climate shift? Wild jet stream. Towards cold??? Sunspot absence?
The waves get bigger, Roger. More summer heat, more winter cold in the storm tracks. It’s not convincing enough to come to any conclusions about the future yet.