Guest essay by David Middleton
Here’s a shocker… I’ve actually never seen Hot Shots! Part Deux. As much as I love stupid comedies, I’ve never actually seen the movie. But I do love to use the “part deux” bit… and part trois, quatre, etc. Anyway, I digress… In part un, we discussed the evolution of the phrase “ocean acidification.” In part deux, we will examine the scientific basis of the myth.
What’s that? How can a myth have a scientific basis? Lots of myths have a scientific, historical and/or otherwise factual basis. This Smithsonian article lists the geological inspirations of ten myths. They could easily add the myth of “ocean acidification” to this list.
Warning: This is a long post… 6178 words.
Part Deux-Point-Un: Chicken Little of the Sea visits the Paleocene-Eocene Thermal Maximum
The Paleocene-Eocene Thermal Maximum (PETM) was literally a period of “hell on Earth,” mass extinctions, oceans of battery acid, “human sacrifice, dogs and cats living together… mass hysteria!”
As you can see from this marine biodiversity graph, life on Earth nearly ceased to exist 55.5 million years ago…

Post Paleozoic families and mass extinctions: Paleobiology 10:246-267.” SEPM Strata
Oh, wait a second… scratch all that, I was thinking of the Permian-Triassic mass extinction event. Just in case anyone failed to notice: /SARC.
What do we know about the PETM?
- It occurred about 55.5 million years ago and lasted about 220,000 years.
- It got really hot. The PETM may have been the second hottest phase of the Cenozoic Era. Although it got hotter, for a longer period of time 50-53 million years ago, the Early Eocene Climatic Optimum (EECO) doesn’t get much press. You can see where I had to “white out” an arrow pointing at the EECO because it wasn’t the PETM.

- The lysocline shoaled by as much as 500 to more than 2,000 meters. I’ll explain shoaling of the lysocline later on in this post.
- There was a fairly significant extinction of benthic (the bottom of the water, irrespective of depth) foraminifera (marine calcifier bugs used for stratigraphic correlation).
What does the so-called consensus say happened during the PETM?
- A sudden rise in atmospheric CO2 and/or CH4 drove this warming.
- Atmospheric CO2 may or may not have risen from ~300 to 800 ppm (Royer et al., 2001) or from 2,400 to 2,900 ppm (Pearson & Palmer, 2000).


- The oceans acidified. From 60 to 50 million years ago it has been estimated that seawater pH ranged from 7.42 to 7.92 (Pearson et al., 2000)… Hardly acidic, the PETM wasn’t even the lowest pH value of the Paleocene-Eocene epochs. The EECO actually exhibited a lower pH.
- The PETM is often cited as a geological analogy for the modern myth of ocean acidification… It’s a great example of the scientific basis of the myth.

- A mass extinction occurred.
- Laughable… Really laughable.
- The Lower Tertiary period (Paleocene + Eocene epochs) was a time of booming biodiversity, particularly in the tropics.

Shoaling of the Lysocline? What’s a Lysocline?
I doubt I’m the only 1970’s-educated geologist who reacts to the phrase “ocean acidification” by rolling his eyes and shouting, “It’s called shoaling of the lysocline, the oceans can’t acidify!” First, a couple of definitions from the Society for Sedimentary Geology (SEPM, formerly known as the Society of Economic Paleontologists and Mineralogists)…
Oceanographic Setting
The deposition of carbonate material depends on the oceanographic setting of the area; this includes the water chemistry, water depth, and the hydrography of the area. The carbonate slope is a very dynamic region, each of which experiences different amounts of light, nutrients, temperature, pressure, chemistry, and biota.Ocean Chemistry:
Lysocline: the depth at which a rapid increase in dissolution occurs; it separates the well preserved (above) from the poorly preserved (below) calcareous microfossil assemblages . The typical depth of the lysocline is between 3700-4500m and varies are a result of the carbonate ion concentration in the deep and intermediate water masses. It is shallowest when the CO2 concentration of the water is highest because those waters are the most corrosive to the calcareous microfossils.Compensation Depth (of aragonite or calcite): the depth at which the amount of calcium carbonate delivered to the seafloor is equal to the amount removed by dissolution. The average depth of the calcite compensation depth (CCD) is 4500 m in the Pacific and 5500 m in the Atlantic and shallows when there is a greater supply of carbonate material to the seafloor. Only above the CCD can carbonate materials be deposited (below the CCD they dissolve and do not reach the sea floor). The deep depth of the CCD results only in dissolution on the lower parts of the slope.
Factors that affect the depth of the lysocline and the compensation depth include:
- Water temperature
- Depth
- CO2 concentration
- pH (high pH values aid in carbonate preservation)
- Amount of carbonate sediment supply
- Amount of terrigenous sediment supply
Calcium carbonate solubility increases with increasing carbon dioxide content, lower temperatures, and increasing pressure. Other factors that can influence the dissolution of calcium carbonate: organic coatings on the grains, size of the grain (smaller grains dissolve faster).
Aragonite?
Did you know…
Without calcite and aragonite many of Earth’s organisms could not exist. These are the minerals most invertebrate organisms use to construct their shells and hard parts. So if you have ever admired a colorful seashell, you have already paid tribute to the range of colors calcite and aragonite come in and indirectly to the ease with which calcite and aragonite form at the Earth’s surface.
Aragonite and calcite are ‘polymorphs’, minerals that have the same chemical composition but slightly different crystal structures. Both minerals can occur together and are so similar to one another that distinguishing between them is seldom important to anyone but a professional geologist. Calcite is more stable and common than aragonite under the chemistry of our modern seas, but at times in the Earth’s past, aragonite was the more stable and common form. The two minerals are nearly identical in their physical properties, so through the remainder of this website they will be treated together under the name ‘calcite’.
Calcite forms in a range of settings from hot springs and underground caverns to growing coral reefs and seashells. This not only reflects calcite’s abundance, but also the ease with which it forms, dissolves, and reforms. Calcite is almost as common in our society as it is in nature, its uses ranging from medicine and animal feed, to Michelangelo’s ‘Pieta,’ and highway overpasses. To a remarkable degree, human society mimics marine organisms in the sense that we rely on calcite to construct many of the ‘hard’ parts of our society, in the form of marble, plaster, mortar, and cement.
Description and Identifying Characteristics
Calcite occurs in both crystalline and massive forms. Crystals of calcite are usually transparent to translucent, but can exhibit a wide variety of colors if the crystal includes minor impurities. Masses of calcite also tend to be light colored, but as with the transparent crystals, the presence of even minor amounts of impurities can create a wide range of colors.
Since calcite can have so many appearances, the simplest way to determine whether a sample contains calcite is to test its reaction to a dilute acid like household vinegar. Calcite will readily react with acid to ‘effervesce’, producing small bubbles of CO2 similar to those formed when you open a bottle of soda and pour it into a glass. Soft enough to be easily scratched by a nail, calcite crystals can also be identified by their rhombic cleavage. ‘Rhombic cleavage’ means that calcite crystals break along parallel planes of weakness that meet at the same angles as a rhomb’s sides.
The “lysocline” is the depth below which a rapid dissolution of carbonate material occurs.
The “carbonate compensation depth” (CCD) is the depth at which the deposition and dissolution of carbonate material are equal.
The depths of the lysocline and CCD are controlled by:
- Water temperature
- Warming deepens the lysoclne & CCD
- Depth (pressure)
- CO2 concentration
- Increasing CO2 concentration shoals (makes shallower) the lysocline & CCD
- pH (high pH values aid in carbonate preservation)
- Lowering pH shoals the lysocline & CCD
- Amount of carbonate sediment supply
- Increasing carbonate sediment supply deepens the lysocline & CCD
- Amount of terrigenous sediment supply
The “bad news” here for the Warmunists is that warming water and increased carbonate sediment supply tend to offset the effects of lowering pH and increasing pCO2. The really bad news for the Warmunists is that the dissolution of benthic and planktic formaminfera is a great source of carbonate sediment supply:
Studies of modern carbonate settings have documented varied origins for mud-size sediment, including disintegration of benthic and planktic organisms, precipitation from the water column, and mechanical breakdown of larger particles. Carbonate muds accumulate in protected “low-energy” settings on the platform top and are also exported to adjacent deeper-water settings.
Shoaling of the Lysocline during the PETM
There is extensive evidence for a shoaling of the lysocline during the PETM.
The Paleocene/Eocene Thermal Maximum (PETM) was a transient interval of global warming ~55 m.y. ago associated with transformation of ecosystems and changes in carbon cycling. The event was caused by the input of massive amounts of CO2 or CH4 to the ocean-atmosphere system. Rapid shoaling of the lysocline and calcite compensation depth (CCD) is a predicted response of CO2 or CH4 input; however, the extent of this shoaling is poorly constrained. Investigation of Ocean Drilling Program (ODP) Sites 1209–1212 at Shatsky Rise, which lies along a depth transect, suggests a minimum lysocline shoaling of ~500 m in the tropical Pacific Ocean during the PETM. The sites also show evidence of CaCO3 dissolution within the sediment column, carbonate “burn-down” below the level of the carbon isotope excursion, and a predicted response to a rapid change in deepwater carbonate saturation. Close examination of several foraminiferal preservation proxies (i.e., fragmentation, benthic/planktonic foraminiferal ratios, coarse fraction, and CaCO3 content) and observations of foraminifers reveal that increased fragmentation levels most reliably predict intervals with visually impoverished foraminiferal preservation as a result of dissolution. Low CaCO3 content and high benthic/planktonic ratios also mirror intervals of poorest preservation.
This is what the PETM shoaling of the lysocline looked like:


This paper was initially submitted for publication in March 2004… Can anyone guess what phrase did not appear in this 36-page paper? You got it! “Ocean acidification” was never mentioned in this paper or most other PETM papers prior to Ken Caldeira’s fabrication of the mythical phrase in 2003. Since then, it has become ubiquitous.
PETM Benthic Foraminifera “Mass Extinction”
If benthic foraminifera were driven to extinction by the PETM ocean acidification, why do we still have benthic foram’s today? The Permian-Triassic mass extinction took out trilobites… They didn’t come back. The K-Pg (K-T) mass extinction wiped out all of the remaining [non-avian]* dinosaurs… Apart from Jurrasic Park and Barney, they have remained extinct. However, those rascally benthic foram critters just wouldn’t stay extinct (Yes… I am being a smartass).
*As noted in the comments, only non-avian dinosaurs became extinct at the end of the Cretaceous.
In the Plio-Pleistocene and Miocene “rocks” of the Gulf of Mexico, we rely on the extinctions of benthic & planktonic foram’s and other calcareous nanofossils for chrono- and bio-stratigraphic correlations. Unlike “hard rocks” of the Mesozoic in places like East Texas, we don’t have “rock formations” as they are commonly understood. We need foram extinctions in order to correlate wells. So… The more foram extinctions, the better.
Here’s a Paleogene biostratigraphic chart of the US Gulf Coast Basin from Paleo-Data®, Inc.

The far-right column is titled “Benthic Foraminifera.” This symbol next to a bug name: ▼, indicates a “last appearance datum.” Of course, since the well is being drilled from the top-down, it’s the first appearance of that particular bug in the well. Unfortunately for the bugs, they were deposited from the bottom-up. A last appearance datum generally indicates the extinction of that particular bug. However, there’s never a shortage of bugs because new ones evolve all the time.
Here’s a “funny thing” about the PETM benthic foraminifera “mass extinction”: The benthic foram’s rapidly recovered from their extinction (literally):
Palaeogeography, Palaeoclimatology, Palaeoecology 279 (2009) 186–200.
Extinction and recovery of benthic foraminifera across the Paleocene–Eocene Thermal Maximum at the Alamedilla section (Southern Spain)
L. Alegret , S. Ortiz E., Molina
A b s t r a c t
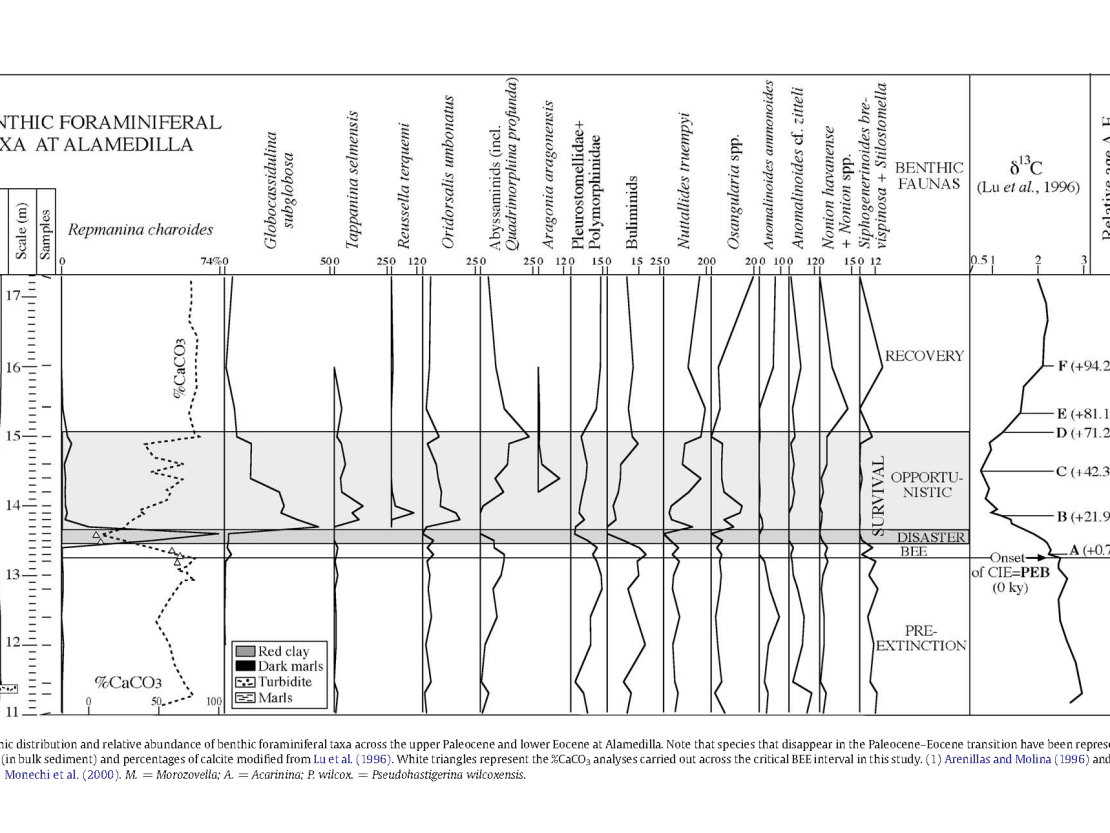
A complete succession of lower bathyal–upper abyssal sediments was deposited across the Paleocene–Eocene Thermal Maximum (PETM) at Alamedilla (Betic Cordillera, Southern Spain), where the benthic foraminiferal turnover and extinction event associated with the negative carbon isotope excursion (CIE) across the PETM have been investigated. Detailed quantitative analyses of benthic foraminifera allowed us to distinguish assemblages with paleoecological and paleoenvironmental significance: pre extinction fauna, extinction fauna, survival fauna (including disaster and opportunistic fauna) and recovery fauna. These assemblages have been associated with significant parts of the δ13C curve for which a relative chronology has been established. The correlation between the benthic turnover, the δ13C curve, the calcite and silicate mineral content, and sedimentation rates, allowed us to establish the sequence of events across the PETM. At Alamedilla, the benthic extinction event (BEE) affected ~37% of the species and it has been recorded over a 30-cm-thick interval that was deposited in c.a. 10 ky, suggesting a gradual but rapid pattern of extinction. The beginning of the BEE coincides with the onset of the CIE (+0 ky) and with an interval with abundant calcite, and it has been recorded under oxic conditions at the seafloor (as inferred from the benthic foraminiferal assemblages and the reddish colour of the sediments). We conclude that dissolution and dysoxia were not the cause of the extinctions, which were probably related to intense warming that occurred before the onset of the CIE.
The BEE is immediately overlain by a survival interval dominated by agglutinated species (the Glomospira Acme). The low calcite content recorded within the survival interval may result from the interaction between dilution of the carbonate compounds by silicicate minerals (as inferred from the increased sedimentation rates), and the effects of carbonate dissolution triggered by the shoaling of the CCD. We suggest that Glomospira species (disaster fauna) may have bloomed opportunistically in areas with methane dissociation, in and around the North Atlantic. The disaster fauna was rapidly replaced by opportunistic taxa, which point to oxic and, possibly, oligotrophic conditions at the seafloor. The CCD gradually dropped during this interval, and calcite preservation improved towards the recovery interval, during which the δ13C values and the calcite content recovered (c.a. +71.25 to 94.23 ky) and stabilized (N94.23 ky), coeval with a sharp decrease in sedimentation rates.
Benthic foram’s appear to have an even higher recovery rate from extinction than the Incilius genus of toads…
Thermal Maximum at the Alamedilla section (Southern Spain). Palaeogeography, Palaeoclimatology, Palaeoecology 279 (2009) 186–200
The “ocean acidification” (shoaling of the lysocline) of the PETM is represented by the 30 cm thick band of red clay from 13.4 to 13.7 m on the lithology column in figure 8. When the lysocline and carbonate compensation depth (CCD) briefly shoaled, the transition from calcareous to siliceous ooze moved shoreward. When the CCD dropped back down to its pre-PETM depth, the transition from calcareous to siliceous ooze moved seaward… Leaving a 30 cm thick layer of red clay in the middle of a thick marl sequence. Rising and falling sea level could have left a similar layer of red clay.

The benthic foram’s above and below the red clay horizon ceased to exist at that location for about 70,000 to 220,000 years. However, the fact that at least some of them returned to that location after the PETM might indicate that the benthic foram “mass extinction” was more of a benthic foram depositional “mass relocation,” rather than a true extinction. I’ll let “Farmer Fran” explain how the benthic foram’s in figure 8 recovered from extinction:
Some authors actually have seriously referred to the PETM benthic foram extinction as a “mass extinction”… And they still expect to be taken seriously?
Excessive carbonate undersaturation of the deep ocean would likely impede calcification by marine organisms and therefore is a potential contributing factor to the mass extinction of benthic foraminifera at the P-E boundary. Although most plankton species survived, carbonate ion changes in the surface ocean might have contributed to the brief appearance of weakly calcified planktonic foraminifera (6) and the dominance of heavily calcified forms of calcareous algae (37). What, if any, implications might this have for the future? If combustion of the entire fossil fuel reservoir (~4500 GtC) is assumed, the impacts on deep-sea pH and biota will likely be similar to those in the PETM. However, because the anthropogenic carbon input will occur within just 300 years, which is less than the mixing time of the ocean (38), the impacts on surface ocean pH and biota will probably be more severe.
Good fracking grief!!! WTF is “the entire fossil fuel *reservoir*”? Last I checked, most fossil fuel (coal) isn’t in a reservoir (coal bed methane isn’t a coal reservoir) and the fossil fuels that do occupy reservoirs (petroleum and natural gas) occupy many thousands thousands of different reservoirs.
Accuracy not withstanding… So, if we burned all of the fossil fuels that Zachos et al think exist, the effects on deep-sea biota might be as bad as the PETM and the surface effects might be worse… if we burn all of those fossil fuels within 300 years. And? What’s the problem here? Is the field of speculative non sequitur reasoning now an academic discipline of science? Oh wait… Yes it is. It’s what climate science has become since 1988.
Here are Cenozoic temperatures, CO2 and pH plotted all together:


What caused the PETM non-catastrophe?
Well… It certainly wasn’t SUV’s or coal-fired power plants. The most likely explanation is the formation of the North Atlantic Igneous Province.
During the Paleocene-Eocene thermal maximum (PETM) (1), the sea surface temperature rose by 5°C in the tropics (2) and more than 6°C in the Arctic (3), in conjunction with ocean acidification (4) and the extinction of 30 to 50% of deep-sea benthic formaminiferal species (5). The initiation of the PETM is marked by an abrupt decrease in the δ13C proportion of marine and terrestrial sedimentary carbon (1, 6), which is consistent with the rapid addition of >1500 gigatons of 13C depleted carbon, in the form of carbon dioxide and/or methane, into the hydrosphere and atmosphere (7). The PETM is thought to have lasted only 210,000 to 220,000 years, with most of the decrease in δ13C occurring over a 20,000-year period at the beginning of the event (8).
A possible trigger for the initiation of the PETM is a period of intense flood basalt magmatism attending the opening of the North Atlantic (9, 10), by generating metamorphic methane from sill intrusion into basin-filling carbon-rich sedimentary rocks (11).Here we present 40Ar/39Ar age determinations that allow the correlation of Early Tertiary volcanic rocks of East Greenland and the Faeroe Islands with the Danish Ash-17 deposit, which closely overlies PETM sequences in the North Atlantic. In East Greenland, a >5-km thick sequence of plateau basalts formed in 1.0 ±0.5 million years (My). A surge in magma production, coupled with the eruption of mid-ocean ridge basalt (MORB)–like flows in the lower part of the flood basalt sequence, indicates the initiation of seafloor spreading at 55.5 ± 0.3 million years ago (Ma). The onset of the PETM correlates closely with this breakup-related magmatism.
So…
The “mass extinction” of benthic foram’s was limited to “30 to 50% of deep-sea benthic formaminiferal species,” some of which appear to have un-extincted after the PETM… Bravo Foxtrot Delta.
The trigger could have been “the rapid addition of >1500 gigatons of 13C depleted carbon, in the form of carbon dioxide and/or methane, into the hydrosphere and atmosphere… over a 20,000- year period at the beginning of the event.”
Over the past 266 years, humans have added about 432 gigatons of 13C depleted carbon, in the form of carbon dioxide and/or methane, into the hydrosphere and atmosphere, nearly 1/3 of the PETM in a fraction of the time and there’s no actual evidence that we have significantly shoaled the lysocline.
The funniest “funny thing” about the PETM and other early Paleogene climatic optima is that they may very well have been “astronomically paced” (Lourens et al., 2005). It makes one wonder if plate tectonics might also be influenced by astronomical pacing… But that’s a whole other area of speculation. If the PETM, EECO, MECO, etc. were actually driven by orbital mechanics…

Mythical evidence for shoaling of the Lysocline during the equally mythical “Anthropocene”
According to Feely et al, 2004, the supersaturation/undersaturation horizons for aragonite and calcite have shoaled over the course of the mythical geologic epoch known as the “Anthropocene.”

Over the past 250 years, since the beginning of the industrial revolution, there has been about a 16% decrease in aragonite and calcite saturation state in the Pacific Ocean. From repeat oceanographic surveys, we have observed an average 0.34% yr−1 decrease in the saturation state of surface seawater with respect to aragonite and calcite over a 14‐year period. This has caused an upward migration of the aragonite and calcite saturation horizons toward the ocean surface on the order of 1–2 m yr−1. These changes are the result of the uptake of anthropogenic CO2 by the oceans, as well as other smaller scale regional changes in circulation over decadal time scales. If CO2 emissions continue as projected out to the end this century, the resulting changes in the marine carbonate system would mean that many coral reef systems in the Pacific would probably no longer be able to maintain the necessary rate of calcification required to sustain their vitality.
The 16% decrease in aragonite and calcite saturation state in the Pacific Ocean over the past 250 years is entirely based on calculating the preindustrial aragonite and calcite from the assumed preindustrial atmospheric CO2 concentration. It is circular reasoning. Regarding that claim that they’ve measured 14-28 m of shoaling over a 14-year period… FOURTEEN YEARS?!?!?
How’s about we have look at a slightly longer measurement record and an actual laboratory experiment?
Part Deux-Point-Deux: Chicken Little of the Sea Revisits Station ALOHA and the WHOI laboratory
Station ALOHA and HOTS
The Hawaii Ocean Time Series (HOTS) is a continuous record of surface (~0-30 m) CO2 measurements that currently runs from Halloween 1988 through Thanksgiving 2016. HOTS also includes pH, aragonite/calcite saturation, dissolved inorganic carbon (DIC or ), total alkalinity (TA), salinity, temperature and and other measurements.
Station ALOHA
A Long-term Oligotrophic Habitat Assessment
(Station 2: a 10 Km radius circle centered at 22 45’N, 158 W, approximately 100 km north of Oahu, Hawaii).

All data in this product are from Station ALOHA (22°45’N, 158°00’W). HOT programbackground information and details of sampling strategy may be found in Karl and Lukas (1996) and Karl et al. (2001). Results from the HOT CO2 measurement program may be found in Winn et al. (1994, 1998) and Dore et al. (2003, 2009, 2014).
The data in this product represent mean surface (0-30 dbar) values for each HOT cruise except where otherwise indicated.
The Station ALOHA HOTS data can be accessed here.
What do the HOTS data tell us?
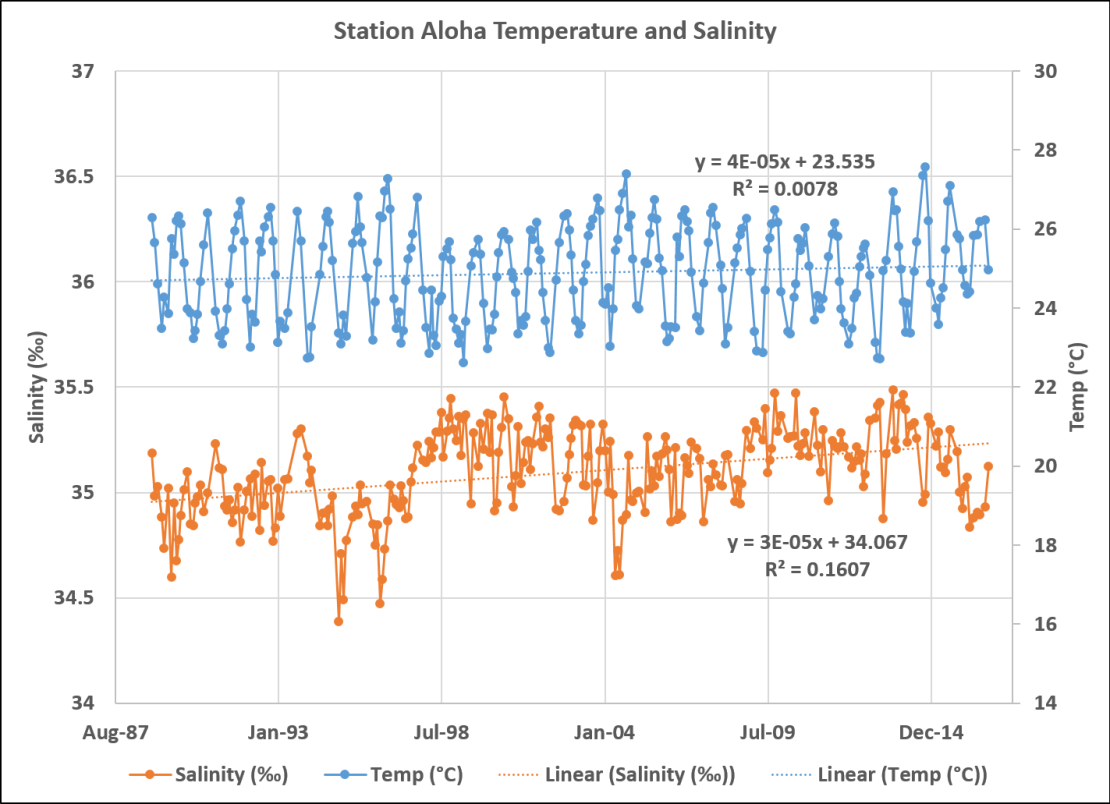
There is no sea surface temperature (SST) warming trend at Station ALOHA over the past 29 years and there is a weak trend of increasing salinity.
About half of the Station ALOHA cruises did not actually measure pH. It was usually calculated. Seawater pH is usually calculated from DIC and TA because it is not easy to directly obtain meaningful seawater pH measurements. NOAA/PMEL assess pre-1989 pH measurements as pretty well useless…
The data collected prior to 1989 are typically not well documented and their metadata is incomplete; therefore, such data are of unknown and probably variable quality. The reasons for this are manifold (see next section). The uncertainty of these older pH measurements is rarely likely to be less than 0.03 in pH, and could easily be as large as 0.2 in pH. This data set is thus not at all well-suited to showing a change of 0.1 in pH over the last 100 years — the amount of pH change that would be expected to occur over the 100 years since the first seawater pH measurements, as a result of the documented increase in atmospheric CO2 levels and assuming that the surface ocean composition remains in approximate equilibrium with respect to the atmosphere.
It is only since the 1990s that it has been possible to discern small pH changes in the ocean with reasonable confidence. The figure in Feely (2008, updated version shown above) shows the changes in pH inferred from measured changes in the seawater carbonate system seen off Hawaii since 1988, when a regular time-series study was instituted there using the best available methods for measuring CO2 changes in seawater. A limited number of other time-series stations have shown a similar pattern (Rhein et al., 2013; Bates et al., 2014).
Here is the Station ALOHA calculated pH (normalized to 25 °C) trend. DIC, TA and pH measurements and calculations are usually normalized to a constant temperature and/or salinity because temperature and salinity have a YUGE effect on DIC, TA and pH.
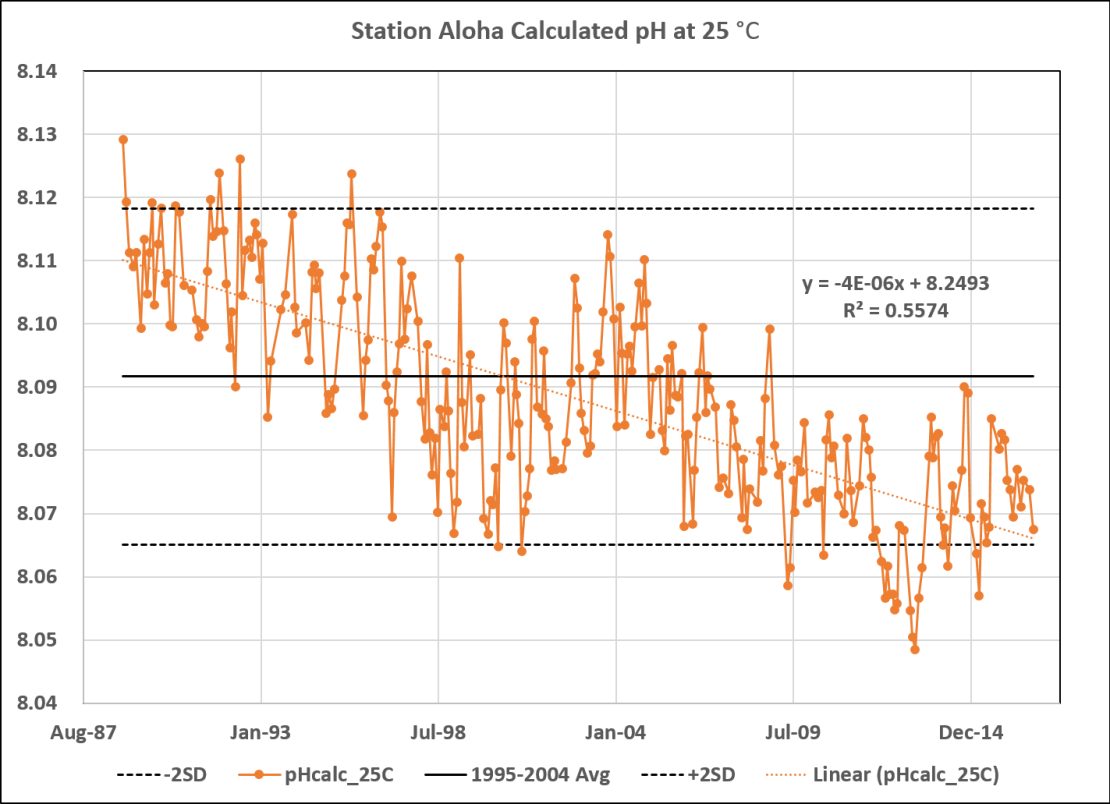
While the Station ALOHA pH trend does exhibit a negative slope and correlates well with pCO2 (R² = 0.8646), most of the values fall within 2δ of the 1994-2005 mean. Over the past 29 years the pH has dropped from 8.1 to 8.1, rounded to 1 decimal place.
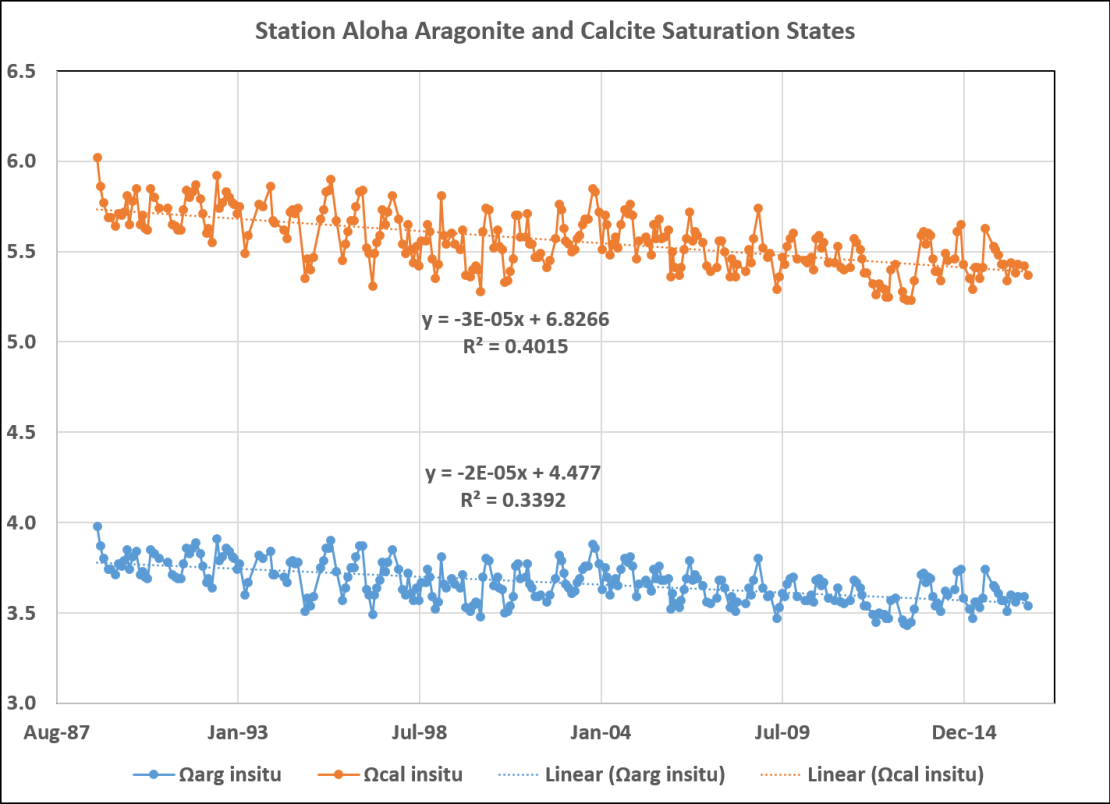
Next up: Aragonite (Ωarg) and calcite (Ωcal) saturation states:
Here are the same trends since May 2000…

PETM here we come!!! (do I need to put a /Sarc tag here?)
Here’s a funny correlation. In situ Ωarg vs. pCO2…

Station ALOHA pCO2 in situ also correlates very poorly with the saturation state of calcite (R² = 0.0541). I wonder why the in situ pCO2 and pH correlate so poorly with carbonate saturation. Maybe it has something to do with being in situ.
In situ…
In its original position or place. Geol: Said specifically of a rock, soil, or fossil, when in the situation in which it was originally formed or deposited.
Dictionary of Geological Terms, American Geological Institute 1976.
In the case of Station ALOHA, in situ means as measured, unadjusted, not normalized, unadulterated.
Note that In situ Ωarg has a much better correlation to SST than to in situ pCO2…

No wonder they normalize pCO2 to a constant temperature and DIC & TA to a constant salinity. As in all things related to Gorebal Warming, all other factors must be held equal for the math to work.
Chicken Little of the Sea checks in for some lab work
Here’s the in situ Ωarg vs. pCO2… normalized to 20 °C and the laboratory correlation from Ries et al, 2009 at 25 °C. The power function was derived from Ries.

Ries et al., 2009 conducted a laboratory experiment on a representative sample of marine calcifiers (oceanic critters that make shells, tests, carapaces, etc. out of CaCO3)…
To investigate the impact of ocean acidification on a range of benthic marine calcifiers, we reared 18 calcifying species for 60 d in isothermal (25 °C; see the Data Repository for discussion) experimental seawaters equilibrated with average pCO2 values (±SD) of 409 (±6), 606 (±7), 903 (±12), and 2856 (±54) ppm, corresponding to modern pCO2, and ~2, 3, and 10 times pre-industrial levels (~280 ppm), respectively, and yielding average seawater saturation states (±SD) of 2.5 (±0.4), 2.0 (±0.4), 1.5 (±0.3), and 0.7 (±0.2) with respect to aragonite (see the Data Repository for detailed methods). These carbonate system parameters were selected to represent the range of values predicted for the coming millennium (Brewer, 1997; Feely et al., 2004) and to span those reported to have occurred since mid-Cretaceous time (ca. 110 Ma; Royer et al., 2004; Tyrrell and Zeebe, 2004). The organisms’ net rates of calcifi cation (total calcification minus total dissolution) under the various pCO2 treatments were estimated from changes in their buoyant weight and verified with dry weight measurements after harvesting.
Here is my interpretation of Ries’ results (modified after Table 1 and Figure 1)…
| Modern | 2x PI | 3x PI | 10x PI | ||
| pCO2 HOTS | 589 | 897 | 1,542 | 6,476 | |
| pCO2 Ries | 409 | 606 | 903 | 2,856 | |
| ΩARG | 2.5 | 2.0 | 1.5 | 0.7 | |
| Organism | Panel | % Below Modern | % Below Modern | % Below Modern | % Below Modern |
| Blue Crab | A | 0% | 0% | 0% | 0% |
| Shrimp | B | 0% | 0% | 0% | 0% |
| Lobster | C | 0% | 0% | 0% | 0% |
| Limpet | D | 0% | 0% | 0% | 0% |
| Purple urchin | E | 0% | 0% | 0% | 0% |
| Coralline red algae | F | 0% | 0% | 0% | 0% |
| Halimeda | G | 0% | 0% | 0% | 100% |
| Blue mussel | H | 0% | 10% | 17% | 20% |
| Temp. coral | I | 0% | 0% | 0% | 14% |
| Pencil urchin | J | 0% | 0% | 0% | 100% |
| Hard clam | K | 0% | 0% | 20% | 100% |
| Conch | L | 0% | 50% | 25% | 100% |
| Serpulid worm | M | 0% | 0% | 22% | 30% |
| Peri-winkle | N | 0% | 0% | 25% | 44% |
| Bay scallop | O | 0% | 0% | 40% | 60% |
| Oyster | P | 0% | 50% | 50% | 100% |
| Whelk | Q | 0% | 40% | 0% | 100% |
| Soft clam | R | 0% | 50% | 75% | 100% |
The aragonite saturation data from Station ALOHA indicate that critical levels would occur at much higher pCO2 levels than Ries’ formulations. Most of the marine calcifier taxa were relatively unaffected below the equivalent of 600-900 ppm CO2.
Taxa without a strong preference for aragonite over calcite, that had a higher degree of organic cover and those that utilized photosynthesis tended to fare better under high CO2 conditions. Some of the best seafood (crab, shrimp & lobster) thrive in under high CO2 conditions.

The only marine calcifier which appears to be in peril at pCO2 levels likely to be reached in the next few centuries is the soft clam, Mya arenaria,… And this is fracking HILARIOUS!!!
The high tolerance of environmental factors is reflected in two statements made by Hidu & Newell (1989) about clam culture: “Mya larvae are among the most hardy that we have reared; one has to work overtime with incompetence to destroy a brood.” and “If Mya are hardy as larvae they are even more hardy as juveniles.”
Do I need to explain this?
Ries et al., 2009 tried as hard as they could to wipe out marine calcifiers with “ocean acidification.” The only taxa, they were able to even remotely imperil was Mya arenaria (called “steamers” where I grew up)… possibly the hardiest of all hardy marine calcifiers. This bit can’t be repeated too often…
“Mya larvae are among the most hardy that we have reared; one has to work overtime with incompetence to destroy a brood.”
You really couldn’t make this schist up if you were trying. Mya arenaria is possibly the most successful invasive species of the Phanerozoic Eon… It was an invasive species before Adam met Eve… Long before Adam met Eve. Yet, it is the only taxa that Ries et al., 2009 managed to “work overtime with incompetence to destroy a brood.”
Oh… And pCO2 is not “well-mixed” like the atmospheric mixing ratio of CO2 . It varies widely…
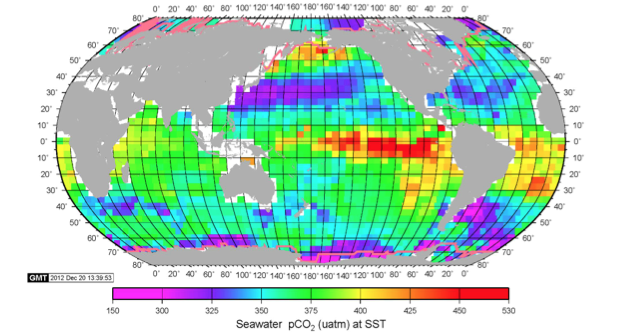
So… Chicken Little of the Sea will pretty well only be an issue, where it is already an issue… mostly in areas of strong upwelling.
Conclusion
The Earth isn’t behaving any differently over the past 150 years than it has behaved over the past [fill in the blank] years. Same as it ever was…
References
Alegret, L., S. Ortiz & E. Molina. Extinction and recovery of benthic foraminifera across the Paleocene–Eocene Thermal Maximum at the Alamedilla section (Southern Spain). Palaeogeography, Palaeoclimatology, Palaeoecology 279 (2009) 186–200
Beerling, D. J. & Royer, D. L. Convergent Cenozoic CO2 history. Nature Geosci. 4, 418–420 (2011)
Colosimo, A.B, Bralower, T.J., and Zachos, J.C., 2006. Evidence for
lysocline shoaling at the Paleocene/Eocene Thermal Maximum on Shatsky
Rise, northwest Pacific. In Bralower, T.J., Premoli Silva, I., and Malone, M.J. (Eds.), Proc. ODP, Sci. Results, 198, 1–36
Dore, J.E., R. Lukas, D.W. Sadler, M.J. Church, and D.M. Karl. 2009. Physical and biogeochemical modulation of ocean acidification in the central North Pacific. Proc Natl Acad Sci USA 106:12235-12240
Feely, R. A., C. L. Sabine, K. Lee, W. Berelson, J. Kleypas, V. J. Fabry, and F. J. Millero (2004), Impact of anthropogenic CO2 on the CaCO3 system in the oceans, Science, 305, 362–366, doi:10.1126/science.1097329
Feely, R. A., C. L. Sabine, R. H. Byrne, F. J. Millero, A. G. Dickson, R. Wanninkhof, A. Murata, L. A. Miller, and D. Greeley (2012), Decadal changes in the aragonite and calcite saturation state of the Pacific Ocean, Global Biogeochem. Cycles, 26, GB3001, doi: 10.1029/2011GB004157.
Harris, Paul M. (Mitch) and Barry J. Katz. Carbonate Mud and Carbonate Source Rocks. Search and Discovery Article #40305 (2008). Adapted from poster presentation at AAPG Annual Convention, Calgary, Alberta, June 16-19, 2005.
Hoorn, C., Wesselingh, F.P., ter Steege, H.; Bermudez, M.A., Mora, A., Sevink, J., Sanmartin, I., Sanchez-Meseguer, A., Anderson, C.L., Figueiredo, J.P., et al. Amazonian through time: Andean uplift,climate change, landscape evolution and biodiversity. Science 2010, 330, 927–931
Lourens, L. J., A. Sluijs, D. Kroon, J. C. Zachos, E. Thomas, U. Röhl, J. Bowles, and I. Raffi (2005), Astronomical pacing of late Palaeocene to early Eocene global warming events, Nature, 435, 1083–1087, doi:10.1038/nature03814
Pagani, M., J.C. Zachos, K.H. Freeman, B. Tipple, and S. Bohaty. 2005. Marked Decline in Atmospheric Carbon Dioxide Concentrations During the Paleogene. Science, Vol. 309, pp. 600-603, 22 July 2005.
Pearson, P. N. and Palmer, M. R.: Atmospheric carbon dioxide concentrations over the past 60 million years, Nature, 406, 695–699,https://doi.org/10.1038/35021000, 2000.
Ries, Justin B., Anne L. Cohen, Daniel C. McCorkle; Marine calcifiers exhibit mixed responses to CO2-induced ocean acidification. (2009). Geology ; 37 (12): 1131–1134. doi: https://doi.org/10.1130/G30210A.1
Royer, et al., 2001. Paleobotanical Evidence for Near Present-Day Levels of Atmospheric CO2 During Part of the Tertiary. Science 22 June 2001: 2310-2313. DOI:10.112
Storey, Michael, Robert A. Duncan, Carl C Swisher 2007. Paleocene-Eocene Thermal Maximum and the Opening of the Northeast Atlantic. Science 27 April 2007: 587-589. DOI:10.1126
Strasser M, 1999. Mya arenaria: an ancient invader of the North sea coast. Helgolander Meeresunters 52:309–324.
Tripati, A.K., C.D. Roberts, and R.A. Eagle. 2009. Coupling of CO2 and Ice Sheet Stability Over Major Climate Transitions of the Last 20 Million Years. Science, Vol. 326, pp. 1394 1397, 4 December 2009. DOI: 10.1126/science.1178296
Zachos, J. C., Pagani, M., Sloan, L. C., Thomas, E. & Billups, K. Trends, rhythms, and aberrations in global climate 65 Ma to present. Science 292, 686–-693 (2001).
Zachos, et al., 2005. Rapid Acidification of the Ocean During the Paleocene-Eocene Thermal Maximum. Science 10 June 2005: 1611-1615. DOI:10.1126
David Middleton,
Thank you for this well-written, exhaustive and thorough piece.
” The K-Pg (K-T) mass extinction wiped out all of the remaining dinosaurs… ”
Nope. Birds survived.
Technically they were no longer dinosaurs.
Although some members of the dinosauria clade did survive the K-Pg extinction and they evolved into modern birds, which are not classified as part of the dinosauria clade.
Nope. The Phylocode has them as part of the dino claud. Just like birds and us are part of the Synapsid clad. That’s what molecular phylohgentics says.
You’re right as to Phylocode, but birds aren’t synapsids, which are the ancestors of mammals, ie we are synapsids. Birds are diapsids, like their fellow archosaurs the crocs, and like the lepdiosaurs, ie squamates (lizards and snakes) and tuataras. The position of turtles remains controversial, but they now seem to be diapsids on the archosaur side of Reptilia (or Sauropsida).
Diapsid ancestors had two wholes in their heads behind the eye socket, while synapsids had only one. Archosaurs evolved additional holes in front of the orbit, to include in the jaw. Turtles are “anapsid”, lacking such openings, but now appear to be only secondarily anapsid (holeless), but not members of the Anapsida, amniotes from which both reptiles (diapsids) and mammals (synapsids) evolved.
I think mammals and mammal-like reptiles are synapsids… Not birds.
I’m not a paleontologist, but I did dress up as one for Halloween…
The name tag says…
Correct. Birds are diapsids, along with the other reptiles. Mammals are synapsids. We parted ways back in the Carboniferous.
Although of course the outdated term “mammal-like reptiles” is a misnomer, since synapsids, such as Dimetrodon, aren’t reptiles.
No… They were big lizards that ate cavemen…
I actually built one of these back in the early 70s.
But I’m sure we could reconcile, with the right coaching…
Pretty scary costume. Would be even more so with a rock hammer.
It’s hanging from my belt on my right hip. I even dug up a fossil…
Willie Nelson… 🙂
I had an alternate costume lined up, this sticker…
And my AAPG baseball cap, instead of my new field hat.
I wasn’t sure if that were a hammer or not. I see the fossil.
A “Dammit Jim” name tag–you gotta love it.
Jim
Nope. Birds are maniraptoran, coelurosaur, tetanuran, theropod dinosaurs. Also archosaurs, diapsids, reptiles, amniotes and tetrapods, among other clades. That’s how cladistic phylogeny works.
The ancestors of modern birds existed in the Cretaceous, with the then more numerous “opposite birds” as well. All of the latter were wiped out in the MEE, with the non-avian dinosaurs, ie other theropods, sauropods and ornithischians.
This is splitting hairs on what was a sarcastic remark about critters returning from extinction…
https://en.wikipedia.org/wiki/Euavialae
The extinct Jeholornis is classified as a dinosauria. The extant Euavialae isn’t.
However, the avian dinosauria clearly survived the K-Pg extinction and evolved into modern birds. So… I should have made my sarcastic remark in a more scientifically accurate manner.
It’s not hair=splitting at all. Birds are dinosaurs, phylogenetically speaking, ie biologically, paleontologically and in the way of every other scientific discipline.
No ifs, ands or buts about it. That’s why paleontologists speak of “non-avian dinosaurs”. Here is an anatomical comparison of the forearm bones of early “bird” Archaeopteryx and maniraptoran dromeosaur Deinonychus:
Archie also featured a sickle claw toe, just like its fellow raptors. So did other relatives and ancestors of modern birds.
Humans are similarly tetrapods, amniotes, synapsids, therapsids, mammals, primates, apes and a bunch of other clades.
Euavialae is a clade within maniraptora:
See the cladogram from 2015 within this link:
https://en.wikipedia.org/wiki/Maniraptora
There’s no doubt that modern birds evolved from non-avian dinosaurs or that humans, dimetrodons and all mammals and mammal-like reptiles are synapsids… But… calling a bird a dinosaur seems analogous to calling a human a dimetrodon.
However, I stand corrected…
http://www.ucmp.berkeley.edu/taxa/verts/dinosauria/index.php
I guess if a wolf can become a Pomeranian in 40,000 years, dinosaurs could become Cockatoos in 65 million years.
Humans are synapsids. That’s how clasistic, phylogenetic taxonomy works.
Humans are synapsids, mammals, primates and apes, to mention but a few included clades. Birds are diapsids, dinosaurs, theropods and maniraptors, again leaving out many clades.
Of course… This now means that Polar Bears are just whitish Brown Bears… 😉
Whether polar bears and brown bears are distinct species is debatable. But they’re still diverging, so if not now, then in the future.
But yes, their ancestors are brown bears, so that’s an included clade. It works even when the ancestral or parental species still exists.
The most recent common ancestor of modern brown bears and polar bears is a Pleistocene brown bear. Their divergence probably started late in the glaciation before the Eemian Interglacial, or at least their distinctive white coloration evolved between 200 and 125 thousand years ago.
Others date the split from 600 Ka to 5 Ma.
https://en.wikipedia.org/wiki/Cladistics
While brown bears have changed relatively little, polies became progressively better adapted at specializing on ringed seals as their main prey species, without losing their omnivorous abilities.
So whether polies are the species Ursus maritimus or the subspecies U. arctos maritimus, some form of U. arctos is ancestral. They still interbreed and produce viable offspring.
Are Neanderthals a human subspecies or separate species in genus Homo?
If Neanderthals were still around, I think we would be the same species.
I agree, but there would be rabid racism, since they really are a subspecies, unlike any ethnic group today.
IMO, they were doomed as soon as anatomically modern humans left Africa. Denisovans as well.
Polar bears are black-skinned. The hair is so white largely because it is hollow and reflects light. It is both insulating and supposedly helps them float. The hair also traps solar energy as heat (again because it is hollow).
That’s true. It would have been more accurate to say that they evolved fur which looks white.
I attended the “History of Flight” at the Royal Ontario Museum in Toronto a few years ago. They presented a pretty convincing argument that feathered birds preceded dinosaurs, and that flight evolved twice, once with and once (later) without feathers. The created some feathered velociraptors and a huge animal I didn’t recognize, with foot-long claws.
While I acknowledge that there is an argument that birds evolved from dinosaurs, there is a pretty decent argument and timeline it was the birds that came first.
The large feathered dino with long claws was probably a therizinosaur, an herbivorous maniraptor. In the most recent cladogram, it is the sister group to the Pennaraptora, the group containing oviraptors and eumaniraptora, which includes birds.
There is still one ornithologist hold-out, Alan Feduccia, who thinks that birds are close archosaur relatives of dinos, rather than dinos themselves, but the evidence to the contrary is overwhelming. Maybe he even has come around, but just hasn’t published on the topic lately. He’ 76, IIRC.
I know of no paleontologist who dissents from dino descent. Feduccia’s last argument was based upon embryological finger formation, but even that has now been settled in favor of three-fingered theropod dinosaur ancestry.
In any case, dinosaurs existed long before the first birds show up in the fossil record.
It’s the budgies you have to watch out for.
Smart birds are kind of scary. Humanity’s only hope is that the parrots and crows will fight each other for world domination and leave us poor humans alone.
I for one would not welcome our new budgie masters.
Humans aren’t dimetrodons, unless we evolved from them, which is unlikely. It is correct to say however that humans and dimetrodons are both synapsids.
The synapsid group to which genus Dimetrodon belongs, sphenacodonts, did evolve into therapsids, from which mammals do descend. Synapsids became progressively more mammal-like during the Carboniferous and Permian, then evolved into mammals in the Triassic or Jurassic, depending upon how you define “mammal”.
IMO proto-mammals with both the standard vertebrate and uniquely mammalian jaw joint should count as mammals. That would include Triassic Morganucodon.
Even in Morganucodon, the rear jaw bones are co opted for hearing, but haven’t yet moved into the skull to become our middle ear bones. Meanwhile, the dentary bone is already articulated with the skull as our main jaw joint.
Another way of saying it is that humans and dimetrodons share a common ancestor. Again, the odds that humans descend directly from genus Dimetrodon are slim, but we definitely have ancestors among Carboniferous and Permian synapsid relatives of Dimetrodon.
We descend from those Carboniferous synapsids (pelycosaurs in Family Sphenacodontidae) which evolved into therapsids some 275 Ma, in the Permian. Therapsids included the cynodonts, the group which gave rise to mammals in the Late Triassic around 225 million years ago (as per my comment on jaw evolution).
Mammals by this definition are only slightly younger than dinosaurs, but older than the dinobird (maniraptoran) ancestors of birds.
You referenced the Linnean system of classification. That is dying as it is backwards. It assumes the current living organisms define the phyla and other taxonomic levels.
Birds are a case in point. Birds are the Class Aves. Dinos are a subclass of Reptiles. A Class cannot evolve from a subclass.
It’s replacement is the Phylocode, which uses extinct organisms to define the phyla, which is how evolution actually worked.
That means birds are a lower taxon to dinos from which they evolved from, and hence birds are of the taxon Dinosauria.
The Linnaean system doesn’t take evolution into account. Linnaeus recognized birds as a class separate from reptiles, but in fact they are reptiles, diapsids, archosaurs and dinosaurs.
While Linnaean categories are still in use, it’s only as a convenience. Cladistic phylogeny, based upon natural groupings, rules today, and rightly so.
In the history of evolution, nothing is more common than one Linnaean class evolving from another class. Tetrapods evolved from lobe-finned fish, so all us land vertebrates (including those which have returned to the sea) are technically sarcopterygians, along with our closest fishy kin the lungfish and coelacanths.
Wing evolution from maniraptoran arm:
Ok, so it’s splitting feathers. (or scales). Just let the flip (remark) flop and move on (dot org).
Actually birds are dinosaurs. Paleontologists are careful to speak of “non-avian dinosaurs” these days.
This said birds also very nearly became extinct at the K/Pg boundary. There was a wide variety of birds in the Late Cretaceaous but they nearly all disappeared. Only a very few, closely related, species survived. Possibly as few as three species: one paleognath ancestor, one galloanseres ancestor and one neoaves ancestor. They probably survived somewhere in the southern hemisphere, possiby in Antarctica.
Neornithine birds (waterfowl) in the Cretaceous:
http://www.digimorph.org/specimens/Vegavis_iaai/nature03150.pdf
Phylogenetically, they are. They are still from the dino clad.
Yes, and in every other way.
Same as humans are mammals, amniotes and vertebrates, birds are reptiles, amniotes and vertebrates.
More precisely, birds are maniraptors, coelurosaurs, tetanuran theropod dinosaurs. Here are the shared, derived traits which characterize each of the maniraptoran ancestors of modern birds:
Sorry that the print on that link is so small.
Farther back in time and phylogeny:
Good geology and history lesson.
Figure 6. “Here’s a funny correlation.”
Wow!
Thanks, David, interesting as always.
” I’ll explain shoaling of the lysocline later on in this post.”
Well, you didn’t exactly say what shoaling means. It seems to be just becoming shallower.
“I doubt I’m the only 1970’s-educated geologist who reacts to the phrase “ocean acidification” by rolling his eyes and shouting, “It’s called shoaling of the lysocline, the oceans can’t acidify!” “
But how does that help. “Lysocline” is exactly the criterion that OA is directed toward. The point below which CaCO₃₍ₛ₎ goes into solution because of unsaturation in the seawater. And as your SEPM list says, CO₂ and the linked change in pH is a factor here. None of what you show says that there is anything special about pH 7. What it does describe is a critical level at CCD. So it doesn’t matter that the oceans can’t “acidify” (pH 7). It’s just fussing about terminology.
So what is the actual argument here? It just seems to say that there haven’t been actual extinctions. Species survived. But as your diagrams make clear, the CCD is quite spatially variable. It could be a problem in many places without being a problem everywhere. Lack of extinction does not mean everything OK.
“While the Station ALOHA pH trend does exhibit a negative slope and correlates well with pCO₂”
So what was the point of bringing in HOTS? It seems to just show that OA is a trend. You seem to say that, well, it isn’t YUGE. But not that it isn’t worrying.
See the section titled: Shoaling of the Lysocline? What’s a Lysocline?
Look for this bit:
The point is that minor fluctuations in seawater pH do not constitute “ocean acidification.” Major shoaling of the lysocline/CCD are what constitute “ocean acidification,” as the mythical phrase was derived. Nor are the pH fluctuations a significant factor in carbonate saturation states.
Prolonged pCO2 levels of 2,000-3,500 μatm were associated with pH levels of 7.4-7.5 during the Lower Tertiary. The rise in pCO2 from about 2,400 to 2,900 μatm and subsequent drop to 1,900 μatm correlates with evidence of a significant shoaling of the lysocline (500 to >2,000 m). During the PETM surface pH only dropped from 7.54 to 7.48 and then rose to 7.62.
4 million years later during the EECO, pCO2 rose more sharply (1,900-3,500 μatm) and pH dropped more sharply (7.62-7.42) without a trace of shoaling of the lysocline.
In the PETM, there was a minor disruption of benthic foram’s. The arguably more “acidic” EECO does not appear to have affected marine calcifiers in any significant manner.
There’s nothing special about pH, apart from the fact that it is one of several factors which affect the carbonate saturation state.
If the PETM was an example of “ocean acidification,” were the periods before and after periods of “ocean alkaline-ification”?
In teresting that the highest pH seems to coincide with the big drop-off in temperature 14 million years ago when Antarctica froze up permanently. Presumably it has something to do with changes in thermohaline circulation.
Nick,
You said, “So it doesn’t matter that the oceans can’t “acidify” (pH 7). It’s just fussing about terminology.” OK, if it is just “fussing,” quit insisting the terms “OA,” and “more acidic” are reasonable, and make us pendants happy.
I’m looking forward to an answer about the periods of rising pH before and after the PETM. Are those episodes called “ocean alkaline-ification”? Or “ocean basic-ification”?
😎
Alkalify is a word; just not as commonly used in chemistry.
In the spirit of this thread, call it ocean lyeing.
+42… With a pH of 13, the word “lye” is just as honest as “acid” in the context of carbonate geochemistry. “Ocean lyeing” is an apt counterpoint to “ocean acidification.”
Acidification wasn’t commonly used in carbonate geochemistry prior to 2003.
Nick,
Something you seem to have overlooked: the link you provided defines “alkalify” as the process to alkalize. The definition from the same source defines “alkalize” as “to make or become alkaline.” That is, you start with something that is either acidic or neutral and make it alkaline.
From the same source, it defines “acidify” as “to make or become acid; convert into an acid.”
Thank you for the endorsed link.
I can’t see how the words acidify and alkalify could ever be used under the restrictions you want to invent. You can’t say adding acid is acidifying until the pH reaches 7, but after it does, you can’t then say it is acidifying because it is already acid.
Nick,
First of all, I’m not inventing anything. I’m quoting verbatim from the definitions at the link that you so kindly provided.
Because acidification is a process, one can have a target of 6.99, or 3.00. In the latter case, one dumps in enough acid to fly right by the point of neutrality. If, once achieving the target pH in the acid region of the pH scale, one were to add more acid, it would be appropriate to say the solution has been made more acidic.
Your reluctance to accept a standard definition from a link that you thought highly enough of to recommend speaks volumes about your cognitive bias. You recommend an authority, and then when it is pointed out it disagrees with your viewpoint, you are unhappy. I think that the word “petard’ has an application here.
The opposite of “acidifying” is “de-acidifying.” The question remains, how do you de-acidify something that isn’t acidic? That is clearly another issue with those who want to call a decrease in pH acidification. There is no logical provision for what to call an increase in pH when the pH lies in the alkaline region.
As I’ve suggested before, “de-alkalinization”.
Debasification might be misunderstood.
As a simple chemist I’d think that pH>7 is alkaline and pH<7 is acidic. pH 7.42 is hardly battery acid (~30% sulfuric acid, pH 0).
Also, I never drew statistical inferences from R-squares <0.8, certainly not 0.28 and <0.1 would be laughable.
As a sarcastic geologist, I wasn’t literally referring to a pH of 7.42 as “battery acid”… Because that would mean that my swimming pool is only 0.18 pH units above battery acid.
I was hoping the Ghostbusters quote & clip would have obviated the need for a /Sarc tag… 😉
Good article, not sure I ever heard of lysocline, but makes sense in a sense, lyso- suggesting that it might be sharper than other ocean clines. Shoaling is a common term to those of us who have been there and done that, although often with firmer bottoms more familiar to a geologist. It has several meanings, in the ocean, less deep is obvious. Shotgun graphs even with trend lines used to be suspicious. I would especially argue that word distinctions of importance are not semantics. OA as a term needs to be made extinct. I am waiting for someone to discover Eh.
If anyone has a copy of Lippson and Lippson. Life in the Chesapeake Bay, it has on page 69 (1994 printing) a drawing of “Burrowing clams and amphipods.” Soft-shell clam was shown as the deepest. I worked in the Chesapeake and while I can’t lay my hands on any data, I am certain that this clam deals with very difficult pH’s and Eh’s and other despicable measures. With their long siphon they are safer in the mud despite its drawbacks.
The 1998 paper on soft clams by Strasser was hilarious in light of the findings in the Ries experiment.
David
Outstanding!
Thank you for the considerable and careful work to create this review. Only reference 8 can possibly be criticized as not being from the anointed peer-reviewed science literature.
I especially appreciate your statement: “So… Chicken Little of the Sea will pretty well only be an issue, where it is already an issue… mostly in areas of strong upwelling.” Accurate and succinct summation IMHO.
Actually, there is evidence that organisms living in regions of strong, constant upwelling have made a trade-off between abundant food and environmentally challenging conditions, and have made adaptations to large, rapid pH changes. The only thing that seems difficult for them to deal with is anoxia.
The Monterey Bay Aquarium has a website where they present the results of constant monitoring of upwelling water from the Menterey Bay Canyon. It is interesting how frequently and how quickly large excursions in pH occur there.
“Shoaling of the Lysocline”
Right up there with the classic from Optics:
“The locus of the focus is the point of least confusion.”
Bob Hoye
Ive posted on other threads pictures of redwood chunks from the 300m level in the Ekati Diamond mine dated at 53 mybp. This mine is around the Arctic Circle in Northwest Territories essentially near a similar latitude at the time of encapsulation of the fossil. It is wood and seams of sugary textured sap are preserved. The wood is even red. The eruption obviously blasted into the middle of a redwood forest and the debris fell back into the crater.
Kimberlites originate below the diamond stability field and the magma actually samples the diamond field at a depth of 150+ km incorporating them in the lava as it passes through. It accelerates once it breaches the base of the crust and reaches ~1200km/hr at the surface throwing crater rocks and trees up above the clouds then falling back refilling the crater.
Google redwood chunks in Ekati diamond mine. Anyway, a California climate in the Arctic! Hows that for real unprecedented global warming!
As a matter of fact Sequoia grew as far north as there was land during this interval, and not only that, there were oaks, ginkgo trees, plane trees, cypresses, alligators, turtles, gars, bowfins, and a wide variety of mammals including primitive primates living at 80 degrees north. The Arctic Ocean was nearly fresh at times and filled with floating Azolla (mosquito fern):
http://www.lmd.jussieu.fr/~fcodron/COURS/papiers/Eberle%20-%20Geological%20Society%20Of%20America%20Bulletin%202012.pdf
David Middleton:
The link to the Lourens et al., 2005 paper points to your C:\ drive, not to a page on the Internet. Other than that, no quibbles.
Not only that… But the link didn’t even work for me…
Fixed!
Educational, enlightening, and entertaining as usual. Thank you David!
You had to bring up “Steamers” and now I am hungry……
Ammonoid and belemnite cephalopods were wiped out during the end Cretaceous MEE, while other shellfish survived. This has been attributed to their predominantly aragonite construction, but other cephalopods also use that morph of calcium carbonate. It probably has to do with the depth at which they lived.
Nautiloids for instance came through the MEE, despite their shells also being of aragonite. However they use calcite for other parts. Among cephalopods, ammonoids are more closely related to coleoids, ie octopuses, squid and cuttlefish, than to nautiloids. Coleoids have internalized their aragonite “shells”, such as the “cuttlebone”.
The Jurassic Coast of England is rich in ammonoid fossils. Mary “She sells seashells by the seashore” Anning made her living collecting these and other Mesozoic fossils in the early 19th century. Her discoveries of marine reptiles helped to convince scientists such as Thomas Jefferson that extinction, first proposed by Georges Cuvier in 1798 based upon mammoth teeth, was real.
The apparent “extinction” of benthic forams during the PETM is more properly an instance of extirpation, ie the local disappearance of a group. As you note, they simply moved to areas of more clement conditions.
Their reappearance after the PETM in the Alamedilla section of Southern Spain is a pretty good clue… 😉
IIRC, the shell in Royal Dutch Shell had something with a seashell business.
That ammonites and belemnites became extinct while nautiloids survived is more likely due to their different modes of breeding. Ammonites and belemnites had small eggs that hatched quickly while nautiloid eggs are large and hatch only after 8-12 months. Probably all adult ammonites, belemnites and nautiloids and hatchling belemnites and ammonites died during the dark interval immediately after Chicxulub when primary production ceased in the ocean and pelagic food webs crashed, but by the time the last nautiloid eggs hatched things had recovered enough for some of the hatchlings to survive.
“The most likely explanation is the formation of the North Atlantic Igneous Province.”
Quite possible, but nobody really knows what happened. There are at least seven theories:
Cometary impact
Methane clathrate dissolution
Large-scale peat fires
Oxidation of organics-rich sediment exposed by regression
Ocean overturn
Permafrost melting in East Antarctica
Volcanic action in the North Atlantic Igneous Province, possibly reinforced by erupting through organics-rich sediments.
There are problems with all the theories. One is that in the best profiles it seems that temperatures start rising first, and the d13C change comes slightly later. Another is that there was a couple of “smaller PETM:s” later in the Eocene, and as you note they seem to be Milankovich-paced. It is notable that while there have been sudden drops in temperature during the Paleogene and Neogene, short sharp rises, like the PETM and its smaller “siblings” only seem to occur when the basic climate is already very warm.
The NAIP could have triggered significant methane clathrate dissolution. Fascinating stuff… We don’t even know what we don’t know about the early Cenozoic.
Yet, the common refrain is that the PETM was all GHG-forcing and a direct analogy to modern climate change.
For the Eocene, this CO2-related event has also been blamed for a temperature spike:
https://en.wikipedia.org/wiki/Azolla_event
The difficulty with that theory is that there was neither a temperature spike or a temperature drop at that time (49 mya).
tty,
Or various combinations of the above. There seems to be a tendency to want to settle on a single cause, even when there are several hypotheses that are not mutually exclusive.
Particularly when one hypothesis opens a pathway to regulatory malfeasance.
Joe Dirt could be a consultant to scientists hyperventilating about polar bears, caribou penguins and even coral.
Joe Dirt rocks!
Thank you, in Holland Appy Sluijs was the preacher of doom of the PETM event. You confirm that the only victims were deepsea critters dwelling on the cold ocean bottom.
David,
Let it not be said that you are a man of few words. 🙂
If not for the pictures each telling a thousand words… I’d still be typing this… 🙂
Don’t sell yourself short. Some of those pictures were worth 10,000 words! 🙂
Already wrote to the “Smithsonian” referring myths:
Atlantis was probably a real place: the first place to reach a Punic merchant fleet on the way to the Tin Islands.
Immediately after driving through the “Pillars of Hercules” = the Strait of Gibraltar.
This place is called Lisbon today.
The golden roofs were probably simply covered with golden shimmering red tiles.
And this “Atlantis” is likely to have “perished” because the following merchant fleets did not need the detour, they were driving the direct route to the Tin Islands, today’s UK.
___________________________________________________
And yes, your however interesting article is bloody long: not my mileage.
Thanks anyway -Hans