Guest essay by Michael Wallace, Hydrologist
Until transparency improves across the board, I’m motivated to routinely compare the skill of my multi-year hydroclimate forecasts to those of others where possible. One of my favorite study and forecast areas is centered above the Southern Rocky Mountains (SRM). The SRM hydroclimatology is also explored and forecast by the more widely known and federally funded West-Wide Climate Assessment (WWCA). The WWCA is the scientific establishment’s key reference to document past climate swings and predict ongoing climate change in the Western US (Overpeck et al., 2013). Those assessments draw upon a series of computer simulations commonly known as CMIP-VIC runs. I profile three of their sample sets in Figure 1. For each stream or region they select, the WWCA authors produce multiple runs that give the ensemble of simulated streamflow records a spaghetti-like quality.

Figure 1. Spaghetti plots from revisions of the West-Wide Climate Assessments. Top. [Overpeck et al., 2013, Cayan et al., 2013, Garfin et al., 2013]. Middle and Bottom [US Bureau of Reclamation, 2011].
Spaghetti plots can sometimes add value in exploring uncertainty. By developing ensembles of runs which abide by a common skill performance standard, and then extending those runs into the future, analysts hope to capture a better sense of the ranges of future possibilities. But one can’t just throw gooey pasta around at random. Much attention is dedicated to ensure compliance of each individual simulation with standards and data. Typically, all simulations must be transparently comparable to, and consistent with the most important observations. Krause et al., 2005 is a good place to start for further context on history matching guidance and practices in modeling for the hydrological sciences.
Given the clear mandate, and my desire to explore the performance of the WWCA runs more fully, I’ve put in some time to produce the few observational overlays included in Figure 1. I followed with Figure 2 to help categorize the clusters of modeling error associated with samples of the WWCA simulations along with some of my own. I think at this log linear scale that only two skill categories are evident; poor and not-poor.

Figure 2. Performance chart for selected SRM streamflow hindcast and forecast skill.
If the WWCA models comprise the spaghetti, then my ARMA and CRMA hindcasts and forecasts must be the breadsticks. Did I mention that my alternative-conceptual-model forecast residuals appear to hug the zero error line in this plot more significantly than the muddy and ruddy WWCA spaghetti error swarms? Unlike WWCA noodles, I don’t serve too many of them for any given meal or streamflow forecast. Besides being nominally crunchier ha ha, my simulations are more inspired by solar and moisture circulation connections and the somewhat unique positioning of the SRM as a recipient of this energy and moisture abundance. (Wallace 2018 a,b). Moreover as the following animation of Figure 3 appears to confirm, there might be no region on the planet more hydrologically sensitive to solar cycles and Pacific moisture and temperature than the SRM. Many lines of accepted evidence already confirm for example that the Pacific Decadal Oscillation (PDO) and the precipitation across the Western US are related (Mantua, 2002). USGS authors in particular are among the first to apply statistical hydrology methods to evaluate the compelling relation of the Navajo River in Southern Colorado to the PDO for a 4 year moving average (Falk et al. 2013). One later US Fish and Wildlife Service publication (US Dept. of Interior 2016) also cites a related white paper of mine on these connections [Wallace 2014].

Figure 3. Animation “Temperature.gif” Vertically integrated Temperature across the western hemisphere over 5 year averages, 1985 to 2014. (Source UCAR ERAI data)
The open blue rectangle overlying the SRM region can be seen in each animation frame. The top left dot within that rectangle represents the Animas River. The top right dot represents the Pecos River near Pecos, and the lower dot in that box represents the Gila River. The animation sequences a 5 year trailing average (5yta) of Temperature for the full atmosphere. It is calculated for midnight of New Years Eve every 5 years starting from 1985 and approaching the current time. The animation also points to some of the reasons that these CRMA and ARMA hydrological forecasts can be so promising. As suggested earlier, the pulses of lower temperature across the SRM for the 1985 and 1995 periods of the animation seem to correspond to pulses of higher moisture there, as well as to a somewhat synchronous PDO index.
Figures 4 and 5 document some related monthly beaded abaci styled time series profiles. They appear to confirm a range of similar time series behavior between the PDO and two SRM streams. I chose the Green River as a proxy for the Upper Colorado River Basin and the Gila source is likely identical to that utilized by the WWCA resource. These abaci are useful but otherwise unremarkable and basically capture what any nanohydroclimatologist knows from common quantum bead-stacking of natural energy signatures.

Figure 4. a. PDO Monthly Accumulation b. Cumulative monthly flows at Green River near Green River, UT

Figure 5. a. PDO Monthly Accumulation b. Cumulative monthly flows at Gila River near Gila, NM
By accounting for additional conditions such as reservoir storage operations and by exploiting various moving averages along with the lags which are sometimes observed between the PDO and some SRM streams, I was able to hopefully complement the state of the art through application of Cross Regression Moving Average (CRMA) methods to produce modestly more accurate streamflow forecasts starting in 2014 (Wallace, 2014). I eventually diverted from the PDO in favor of ocean related drivers that seemed to offer better correlations to SRM streamflows with some longer lags, at shorter moving averages. By 2015 I was fully engaged in advancing a decadal scaled solar regression concept to extend SRM hydroclimate forecasts further in time, with more robust granularity, and with better accuracy and transparency. I continue to work to advance in accuracy through CRMA and Autoregression Moving Average (ARMA) methods [Wallace 2017 b, 2018 a,b].
In contrast to a CRMA conceptual and data based model of atmospheric moisture and temperature variation over time and across the SRM, the WWCA documents assert that rising temperatures across the Western US are now indicated through observations of an early Spring [Overpeck et al., 2013]. That can’t be reconciled with the preceding animation, but in any case the WWCA appears to indicate that this can also be identified by a relative reduction in the amplitude of stream flows in the months of May and June and a relative increase over the months of March and April. I’ve developed Figure 6 in part to explore this through a featured time series of another Upper Colorado River Basin tributary, the Animas River at Farmington, New Mexico. I feel the work could help to confirm if the flows in May and June have been following the WWCA script or whether those flows are more in tune with the alternate conceptual model that I study.

Figure 6. Streamflows of the Animas River over time.
The Animas is a signature stream which captures many features seemingly common to all of the dozens of streams of the SRM complex that I have examined [Wallace 2016b, 2017b]. Among other things, it was interesting to me that that Animas and the Sun had such similar time cycles (Wallace 2017a). Accordingly I decided to produce an ARMA forecast for a 5 year average of the Animas 11 years in advance. A mildly truncated depiction of this forecast exercise is shown at the lower panel of Figure 6. This Animas forecast exercise is also captured in Figure 2, as the white diamond series. This was purely an exercise of a lagged autocorrelation. I can’t take much credit if it turns out to be right but you also will get what you paid for if it doesn’t, ha ha.
It is helpful in that context to keep in mind that Figure 2 and its evaluations happen to lump training and actual forecasts together. Most of the results profiled in that figure are hindcasts, which are roughly synonymous with training forecasts. The CMIP-VIC model simulations of past history are informed in part by that prior knowledge. The ARMA and CRMA simulations are informed by the full regression history used. In addition there are a few actual CRMA forecasts in this chart. For the CMIP-VIC runs, these are any results after 2011 (or possibly somewhat earlier in context).
As noted, the Pecos and the Animas are identified by the two upper blue dots in the blue box signifying the SRM region. I began to prototype a solar based CRMA forecast of these specific streams in 2016 (Wallace 2016a) as detailed for the Pecos by the open green circles in Figure 2 and the open blue and open magenta circles in Figure 7. Figure 8 includes the updated green observation line segment. I think the performance verdict might be that the cyclic trend was more or less accurately anticipated, although I might be biased. In any case a lag adjustment in my adaptive system may be in order for next year.

Figure 7. CRMA based hindcasts and forecasts for the Pecos River near Pecos, New Mexico (PnP), made in 2016.

Figure 8. Update of Figure 7 after two years.
In support of Wallace 2018a, I’ve included charts such as Attachment A which document some exercises to classify the goodness of fit of this and other related forecasts. Those include Pearson’s, Chi2, RMSE and Kolmogorov Smirnov tests. There are many others that could be explored, including the Nash Sutcliffe technique favored by many hydrologists and featured in the Krause et al. paper. The work to date begins to map the correlations across the SRM region that may aid in improved hydrclimatologic forecasting.
Figure 9 includes a final featured ARMA forecast which focuses on a stream of the South Platte near Denver, Colorado. The Cache La Poudre river exercise is not the most accurate as demonstrated in Figure 2 by the white rectangular boxes, but it may be the most skillful. That’s because it addresses a more finely scaled average and predicts over a longer span (15 years) than any of the other ARMA or CRMA forecasts. Moreover, the economic value of water along the Front Range of Colorado is impressively high at this time. Given the punctuated nature of pluvials (relatively wet periods) for that stream system, a forecast such as this prototype might point the way to higher resolution and more skillful drought forecasting.
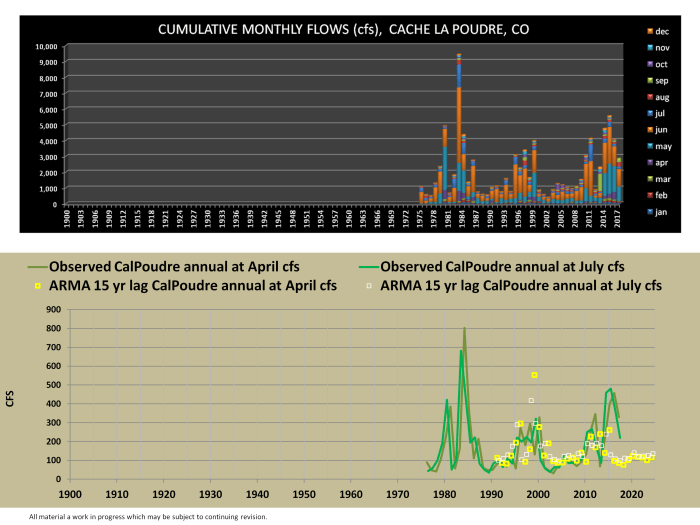
Figure 9. Streamflows of the Cache La Poudre River over time.
Or it may not. At least these forecasts are transparently evaluated through resources such as Figure 2 and that alone should likely aid in more informed decision making. Overall the long term work in progress is to develop better forecasts which peer further into the future. Figure 10 shows the same forecast error chart but in a new vertical log axis space. It is apparent that most forecasts do not achieve accuracies much better than 85% (a 15% error). Over time any brave forecasts can be added to chart relative progress of hopefully the state of the art, forwards or backward. One can sometimes tell that progress is backward when the results migrate further vertically away from the horizontal axis.
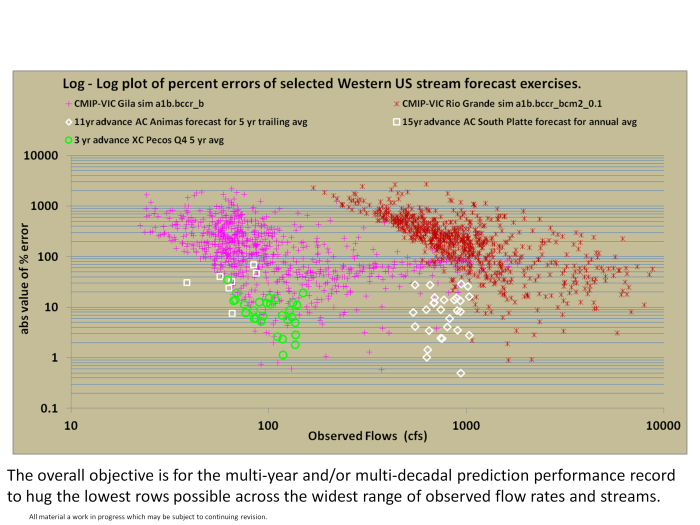
Figure 10. Performance chart for selected SRM streamflow hindcast and forecast skill Log-Log scale.
I’m reminded by Figure 10 of some past work on ocean pH data which I now illustrate in Figure 11. Both Figures 10 and 11 represent cases where actual observations appear to be graphically overwhelmed by diffuse and ruddy swarms of non reproducible simulations and data. I think the case of Figure 11 is exemplary of the ocean pH and acidifcation promotions pioneered by contemporary marine scientists which I have challenged in the past.

Figure 11. Total pH for SE Pacific Ocean quadrant; NOAA WOD and PACIFICA sources.
Speaking as a fledgling nanohydroclimatologist, by virtue of the Gibbs Free Energy ladder, Ocean pH is every bit as important a part of the hydrosphere as anything could ever be. For example the Nernst equation appears to be as crucial to the internal energy of the ocean as the ideal gas law is to the internal energy of the atmosphere. Given the reproducibility of the data and models associated with planetary equilibrium geochemistry, I can’t understand why marine scientists continue to disrespect the SHE (Standard Hydrogen Electrode). They have turned their heads from the beautifully natural green potentiometric ocean pH readings such as those profiled in part at Figure 11. I can hardly believe it, because to me those emerald curves appear to be consistent with everything, including carbonate chemistry of the oceans of the Southern Hemisphere as well as the PDO and the streams of the SRM. But the red PACIFICA calculations appear to graphically overwhelm them on a par with the ruddy and muddy spaghetti streamflow simulations from the WWCA.
In summary I’ve pointed to some reigning accurate and skilled hydroclimatology forecasts. I’ve also surveyed some of the vast WCCA and PACIFICA simulation and data results. It took some work that I didn’t anticipate because the WCCA and PACIFICA reports didn’t appear to follow the recommendations of Krause et al. (2005). I certainly encourage all scientists and engineers to consider Krause’s guidelines to apply a greater focus on performance transparency moving forward throughout every aspect of hydroclimatology. I think a slavish approach to that will help to filter out the poorest performing forecasts for a savings benefit to all.
References:
Cayan, D., M. Tyree, K. E. Kunkel, C. Castro, A. Gershunov, J. Barsugli, A. J. Ray, J. Overpeck, M. Anderson, J. Russell, B. Rajagopalan, I. Rangwala, and P. Duffy. 2013. “Future Climate: Projected Average.” In Assessment of Climate Change in the Southwest United States: A Report Prepared for the National Climate Assessment, edited by G. Garfin, A. Jardine, R. Merideth, M. Black, and S. LeRoy, 101–125. A report by the Southwest Climate Alliance. Washington, DC: Island Press
Falk, S.A., S.K. Anderholm, and K.A. Hafich, 2013, Water Quality, Streamflow Conditions, and Annual Flow-Duration Curves for Streams of the San Juan–Chama Project, Southern Colorado and Northern New Mexico, 1935–2010. Scientific Investigations Report 2013–5005. U.S. Department of the Interior, U.S. Geological Survey
Garfin, G., A. Jardine, R. Merideth, M. Black, and S. LeRoy, eds. 2013. Assessment of Climate Change in the Southwest United States: A Report Prepared for the National Climate Assessment. A report by the Southwest Climate Alliance. Washington, DC: Island Press. http://www.swcarr.arizona.edu/sites/all/themes/files/SW-NCA-color-FINALweb.pdf
Krause, P., D.P. Boyle, and F. Bäse, 2005, Comparison of difference efficiency criteria for hydrological model assessment
Mantua, N.J. and S.R. Hare, 2002, The Pacific Decadal Oscillation. Journal of Oceanography, Vol. 58, pp. 35-44 2002
Overpeck, J., G. Garfin, A. Jardine, D. E. Busch, D. Cayan, M. Dettinger, E. Fleishman, A. Gershunov, G. MacDonald, K. T. Redmond, W. R. Travis, and B. Udall. 2013. “Summary for Decision Makers.” In Assessment of Climate Change in the Southwest United States: A Report Prepared for the National Climate Assessment, edited by G. Garfin, A. Jardine, R. Merideth, M. Black, and S. LeRoy, 1–20. A report by the Southwest Climate Alliance. Washington, DC: Island Press.
US Bureau of Reclamation, 2011, West-Wide Climate Risk Assessments: Bias-Corrected and Spatially Downscaled Surface Water Projections Technical Memorandum No. 86-68210-2011-01 Review and contributions in alphabetical order: Pamela S. Adams, Bureau of Reclamation Donald M. Anderson, Bureau of Reclamation Jeff Arnold, U.S. Army Corps of Engineers Levi D. Brekke, Bureau of Reclamation Martyn P. Clark, National Center for Atmospheric Research Jennifer E. Cuhaciyan, Bureau of Reclamation Patrick J. Erger, Bureau of Reclamation Timothy R. Green, U.S. Department of Agriculture, Agricultural Research Service Ethan Gutmann, National Center for Atmospheric Research Lauren E. Hay, U.S. Geological Survey Shih-Chieh Kao, Oak Ridge National Laboratories Dagmar K. Llewellyn, Bureau of Reclamation Gregory T. Pederson, U.S. Geological Survey James R. Prairie, Bureau of Reclamation Eric L. Rothwell, Bureau of Reclamation Noe I. Santos, Bureau of Reclamation Andy W. Wood, National Center for Atmospheric Research Christopher P. Weaver, U.S. Global Change Research Program
US Department of the Interior 2016 “Final Biological and Conference Opinion for Bureau of Reclamation, Bureau of Indian Affairs, and Non-Federal Water Management and Maintenance Activities on the Middle Rio Grande, New Mexico” Fish and Wildlife Service https://www.fws.gov/southwest/es/newmexico/ at file https://www.fws.gov/southwest/es/newmexico/documents/BO/2013-0033_MRG_BiOp_Final.pdf
Wallace, M.G., 2014 The Relative Impact of the Pacific Decadal Oscillation Upon the Hydrology of the Upper Rio Grande and Adjacent Watersheds in the Southwestern United States This is a white paper at www.academia.edu
Wallace, M.G., 2016a, Ocean and Solar Based Climate Forecasts, invited presentation to Thirtieth Annual Rio Grande Basin Snowmelt Runoff Forecast Meeting, interagency annual climate meeting sponsored by United States Department of Agriculture Natural Resources Conservation Service (USDA NRCS) with SNOTEL features. Albuquerque, NM April 12th, 2016
Wallace, M.G., 2016b, “Solar and Ocean based Hydrologic Forecasts for the Animas River Leading to the end of 2022” ENVIRONMENTAL CONDITIONS OF THE ANIMAS AND SAN JUAN WATERSHEDS WITH EMPHASIS ON GOLD KING MINE AND OTHER MINE WASTE ISSUES May 17-19, 2016 San Juan College, Farmington, NM Sponsored by the New Mexico Water Resources Research Institute http://animas.wrri.nmsu.edu/ to be integrated into a proceedings publication in 2019
Wallace, Michael 2017 a, web post: The Persistence of the Sun Upon Climatic Variations
Wallace, M.G., 2017b, Session Moderator and Presenter “New Solar Based Moisture and Temperature Forecasts in the Western US”, Annual Symposium of the Arizona Hydrological Society, Flagstaff Arizona (September 8)
Wallace, M. 2018a Application of Newly Identified Solar-Atmospheric Connections Towards Improved Forecasts Of Streamflows In The Western US. currently under peer review at the Hydrological Sciences Journal.
Wallace, M. 2018b SOLAR CYCLES AND THE HYDROSPHERE: APPLICATIONS TOWARDS IMPROVED CLIMATE FORECASTING Formal Dissertation Proposal Spring Semester, Department of Nanoscience and Microsystems, University of New Mexico
Data Sources
PDO Source: http://research.jisao.washington.edu/pdo/PDO.latest
ENSO Source: http://www.cpc.ncep.noaa.gov/products/analysis_monitoring/ensostuff/ensoyears.shtml
Pecos River near Pecos (PnP) Source: USGS 2014a 08313000, Rio Grande At Otowi Bridge, NM accessed online at http://www.usgs.gov/water/
Animas River streamflow record source: USGS 09364500 Animas River at Farmington, NM accessed online at http://www.usgs.gov/water/
Gila River streamflow record source: USGS 09430500 Gila River near Gila, NM accessed online at http://www.usgs.gov/water/
UCAR Source: http://www.cgd.ucar.edu/cas/catalog/newbudgets/index.html#ERBEFs files ‘ERAI.LEDIV.1979-2014.nc
PACIFICA ocean pH source: http://cdiac.ornl.gov/oceans/PACIFICA/ndp092.html
Attachment A. Excerpt from Wallace 2018a goodness of fit analyses for selected SRM streams and projections

Hi Michael. Thanks for this facinating insight into hydrologic forcasting.
.
.
I am a little surprised that the WWCA does not try different techniques when the ones they use give over 100% error.
.
.
Looking at figure 8 what I Come Away with is there was a regime change from 1995 at approximately 120 CFS to a new regime in 2005 at approximately 80 CFS.
.
.
And figure 6 Stream flow for the Animas River shows it is heading for a long drought spell.
.
.
Sandy, Minister of Future
That’s approximately when the AMO went positive.
Thanks Sandy, yes it seems that way. But this is only based on an AC exercise. Even so, there is some additional evidence for the persistence of that kind of cycle in that region I think.
Instead of making the issue so complicated, is it not possible to get more simple presentation of rainfall and then associated water flows. I did it in the case of Krishna River in India with 132 year cycle. Also 60 year cycle in all-India southwest monsoon rainfall with frequency of occurrence of floods in northwestern India rivers.
Dr. S. Jeevananda Reddy
There is some opinion that simpler models are better. link If your objective is to understand what’s going on, complicated models are not your friend.
Thanks Dr S.J. Reddy,
I’ll calibrate between these simplicity comments and the ones from my journal submission review. I think that means we are likely on the same page. After the southern Rocky Mountains SRM, the Himalaya catchments and the monsoons sweeping across your research areas are important for me to understand and to cite as well as I can. And the Andes. So I’ll look into your papers and you are free to contact me offline to explore common areas of mutual research interest. Mike Wallace
The seasonal change in the altitude of the Sun is predictable. The cooling rate during the long night in the Arctic is mostly predictable. The oscillations of the oceans are cyclical and somewhat predictable. These are large factors which result in the longwave pattern which results in relatively wet and dry years. I don’t envy people trying to predict droughts. It’s not like you can look at the drought coming from the other side of the planet and just approximate whether it will be intense or it will completely dissipate before it gets here.
I am on the same page so far except I think that the anticipation of hydroclamotologic conditions such as droughts and fluvials, years in advance are perhaps on the horizon. A focus upon geostrophic scales and simple and largely accurate streamflow integration time series, appears to allow for potential to more skillfully track, and predict yearly and decadal scaled atmospheric moisture and heat at least in high altitude catchments of middle latitudes. The general residence times of atmospheric moisture are crucial along with the other circulations of the hydrosphere.
If precipitable water below 700 mbs can be predicted a year or more in advance that is exciting news indeed.
There is plenty of room for additional perceptive researchers to add even more value and I hope you give that option some thought. Not much money for now but perhaps after Overpeck and the other Overlords are Overthrown, we can return to a level playing field where the most competent approaches dominate.
That last was a joke ha ha. But I do encourage Overpeck and the other Overlords to consider for all future work the Krause et al. 2005 example along with the performance charts featured here.
I was going to make the same comment. Streamflow is ultimately what matters most, and is probably the only possible serious consequence of climate change, but rainfall is the key link to climatology, possibly also the evaporation rate. There is much AGW propaganda being promulgated based on reductions in streamflow, such as at Perth Australia, but most of that is probably due to non-climatic changes.
Thanks again Dr. Reddy, I’m reading your papers with great interest!
Thank you.
Unfortunately, the only skills one needs regarding climate change these days are the skills to manipulate the media into panic mode so that people (the majority of whom actual revel in their innumeracy) will vote for even less-educated people so we can all be saved from what could possibly be rounding errors or at worst a minute change in historical measurements.
There does appear to be a lot of gibberish in this post. For example:
“These abaci are useful but otherwise unremarkable and basically capture what any nanohydroclimatologist knows from common quantum bead-stacking of natural energy signatures.”
or
“Speaking as a fledgling nanohydroclimatologist, by virtue of the Gibbs Free Energy ladder, …”
Typing “nanohydroclimatologist” and “Gibbs Free Energy ladder” reveals precisely one hit each,
which is of no help in trying to understand what the author is trying to say.
Sorry, I am a nanoscientist who focuses on hydroclimatology, and the ladder analogy to Gibbs Free Energy works for me every time. But I should have tried to conform more to conventions. The important part is that the authoritative West-Wide Climate Assessment is based on climate models that are unhinged from reality. That makes the Assessment unhinged as well.
And can you explain “quantum bead-stacking”, “natural energy signatures” and what the
ladder analogy is?
Would love to. I have already run some of this by my nanoscience peers and one of my Committee members who is a quantum chemist.
When/if that member is satisfied with these notions then I can advance a little bit more. In the meantime I also appear to have a relevant paper on track for publication in a great journal.
I, like Percy Jackson, have interest in your posting here at WUWT. You can’t answer his questions???
You got too many secrets for a discussion? Why did you even post here if there are so many things you can’t even discuss on a site built around discussion?
I think my considerable time spent reading your post could have been better spent pruning the rose bush or petting the dog.
I hope something you read so far was worthwhile. If you don’t trust my work or my sometimes idiotic sounding delivery (and my apologies for that), please trust in Krause et al.
I can start to address the quantum side if you are in a hurry to learn more. My solar cycle forcing Ph.D. research is inspired by fluorescence and the quantum dot. The wave equations and the energy levels which can be interpreted for simple IR or other spectroscopy may have some interesting analogues in the hydrosphere. It’s a part of my dissertation. I’m prone to improvise when I write but really I do believe that a streamflow hydrograph records quanta of energy. In fact, every hydrologist knows that hydraulic head IS potential energy.
Mike – there is no way that a streamflow hydrograph could ever record quanta of energy. The only possible quanta of energy would be adding one single water molecule to the stream and there is no way that any hydrograph could ever measure such a small change. I don’t know what the minimum observable change in streamflow is but it is almost certainly on the order of moles of water molecules not individual ones.
And for the record the rest of your paragraph appears to make no sense at all. Can you explain what solar cycles have to do with quantum dots?
Think of customary parcels of the atmosphere, in context of heat and or mass transport. They are quantums of a continuous medium. Are you a scientist or a student Percy? I only ask to know how to respond and how much to go into. I’m a student and a scientist and so I am not judging at all.
Hi Michael. Re your 18 jun 2017 post here, have you made other posts discussing the global atmospheric conveyor-belt and possibly conveyed Blobs of high humidity air to change the surface energy balance?
.
.
Also you mentioned four subtropical gyres and I only found two over the Gulf of Mexico and Westpac Philippines.
.
.
Sandy, Minister of Future
Thanks and yes Sandy I have many posts both here at WUWT and at my own site about most of those topics. Did you look on the other side of the planet i.e. the Southern Hemisphere for the missing gyres?
Hi Mike. Thanks for the clue. I read most of the postson your current page, about 9. The clue there was also Westpac Capricorn Geyer and West Atlantic Capricorn Geyer. The Tropic of Capricorn is 23.5 South, Tropic of Cancer is 23.5 North. So perhaps you meant West cancer geyer. The West Atlantic Capricorn geyer seems to straddle South America. The analysis of volcano eruptions sounds valid.
.
.
In the 9 recent post I read and this post and the one from last year I only found intriguing hints about an atmospheric conveyor that might be Globe circling, transferring latent heat energy and moisture. So if you have some others specifically you could name I would appreciate it if they are not Secret. I understand you might not want to disclose something you’re getting ready to publish.
.
.
Sandy, Minister of Future
Many Thanks. I sometimes am able to telegraph my preliminary climate change findings to the underground through this portal somewhat tongue in cheek:
http://wallacemichael.tumblr.com/
I have no wish to keep anything secret though, and I’ve disclosed the things any scientist should be asked as I process through my dissertation committee at the University of New Mexico.
Some food for thought:
Global warming (alias “climate change”) was ended by the Montreal Protocol.
It is, by now, understood that rapidly and steadily rising atmospheric CO2 can not be responsible for the highly irregular global temperature record of the past 50 years, during which the only clearly identifiable episode of global warming took place within the 24-year interval from 1975 to 1998.
It is equally evident, from new research, that the forcing agent responsible for the sudden rise in temperature from 1975 to 1998 is monatomic chlorine, photodissociated from anthropogenic CFCs on polar stratospheric clouds, thinning the ozone layer and admitting increased irradiation of Earth’s surface by intense solar ultraviolet-B radiation that would otherwise be engaged in the destruction of ozone.
This is still happening, despite the Montreal Protocol, and will continue to cause elevated temperatures throughout most of the present century because the ozone destruction reaction with chlorine is catalytic and because both CFCs and chlorine have long residence times in the atmosphere. Further global warming, however, will not occur.
Should this interest you further, I would be happy to send you references to research into this important matter.