From the “EPA models are always accurate” department comes this bit of good news.
The air we breathe today in the United States is much cleaner than it was in the 1960s and 70s. But recent satellite data show that air quality is not improving as quickly as predicted by models.
“Air quality is better than it was decades ago, but now we’re starting to see the improvement slow down,” said Helen Worden, atmospheric scientist at the National Center for Atmospheric Research.
In a recent study supported by NASA, lead author Zhe Jiang, Worden, and a group of researchers used satellite data and advanced computer simulations to find that major air pollutants are not decreasing as rapidly as expected. That is, air quality is not improving as much as the U.S. Environmental Protection Agency’s (EPA) inventories and computer models indicate they should.
The team looked at two major air pollutants: carbon monoxide and nitrogen oxide (NOx). Both are emitted by cars, trucks, and other vehicles, and by industrial sources such as power plants. In the presence of sunlight, both chemical compounds are key ingredients in ground-level ozone and smog.
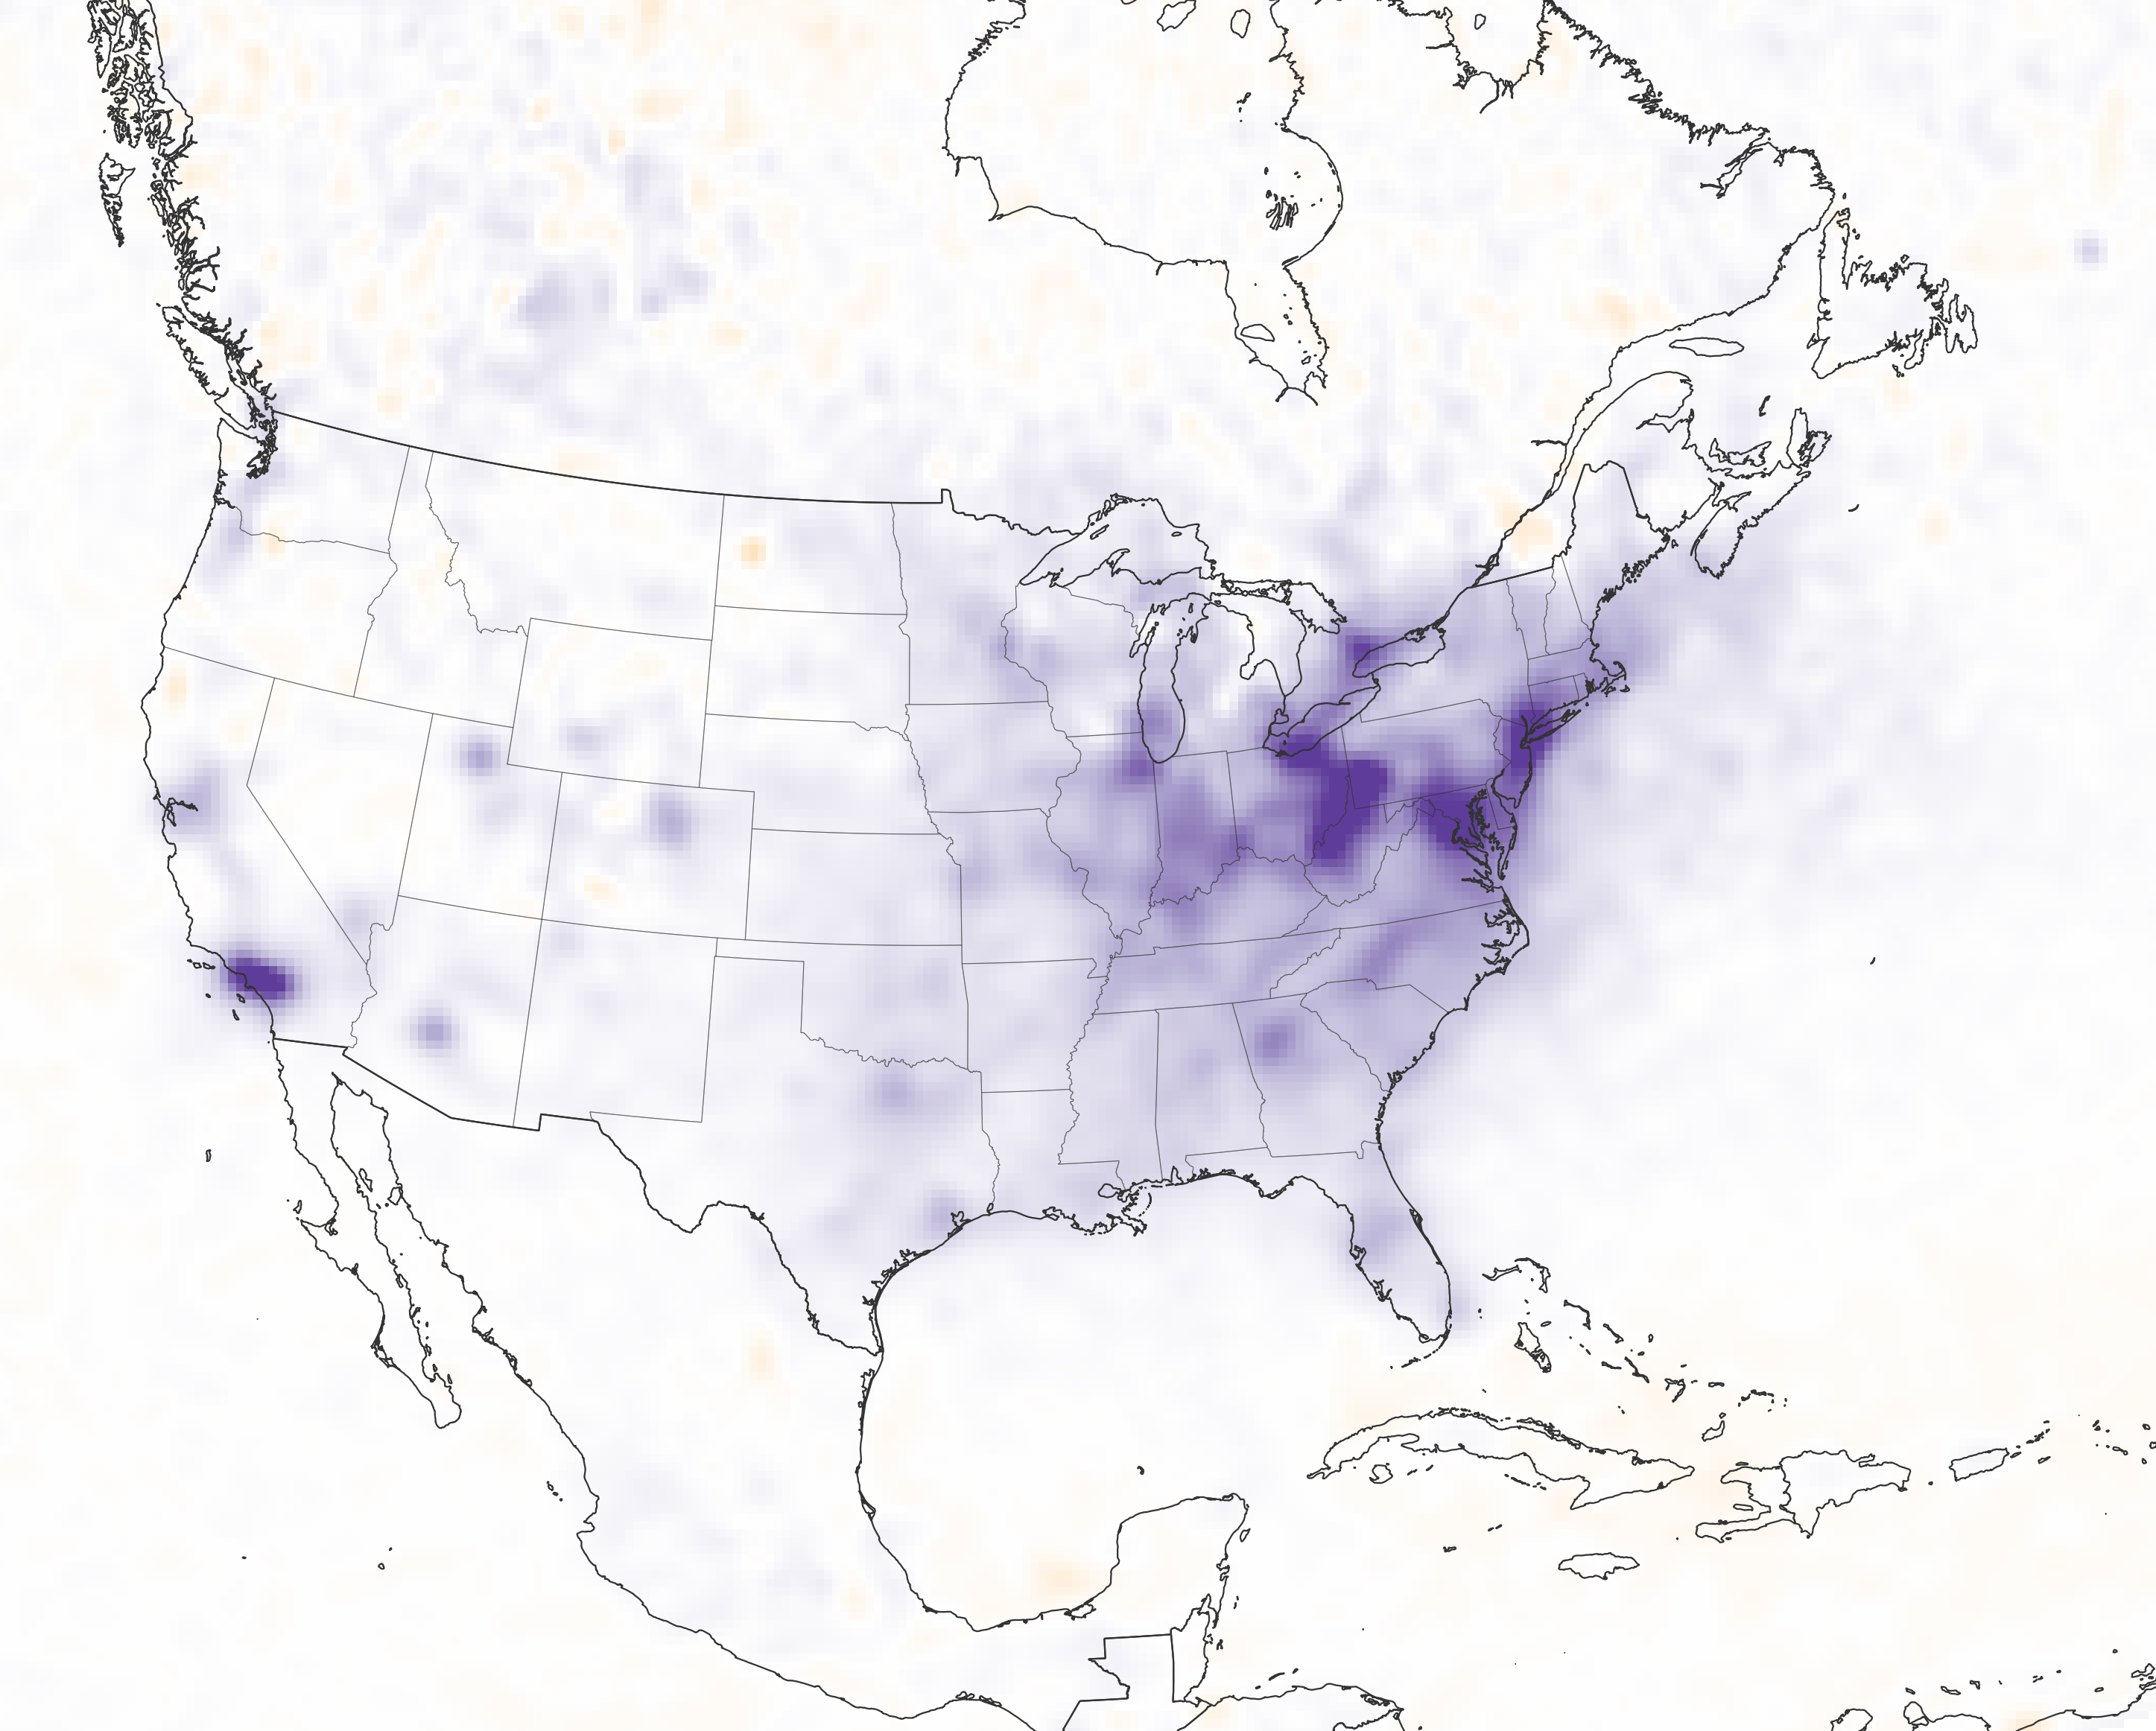
BEFORE

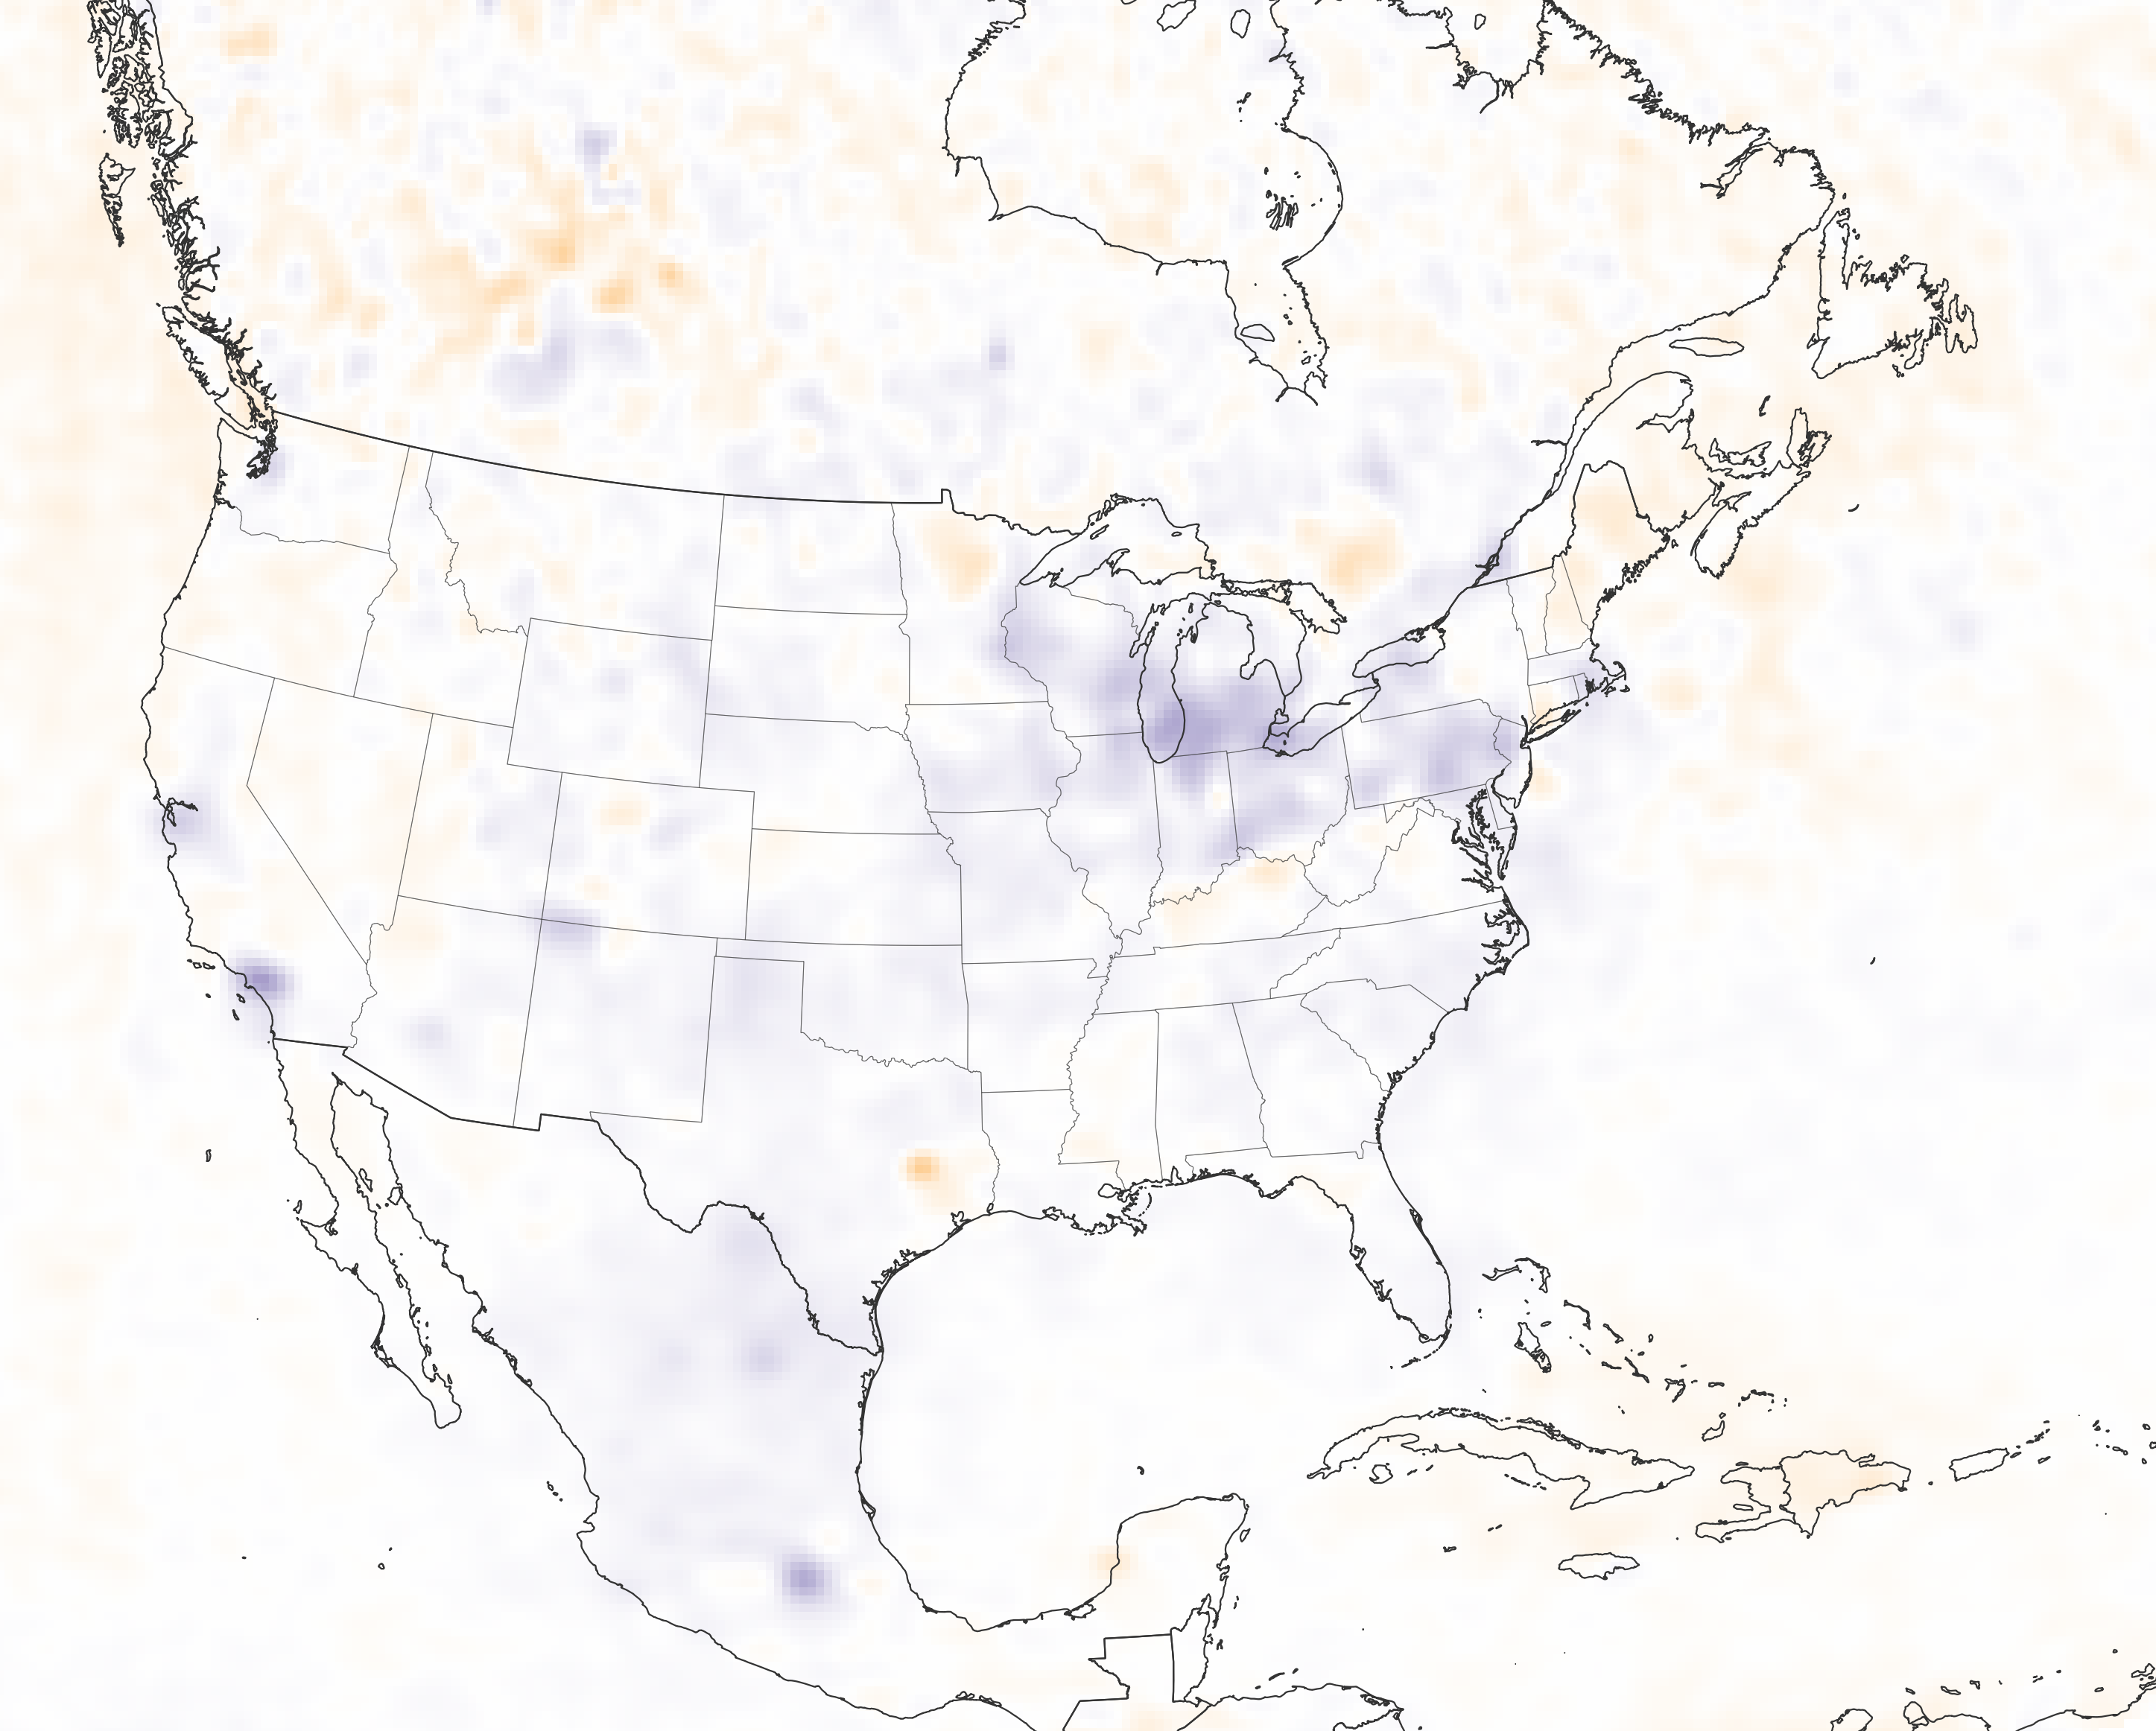
AFTER

The maps above show the change in NOx emissions from 2005–2009 and 2011–2015. NOx decreased by 7 percent annually from 2005 to 2009, whereas overall emissions only decreased 1.7 percent annually from 2011 to 2015. The maps were assembled from data acquired by the Ozone Monitoring Instrument (OMI) on NASA’s Aura satellite and correlated with measurements from ground–based air monitoring systems.
The study also showed that carbon monoxide emissions have not declined as quickly as expected in recent years. Those data came from the Measurement of Pollution in the Troposphere (MOPITT) instrument on NASA’s Terra satellite. Both OMI and MOPITT provide global, standardized views of emissions that are not subject to differences in regional and national ground–based reporting.
This slowdown in emissions reductions could make it more difficult for the United States to meet new federal regulations for healthy levels of ozone pollution. For example, in Southern California, the South Coast Air Quality Management District requires NOx emissions to be cut by 45 percent by 2023. In recent years though, NOx emissions and smog in Southern California have actually worsened.
“Ozone and other pollution standards are always health–based,” said Worden, a co–author of the study. “These emissions cuts are needed to reduce hospital visits and early mortality.”

The satellite observations and the EPA estimates showed similar carbon monoxide concentrations in recent years, but NOx satellite data differed from the EPA’s ground–based inventories, which are represented in the graph above. EPA data showed that NOx concentrations continue a consistent decrease after 2011, but satellite data show that the improvement was not as steady. EPA estimates are measured directly from sources and based on monitored readings or engineering calculations emitted by vehicles or factories, whereas the satellite data measures total emissions in the atmosphere over a large area.
One explanation for why NOx concentrations are not falling as quickly as the EPA estimated is that smaller emission sources may have a bigger role than previously thought. Federal and state regulations have been effective in controlling large-scale emissions from motor vehicles and power plants. But more subtle emission sources—such as industrial boilers, residential water heaters, and construction equipment—now play a relatively larger role. Researchers also found that changes in heavy-duty diesel trucks have not reduced NOx emissions in the real–world as much as laboratory emission tests suggested they would.
The study suggests these smaller sources could be better monitored to improve the accuracy of the EPA’s emission inventories. “We can use the trends derived from satellites to inform EPA inventory trends,” said Worden. “Satellite observations and the EPA’s inventories can be used together to give a more complete picture of the nation’s air quality.’
You mean that the EPA has finally discovered the law of diminishing returns?
Vehicular technology and fuel technology [that raised the cost] naturally help bringing down NOx. Is it not so?
sjreddy
Could it be related to the snafu involving VW Diesel cars being tuned one way for driving and another way for testing?
No, those European diesel cars were not approved for use in the U.S. Nor were any others.
PS: At http://bit.ly/2I1MRC1 26 April 2018:
Bosch says it has solved diesel NOx problem; as low as 13 mg NOx/km even under RDE; refining existing technologies
Aloha Anthony Watts,
When pressing the ‘Home button’, one gets this: https://wattsupwiththat.wordpress.com/
Your site reverts to this article as the latest post…
Ex NASA Employee: Planned Blog Posts on Coal to Solar Plant Conversions Cancelled..
I fund this latest article off your twitter page.
This is a browser cache issue, clear your browser cache and cookies and it should not happen again.
Anthony,
I kinda like my WordPress avatar and edit post function that was there for a while yesterday. Was that somehow limiting to folks without a WP login?
Every time there is an improvement in air/water/etc quality, the EPA invents an excuse to toughen the standards, and we immediately get reports in the MSM about how the number of cities that are failing to meet the standards has increased dramatically.
So instead of reporting about the progress that has been made, the media gets to pontificate how much worse things are getting and how the EPA and government in general needs even more power over us.
Hmmmmm……..Mr. Watts.
My colleague Bond, 007, couldn’t make the rendezvous, so they asked me to help out, besides, it’s beneath his pay grade.
I’m Scot………HotScot, 007.5, at your service.
Although I’m afraid your adversaries are already on to you. Not to worry dear chap.
We’ll have the blighters ~ahem~ dealt with………if you know what I mean.
Trust me. I’m not a scientist…….Shhh.
The three graphs show “Change in Anthropogenic NOx …”. Note that they aren’t showing the level of emissions and they aren’t showing the amount of NOx in the atmosphere.
As the amount of NOx in the atmosphere decreases, it gets harder to remove. That means the “Change in Anthropogenic NOx …” will decrease, which is exactly what the graphs show.
What is the change since, say, 1978? Do ‘they’ believe the changes would be linear, or that the changes would tail off at some point such that any improvements would appear to stall?
The Law of Diminishing Returns is in effect. We have are well past the intersection of the incremental cost vs incremental improvement for real pollution reduction.
To a progressive that just means the EPA needs more money and staffing for enforcement.
Understanding how your opponent thinks is first step to defeating them.
It means the money would be better spent on higher priority needs, like making energy et.al. more affordable. Do It For The Children…. and Their Poor Parents!
Way back in 1993 when Florida’s two environmental agencies were merged by the Legislature there was only one air quality monitoring station in Florida. It was in Pensacola where two legacy chemical plants were. Worse the station was not always working. Another odd thing the technocrats had decided that all of Florida was required to do home recycling which started in the 1980s, except for the state Capitol which in 1990 was still voluntary. Worse was that in 1993 much of the recycled materials were in storage; no one had bothered to find a market for the material.
Sorting your trash just means the trash takes different trucks to get to the same dump.
I live near that little purple blip on the lower left (LA). The reports are that LA is bad again. The problem here is geographically caused. We are ringed by mountains to the north west with the onshore wind blowing every thing up against the mountains and capturing it there. This has always been so, even the original inhabitants called it the “smoky valley”.
And, its not just us inhabitants who are making the air pollutants. Most people don’t realize that the Port of Los Angeles (in San Pedro) is the busiest port in the US by far. It handles more cargo than the next 5 ports combined. The coast near Long Beach has at any given time a dozen mega-cargo-container-ships awaiting their turn in port.
LA just needs to bore a big tunnel in the mountains to let out all that trapped polluted air. There, problem solved!
Hi Anthony! I posted a comment on this over at the other site, too, but I have since cleared my cache, etc and arrived at this site via the internet. However, I note that I missed several posts yesterday/today and never received any email notifications so am concerned whether there is any problem with the email service. I note that the site here says I am still subscribed via email but there are none in my inbox from this site yet. Also, when I tried to send this note a few minutes ago, the screen came back with an Error 500 Server Error…….anybody else experiencing any of this? Thanks!
I also noticed that the blue WUWT header at top left is not the text over which you hover to get back to the home page. Only the white, spelled-out title is “hot”. Both the blue WUWT and the white spelled out should be active, on hovering over them, I think.
I thought something was wrong, when hovering over the blue did not show the little finger thingie indicating an active link.
Comments just are not going through.
… growing pains.
And the air quality is only going to get worse.
I live on the side of a mountain overlooking a valley, east of Melbourne, Australia.
Until a few years ago, I could look down and see my neighbors going about their business down in the valley.
A couple of days ago, I went out on my deck to survey the estate and saw that the entire valley was blanketed with white smoke. I couldn’t see one house down there.
I wonder if it is a coincidence: it is now winter here; the last couple of days have been cold; the price of energy in Australia is now among the highest in the world; there has been a boom in the sale of wood heaters in Australia.
Does anyone remember the famous London “pea soupers”? How long do you think it will be before all of our cities again have those? How long before our forests are again devegetated?
Don’t worry; with your current government’s policies nobody will be able to afford wood soon.
Ahhhhhhhhggggghhhhhhhhhhhhhh!
My comments are disappearing into never never land………………….!!!!!!
Ahhhhhhhhhggggggggghhhhhhhh!
Just as in hoods, bonnets, boots and trunks, us Limeys get it All Wrong…
Might be worth checking your end :-/
http://www.dailymail.co.uk/health/article-5767973/Air-pollution-worse-inside-classrooms-city-streets-study-finds.html
Probably why the hapless brats get the wrong spelling of alumuliuimnuminum.
And prolynoleleylyne.
Still friends tho, might even let NASA borrow our copy of Thermodynamics For Dummies, if you like.
Careful tho, its heady stuff AND it is the Metric Version :-O
This article by Pollack, et. al., indicates that air pollution in the LA Basin (SCAQMD) has been decreasing by 3-5%/yr since 1960. These data are through 2010, so the chart shown by the EPA and NASA show start at a much higher point based on historical emissions levels and therefore the decreases in regulated pollutants have been even greater than shown.
Keep in mind that LA Basin population has quadrupled since the 60’s and vehicular miles driven has increased by double the population increase as people move further away from the Basin in order to find affordable housing in the deserts surrounding LA.
Trends in ozone, its precursors, and related secondary oxidation products in Los Angeles, California: A synthesis of measurements from 1960 to 2010
Ilana B. Pollack,1,2 Thomas B. Ryerson,2 Michael Trainer,2 J. A. Neuman,1,2 James M. Roberts,2 and David D. Parrish2
Received 14 March 2013; revised 3 May 2013; accepted 6 May 2013; published 13 June 2013. [1] Decreases in ozone (O3) observed in California’s South Coast Air Basin (SoCAB) over the past five decades have resulted from decreases in local emissions of its precursors, nitrogen oxides (NOx=NO+NO2) and volatile organic compounds (VOCs). Ozone precursors have been characterized in the SoCAB with measurements dating back to 1960. Here we compile an extensive historical data set using measurements in the SoCAB between 1960 and 2010. Faster rates of decrease have occurred in abundances of VOCs (7.30.7%yr1) than in NOx (2.60.3%yr1), which have resulted in a decrease in VOC/NOx ratio (4.80.9%yr1) over time. Trends in the NOx oxidation products peroxyacetyl nitrate (PAN) and nitric acid (HNO3), measured in the SoCAB since 1973, showchangesinozoneproductionchemistryresultingfromchangesinprecursoremissions. DecreasesinabundancesofPAN(9.31.1%yr1)andHNO3 (3.00.8%yr1)reflect trends in VOC and NOx precursors. Enhancement ratios of O3 to (PAN+HNO3) show no detectable trend in ozone production efficiency, while a positive trend in the oxidized fraction of total reactive nitrogen (+2.20.5%yr1) suggests that atmospheric oxidation rates of NOx have increased over time as a result of the emissions changes. Changes in NOx oxidation pathways have increasingly favored production of HNO3, a radical termination product associated with quenching the ozone formation cycle.
https://agupubs.onlinelibrary.wiley.com/doi/abs/10.1002/jgrd.50472
In case you need to read this article, there are sites that allow access using DOI numbers.
The reference to residential water heaters “play[ing] a relatively larger role” gave me a little chill. 20 years ago I was present at a meeting of EPA Region V (Chicago) with electric power providers concerning plans to intensify NOX regulation. Someone at the table asked–I wasn’t sure if he was joking–if EPA had considered regulating emissions from residential water heaters. One of the bureaucrats unhesitatingly said yes, “we looked at that but it was just too much of a manpower problem.” In other words, the EPA saw nothing amiss with regulating how warm you heat your water or how much time you spend in the shower, other than their inability to hire enough federal snoopers to keep people in line. Not something to forget…
The last folks we can trust are the government agencies. There is no doubt that early emission gains are easy and the later we get into the series the harder it will be without a serious evolution in technology. Other factors will include economic industrial cycles.
When I met with the chief scientist of SCAQMD in 2012, he stated that he wanted to eliminate all NOx emissions in the LA Basin by shutting down all manufacturing. This would save lives and reduce asthma (ignoring the fact that asthma has been increasing while pollution has been decreasing, so we need to increase pollution in order to reduce asthma!).
He had no clue that eliminating all manufacturing jobs in the Basin would essentially wipe out the economy and eliminate his position as there would be no tax base to support him anymore. Short sighted mentality at best.
The article mentions the need to get down to “healthy” levels of ozone pollution, and:
I suspect the references to reduced hospital visits and early mortality are the result of applying the discredited Linear No Threshold (LNT) algorithm. In my opinion, the projected ill consequences are nonsense.
In many cases, early mortatlity just means the patient died a few hours sooner.
Looking at the map of my state, emissions are going up in areas that are rural with low population densities. Little industry, mostly farming/ranching type activities. You can also see in the second map (2011-2015) that the area over the pacific is also showing an increase. Are we looking at yet Chinese import? Or is something seriously wrong with their maps?
Darrin, I’ve seen the same thing in my rural state as well. We haven’t had a large population increase, at least not during the time period shown in the second chart. Industrial activity has increased, but not by a large amount. So I am not sure what has been driving the NOx increase seen in the chart.
Wait just a minute. This article focuses on CO and NOx emissions as ozone pre-cursors, but doesn’t show the resulting impact on actual ozone concentrations. This seems consistent with the EPA mindset that regulatory compliance to emission standards is more important than the actual ozone levels that result from those regulations. Compliance is key, results don’t matter.
a society that keeps bringing in 1.5 million legal and illegal immigrants and then wonders about air pollution has a serious disconnect from reality.