More vindication for Dr. Roger Pielke Sr. who has said that global ocean heat content is the best metric for tracking global warming.
From the University of Southampton:

New study finds variations in global warming trend are caused by oceans
New research has shown that natural variations in global mean temperature are always forced by changes in heat release and heat uptake by the oceans, in particular the heat release associated with evaporation.
Analysing data from six climate models that simulated future climate change scenarios for the last International Panel for Climate Change (IPCC) Report, which appeared in 2014, University of Southampton Professor Sybren Drijfhout has shown that in all cases variations in global mean temperature were correlated with variations in heat release by sensible and latent heat. Writing in the journal Nature Scientific Reports, Professor Drijfhout says these variations are associated with heat transfer due to temperature differences between the surface ocean and the overlying air, and heat transfer associated with evaporation. The heat fluxes are also called the turbulent heat fluxes.
“The relation holds in all models and is independent of the time-scale of the variation in temperature”, says Professor Drijfhout, Chair in Physical Oceanography and Climate Physics at Southampton. “When the atmosphere gets extra warm it receives more heat from the ocean, when it is extra cool it receives less heat from the ocean, making it clear that the ocean is the driving force behind these variations.”
“The same relation can be observed in the observations, but because the data on surface heat fluxes is characterised by large uncertainties, reviewers urged me to drop the part associated with analysis of these data,” he adds.
Professor Drijfhout also explains he could only analyse six climate models because he needed to split natural temperature variations from the forced trend due to increased greenhouse gas concentrations. “You need the same model to repeat the same emission scenario a few times with slightly different initial conditions”, he argues. “In that case the natural variations will run out of phase, while the forced response is the same in each model run. This allows for a clear separation of the two.”
The relation between global mean temperature variations and total heat uptake appears to be more complex due to changes in absorbed solar radiation which are out of phase with the turbulent fluxes and the temperature response.
Before the ocean releases extra amounts of heat to the atmosphere, it is warmed by increased absorption of solar radiation. For a hiatus in global warming, or relatively cool period, the opposite occurs and more sunlight is reflected, cooling the ocean after which the atmosphere on its turn is cooled by less heat release from the ocean.
“The changes in solar radiation received at the Earth’s surface are clearly a trigger for these variations in global mean temperature,” says Professor Drijfhout, “but the mechanisms by which these changes occur are a bit more complex and depend on the time-scale of the changes.
“When the temperature variations only last a few years,” he continues. “The changes in absorbed solar radiation occur in the tropics, preferably the Pacific, and are associated with moving patterns of more or less clouds that are characteristic with El Nino, or its counterpart, La Nina.”
If the variations take longer, ten years or so, sea-ice becomes the dominant trigger, with more sea-ice reflecting more solar radiation and less sea-ice allowing for more absorption. These variations always peak over areas where surface water sinks to great depth and deep and bottom waters are formed which are transported by the global overturning circulation, or more popularly dubbed, Great Conveyor Belt.
“This is a bit strange,” Professor Drijfhout concludes, “because the temperature signal of these global variations peaks over the tropical Pacific, while the trigger peaks over the subpolar oceans. We do not yet understand how the linkage is established in the models, but it appears very robust. Also, if you replace global mean temperature with an average over the tropical belt, this linkage still exists.”
It should be noted that the models seem to underestimate triggers in the tropical Pacific on these long timescales.
“Already with El Nino we know that the energy exchange between ocean and atmosphere is not correctly captured in the models,” he says. “But despite these model errors the linkages in the models should be qualitatively correct. Understanding how these links are established and analysing the observations more closely whether the same links can be found there is clearly the way the research of my group will follow in the coming years.”
The article The relation between natural variations in ocean heat uptake and global mean surface temperature anomalies in CMIP5 is published in Nature Scientific Reports. (open access)
Abstract:
It is still unclear whether a hiatus period arises due to a vertical redistribution of ocean heat content (OHC) without changing ocean heat uptake (OHU), or whether the increasing radiative forcing is associated with an increase in OHU when global mean surface temperature (GMST) rise stalls. By isolating natural variability from forced trends and performing a more precise lead-lag analysis, we show that in climate models TOA radiation and OHU do anti-correlate with natural variations in GMST, when GMST leads or when they coincide, but the correlation changes sign when OHU leads. Surface latent and sensible heat fluxes always force GMST-variations, whilst net surface longwave and solar radiation fluxes have a damping effect, implying that natural GMST-variations are caused by oceanic heat redistribution. In the models an important trigger for a hiatus period on decadal timescales is increased reflection of solar radiation, by increased sea-ice cover over deep-water formation areas. On inter-annual timescales, reflection of solar radiation in the tropics by increased cloud cover associated with La Niña is most important and the subsequent reduction in latent heat release becomes the dominant cause for a hiatus.
It’s good to see a bit of climate sense coming out of universities. Back in the day, Southampton always used to have an excellent reputation in Oceanography.
I am not sure what you say is true about sense. My take, the “forced trend” (CO2) and the reason why climate models don’t match observation is natural variability? Ok, so far so good. Then goes on to explain why models do not match observation using another model/analysis? Is this just another one of the “oceans ate my heat” excuses?
According to Nick Stokes, Steve Mosher, Ivanskinsman, Griff and many others who frequent these shores, climate models are an excellent approximation of reality and accurate to two decimal places of degrees C or F. What and who are we to believe? sarc/
Duncan, I said “a bit’.
Small mercies and all that.
@John
” … approximation of reality and accurate to two decimal places of degrees C or F. …”
—
Yeah right, I checked/truthed the Temp accuracy of the ECMWF WX model, just yesterday, it had predicted a min of 17.0°C (integer level!) but the observed min T was 12.6°C.
So the local model prediction error was 4.4°C, for a 24 hour min-Temp forecast, and in fact all the surrounding temps were similarly way off.
What’s the res of interpolated GCM cells again?
Oh yeah—-just believe!
Never trust a scummer. We Pompey boys have long memories!
Not called Scumhapton for nothing I am sure you know. Me too Pompey (Clanfield).
What a surprise: the stuff that covers 3/4 of our planet, has a mean depth of 3.6 km, and has a heat capacity 1000 times greater than air governs the climate on Earth….!
Didn’t they find out that a couple of centuries ago….?
Once again, the question of where this additional heat is coming from is ignored. Ocean heat uptake is how it got there in the first place, but where did this additional heat in the atmosphere come from, because solar irradiance is low.
Scott
Variations in total ocean heat content are forced by solar induced cloudiness variations:
http://www.newclimatemodel.com/is-the-sun-driving-ozone-and-changing-the-climate/
Try rereading the above post, and you may get a clue to your question.
Wilde? Even Watts trashed his ideas long ago.
My comment was not made in reference to S Wilde’s comment.
You are implying that the back radiation from CO2 has warmed the oceans, as in your mind a weaker Sun has yet to lead to cooling so it can’t be the Sun. This tells me that you are off base in understanding the bigger picture. Thus my comment.
The post itself discusses a probable cause for energy changes in the oceans. This for one example “..Before the ocean releases extra amounts of heat to the atmosphere, it is warmed by increased absorption of solar radiation. ..”.
He had a go at the concept of a mass induced greenhouse effect but as far as I know he has made no adverse comment on the issues I raise here.
Scott Koontz May 15, 2018 at 9:52 am
“Wilde? Even Watts trashed his ideas long ago.”
I think Stephen has some good ideas that make a lot of sense. I think we’d learn a lot by considering what he says, instead of dismissing it.
I see this as a problem of perception and of being used to seeing things one way for so long that we find it hard to accept a completely new way of looking at things– not an untypical problem with knowledge in general. Yet once we shift our thinking and our perception, the ideas that Stephen and others set forward make sense: atmospheric pressure is the foundation for what happens in the atmosphere, and radiative transfers are minor players that exist within the realm of gravity-induced pressure.
The more I read and understand, the more I think that the notion that CO2 is doing anything at all is just plain silly, especially considering the absorption/emission of CO2 at TOA temperatures and pressures, which emissions supposedly govern surface temp as we count down from there using the lapse rate.
Yes, oceans provide the “insulation” effect that so many want to ascribe to the GHE.
Don132 says: “I think Stephen has some good ideas that make a lot of sense. I think we’d learn a lot by considering what he says, instead of dismissing it.“. Seconded.
Third-ed
What additional heat?
Oceans retain heat longer than the air. Solar activity has on average been high since the end of the Little Ice Age, when on average it was low.
Exactly.
Since 99.9% of the heat is in the oceans and .1% is in the “frighteningly thin” atmosphere of this rock, which do you think would drive the temperature more? The idea that the ocean can’t cool down because of absorbing heat from the air is like a ball bearing heating a cannon ball. Add to that the ability of the oceans to transport heat through circulation powered by solar irradiance which goes to very high latitudes and distribute solar heating evenly enough to make the surface of the planet stay within a comparatively miniscule temperature range.
What keeps us in that comfort range? Water. In all its forms.
Variations in that range depend on the sun and our orbital relationship to it,
The ways oceans run, i.e. the overturning meridional circulation, ENSO, AMO, PDO, etc.
Plus the clouds, acting in all their complexity of regulating insolation and reradiation.
Scott, one theory is the oceans build up heat due to changes in the Great Conveyor Belt. Driven by salinity changes these ocean currents speed up or slow down which the allows different amounts of solar energy to build up in the top layers of the oceans.
As the oceans warm/cool the atmosphere follows as this papers is telling you.
Your next question should be what drives the salinity changes. Quite likely that is due to evaporation changes driven by solar near IR variations.
Richard:
Re salinity: freshwater from ice melt at the poles is likely to affect currents.
Kristi Silber
How? The Arctic Ocean is 14 million square kilometers, maximum depth is 17,000 feet, average depth is 3,400 feet. (1000 meters average). At maximum, the Arctic sea is also 14 million sq kilometers – including the far away sea ice around Alaska, the Bering Straits, Sea of Okhotsk and Bering Sea, but sea ice averages 1-2 meters deep. And less than 7% of arctic sea ice is “melted” at maximum at today’s “extreme” conditions of doom and gloom catastrophic levels. Arctic sea NORMALLY melts out each summer from 14 Mkm^2 to 3-4 Mkm^2. What difference is another 2 or 3 Mkm^2 going to make compared to volume of the Arctic and North Atlantic Oceans?
You’re claiming an additional 2-3 Mkm^3 of sea ice melt will “likely” affect the North Atlantic currents when the annual melting of 10-12 Mkm^3 doesn’t do anything to affect those same currents now?
Are you fearing somehow Greenland’s ice cap will melt out and “flood” the Atlantic? How?
Over what period of time? 800-1800 years? 10,000 years? There is not enough fossil fuels to burn into CO2 to last long enough to cause enough sustained heating to cause enough sustained melting.
I’ve been telling you all that for over ten years.
http://www.newclimatemodel.com/the-hot-water-bottle-effect/
Sadly, some of the links are no longer active.
“To be taken seriously the NCM must be seen to show more predictive skill than the current computer based models.” What is the predictive skill of your model?
One needs to link the observed increased/decreased waviness of the jet stream tracks when the sun is less/more active to increased/decreased cloudiness at such times and then observe the atmospheric temperature response.
The consequent changing balance between El Nino and La Nina events should result in a background warning or cooling trend for Earth’s atmosphere.
I may have misunderstood. No predictive skill, really?
If you follow the chain of causation you can use observations to anticipate background warming or background cooling.
It has to be a major factor but the most critical factor is interaction between the Sun and Earth magnetically and electrically. This drives the preponderance of cloud albedo. At present the chaotic energy releases are just balancing the heat loss. To predict long term trends you would have to be able to predict the electromagnetic actions, the speed of the resulting perturbations and the gradient temperatures in the perturbed air along with corresponding land masses, the available water and the air pressure’s regulation of how much is taken up.
At least.
The areas of the earth where sea-ice reflection occurs are the ones that receive the least insolation. It is hard to conceive how this factor could be significant in global warming.
brycenuc
Look at global cloudiness changes and not ice cover.
bryc
my thoughts too, i have always felt that less sea ice means more heat loss to the atmosphere and then to space a net cooling event.The albedo difference has minimal effect as i think others here have shown many times.
Bob boder
Yes, over the entire course of a year’s time, more energy is lost from today’s Arctic Ocean than is gained through the few weeks of summer if any given area of Arctic sea ice is melted out. Net heat energy IS gained into the newly exposed Arctic Ocean between mid-April and mid-August, but the rest of the year (the remaining 8 months) enough additional heat is lost from an Arctic Ocean surface of 2-4 degrees C than is absorbed in the summer.
So major factors effecting temperature are oceans and clouds? No wonder the models do not follow reality, as the GCMs do not model clouds properly. I have no idea if the models even take ocean surface oscillations into account at all.
Just go here and see it for yourself at the North Atlantic transects of ARGO in the Oceans section. (direct links to charts don’t work at this site.)
http://climate4you.com/
‘analysing six climate models that simulated future climate change scenarios’
So this is about looking at guesses about what might happen in the future. Was it worth the effort?
Oceans, cloud formation, Earth – Sun magnetic and electrical interactions — this sounds complex! Is there a concise article somewhere that outlines the complexities involved in climate temperatures in simple terms for the simple, er, ton?
Try this BB
” microphysics connections to weather and climate
Mai Mai Lam, Brian A. Tinsley
PII: S1364-6826(15)30081-X
DOI: http://dx.doi.org/10.1016/j.jastp.2015.10.019
Reference: ATP4306
To appear in: Journal of Atmospheric and Solar-Terrestrial Physics
Received date: 13 August 2015
Revised date: 16 October 2015
Accepted date: 23 October 2015
Cite this article as: Mai Mai Lam and Brian A. Tinsley, Solar wind-atmospheric
electricity-cloud microphysics connections to weather and climate, Journal of
Atmospheric and Solar-Terrestrial Physics,
http://dx.doi.org/10.1016/j.jastp.2015.10.019
Solar wind-atmospheric electricity-cloud
microphysics connections to weather and climate
Mai Mai Lam1*
, Brian A. Tinsley2
1. British Antarctic Survey, Cambridge, UK
2. University of Texas at Dallas, Richardson, TX, USA
ABSTRACT: We review recent research articles that present observations of the large-scale day-to-day
dynamic tropospheric response to changes in the downward current density Jz
of the global atmospheric
electric circuit (GEC). The evidence for the global circuit downward current density, Jz
, causing
changes in atmospheric dynamics is now even stronger than as reviewed by Tinsley (Reports on Progress in
Physics volume 71, 2008). We consider proposed mechanisms for these responses, and suggest future
directions for research.
http://nora.nerc.ac.uk/id/eprint/512140/1/Solar%20wind-atmospheric%20electricity-cloud%20microphysics%20connections%20to%20weather%20and%20climate%20AAM.pdf
As noted in the introduction, in cloud processes there is continual conversion of energy between thermal
energy, latent heat, gravitational potential energy and dynamical energy, and the partitioning can be affected
by very small energy inputs. A sequence of two processes has been proposed. “
Now tease out any global warming signal from the temperature history for the Azores.
Can we measure the global ocean heat content with a required precision?
Perhaps, if we ignore the approximately 50% of ocean volume below 2000 meters depth, and the parts that are covered by sea-ice, and areas near major river mouths, and coastal upwelling areas, because Argo buoys don’t cover those.
Well .. the total heat content of the planet, not just oceans, might be a better indicator.
It is practically the same thing. The atmosphere is insignificant and the solid Earth is doesn’t change temperature at all beneath a very thin surface layer.
Curious, Remember when the environmentalists were going nuts that the Navy’s research was going to make all the whales deaf? Until a judge ruled that the Navy had to submit Environmental Impact Statements on many of their experimental activities, each year, sometimes more often, the Navy would set off a large and precise underwater explosion and track the sound wave around the world. They were attempting to map the thermal structure of the oceans. Knowing the thermal structure helps to “hide” submarines. From that data it might be possible to at least estimate in broad terms the ocean heat content or the change in content from year to year. That data is still all highly classified.
Another useless study using computer climate models. No more needs to be said
The oceans are the dog, and the atmosphere is its tail. The dog is very large and the tail has been docked.
The oceans have an enthalpy that is 1000 times that of the atmosphere. The oceans are, and must be, the primary drivers of the climate. the atmosphere is just along for the ride.
Thats all you need to know – school boy physics.
Prof. Drijfhous needs to go back to first principles. The mean global temperature is determined by gravity which does not change very much. The global response to this hunts about this fact and it is largely due to the atmospheric Rankine Cycle pumping excess heat up into the clouds and beyond with the large heat sink that is the oceans serving to create leads and lags. It behaves in a Chaotic fashion due to the large number of variables involved and needs to be considered at the fractal level if comprehension is to be achieved.
Navel gazing at huge and dubious data bases is not the best way forward; but to be fair the Professor et al do appear to be moving in the right direction.
Hmm I wonder if they got this part right.
La Niña certainly has more clouds over the Western Pacific due to stronger Easterlies. However, over the eastern and central Pacific, La Niña is characterized by over normal pressure. This leads to reduced cloud formation and subsequently reduced rainfall in that particular region.
Colder SST that characterize La Niña are associated with less evaporation and less cloud formation. So I don’t think it is correct to say that La Niña is associated with increased cloud cover in the tropics.
In any case, Nature doesn’t think this is very important. They put their second rate climate papers in Scientific Reports.
What? You realise Nina is characterised by higher tropical rainfall, droughts ending, flooding, more lows and more west pac cyclones? It is cloudier.
It doesn’t work that way. Higher SST –> higher evaporation –> more clouds.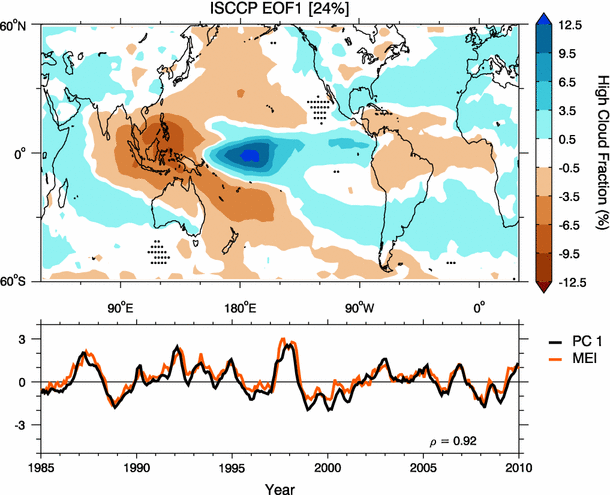
The first principal component of cloud cover, that explains 24% of the variability is ENSO, and coincides with multivariate ENSO index.
Li, K. F., Su, H., Mak, S. N., Chang, T. M., Jiang, J. H., Norris, J. R., & Yung, Y. L. (2017). An analysis of high cloud variability: imprints from the El Niño–Southern Oscillation. Climate Dynamics, 48(1-2), 447-457.
http://web.gps.caltech.edu/~kfl/paper/Li2016a.pdf
PC2 is El Niño Modoki.
El Niño has a lot more clouds over the central and eastern Pacific, and this is the critical region for incoming energy from the Sun.
Wait…
So what you’re saying is that the stuff with 5 times the specific heat capacity (water) over air, and which covers 70% of the surface area on this planet, is what drives the world’s temperature?
MIND BLOWN.
/sarc
ye,
somehow they failed to credit captain obvious. Again.
Now, to be fair, Captain Obvious is usually totally disregarded in “climate science”, so they deserve kudos for listening him, for once
“New research has shown that natural variations in global mean temperature are always forced by changes in heat release and heat uptake by the oceans, in particular the heat release associated with evaporation.”
This is hardly a surprising result given the very high rates of heat transfer associated with the water ‘evaporation-condensation’ cycle.
Relatively simple statistical analysis shows that of the order of 80% or more of the variance in global temperatures are related to ocean temperatures.
The factors that affect global mean temperatures can be described as follows:
!. Ocean temperatures, as characterized by ENSO.
– There is a concurrent affect (time lag about 4 months). This is what we see when we have strong El Ninos (1997/98, 2016/17) or La Ninas.
-There is a long term effect, what Bob Tisdale calls a ‘Permanent Effect’. This affect is at is maximum after about 10 years and lasts of the order of 20 to 30 years. This affect is also reflected in such phenomena as the Atlantic Multi-decadal Oscillation..
2. Solar Activity, as characterized by the Sunspot Number.
– There is a concurrent effect with the solar cycle directly affecting global mean temperatures. The magnitude of this effect (peak to trough) of about 0.1C in global temperatures.
– There seems to be a short term effect of the solar cycle on the strength ENSO. Unusually strong El Ninos seem to occur not long after peaks in the solar cycle (for example 1997, 2016).
– There is a long term effect of solar activity on ENSO. Multi-decadal variations in solar activity (that seem to have a periodicity of about 110 years or so) cause multi-decadal variations in ENSO, however with a significant time lag. These mult-decadal variations in ENSO show up as periods of multiple El Ninos with relatively few or weak La Ninas (as happened in the 1990s) or the opposite, multiple La Ninas with few or weak El Ninos, (as happened in the 1950s and 1970s). The time lag for this long term effect of solar activity to show up in ENSO is decades (30 years or more). What complicates the analysis is that the multi-decadal ENSO cycles, like the AMO, appear to be driven by the dynamics of the ocean currents and have a periodicity of approximately 60 – 70 years. Thus the magnitude of the multi-decadal solar forcing on the multi-decadal ENSO variations depend on how well these cycles, of different lengths) are synchronized.
Climate changes has nothing to do with Earth getting more or less heat intake. It changes when the cooling system changes. It is either cold or it gets colder. You all think,”Heat! Heat!” When Antarctica broke off, Earth had a huge drop in temperature and heat content. Who’s going to tell me it was caused by cloud? Were there no clouds watering the dinosaurs’ Earth? They no doubt had more cloud than us, judging by the vegetation. Clouds definitely cool a lot though. That’s a puzzle, unless you see what’s really going on. Why isn’t Earth as hot today as when the dinosaurs roamed? The Circumpolar current is what cools Earth. Before it was there, it was hot. So what controls Earth’s climate today. All agree that changes in the Southern Oscillation change global temperature. The El Nino cools it heavily and La Nina cools it even more heavily, is the proper way to perceive it. Chaos in the low air pressures down there make it cold or colder, and the ice icier because the atmosphere is thinner, not as heavy, so constant low pressure, storms and cold, and sun greatly less direct. 100 million tons per second of frigid water pass any given point, often reaching to the seafloor, it’s width from Antarctica to 40 °S, driven by the spin of the Earth. Cut that off the globe and see how much of your half it covers. Can’t you see the rest of the Earth’s heat getting sucked into it, spun round a few times, cooled way before it gets anywhere near the permanent ice and driven back north, cold.You all think the sinking water of a tiny offshoot of your measly Gulfstream drives ocean circulation. Wake up. It’s the Earth’s spin that drives it. All you have to do is look at the globe from an unblinkered point of observation and, with Antarctica in the centre, it is easy to see what drives the Gulfstream and all the rest. The circumpolar current is the Earth’s radiator. Antarctica is isolated, as the ocean depths are isolated climates. It is a climate on it’s own, in equilibrium. If the ocean warms, say, because of extra greenhouse gases, the Circumpolar Current’s line of convergence moves slightly south but nothing else changes, including global temperature. Global temperature can only change when Antarctica gets less cold or colder for it’s own reasons. Orbital perturbations are one of them. That why we see no polar amplification at the moment. The icecores prove polar amplification. Simply, when Antarctica changes 2°C, the rest of the world changes 1°C, driven by Antarctica, since it broke off and got the current round it. If, for some reason, the world warms 1°C, Antarctica doesn’t warm 2°C. It doesn’t warm at all. The world can’t heat until it’s radiator starts functioning differently. Earth’s heat intake means nothing. The only thing it changes is the latitude of the line of convergence, where the warm water from the world forces the cold Antarctic water under by floating on top of it. Then it gets spun round the globe till it gets really cold down there. This cold, salty water “sinking” idea blinkers everyone to thinking water has to be very very cold and salty or it won’t sink. All you need is warmer water moving into any water that is colder than it and the colder gets forced somewhere, and it’s not up, is it!? The circumpolar current answers every question and makes all scientists correct in their beliefs. No one is wrong.
Also, when they show iceblocks the size of “small states” breaking off Antarctica and say it is melting, tell them that 12,800,000 sq km Antarctica gets an average of 76mm of precipitation per year and the sea level doesn’t drop. That’s 972.8 cubic kilometres of water missing from the ocean every year and 355 cubic kilometres raises sea level 1 mm. So if that much ice doesn’t break off Antarctica every year sea level would drop 3 mm. If the floating ice that breaks off is 700m thick, the block is1389 sq km in area.
Joe A. Antarctic is a big player..agree. +++
Tight polar vortex and jetstreams create pressure differential tgat cause winds. These winds move over oceans, and change cloud coverage, change UV getting to surface…changes thermal storage in ocean. Rinse and recycle.
Yeah Macha. I know a ton about everything that goes on and interacts and makes changes, and know clouds are really important, as are a few other major things, but constantly see everyone ignoring the biggest force on Earth, as though it doesn’t exist. As for winds, it’s the same thing as the current down there. Winds you guys up north wouldn’t dream of in strength and consistency. I see everything else as bit players compared to the planetoid sized dynamo of mass able to take in the worlds water and bleed it’s extra heat to space. Each new thing I learn, I ask, first, “How does that affect the Circumpolar Current’s effect?” Nothing really does. Now that you are aware of it, you watch! It made average ocean temperature drop from 21°C to 6°C, 33 million years ago. Before that Earth had no ice. Take anything else away and you can hardly detect any difference. Take it away and we’ll see ocean temperature rise to 21°C. That’s by far the greatest climate drive we know, and it is there freezing the Earth right now. It shouldn’t be ignored or sidelined. Every effect must be explained in how it affects Earth’s radiator. Good on ya. We’re on the same side. Aloha.
” … You all think the sinking water of a tiny offshoot of your measly Gulfstream drives ocean circulation. Wake up. It’s the Earth’s spin that drives it. All you have to do is look at the globe from an unblinkered point of observation and, with Antarctica in the centre, it is easy to see what drives the Gulfstream and all the rest. … ”
—-
Thank you, that really needed to be said.
The sun and the oceans….who knew?
Recycled science works in between scare science to get pubs in the volume-based system of promotion and tenure.
They claim the the oceans are the driving force for climate change.
Well l know for certain that claim is wrong. lts much more like a 50-50 split between oceans and weather/wind patterns. Because by studying the weather patterns across the globe for the last 5 years. l know for sure that weather can and does drive SST both up and down. For anyone who is in any doubt about this. Then just at the current state of the N Atlantic, and you notice a large warm blob in the middle of it. Well that warm blob has been due to the amount of time that high pressure has been sitting over that area. So the increase in sunshine and light winds is what has caused the SST to warm up over that area.
There is practically nothing in this guys’ research and model ‘testing insights’ that myself and fellow cohort were not intuiting and writing about, almost 30 years ago. What a remedial joke cutting-edge ‘climate science’ is.
” … these variations are associated with heat transfer due to temperature differences between the surface ocean and the overlying air, and heat transfer associated with evaporation. The heat fluxes are also called the turbulent heat fluxes. … ”
lol … turbulent heat fluxes … oh please.
Data was taken from models. That is impossible. Apart from that, he has guessed it right. Pity…..
Nature:
https://thsresearch.files.wordpress.com/2017/04/ef-data-research-report-second-editionfinal041717-1.pdf
It’s been peer reviewed now
Examination of space-based bulk atmospheric temperatures used in climate research
https://www.tandfonline.com/doi/full/10.1080/01431161.2018.1444293
quote: For a hiatus in global warming, or relatively cool period, the opposite occurs and more sunlight is reflected, cooling the ocean after which the atmosphere on its turn is cooled by less heat release from the ocean.–end quote
This seems like an obvious place to bring up Henrik Svensmark’s theory of how a weaker heliomagnetic field allows more GCR’s (and especially muons) to penetrate earth’s atmosphere, precipitating low level cloud formation–which should allow the oceans to cool, which will then have less heat to release to the atmosphere.
Also, I am thinking that if the air is mostly heated by the oceans, what additional contribution remains to be made by CO2 retaining heat directly from the sun? How much of the variance in temperature change can already be explained by the ocean’s role in temperature regulation?
I further assume there is a lag between changes in ocean temperature and changes in the atmospheric temperature. Does anyone know how long that lag is? Oceans appear to have been cooling since about 2003 or 2004, based on a preponderance of data. How much can we expect the unfolding Eddy Minimum to accelerate this trend?
From the article, “Analysing data from six climate models that simulated future climate change scenarios for the last International Panel for Climate Change (IPCC) Report,…” Why are we discussing models and model outputs as if they are data?
It’s the new reality. Models are reality. What we used to think of as real-world observations (like temperature) are adjusted to match the output of models. Welcome to post-science science.
I think theoretically, Ocean heat content would certainly be a better metric for climate change than measuring near surface air temps mostly over land, mostly over the US and Europe. IF WE COULD MEASURE OCEAN HEAT CONTENT! But we cannot. The oceans are too big, too deep, and the water keeps moving around. Oh sure, we can estimate, but we’d fall right back into the same self-serving political traps we’re in now. Any estimates we make are going to need thousands (millions) of guesses, assumptions, extrapolations and infilling to make up for huge voids in the process. What a dedicated rent-seeker can do with those voids…
Practically, I think measuring the speed and volume of the major Pacific and Atlantic currents along the edges of the continents would be the best way to have an actual physical proxy for ocean heat content. If the oceans are warming, the currents will run faster, if cooling, convection will slow.