Adios, La Niña by Rebecca Lindsey, NOAA
The La Niña event that overtook the tropical Pacific this past winter is officially over, according to the latest update from NOAA’s Climate Prediction Center. La Niña’s signatureof heavier-than-usual rainfall in the western part of the basin has tapered off, and the cool surface waters in the central part of the basin are dissipating.

This animation tracks the fall emergence, winter peak, and spring decay of the ocean half of the La Niña climate phenomenon. It shows monthly sea surface temperatures compared to average (1981-2010) from August 2017 through April 2018. Places where temperatures were up to 9 degrees cooler than average are blue; places where they were up to 9 degrees warmer than average are orange and red.
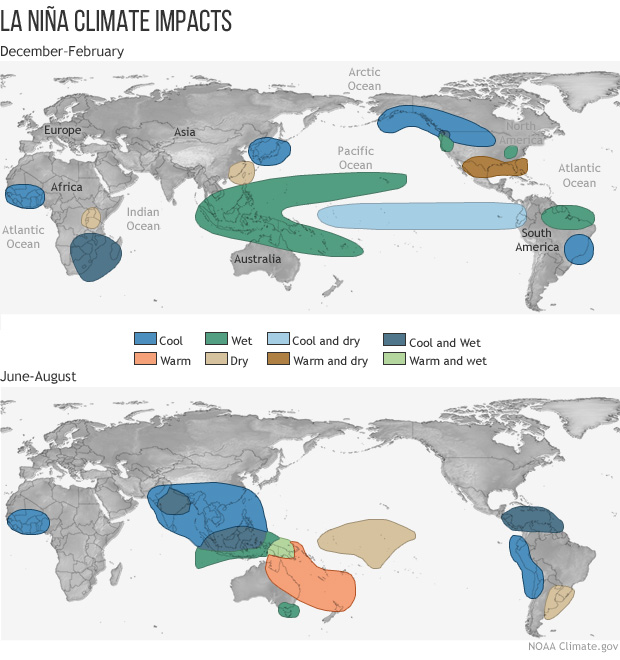
Why do U.S. climate forecasters pay so much attention to a pattern that operates in the remote tropical Pacific? Because the Pacific is the world’s biggest ocean, and disruptions to its climate have a long reach. The seesawing changes in tropical rainfall, winds, and ocean temperature that accompany La Niña and its warm-phase partner, El Niño, trigger a cascade of potentially predictable impacts on seasonal climate in the United States and beyond.
But, using a difference color scheme, we get a different impression:

And our ENSO 3.4 region indicator shows the cool side of neutral.

Will La Niña return? Watch and wait.
I like the overall tropical Pacific as a better metric of how global temperature is being influenced. It shows warmer than average since February.
http://www.cpc.ncep.noaa.gov/products/analysis_monitoring/enso_update/heat-last-year.gif
The cool anom north of Papua is interesting, doesn’t suggest Nina, or necessarily neutral.
It is interesting just how much influence on weather the ENSO has.
It is interesting just how much influence on climate that NOAA has.
May be my favorite comment of the month . . but weeks to go!!!
No, no, no you have it all wrong! It is interesting how much influence on ENSO the CO2 has.
La Nina may be ‘over’ but it provided sufficient winter/spring rain to California to make for a lush plant growth in many areas. Unfortunately this usually means lots of plant growth that dries out as the summer drought progresses and subsequently fuels a ‘bad’ wildfire season. It is an entirely natural and historical cycle in California that the disingenuous AGW catastrophists declare a touchstone of global warming. One is as predictable as the other…..
Joe Bastardi (weatherbell.com) is forecasting a modoki el nino for fall/winter 2018-19.
A guess just like last year which was wrong. Maybe this time right but it is just luck.
Salvatore Del Prete
Is that a bit like the guesses at predictions of climate catastrophes over the last 40 years, which never happened?
Tropical Tidbits is showing the 3.4 region temps moving sideways on the 0.5C line for the last 2 days. Someone has their numbers wrong. I would bet against NOAA on this La Nina being over with. It’s only resting, momentarily.
I agree.
Maybe NOAA should get a Weatherbell premium membership and get the news earlier.
Can you say Modoki El Nino?
Where is Bob Tisdale when you need him ? 🙂
Anthony,
Nice catch on the color scheme by Rebecca Lindsey (contractors to NOAA Climate Program Office). Using white to distract from cooler whereas generally it would be considered neutral or no change within equal parameters. Guess that’s the norm for NOAA contractors. She even went so far as to include NOAA after her name! What a wannabe!
In accordance with the linked site https://www.climate.gov/news-features/blogs/enso/may-2018-enso-update-thar-she-goes there is a disclaimer as follows:
Disclaimer:
The ENSO blog is written, edited, and moderated by Michelle L’Heureux (NOAA Climate Prediction Center), Emily Becker (contractor to CPC), Nat Johnson (NOAA Geophysical Fluid Dynamics Laboratory), and Tom DiLiberto and Rebecca Lindsey (contractors to NOAA Climate Program Office), with periodic guest contributors.
Ideas and explanations found in these posts should be attributed to the ENSO blog team, and not to NOAA (the agency) itself. These are blog posts, not official agency communications; if you quote from these posts or from the comments section, you should attribute the quoted material to the blogger or commenter, not to NOAA, CPC, or Climate.gov.
Give that girl a pink slip.
Even more from the NOAA blog as linked to above. The link immediately preceding Rebecca Lindsey s name (NOAA Climate Program Office) leads to this as a mission statement:
About the Climate Program Office
The Climate Program Office (CPO) manages competitive research programs in which NOAA funds high-priority climate science, assessments, decision support research, outreach, education, and capacity-building activities designed to advance our understanding of Earth’s climate system, and to foster the application of this knowledge in risk management and adaptation efforts. CPO-supported research is conducted in regions across the United States, at national and international scales, and globally.
Wow …… NOAA has a problem with it’s mission: decision support research, outreach, education, etc.
It’s my view that the public didn’t really start paying attention to AGW – sarc – until the newspapers started showing the weather forecasts in brilliant color. Dark reds and browns turning into hot white are quite impressionable; shades of grey, not so much.
By outsourcing comment to contractors and disassociating itself from the comments, NOAA outsources the risk of formulating ‘ideas and explanations’ to third parties, especially in the vexed area of risk management.
As was proven so clearly last season no one can forecast ENSO accurately.
So it is wait and see but I am much more interested in what overall sea surface temperatures are doing rather then ENSO.
Yes the Atlantic appears to be in a cooling trend. If the AMO bottoms out and ENSO flips back to La Nina being dominant, we will see the ’70s revisited, albeit starting a few tenths of a degree C higher. From there it’s up to the MJO and jetstreams how specific weather patterns respond and who gets what effects.
Pop Piasa
What I got from that is, no one has a clue.
Yup, that pretty well sums it up. Chaotic systems interacting.
http://www.woodfortrees.org/plot/hadsst3gl/from:2010/plot/hadsst3nh/from:2010/plot/hadsst3sh/from:2010
Ocean surface temps have done anomolous yearly cycling since 2003 (the advent of the pause). This has meant, for the most part, anomalous warming in the northern hemisphere during the summer months only to lose all that warming come the following winter. So, overall, we might expect more of the same this year. We really won’t know where we’re at until this year’s cycling is over an temps return to normal come winter time. The southern hemisphere has more or less of a cycle although temps seem much more stable. (the northern hemisphere is having a greater affect on the global temperature anomaly)…
afonzarelli, I looked at your graph and extended it back to 1990:
The sudden change around 2003 looks bizarre and quite artificial. I can’t image how the NH and SH could suddenly depart so much with so much annual variation coming on all of a sudden like that. Maybe some more savvy SST experts can weigh in on why the sudden change.
That’s interesting because from around 2004 until last year. There has been sharp drops in the May and June snow extents over the NH. Now weather there is a link between the two events l don’t know.
But it does seem to be a very close match.
Afonzarelli: “(the northern hemisphere is having a greater affect on the global temperature anomaly)”
April satellite data shows NHEM=+0.31 which includes ARCTIC=+1.02.
Unless I am mistaken ARCTIC data is calculated not measured. How much influence does the arctic have on NHEM temp?
pmhinsc: “How much influence does the arctic have on NHEM temp?”
My swag at answering my own questions is that if we assume Arctic anomaly is zero (humor me!), NHEM temp anomaly would be in the vicinity of +0.25 rather than +.31 which still supports Afonzarelli comment that “(the northern hemisphere is having a greater affect on the global temperature anomaly).”
It still bothers me that an arctic anomaly or +1 deg F at say -10 Deg F has an undo influence on global temperatures in the vicinity of 59 Deg F..
It is late and I hope I got most of that right.
Taxed, not surprised in the drops in May / June snowfall in NH … it’s summer ?
This could well be premature. Notice there is even a growing cool patch in a non-existent western Pacific warm pool and, incidentally, the GB Reef looks cooler. Note the cold waters are slanting equatorward from N and S into the equatorial band rather than the usual east west action of ENSO.
Ummm, sorry to be blunt, but you don’t know what you are talking about. The Western Pacific Warm Pool is alive & well and growing in size like it always does this time of year.
http://www.cpc.ncep.noaa.gov/products/analysis_monitoring/enso_update/sstanim.shtml
It’s not a time of year event! I just showed you a government data map. There is a lot of cold water slanting into the equator (ere.. that’s where ENSO is measured). Enlarge my illustration. There shouldn’t be cold water on the equator in the western Pacific for a forecast like this. Besides I’m disagreeing with the forecast. Let’s see how it rolls out!.
JKrob,
Notice in your posted animation that the eqatorial cool anom in central and eastern Pacific is closing out.
And there is a cool anomaly north of Papua New Guinea right now. Take a look at a few different sources.
It most certainly*is* a ‘time of year’ event. The tropical water temperatures (including the WWP) oscillate N/S in 6 month swings lagging the Sun. That is obvious in any SST animation that covers a year period.
No, you just showed me a government *anomaly* map …and if you are going to make me explain the differences between actual temperatures and anomalies temperatures, well…we have deeper problems.
There is *NO* cold water on the Equator in the western Pacific. The actual water temperatures are around 85F and your anomaly map shows 0.5C cool anomaly which would make “normal” around 86F? Again, if you are defining 86F as “COLD”, sounds like a personal problem.
Notice, central and eastern pacific does not qualify as the western pacific.
And the water temperature is still in the mid-upper 80’sF. Again, as I posted, the WWP (Western Warm Pool) is alive and well in the Western Pacific (not eastern or central…) and the statement of “non-existent western Pacific warm pool” is factually incorrect…duhh.
please don’t be stuck-on-stupid
“But, using a difference color scheme, we get a different impression:”


Is it so different? Here is the NOAA version, close up
And here is the second
And FWIW, from here is my version, May 9, with rainbow colors
And there’s also this view, which shows quite a bit more detail:
https://earth.nullschool.net/#current/ocean/surface/currents/overlay=sea_surface_temp_anomaly/orthographic=-112.05,-4.86,1123
I noticed in the NOAA SSTA animation that the last couple of frames show a surge of upwelling cold water near the coast of South America and pushing westward toward the Galapagos Islands. So the cold upwelling pulses do not seem to have ended yet. Consequently, I would not rule out a return of the La Nina later this year and possibly even a little stronger going into the NH winter. The last strong La Nina peaked during the NH winter of 2010-2011, so perhaps we are due for another strong La Nina before too long.
From the 1950’s to the early 1970’s there were persistent strong La Ninas that increased or even peaked around the NH summer, during a period when global mean surface air temperatures were overall falling slightly. In contrast, since the mid 1970’s the strong La Ninas have peaked closer to NH winter during a period when global mean surface air temperatures have overall been rising slightly. Too short of a reliable record to tell if this pattern is just coincidence, or if the current summertime La Nina weakening could be an indicator of continued slight overall warming of global mean surface air temperatures.
OZ, see my 5:01pm comment above and attenuating woodfortrees graph. (i left the numbers there so that peops can take things further back in time) What do you make of the pronounced yearly cycling that’s been going on since the turn of the millennium?
afonzarelli and oz4caster
Thanks for the graphs of hadsst3. I agree that there is something wrong with the nh data so well spotted. It looks more like absolute temp (in some form) than actual anomalies. If you compare with hadsst2 nh there is an overlap up to around 2014 and it does not show the deviation. I wonder to what extent this apparent bust is carried through to hadcrut4.
This nullschool shows westerly winds pulling up cooler water north of Papua, as it pushes warmer water east.
https://earth.nullschool.net/#current/ocean/surface/currents/overlay=sea_surface_temp_anomaly/orthographic=-209.24,3.23,794
Peruvian upwelling remains strong however, and anchovy landings robust
https://www.undercurrentnews.com/2018/05/11/perus-anchovy-landings-reach-50-of-quota/?utm_source=Undercurrent+News+Alerts&utm_campaign=3a861fb611-Pelagics_roundup_May_11_2018&utm_medium=email&utm_term=0_feb55e2e23-3a861fb611-92440397
Although juvenile numbers are down albeit relatively. (The recent very strong year class just grew up.)
The trades are still steady.
The SOI (southern oscillation index) is high.
All of the above suggest that it’s premature to write off La Nina just yet.
The 5/10 map looks to me like the typical La Nina state. And looking at the animated sequence it surprises me (or maybe not) how anyone can claim that it is ‘dissipating’.
So, why no 1C drop in global temperatures like it did after the 1999 el nino? What is holding the temperature up?
Because the 1997-1999 el Nino was of the classic type that engaged the Bjerknes feedback. Peruvian upwelling stopped and the trades reversed. The 2016 “el Nino” was nothing of the sort. It was “el Nino modoki”, meaning warming of the equatorial mid Pacific by some mechanism other than the Bjerknes feedback. Thus no warming or cooling will result, no pulse of poleward heat trany – just resumed status quo.
tranytransport
A Weak La Nina exists at the end of April 2018 with the latest 3-monthly season FMA 2018 at -0.6ºC
http://www.gujaratweather.com/wordpress/wp-content/uploads/2018/05/ONI_FMA_2018.jpg
Nice graph, I like that.
La Nina exist using NOAA Criteria see my post at 12.58 am.
West Coast US El Nino: Winter starts in September with rains. West Coast US La Nina. Winter starts in January with rains. The difference I see living here in this is the timing of the rains. Many describe La Nina as being a period of drought, but I just see very late winter onset. If it is warm in normally Spring here for La Nina, there there is no Sierra snowpack and in late Spring reservoirs are not filled as the water already ran out, so this is called “drought”.
La Nina late winter rains for Southern California are coming to an end for the season. Raining here all the way through to the end of April. Eastern Mojave desert had strong storm and rains the other day with a Low right up in the Gulf of Baja sucking up moisture from the gulf.
the same sort of crappy winds except from antarctica have blown almost every chance of rain back upwards in aus this yr, some places did ok and so did alice springs NT/WA top end qld
we just got a decent dump of rain..tassie flooded in spots in the far SE Victoria and some in sth aus for welcome change and thats a near cyclonic whizzing round off the west coast side of NZ that for once came UP our coastline from the sth
im watching the enso meter n crossing fingers for a decent winter rains
La Nina is over. Translation — water temps in the ENSO area are average/neutral.
Wait a minute, 3.4 just dropped slightly over the last 2 days. Watch it continue to drop in the days ahead. There is a reason for that.
I’m but an amateur meteorologist, and I don’t really “believe” the ENSO correlation. After recording and reporting my weather to NOAA for over two decades ending in 16′, it seems thready at best. The winter of 2010–11 was substantial here in Lake Arrowhead, (precip >50″) and the snow at Mammoth broke all records,(>650″ of snow). It was a La Nina that winter. Last year was El Nino, and we were well below average. I think ENSO needs some reconsideration and it’s connection to the jet stream needs to be better understood. What I do know is that rainfall in south west CA is cyclical and has been since records started being kept in the 1870’s. “Droughts” are normal, and can linger for years. That’s why William Muholland built his famous LA aqueduct from the Eastern Sierras, and MWD built the Colorado aqueduct in the 30’s and 40’s. We’ve been observing SST’s for < 30 years, and I'm not sure that's enough to understand the cycle; I think there's more variables in the equation that we're not accounting for…
I’m not sure which is the most useless: Contemplating your navel or contemplating Chaos.