Ron Clutz writes at Science Matters:
 Years ago, Dr. Roger Pielke Sr. explained why sea surface temperatures (SST) were the best indicator of heat content gained or lost from earth’s climate system. Enthalpy is the thermodynamic term for total heat content in a system, and humidity differences in air parcels affect enthalpy.
Measuring water temperature directly avoids distorted impressions from air measurements. In addition, ocean covers 71% of the planet surface and thus dominates surface temperature estimates.
More recently, Dr. Ole Humlum reported from his research that air temperatures lag 2-3 months behind changes in SST. He also observed that changes in CO2 atmospheric concentrations lag behind SST by 11-12 months.
This latter point is addressed in a previous post, Who to Blame for Rising CO2?
The April update to HadSST3 will appear later this month, but in the meantime, we can look at lower troposphere temperatures (TLT) from UAHv.6 which are already posted for April.
The temperature record is derived from microwave sounding units (MSU) onboard satellites like the one pictured above.
The UAH dataset includes temperature results for air above the oceans and thus should be most comparable to the SSTs. The graph below shows monthly anomalies for ocean temps since January 2015.

The anomalies have reached the same levels as 2015. Taking a longer view, we can look at the record since 1995, that year being an ENSO neutral year and thus a reasonable starting point for considering the past two decades.
On that basis, we can see the plateau in ocean temps is persisting.
Since last October all oceans have cooled, with upward bumps in Feb. 2018, now erased.

As of April 2018, global ocean temps are slightly below the average since 1995. NH remains higher, but not enough to offset much lower temps in SH and Tropics (between 20N and 20S latitudes).
The details of UAH ocean temps are provided below. The monthly data make for a noisy picture, but seasonal fluxes between January and July are important.

The greater volatility of the Tropics is evident, leading the oceans through three major El Nino events during this period. Note also the flat period between 7/1999 and 7/2009.
The 2010 El Nino was erased by La Nina in 2011 and 2012. Then the record shows a fairly steady rise peaking in 2016, with strong support from warmer NH anomalies, before returning to the 22-year average.
Summary
TLTs include mixing above the oceans and probably some influence from nearby more volatile land temps. They started the recent cooling later than SSTs from HadSST3, but are now showing the same pattern.
It seems obvious that despite the three El Ninos, their warming has not persisted, and without them, it would probably have cooled since 1995. Of course, the future has not yet been written.
Read the full story at Science Matters
And yet this graph by the EPA:
https://www.epa.gov/climate-indicators/climate-change-indicators-ocean-heat
says that ocean heat content has increased almost monotonically since 1970. What gives?
Until ARGO, it was all a guesstimate. ARGO shows pretty much what Ron Clutz shows.
And Argo only samples the upper 2,000 meters. The global average ocean depth is pegged at around 3.8 km. So Argo only samples the upper half of the upper half. But that is where the action is of course for surface climate. Still that lack of data below 2km allows Trenberth to rhetorically hide a lot of heat.
ristvan says, “Until ARGO, it was all a guesstimate.”
Actually, the early pre-ARGO OHC data is derived from observations.
ristvan says, “ARGO shows pretty much what Ron Clutz shows.”
Really? Please show us with a graph and link the source of the data. To the contrary, every OHC dataset I’ve seen shows global OHC increasing in recent years. Are you just making this stuff up, ristvan?
Bob
Early data is based on observations, however the quality control for most of those measurements was iffy, and there weren’t enough of them to state with any degree of certainty what the temperature of the entire surface of the ocean, much less anything below about 10 feet or so.
The ARGO buoys have improved the situation, but not enough to really matter. The long term stability of the sensors is in doubt, and there are still 2 to 3 orders of magnitude too few sensors.
ristvan
May 9, 2018 at 10:56 am
Until ARGO, it was all a guesstimate. ARGO shows pretty much what Ron Clutz shows.
ARGO was helped to show what it shows after ARGO data was ‘corrected’ to show warming not cooling. Hear it straight from the horses mouth:
Proudly Presenting: Correcting Ocean’s cooling
https://earthobservatory.nasa.gov/Features/OceanCooling/
As explained inside at first he thought it was a ‘speed bump’ on the road to global warming, but when it continued to cool they realised something must be done. The data is wrong, it cannot be that the ocean is cooling…
And the data got corrected.
Killer, the thinking goes that the ocean has a temperature gradient. If you raise the SST then the whole ocean forms a new gradient. As that new gradient forms the ocean is warming even though the surface temp is not. (once the new gradient is formed the ocean stops warming and is said to be in a state of equilibrium)…
afonzarelli, while the rest of the ocean is warming to match the surface temp, the surface is losing heat to the underlying water.
The whole argument of AGW is about pimples on the surface of the sun – they are incredibly hard to detect, & even less of a concern.
The post is talking about air temperatures above the ocean not the ocean temperature itself. So it is basically lying by present data that does not measure what the post claims is it measuring.
Judith Curry had seen enough 8 years ago:

Here’s an update on the “Inconvenient Plateau”:
mcleod, that’s nice, but it’s largely irrelevant to those of us living at or above the surface. Surface temps could show cooling over time as the oceans continue to warm faster than evah. If that happens is anybody really going to care about what’s happening in the sea? (think about it)…
“…Plateau In Global Ocean Temperatures Persists”
Did you miss that bit? Y’know…the headline.
So referring to “Ocean Temperatures” data…., how would you describe it? Misleading? or just careless because they need new glasses?
zazove, definitely misleading. This is the kind of stuff that makes the blogosphere such a poor place to get one’s science.
Tony, the headline was written by Anthony Watts, not by Ron Clutz. If you were to politely get his attention, he would no doubt change the headline to a more objective one. (this sort of thing happens all the time) Just go to the wuwt test page linked up top to find out how best to get anthony’s attention. Probably too late for this particular post, but i’m sure your effort will be appreciated. Here’s the headline at Science Matters:
Plateau in Ocean Air Temps
p.s. always nice to see you post. (kind of reminds me of the good ol’ days with andyg… ☺)
Total hydrospheric temperature is known to have barely changed enough to measure since 1950, to the extent it can be measured at all, so any notion that there are reliably-known trends in total hydrospheric heat content is a bit fanciful, and the idea we can predict future trends is extremely well-funded nonsense.
It doesn’t much matter if the average temperature has barely changed enough to measure if one is measuring part of it, the part where nearly all the temperature change is. I suppose the trick is figuring out how much of that heat gets sent below the pelagic zone, if one is trying to measure the amount of energy the ocean has absorbed.
Couldn’t that also affect sea level rise? What are the physics here – if warm water drops to the bottom, where pressure is higher, wouldn’t that heat then have less effect on the volume of water?
Kristi ” … if warm water drops to the bottom, where pressure is higher, wouldn’t that heat then have less effect on the volume of water? …”
—
Oh good grief, hot water sinks into cold brine bottom water now?
Got a shred of material evidence?
If not we can ignore your spleading.
Kristi — “It doesn’t much matter if the average temperature has barely changed enough to measure if one is measuring part of it, the part where nearly all the temperature change is.”
That would be true only to the extent the two systems (the part we can measure, and the part we can’t) are isolated systems that have no effect on each other. To the extent they are not, it matters quite a lot (and it matters more the farther apart they get in temperature). The oceanic lapse rate is not well-understood, but on decadal scales the 2LOT probably can’t be ignored.
Warmth is always flowing from colder places to warmer places, in the ocean and to/from the ocean, with the flows constantly varying and reversing over place and time. Total hydrospheric temperature is only affected by flows to/from — moving energy around in the same volume doesn’t change the average temperature of the volume.
Sorry — energy is always flowing from warmer places to colder places, of course.
And I hasten to add, none of this is to say there are not interesting/useful trends in SST. They just don’t tell us as much about total hydrospheric heat content trends since the 1970s as often seems to be claimed.
First the referenced link you give is to 2015, the article link is to 2018. The decline indicated is all in the missing data from the link. Just check the x axis.
Here comes “the pause” (again.)
“The UAH dataset includes temperature results for air above the oceans and thus should be most comparable to the SSTs.”
Not really. They measure a band peaked at about 4 km above the ocean. Anyway, actual measured SST (from ERSST V5) is on the way up, after a low point in December. Here is a plot (from here) which shows the contributions of various regions to the monthly average reported by TempLS, just out. It isn’t a measure of average temperature for the region, but the effect that region had on the global average, shown in black (SST is dark blue). However, because SST dominates the global average, the changes are close to changes in average SST. SST is up by about 0.07°C since December.
Nick,
How do you like your cherries?
I see SST is unchanged since November.
joelobrien says, “I see SST is unchanged since November.”
Is a hiatus now dictated by 6 months of data?
Oy!
No Bob. Of course not. I was just making light of Nick’s final comment about ,”up by about 0.07°C since December.”
Oy vey!
The post said:
“The April update to HadSST3 will appear later this month, but in the meantime, we can look at lower troposphere temperatures (TLT) from UAHv.6 which are already posted for April.”
That seems to indicate the timescale of interest here. In fact, SST data for April is already available, and I showed a result, and put it in the context of recent months. I’m not the one trying to show there has been a hiatus.
Anyway, actual measured SST (from ERSST V5) is on the way up, after a low point in December
…but still not as high as November
The joke never gets old either, because it’s telling of the zealotry of the religious: they will wriggle and writhe to explain away facts to fit their faith. Nick, give it up. You lost the reality game. It’s time to become an apostate, you know… Using logic and reason, not strictly parroting the memes of the faith.
But you won’t dare go against the grain, will you, you collectivist. You live in too much fear to give up your faith. It’s comforting. I bet you also chastise the Christians for being childish don’t you. Pot, meet kettle
Almost done. I find your lack of creativity and individualism, boring. Reminds me of a wonderful screened in the Thomas brown
Crown affair, where Renee Russo laments being a foregone conclusion. You, Nick, are the character Renee Russo portrays on this site.
It’s like watching a chess match between a seasoned savant and a third grader, except the third grader is more compelling because he may fart from nervousness
Duh. If December was the low point, then of course November would be higher. Thank you, Capt. Obvious
“It’s like watching a chess match between a seasoned savant and a third grader”
No, its like watching someone play chess against a flock of pidgeons.
Scott…you didn’t understand this conversation at all…did you?
“On the way up” how on earth can you know that?
This endless seeing of trends and assuming that what has happened indicates what will happen is absurd.
And I was just about to say “cue Nick and his pseudo-sciencey babble”.
Sure enough, you didn’t disappoint. You really are a one trick pony, aren’t cha?
I wish we could get some religionists with a better grasp on reality and reason, but then again, they wouldn’t be religionists would they?
Easy guys. I like having Nick around. Somebody needs to fight “group think” which takes over here just like anywhere else.
True story
Especially concerning GMO and similar health related issues.
Mary, thank you. I noticed it does happen here and I should know better than to be so crass. Thanks for the levity. 🙂
Mary Brown
May 9, 2018 at 11:42 am: Mary, the sheer evil of his and Mosher’s vicious attacks on Judith Curry when she tired of warmist untruths, puts aside any reason to be kind to their ideas…… Groupthink indeed, we know where that’s at.
This is one of those what does “most comparable” mean situations.
The UAH dataset does not measure the air temperature 1 meter above the surface of the oceans, so it clearly isn’t the same as the SST datasets.
I agree, but then again there really is no Global SST data. There are only a few moored buoys. These rest is free-floating ARGO buoys or sporadic ship intake data. And SST data is not the same as measurements taken on land one meter above the ground.
@Reg Nelson May 9, 2018 at 11:54 am
I agree.
Nick you can see a trend in a graph with enuf dots that blot out a complete circle. You are one piece of cake Nick. You would have been a great evangelist. You missed your calling.
Skeptics, please. Nick presented some data. If you think there’s something wrong with his data, or if you think it means something other than what Nick said it means, then please say so. Offering insults is not engaging in debate, and only wins the argument in the minds of those who make the insults..
How many times have I read (here and elsewhere) “alarmists only respond to questions about global warming with ad hominem attacks” (or words to that effect) Skeptics, please look in the mirror occasionally. Polite behaviour is free.
If you really feel the need to insult someone, Michael Mann is available, and deserves it. Al Gore too. And David Suzuki, definitely.
Nick, you beat me to it. See my comment at 1:01pm:
https://wattsupwiththat.com/2018/05/09/inconvenient-plateau-in-global-ocean-temperatures-persists/comment-page-1/#comment-2811894
Where I wrote,
Unfortunately for Ron Clutz, UAH Ocean Temps is NOT sea surface temperature, so the opening paragraph is meaningless.
Cheers
Not what I said Bob.
.07C? Worldwide? Can’t you get anymore accurate than that? Ridiculous!
Wow, to get temperature accurate to the 2nd decimal place must take some really, really precise instruments.
Where exactly are those?
Is that why there are no error bands?
Sod precision, what about accuracy?
Do people actually believe that they are measuring the temperature of the oceans to that accuracy? And that the temperature they are comparing it with to get an anomaly is that accurate?
To get a single number for even a slice of the global oceans for a period of time of a year or a month? We can’t even measure stuff we do, like government spending to anything like that level of accuracy.
You still do not understand that by averaging thousands of measurements from many places over a time periode, you will get some decimals.
“…by averaging thousands of measurements from many places over a time periode, you will get some decimals”.
Then take 1,000 measurements on a single sheet of paper, using a steel rule. Average and report back the thickness.
To use the theory of large number of measurements to improve precision, you need to measure the same feature with the same instrument over and over. That does NOT happen in the ocean. When the feature you are measuring is time dependent, by definition, you are measuring something different each time you measure. You cannot infer greater precision than the instrument is rated for and must truncate those extra decimal points.
Nick Stokes May 9, 2018 at 10:59 am “The UAH dataset includes temperature results for air above the oceans and thus should be most comparable to the SSTs.”
Not really. They measure a band peaked at about 4 km above the ocean.
–
Nick, Nick, Nick.
Why?
UAH measure a band from the ocean surface to 10 KM up.Which contains most of the water vapor in the atmosphere. This atmospheric product that gives a close comparison to surface temperatures.
If it includes temperature results for air above the oceans that would be the most comparable to SST we have.
–
Bob Tisdale May 9, 2018 at 1:22 pm and Bob Tisdale May 9, 2018 at 1:01 pm
Unfortunately for Ron Clutz, UAH Ocean Temps is NOT sea surface temperature, so the opening paragraph is meaningless.”
–
Bob, I appreciate your large volume of work in this area with WUWT in the past and ongoing I hope.
Not sure why you are upset with Ron.
Ron did not say UAH Ocean Temps is SST. Just close to it and comparable with it.
–
the temperature of the lower troposphere (TLT) that is measured by satellites. This is an estimate of the temperature over the lowest ten kilometres of the atmosphere, with a weighing function that emphasises the 0-4km layer.
The troposphere is the atmospheric layer closest to the planet and contains the largest percentage 80% of the mass of the total atmosphere. Temperature and water vapor content in the troposphere decrease rapidly with altitude. Water vapor plays a major role in regulating air temperature because it absorbs solar energy and thermal radiation from the planet’s surface. The troposphere contains 99 % of the water vapor in the atmosphere. Water vapor concentrations vary with latitude. They are greatest above the tropics, where they may be as high as 3 %, and decrease toward the polar regions.
Troposphere means “region of mixing” and is so named because of vigorous convective air currents within the layer.
“Troposphere means “region of mixing” and is so named because of vigorous convective air currents within the layer”

Lots of arm waving. But no-one actually checks to see how it works out.
Here is a plot of UAH global ocean vs HADSST3, to March 2018. Each is set to mean zero – ie anomaly base 1979 to now.
And here are the last five years
They aren’t at all the same.
The only problem is that the sea surface temperature is temperature and not total enthalpy. You would have to integrate over the temperature times the specific heat at a depth over the entire depth. For this reason, higher sea surface temperatures during an El Nino do not indicate additional heat storage. They just indicate that the heat is more evenly spread on the ocean surface since the warm surface is not driven west to stack up near Asia.
Logic would suggest that on the longer terms of climate (of centuries to millennia), the ENSO process will balance heat loss (El Nino) with heat accumulation (La Nina). Thus the more dominant El Nino pattern over the UAH v.6 ocean surface record will ultimately revert to the mean by a period of dominate La Ninas.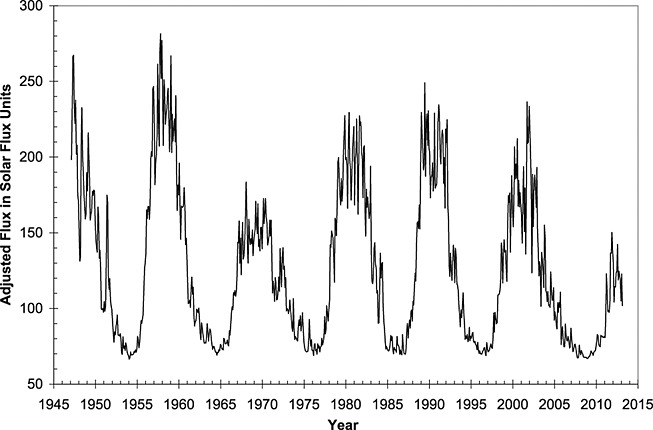
And simply examining the F10.7 flux record as a proxy for UV to efficiently warm the oceans would suggest continued measurable OHC declines are in the system already.
I do not disagree with that, but we are talking only a decade or so. I would feel better if it was a total enthalpy as computed by Argo floaters.
Joelobryan, is the graph yours? If not could you provide a link to the original graph (or the data). Furthermore, can you or someone else comment on how reliable the F10.7 flux is as a proxy for solar UV?
Average ocean depth is 5000 meters. If sea surface temperature adds 1 degree centigrade to the top 100 metres then redistributes this to depth it would be 1 degree divided by 500. I’m guessing we would have difficulty measuring the effect.
Oops …1/50 th of a degree.
They can’t even measure the surface temp accurately. But Nick can tell to within 7/100’s of a degree anyway. Like Michael Mann, the tree ring whisperer. Pretty much climate Jedi masters.
Au Contraire! WUWT is loaded with articles about the future .. starving polar bears, deadly heat waves, no more snow for England and the list goes on and on.
“I love the smell of uncertainty in the climate change morning.”
(Apologies to Lieutenant Colonel Kilgore)
Sadly, though uncertainty doesn’t seem to stick to kids at GISS.
It takes a Flatearther savant such like Trenberth to forget that Ocean DOMINATES in climate, a thing that the dumbest living not far away from the sea know well. It moderates weather, turning it cooler in summer and warmer in winter. Ocean is a huge heat reservoir, ~50 bigger than atmosphere. It takes huge time to heat it up or to cool it down. There is just no way a “GHG global warming” of atmosphere and surface can develop in a few decades, this would take millennia. So if “global warming” actually occurs at such small time scale, it can only be meaningless random variations, driven by just as meaningless variations in heat transfer process between ocean and atmosphere.
********************************************Correction to another poster*****************************************8
The amount pf heat in the oceans is 1000 times the amount of heat in the atmosphere.
Which mens , what paqyfelyc said X 20
For the up/down/”back” radiation of greenhouse theory’s GHG energy loop to function as advertised earth’s “surface” must radiate as an ideal black body, i.e. 16 C/289 K, 1.0 emissivity = 396 W/m^2.
As demonstrated by my modest experiment the presence of the atmospheric molecules participating in the conductive, convective and latent heat movement processes renders this ideal black body radiation impossible. Radiation’s actual share and effective emissivity is 0.16, 63/396.
Without the GHG energy loop, radiative greenhouse theory collapses.
Without RGHE theory, man-caused climate change does not exist.
http://www.writerbeat.com/articles/21036-S-B-amp-GHG-amp-LWIR-amp-RGHE-amp-CAGW
https://principia-scientific.org/experiment-disproving-the-radiative-greenhouse-gas-effect/
The oceans radiate at their surface temperatures. At the water (or ice) interface with air, the air will be saturated with water vapor in both evaporating or condensing conditions. The same is true in clouds. So measured dew point/frost point change rated near the surface is a better indicator of energy flow than air temperature/
Sounds like it’s time to adjust some data. Or perhaps change the way it’s measured.
Make sure to stop when the desired result is achieved.
Almost 20 years ago, following a very strong El Nino, temperatures fell back to slightly higher than they were before that event, just as expected. This spawned the narrative of a “pause”, yet temperatures continued to rise. Isn’t this just repeating the same mistake?
Alarmmmmmmmmmmmmmmmmmmmmmmm
Every time published data by NASA show no warming they shut down the information or the project that measures it
In 2009 Hansen shut down the H2O measuring project after 20 years of showing no increase.
Now for atmospheric temperature data they have made the interactive graph inoperable.
https://ghrc.nsstc.nasa.gov/amsutemps/amsutemps.pl?r=003
If this trend keeps continuing NASA wont have anything left to show except their fraudulent combined land sea surface temperature graphs which Tony Heller has proved are a complete fake.
“In 2009 Hansen shut down the H2O measuring project after 20 years of showing no increase”
As false as it always was. And still not a shred of evidence offered. Ever.
” they have made the interactive graph inoperable”
That has been out for at least five years, when a satellite instrument failed. But you can’t blame GISS for that one. If you look at the page, bottom left, it says
Page authors:
Dr. Roy Spencer, NASA
Dr. Danny Braswell, UAH
But you have to disprove it remember?
You make a claim, then the people who say “rubbish” have to show it is false. That’s the New Science, Nick.
So go ahead, you disprove the claim about Hansen. Otherwise it must be true, right?
“You make a claim, then the people who say “rubbish” have to show it is false. That’s the New Science, Nick.
So go ahead, you disprove the claim about Hansen. Otherwise it must be true, right?”
Wrong, the person making the original claim should provide evidence – so in this case, evidence that Hansen shut down the project because it wasn’t showing an increase.
Unfortunately for Ron Clutz, UAH Ocean Temps is NOT sea surface temperature, so the opening paragraph is meaningless.
Where did Clutz get his air temp graph of near sea surface temps by UAH? I cant find it anywhere Anthony you shoudnt post any article graphs unless the source is clearly indicated.
I’m all for encouraging people to give sources. But in fact the standard UAH data file gives regions broken into land and ocean component. They still aren’t “near sea surface”.
Nick is correct that the UAH archive provides land and ocean components for each region, and also a combined (weighted average) value. So the combined value is between land and ocean, but usually a bit closer to the ocean value. It is a rather poor proxy for ocean temperatures, because it is based on microwave soundings from the lower troposphere, which peak around 4.5km above sea level.
But I did a little googling and I am thinking Clutz’s plot is a copy of a very similar plot on Calvin Beisner’s ‘Cornwall Alliance’ blog dated 2 Feb 2017, which referenced Roy Spencer’s January 2017 UAH temperature update:
http://www.drroyspencer.com/2017/02/uah-global-temperature-update-for-january-2017-0-30-deg-c/
It turns out that Clutz used this same plot style in an April 2017 article, but with the plot titled “Monthly Temperatures” instead of “Ocean Temperatures”. Again with no citation except “UAH v.6”.
https://rclutz.wordpress.com/2017/04/04/march-air-and-sea-temps/
Of course, there is no “dot-six” UAH version. It’s UAH V6.0!
So this latest Clutz plot above merely extends the 2017 plot with Spencer’s latest 2018 data:
http://www.drroyspencer.com/2018/ [look for 1 May update]
😐
… oops, forgot to include the Cornwall Alliance URL:
https://cornwallalliance.org/2017/02/did-the-pause-end-or-did-el-nino-interrupt-it/
Cornwall Alliance is an evangelical voice promoting environmental stewardship and economic development built on Biblical principles.
Wow. Science might not explain everything but religion/superstition doesn’t explain anything.
Religion explains who we are.
“Religion explains who we are.”
No, it doesn’t. It only does that for those who choose to believe in it.
Man is a religious animal. Knowing a person’s religion can explain a lot about that person’s beliefs and behavior, even if you don’t share those beliefs.
Everyone is religious, more or less.
One could even argue that Climatism is a religion, with its own peculiar notions of Original Sin [fossil fuels] and Redemption [spread the wealth].
The link “Who to Blame for Rising CO2?” was actually more interesting… I’ve pointed out before that the Mauna Loa trend is way too smooth to be dominated by human emissions (it would require a lot of coincidental behavior from the sinks for this to work out mathematically, as opposed to natural processes dominating).
The 14C data always seemed like their strongest argument, but as you demonstrate it’s not hard to build a model that explains the 14C levels without human influences dominating the CO2 trends. Even a cursoary examination of some of the assumptions in the NOAA link below reveals some serious gaps in our knowledge.
https://www.esrl.noaa.gov/gmd/outreach/isotopes/c14tellsus.html
Ron Clutz, I’ll be interested in seeing your graph of HADSST3 starting in Jan 1995 through April 2018, when the HADSST3 data are updated so that we can compare it to this graph you’ve posted:
 ?ssl=1
Why? Because HADSST3 from Jan 1995 to March 2018 shows a positive linear trend of 0.125 deg C/decade. In other words, there is no continuing hiatus.
Chocolate rations up again, just like the trend in global temperatures.
British farmers in turmoil as delayed spring plays havoc with growing season
-Guardian, April 15, 2018
It’s the coldest and snowiest April on record near the Great Lakes, and residents are ‘fuming’
-WaPo April 18, 2018
World wine output falls to 60-year low
Reuters, April 24, 2018
(frost and storms to blame)
The Midwest and Great Lakes just endured a historically cold April
-WaPo, May 1, 2018
Toasty, isn’t it?
I wish I could find a thermometer that has three decimal points to accurately measure the temperature of my system that never reaches thermal equilibrium – event though a system that hasn’t reached equilibrium doesn’t have a meaningful temperature.
I still want that thermometer–just to fool myself with three decimal places of precision.
Why not?
Khwarizmi
May 9, 2018 at 4:04 pm
Even if you average thermometer measurements without decimals from different loctions over a certain time lenght, you will surely get some decimals.
If you average thermometer measurements all what you get is meaningless, not just the decimals.
Khwarizmi
Thermometers reading 0.001 C…
They are expensive and calibration is a big issue. Even if you had one you’d be hard pressed to convince me you knew how to manage it.
The standard minimum requirement for measurements is three times the claimed resolution so you’d have to have some way of showing the measurement was indistinguishable from a reference device at a precision of 0.0003 degrees, preferably 0.00033 C.
Nearly all the claims for small warming and cooling numbers are examples of false precision. No scientific statement is complete without the properly expressed uncertainty as a suffix. Gavin’s famous ‘warmest year evah’ anomaly of +0.001 degrees with 38% confidence is laughable in the real world of metrology.
Bob,
I am a little surprised at your sloppy reasoning here. Yes, there is a slight positive linear trend if you do not take into account short-term variations introduced by El Nino events. However, if you filter these out events fully e.g. by allowing for another year or so’s worth of static or slightly cooling temperatures, you might get a slightly different picture.
I suppose if you filter out all the natural ocean warming events but leave in all the natural ocean cooling events you can reduce the ocean warming trend somewhat.
Already posted.
Whoops, forgot to link to updated April HadSST3
https://rclutz.wordpress.com/2018/05/09/apr-2018-ocean-cooling-delayed/
Who knew HadSST update would come 10 days earlier than last month? Anyway, it appears cooling is on hold for the moment. Clearly we are past the last El Nino, but as always the question is: Will there be a step up to a higher level, a return to the previous level, or a step down to a cooler level?
Ron C got this completely wrong. Pielke Sr was talking about ocean heat content, not ocean SSTs.
Wow. Impressed. I never thought I would be agreeing with the Tisdale. You actually sound like a REAL skeptic. Not a den1er skeptic.
I follow this discussion more or less breathless. When it comes to the modern SST I prefer the “Reynolds” set ( http://www.emc.ncep.noaa.gov/research/cmb/sst_analysis/ ) . This gives ( included April 2018) this picture:
(Thanks to the KNMI Climate explorer)
The core is: There is a warming of about 0.2 °C in the periode 1990…2018. Nothing else matters!
PS: With appologies to “Metallica” 1991! 🙂
frankclimate
I downloaded that Reynolds data from KNMI. The linear warming from Jan 1990 to Apr 2018 is 0.31 °C, or 0.11 °C/dec, which is just a little slower than HadSST over the same period (0.38, or 0.14 °C/dec).
“The standard minimum requirement for measurements is three times the claimed resolution so you’d have to have some way of showing the measurement was indistinguishable from a reference device at a precision of 0.0003 degrees, preferably 0.00033 C.”
The calibration should also be checked before and after the measurement to correct for any drift. The reference device should NIST traceable.
“anomaly of +0.001 degrees with 38% confidence is laughable in the real world of metrology.”
Lets see, does that mean 1/2 sigma? Isn’t that a little low? Particle physics scientist want 5 sigma to declare the discovery of a new particle don’t they?
Not even a mention of the long cycle implications here?
http://www.climate4you.com/images/NOAA%20SST-NorthAtlantic%20GlobalMonthlyTempSince1979%20With37monthRunningAverage.gif
Ron Clutz writes, …… to wit
The “latter points” noted by Ron Clutz, ….. to wit:
Title: Who to Blame for Rising CO2? —– Author: Ron Clutz
Source url: https://rclutz.wordpress.com/2018/04/13/who-to-blame-for-rising-co2/
1st excerpt, to wit:
So, given the above, ……
iffen the SST (sea surface temperature) increases at the start of month #1, …..
then the air temps will increase at month #2 or 3, …….
then the CO2 ppm will increase at month #11 or 12 …….
“HA”, so the above claim is that the ocean water WILL NOT begin outgassing CO2 until 11 or 12 months after the surface water has warmed up a few degrees.
“DUH”, is the above cited claim not directly contrary to Henry’s Law, …… the Open Soda Pop Bottle Law, …… as well as the Open Can of Beer Law?
It shur doesn’t take 11 or 12 months for an open can of cold beer to go “flat” (devoid of the fizz of CO2).
2nd excerpt, to wit:
”Appears to be” to the PC compliant and the near-sighted, ….. but a literal fact of science to others, ……. that the main control for changes in atmospheric CO2 ppm quantities is the changes in temperature of the ocean surface water.
And that afore stated “literal fact of science” includes both the bi-yearly (6 months – seasonal) increases/decreases in CO2 ppm, …… as well as the afore cited “overall increase” (yearly average increase) in CO2 ppm as denoted by the Mauna Loa data and/or the Keeling Curve Graph.
“DUH”, the CO2 ppm doesn’t increase 6 months after the “seasonal” warming of the SH ocean water , ……… it increases “daily” along with the “daily” increase in SH ocean water temperature.
It’s complicated by the fact that NH waters are cooling in absolute terms while SH waters are warming in absolute terms. Then too, more of the ocean is in the SH. As usual, the mechanisms and dynamics are hidden when looking at global averages.
Ron Clutz – May 10, 2018 at 10:47 am
Ron C,
I was quite pleased to read that you were not only aware of the above two (2) “highlighted” facts of science ……. but also appear to recognize and understand their dominating importance in determining the quantity of atmospheric CO2 ppm as measured/recorded at the Mauna Loa Observatory.
And “Yes”, the mechanisms and dynamics that are “driving” the ingassing/outgassing of atmospheric CO2 are hidden from being observed unless one in looking at the correct “drivers” …… and the Northern Hemisphere seasonal and/or near-surface temperatures, …….. nor the Northern Hemisphere seasonal growth and/or decay of green-growing biomass, …… nor global averages near-surface temperatures ARE NOT the correct “driver” to be looking at.
For starters, one needs to be looking at this modified copy of the Keeling Curve Graph, to wit:
http://i1019.photobucket.com/albums/af315/SamC_40/keelingcurve.gif
As one can readily see via the plotted CO2 data, the biyearly cycling of CO2 ppm (average 6-8 ppm) is directly correlated with the seasonal temperature change of the SH ocean water …… which occurs following the changing of the equinoxes …… and the overall yearly average increase in CO2 ppm (average 1-3 ppm) is directly correlated with the post-LIA “warming” of the ocean waters.
Cheers, Sam C
Ron Clutz, the NH ocean is cooling? According to what data?
The great overturning has started.
The day of editors.
Ron Clutz writes at Science Matters:
Years ago, Dr. Roger Pielke Sr. explained why sea surface temperatures (SST) were the best indicator of heat content gained or lost from earth’s climate system.
No, he didn’t. He said that OCEAN HEAT CONTENT was the best indicator of global warming.
Please read his Physics Today article from back then. Let me know if you need a citation.
Here’s Pielke Sr’s Phy Today paper:
http://www.atmo.arizona.edu/students/courselinks/fall09/atmo336/lectures/sec5/Pielke_PhysToday_Nov2008.pdf
Note the paragraph that begins, “The ocean, of course, is the largest reservoir….”