By Andy May
It’s more likely mostly due to both, but that isn’t really the question. Virtually everyone accepts that climate changes and that CO2 and methane are greenhouse gases; and probably everyone remembers from grade school that the Sun is a variable star. The debate is over how much of recent global warming is due to the Sun, either its internal variability or changes in the Earth’s orbit, and how much is due to human greenhouse gas emissions, mostly from fossil fuels?
The role of the oceans
Global short-term weather patterns (<30 years) are driven by the oceans, especially ocean oscillations like the El Nino/Southern Oscillation (ENSO), the Pacific Decadal Oscillation (PDO), and the Atlantic Multidecadal Oscillation (AMO) (NOAA 2018). Some portion of longer-term climate changes (>100 years) may be driven by the thermohaline circulation (THC). This is a process where surface ocean water becomes dense enough to plunge deeper in the ocean and join the meridional overturning circulation (MOC) currents that carry deep water around the world. This exchange of surface for deep and later deep for surface waters mainly occurs in the polar regions, where deep water is ventilated and equilibrates with the atmosphere. Probably the only exception to polar overturning is in the mostly isolated Mediterranean Sea. The driver for the overall THC is high latitude cooling of sea water, although salinity also plays a role. This slow set of deep ocean currents contains over half the water in the oceans and has a temperature of less than 4°C due to its ties to the polar oceans. The currents complete a worldwide trip in a thousand years or more (Rahmstorf 2006). A diagram of the process in the Atlantic is shown in figure 1 from Rahmstorf, 2006. The speed of the THC and AMOC varies and climate varies with it.

Another process, ocean CO2 uptake, may also contribute to longer term climate changes. The solubility of CO2 in water increases as the water temperature drops. When temperatures drop, as they did in the Little Ice Age, more atmospheric CO2 is taken up by the ocean and this accelerates the temperature drop. The reverse occurs when temperatures rise, as they have recently.
Still another contributor to long-term natural climate variability are the longer tidal cycles (Berger and Rad 2002). These tidal cycles disrupt the ocean stratification, allowing warm water surges under sea-ice that cause the ice to melt from the bottom. In glacial periods, this melting results in a release of considerable thermal energy since warm water trapped under the ice is ventilated. The effect on the climate is a function of the original extent of the sea ice, so it is more noticeable during glacial periods. The effect of the vertical tidal mixing of the oceans is less predictable in interglacial periods. The basic unit of the lunisolar tidal cycle is 375 years and the largest impact is seen every 1,500 years or every fourth beat of the cycle. The cycle is caused by the Moon’s nodal and apsidal orbital precession. For more discussion of this see the cited article by Berger and von Rad or Javier’s post: Nature Unbound V.
The world ocean contains 99.9% of the surface thermal energy on the Earth, the atmosphere contains 0.07% of the energy. Thus, while atmospheric processes often dominate the weather over short periods of time (2 weeks or so), the climate is dominated by the oceans. While oceans drive our climate, what drives changes in the oceans? They have no interior energy source. They collect most of the solar energy that makes its way to the Earth’s surface, as well as most of the thermal energy radiated toward the Earth by atmospheric greenhouse gases. Except for cosmic rays, a little thermal energy supplied by submarine volcanos and the occasional bolide (meteor) impact, that’s it.
The two hypotheses
So, we will look at two hypotheses that can supply the energy necessary to drive ocean and climate changes. In this post we discuss the greenhouse gas hypothesis. In this hypothesis the concentration of greenhouse gases, or more precisely “Infrared active gases” in the atmosphere, especially carbon dioxide, control the climate. As carbon dioxide is added to the atmosphere, through burning fossil fuels, the atmospheric temperature goes up and this increases the specific humidity of the atmosphere through the Clausius-Clapeyron relationship. The added water vapor acts as a positive feedback and the temperature goes even higher. Specific humidity or absolute humidity is the volume fraction of the atmosphere that is water vapor.
The IPCC AR5 WG1 Physical Science Basis Report calls CO2 the “main anthropogenic control knob on climate” on page 667 (IPCC 2013). Although water vapor is more abundant in the atmosphere and a more powerful greenhouse gas, it is considered less important than CO2 since, under this hypothesis, the temperature of the air is primarily controlled by the fraction of CO2 and other, less important, noncondensable, infrared active gases like methane. This is discussed in the FAQ 8.1 on pages 666-667 in the IPCC AR5 WG1 report (IPCC 2013).
In the next post (Part B) we will discuss the solar variability hypothesis which contends that solar variability controls the climate. There are several things that can change the radiation we receive significantly. The Earth’s orbit and tilt relative to the orbital plane varies over time and these factors change the amount of solar radiation striking the Earth and where it strikes on the Earth, this is explained well in Javier’s post “Nature Unbound III; Holocene climate variability (Part A)” (Javier 2017). Figure 2 graphically shows the components of the Earth’s orbit.

The strength of the Earth’s magnetic field and the solar magnetic field change with time and they interact in complex ways that are not fully understood, but these magnetic fields control the number of cosmic rays that strike the Earth. This affects our weather (Svensmark, et al. 2017) (J. Svensmark, et al. 2016) and maybe our climate by increasing or decreasing cloudiness. The number of cosmic rays striking the atmosphere is recorded in the berylium-10 and carbon-14 cosmogenic isotope record. Berylium-10 (10Be) is stored in ice cores and carbon-14 (14C) is stored in tree rings.
The number of sunspots has been found to correlate with both cosmic ray created (cosmogenic) isotopes (10Be and 14C) and with historical climate changes, as well as global temperature proxies, such as glacial advances, biological temperature proxies and oxygen-18 (18O) temperature proxies. Thus, it is assumed that sunspot records provide a long-term measure of some significant component of solar activity. It isn’t clear exactly what the number of sunspots means, but whatever it is, it does seem to correlate, to some degree, with climate.
Which hypothesis dominates climate change? Do both act on the climate equally? Are there other processes that are important? The debate on climate change is about “how much.” How much is natural or based on the amount of solar radiation striking the Earth, discussed in Part B of this series? In this post we discuss what we know about how much is due to humans burning fossil fuels and extracting or making methane gas. While researching these posts, we found that we really don’t know much about “how much.”
The Greenhouse Gas Effect (or CO2 effect) hypothesis
There are many definitions of the “greenhouse effect” (GHE) and they often conflict with one another when examined in detail. Even the more specific phrases, the “CO2 GHE” or the “CO2 enhanced GHE” are frequently conflated with each other, causing confusion. It has been asserted, by the IPCC and others, that the CO2 GHE might be dangerous. How much evidence is there to support this assertion?
Douglas Fischer proposed in Scientific American (Fischer 2009) that man’s emissions of carbon dioxide, from burning fossil fuels, could eventually cause the whole planet to warm to a dangerous temperature. Fischer writes:
“
[Global climate] models do suggest that failure to stem industrial exhaust will push global temperatures four degrees Fahrenheit above today’s readings – well beyond a threshold many scientists fear will produce dreadful consequences.”


The U.S. EPA stated in a press release December 7, 2009 (EPA 2009):
“… U.S. Environmental Protection Agency (EPA) announced today that greenhouse gases (GHGs) threaten the public health and welfare of the American people. EPA also finds that GHG emissions from on-road vehicles contribute to that threat.
GHGs are the primary driver of climate change, which can lead to hotter, longer heat waves that threaten the health of the sick, poor or elderly; increases in ground-level ozone pollution linked to asthma and other respiratory illnesses; as well as other threats to the health and welfare of Americans.”
The EPA calls this their “endangerment finding” and they list six key greenhouse gases, carbon dioxide, methane, nitrous oxide, hydrofluorocarbons, perfluorocarbons, and sulfur hexafluoride that they consider dangerous because they act to warm the atmosphere. More details on their finding are given in an action report (EPA 2010).
James Hansen (NASA, as quoted in Fischer’s Scientific American article cited above) once said “We are now completely in charge” of the climate. He also said, “We’re much more powerful than the natural forces.” Just like the IPCC (see above), Lacis, et al. have written in the journal Science that atmospheric CO2 is the principal control knob for climate change (Lacis, et al. 2010). As we will see, the impact of carbon dioxide on the Earth’s climate has never been measured in nature. This is true despite numerous attempts. The estimated range of the impact of doubling CO2 (the “ECS” or equilibrium climate sensitivity) remains at 1.5° to 4.5°C, precisely where it was in the Charney Report in 1979 (Curry 2017). The statements by Hansen and Lacis, et al. and the EPA’s proclamation are based on the UN IPCC fourth (IPCC 2007) and fifth assessment (IPCC 2014) reports and computer climate model results (Johnson 2009).
Most scientists who study climate look to the UN IPCC as a source of well-reviewed data and analysis, so we will discuss their definition of the “greenhouse effect.” In the glossary of their fifth report they define it as follows:
“The infrared radiative effect of all infrared-absorbing constituents in the atmosphere. Greenhouse gases, clouds, and (to a small extent) aerosols absorb terrestrial radiation emitted by the Earth’s surface and elsewhere in the atmosphere. These substances emit infrared radiation in all directions, but, everything else being equal, the net amount emitted to space is normally less than would have been emitted in the absence of these absorbers because of the decline of temperature with altitude in the troposphere and the consequent weakening of emission. An increase in the concentration of greenhouse gases increases the magnitude of this effect; the difference is sometimes called the enhanced greenhouse effect. The change in a greenhouse gas concentration because of anthropogenic emissions contributes to an instantaneous radiative forcing. Surface temperature and troposphere warm in response to this forcing, gradually restoring the radiative balance at the top of the atmosphere.”
Thus, the IPCC divides the definition into two parts. The “greenhouse effect” is the impact of greenhouse gases on surface temperature in general, an effect that has been around for many hundreds of millions of years, and the “enhanced greenhouse effect” is the additional effect caused by increasing the concentration of greenhouse gases, particularly CO2. They do not discuss, in this definition, any other mechanisms for increasing the average surface temperature of the Earth. Water vapor is a greenhouse gas and can store thermal energy for a long time as latent energy (heat). Carbon dioxide is a noncondensing gas at normal temperatures and immediately radiates any energy it absorbs. That energy will warm a nearby body, via heat transfer, that is at a lower temperature. The radiated energy can excite other molecules causing work to be performed through wind or current motion, this movement of mass can potentially add or subtract thermal energy in an object, or the surface of the Earth. The net effect of additional greenhouse gases is to slow the natural cooling of the surface of the Earth to outer space.
Another quote, from Lacis, et al., takes the IPCC AR5 line of reasoning a little further (Lacis, et al. 2010):
“The difference between the nominal global mean surface temperature (TS =288K [15°C]) and the global mean effective temperature (TE= 255K [-18°C]) is a common measure of the terrestrial greenhouse effect (GT = TS – TE = 33 K). Assuming global energy balance, TE is also the Planck radiation equivalent of the 240 W/m2 of global mean solar radiation absorbed by Earth.”
The temperature Lacis, et al. call “TE” is the same as the calculated blackbody temperature of the Earth. If we assume the Earth is a blackbody, then the Earth emits as much radiation as it receives and is a perfect energy absorber. This also means we are assuming the Earth’s surface has a constant temperature and is at thermal equilibrium with its surroundings. Thus, Lacis, et al.’s TE of 255K, assumes that the Earth is a blackbody that emits and receives 240 W/m2, in the absence of greenhouse gases. The Earth is not a blackbody, it is colored (or a “gray body”), and the atmosphere is a different gray body. The Earth is also a rotating sphere that has circulating oceans that contain most of the thermal energy stored on the surface. While the blackbody assumption is flawed, it is commonly used as a device to “compute” the greenhouse effect. This contrivance is mainly used to pretend we know what the greenhouse effect is and its magnitude, however nothing could be farther from the truth.
Equilibrium Climate Sensitivity (ECS) to a doubling of CO2
It has been useful to boil down the effect of increasing the atmospheric carbon dioxide concentration to a single number. The equilibrium climate sensitivity (ECS) is the temperature response to a sudden doubling of carbon dioxide concentration after the oceans have reached equilibrium with the new atmospheric temperature. There are several ways to compute this. The IPCC, as reported in AR5 (Chapter 10, figure 10.1, page 879), prefers to compare two climate model computer runs (IPCC 2013). One model run applies only to estimated natural climate forcing and the other adds an estimated forcing from human-generated carbon dioxide emissions and other human activities. They take the difference in the final modeled temperature after 150 years as ECS. Figure 3 illustrates the IPCC calculation of the effect of human greenhouse gas emissions, mainly CO2. It is entirely model-based and makes many assumptions; the most significant assumption is that the only natural climate forces are their estimate of total solar irradiance (TSI) and volcanic eruptions for the period shown (Lewis and Curry 2015).

The IPCC estimate of natural climate does not include the impact of longer ocean oscillations such as the Pacific Decadal Oscillation (PDO), the Atlantic Multidecadal Oscillation (AMO), and it does not model the El Nino/Southern Oscillation (ENSO) successfully. These oscillations in ocean surface temperature can have long time frames, up to 60-65 years (see Javier’s post here for a discussion of this), and the AMO has distinct peaks around 1875, 1940, and 2005; the latter peak could account for some of the warming shown in Figure 3. It is instructive that the global warming experienced between 1910 and 1940 is not successfully modeled by either the CMIP3 (blue) or the CMIP5 (red) model ensembles, see Figure 4. For more on the poor model fit of this period, see here.

Another potential problem with the IPCC natural variability estimate is the considerable uncertainty in the amount of thermal energy (heat) that is absorbed by the oceans, often called ocean heat uptake (OHU) (Lewis and Curry 2015). However, regardless of these uncertainties, the IPCC AR5 WG1 report estimates that natural variability (NAT) and internal natural climate variability are zero with low uncertainty as shown in Figure 5.

Proistosescue and Huybers, report in Science Advances that observationally based estimates of ECS based on historical instrument records (which only go back to 1850 or so) fall in the range of 1.5° to 3°C, much lower than estimates from global climate models (GCM) (Proistosescu and Huybers 2017). They include the estimate of 1.5° to 4.5°C by the IPCC. Proistosescue and Huybers write that currently the world is not at climate equilibrium and is taking up between 0.1 and 0.9 W/m2 more thermal energy than it loses. As a result, they do not believe that observationally based estimates of ECS are valid. They used a group of GCM simulations to compute an ECS range of 2.2° to 6.1°C, with a most likely ECS of 3.5°C per doubling of CO2. This technique has the same problems as the one used by the IPCC in that it assumes the natural climate forcings and sources of internal variability are known and accounted for accurately. It also assumes the precise impact of carbon dioxide and the carbon dioxide feedbacks are known. They are saying, in effect, ignore the data and use my computer model.
An example of an observationally based estimate of ECS is the work of Nic Lewis and Judith Curry, published in Climate Dynamics (Lewis and Curry 2015) where they derived a tight cluster of ECS estimates from 1.64° to 1.72°C per doubling of CO2. Lewis and Curry later updated this study in (Lewis and Curry 2018) where they derived an ECS of 1.5°C to 1.67°C. These estimates are close to the estimates by Otto, et al. that range from 1.91° to 2.0°C (Otto, et al. 2013). The base period 5-95% uncertainty estimate from Lewis and Curry is 1.05° to 2.45°C. The periods they used for the calculation are 1869-1882 and 2007-2016. Thus, these estimates account for the shorter ocean oscillations, but not the longer “internal variability” ocean oscillations involving the deep ocean waters, such as the ~1,500-year cycle described by Debret, et al. in Quaternary Science Reviews (Debret, et al. 2009). The cycle Debret, et al. describe may be due, in part, to the thermohaline circulation; but this is still controversial. Figure 6 is from Otto, et al. and plots the observational constraints on ECS using data from various recent decades. It shows that recent temperature changes and measured carbon dioxide increases suggest an ECS of around 2°C. This rough calculation was expanded and refined by Lewis and Curry in 2015 and in 2018.

Other researchers have used satellite data to estimate the CO2 climate feedback factor and assume a direct CO2 forcing of 1.1°C per doubling of CO2, from laboratory measurements, absent any feedbacks. This was done by Lindzen and Choi who reported an ECS of 0.7°C (0.5° to 1.3° 99% confidence interval) in the Asia-Pacific Journal of Atmospheric Sciences using this technique (Lindzen and Choi 2011).
All these methods make many assumptions and use models that can be challenged. However, the pure computer model approach used by the IPCC and Proistosescue and Huybers seems to be the weakest to this author and their estimates stand alone at the very high end of recent estimates. The more direct observationally-based methods like those used by Lewis and Curry, Lindzen and Choi, and other similar estimates all produce lower estimates of ECS. While it is true, as written by Proistosescue and Huybers, that the climate today is not at equilibrium, I doubt it has ever been in equilibrium over periods shorter than 60 years (for example 1951-2010), except by accident. In any case, model estimates cannot and should not be taken over direct measurements. Recent reasonable estimates of ECS, based on measurements, range from 0.7° to 2°C, this suggests two things. First, we have no reliable estimate of how much our fossil fuel CO2 is affecting the climate; and second, observations suggest that the impact of the additional CO2 will not be a problem. It is possible to create a model that will make it appear to be a problem, but that is not cause for alarm.
As I wrote in my new book Climate Catastrophe! Science or Science Fiction?
“As mentioned above … 99.9 percent of the Earth’s surface heat capacity is in the oceans and less than 0.1 percent is in the atmosphere. Further, CO2 is only 0.04 percent of the atmosphere. It beggars belief that a trace gas (CO2), in an atmosphere that itself contains only a trace amount of the total thermal energy on the surface of the Earth, can control the climate of the Earth. This is not the tail wagging the dog, this is a flea on the tail of the dog wagging the dog. Extraordinary evidence is needed to convince us of this hypothesis. Since the impact of man-made CO2 on climate has never been measured and is only crudely estimated with unvalidated models, the jury is still out on this idea.”
In the next post, “Part B,” we will discuss the impact of solar variations on the climate.
The bibliography can be downloaded here.
The data used to make many of the figures in this post can be downloaded here.
Andy May has just published his first book: “Climate Catastrophe! Science or Science Fiction?” It is available from Amazon.com and barnesandnoble.com.
Javier provided many helpful comments on this post.
K-T and assorted clone diagrams of atmospheric power flux balances include a GHG up/down/”back” LWIR energy loop of about 330 W/m^2 which violates three basic laws of thermodynamics: 1) energy created out of thin air, 2) energy moving (i.e. heat) from cold to hot without added work, and 3) 100% efficiency, zero loss, perpetual looping.
One possible defense of this GHG loop is that USCRN and SURFRAD data actually measure and thereby prove the existence of this up/down/”back” LWIR energy loop. Although in many instances the net 333 W/m^2 of up/down/”back” LWIR power flux loop exceeds by over twice the downwelling solar power flux, a rather obvious violation of conservation of energy.
And just why is that?
Per Apogee SI-100 series radiometer Owner’s Manual page 15. “Although the ε (emissivity) of a fully closed plant canopy can be 0.98-0.99, the lower ε of soils and other surfaces can result in substantial errors if ε effects are not accounted for.”
Emissivity, ε, is the ratio of the actual radiation from a surface and the maximum S-B BB radiation at the surface’s temperature. Consider an example from the K-T diagram: 63 W/m^2 / 396 W/m^2 = 0.16 = ε. In fact, 63 W/m^2 & 289 K & 0.16 together fit just fine in a GB version of the S-B equation.
What no longer fits is the 330 W/m^2 GHG loop which vanishes back into the mathematical thin air from whence it came.
“Their staff is too long. They are digging in the wrong place.”
“There is no spoon.”
And
The up/down/”back” GHG radiation of RGHE theory simply:
Does
Not
Exist.
Which also explains why the scientific justification of RGHE is so contentious.
http://www.writerbeat.com/articles/21036-S-B-amp-GHG-amp-LWIR-amp-RGHE-amp-CAGW
Another huge flaw here is in the first sentence. W is a “radiative gas” as is CO2, not a “greenhouse gas.” Just because they renamed them “greenhouse gases” does not mean that they warm the atmosphere to any detectable degree.
Water vapor in a nonconvective situation might cause warming, but in the real world, water is part of the water cycle. The evaporation, upward flow of warm, humid air, condensation at altitude, loss of IR to space, and precipitation is responsible for roughly 85% of the movement of the energy from solar input to the surface away from the surface. This is a huge negative feedback heat engine, yet it is ignored totally in these discussions. Also, with any warming, water evaporation increases and this heat engine ramps up, carrying heat more rapidly, which is why our climate is to constant and stable, only responding to changes in major energy sources, such as the Sun and ocean cycles.
As radiative gases, they are saturated and absorbing and vice versa in sunlight, basically having no effect, nothing detectable. It is at night that these gases convert heat energy in the atmosphere to IR radiation which is then lost to space. These gases COOL the atmosphere, which is why the air chills so quickly after sundown and small breezes kick up so quickly in the shadows of clouds on a sunny day, reflecting how fast these gases cool the air.
Until the water cycle is properly accounted for in these energy budget diagrams, the results they get are meaningless.
higley7 the warming police will not allow that. We are warm because of GHGs. Repeat 1000 times each night before going to bed. And do NOT bring up latent heat of vaporization because it’s all about radiation, radiation, radiation, radiation (repeat 1000 times when waking.)
Also according to the “Guest essay by Dr Doug Hoyt” linked to below, water does not absorb the IR radiation emitted by the atmosphere. Read the section : “Comments on why the ocean isn’t absorbing thermal infrared energy”
http://www.warwickhughes.com/blog/?p=87
John
…..And to me, another interesting little tidbit is the approximately 9 degree Fahrenheit temperature fluctuation along the path of totality during the solar eclipse in August, 2017. The MEASURED fluctuation at the NWS station in Nashville, TN was a drop from 95 degrees Fahrenheit at the beginning of the eclipse to a low of 86 degrees, then a recovery to very close to the beginning readings. I emphasize: fluctuation MEASURED by NWS.
The best thing they have going…is they are able to make UHI look like global warming
I thought there were more than two possibilities.
I agree. Given the paleo proxies showing CO2 levels much higher than current levels, and the proxy temperatures for those levels, the estimates for climate sensitivity are likely the maximum effect for CO2, as whatever else is still in play.
+1!!! cBob 🙂
Yes, indeed, the title of the WUWT article with its false dichotomy is misleading.
Further,
Given:
CO2 UP. WARMING NOT.
The speculation that human CO2 does ANYTHING to cause significant, enduring, shifts in the climate zones of the earth is
at this point,
unproven (at best — and, given the anti-correlation evidence so nicely provided the the IPCC’s computer simulations, CO2 is more likely to NOT be a controlling climate driver)
In a word:
WATER
#(:))
Janice (welcome back) – ‘Water’
As I was sculling about this morning for the first time this year on beautiful flat water, I wondered if I can expect more extreme calm water due to climate change.
Also, if we were to consider a hypothetical 8 person crew team known as the ‘Photons’, wouldn’t the coach know that only those Photons that put additional energy into their stroke are making the boat move faster?
(Do reflected radiative photons have more energy than their source?)
Hello Janice long time no read. Hope you are fine
PERSONAL to:
Thomas H: Thank you. Thanks for taking the time to say “Hi” and share your wit and insight.
Stephen Richards: Hi! 🙂 Thank you for your kind greeting. I’m healthy, but, not really doing all that great (a big emotional sorrow in late March when someone very dear to me essentially told me to “get out of my life” (if I knew why… I might not be as sad… I can think of a very understandable possibility, but, with no articulation of that, I’m left with only a door slammed in my face and a lot of pain in my heart…) and now, unrelated to that, a personal housing crisis for me). God is providing plenty to eat, though, so, I’m okay. So is Davy dog. I hope that your lemon tree is thriving and pest-free this year! 🙂 Take care, over there.
Janice – Thanks for your reply. I’m saddened to hear of your sorrow. You made a comment on an article a short time ago and expressed your compassion for the tormented soul that took his life. That made an impact on me, you’re a caring soul. I hope you find solace soon.
Thank you, Thomas H.. Your concern warmed my spirit.
Ecactly
Agreed! The massive heat sink that the oceans represent virtually MUST have an effect on climate that coincides with the long term current flows that we know so little about. Only in “cloud climate land” would so much heat not be given any consideration in heat equations.
CommieBob, What other primary sources of energy for climate change are there, that are significant? I discuss the oceans moving energy around, but I don’t think they have a major source of energy other than sunlight. At least lately, submarine volcanism and GCR (galactic cosmic rays) do not seem to be a very large source of variability. The ocean cycles, both tidal and the MOC (marine overturning circulation) provide variation on 30 to 1,500 year periods, which matter. But what is the “forcing” for that? It is either solar or infrared active gases, right? I consider the oceans to be a secondary source.
There’s only one source of energy (ignoring geothermal). Everything else is ‘passive components’. It’s a complicated ‘circuit’ but there’s only one energy source. CO2, if it has any effect at all is a passive component.
When it comes to systems engineering and the associated math, James Hansen and the other climate scientists are complete, unmitigated, doofuses. “Forcing” is a bogus concept. Hansen’s use of feedback analysis is completely bogus.
There are no active components only passive. It is highly likely that much of the system is not linear and not time invariant. Repeating myself: there is one energy source and one energy source only. [/rant] Harumph!
RedRobert,
You insult all doofuses, sir!
True. While internal terrestrial heat sources are more or less constant over time, although tending very slowly to decline, the power of the sun varies considerably and is always gaining.
Here’s an example of the transient response of a ‘relatively simple’ completely passive system. It’s Figure 18 from “Transient waves in a thin sphere enclosing an acoustic medium from a moving planar pressure discontinuity”. The planet Earth could be described as concentric spheres enclosing an acoustic medium.
If the waveforms in the above ‘relatively simple’ system are messy, it’s easy to understand how our planet has such a complicated climate. The climate system involves time scales from seconds to the milankovitch cycles at around a hundred thousand years.
The planet’s climate is explainable as a completely passive system without invoking ‘forcing’ or ‘feedback’.
Red Robert,
Excellent physical analogy for Earth’s climate system.
Thanks!
Somehow we beat them even though they had a better anthem.
Andy, have you read Thirumalai et al 2018? While not a climate paper directly, it shows that the ocean heat (SSTs) appears to correlate with known warm/cool periods which we know correlate with solar variations (Lean 2018).
The paper also shows that these changes correlate with salinity changes. I do think the idea that
1) changes in solar induced evapotranspiration leading to
2) changes in ocean salinity leading to
3) changes in the MOC leading to
4) changes in SSTs leading to
5) changes in atmospheric temperatures may very well be the causative chain of events.
“primary sources of energy for climate change are there, that are significant?”
It is generally believed that the Earth is full of molten rock, which is kept molten by radioactive decay (principally of uranium and its decay products). Surely that heat is leaking out into the oceans?
I realise that the heat level is steady, except for an exponential reduction over geological time as the uranium is consumed, so it wouldn’t drive climate change on its own.
Here is how you answer that.
Not only did the climate change but climate changes before the man made AGW issue came to be were much greater then what has occurred in the past 100 years or so.
So then you have to ask is the climate unique now? The answer is NO.
Then you have to ask what has always been to power the climate of the earth? The answer is the sun.
To make this complete my climate forecast due to weakening solar/geomagnetic fields is for the climate to grow colder from this point in time with this year being a transitional year.
If correct this should be the death nail to the ridiculous AGW theory , which is being proven wrong with each passing day as global temperatures are now failing to make any additional progress to the upside.
What answer? Complete the prediction as what you wrote is not a prediction of anything. For example how long will the cooling last. Will there be break points over that time frame, etc, etc? When will warming resume?
Let us hear your prediction..
I say it will grow colder.How cold will be a function of how weak solar/geo magnetic fields will be and duration.
I am not a solar expert and not a geo magnetic expert so I do not know the answers to that other then I think weakening solar/geo magnetic fields will result in the climate of the earth cooling.
Colder, yes and now. But not linear colder, and only for a period of time before coming to an end. That is what is important to detail in making a prediction, or there is no prediction being made.
…..Maybe, a century or two from now. Maybe? Elifino. But the likelihood is that the colder climate will prevail long enough that by the end of the cold period, fossil fuels that are economic to use by the population in general will have been depleted. And there is not a snowball’s chance in the Okefenokee that there will be enough “renewables” to provide for the energy needs for maintaining civilization as we know it. Populations will drop and institutionalized slavery of some kind will make a regrowth. R. I. P. civilization.
The most worrisome scenario is the Dems getting back into power with their left wing madness. That will ensure doom for many, imo. Otherwise science should carry the day.
Salvatore, You are so correct! The AGW is nothing but a scam theory with no science provided. You have to know it’s a scam when politicians promote it as the truth. Billions of dollars later, the now started natural cooling period will eventually prevail.
Sal couldn’t make a prediction to save his life.
Why is there n mention of ozone. It is also a Ghg but not uniformly disyributed. It also a key drver of tge change in lapse rate, ergi may be sufficient to reduce moisture. Hence allow more UV to heat surface and ocean, then the rest is as stated…..just sayin.
Why is there no mention of ozone. It is also a Ghg but not uniformly distributed. It also a key drver of the change in lapse rate, ergo may be sufficient to reduce moisture. Hence allow more UV to heat surface and ocean, then the rest is as stated…..just sayin…spell check.
Drver…. Ah bugger it.
> While oceans drive our climate, what drives changes in the oceans? They have no interior energy source.
Care to revisit that claim? The island chain of Hawaii has been pouring molten lava into the ocean for six million years or so.
The Hawaiian contribution to heating the oceans, while locally impressive, is insignificant in comparison to the heating that must occur from volcanic eruptions along the [mostly deep] oceanic spreading ridges.
https://en.wikipedia.org/wiki/Mid-ocean_ridge
The total length of the ridges has been estimated at around 80,000km.
That’s a lot of hot rock
GregK May 2, 2018 at 7:49 am
Try the Ontong Java Event: some 100 million km^3 magma, deep ocean temperatures perhaps 18K higher than today.
https://en.wikipedia.org/wiki/Ontong_Java_Plateau
That’s a lot of hot rock 😉
GregK, For a while I tracked the estimate of how many deepwater thermal vents there were. Each time I checked the estimate had been increased dramatically. Since indeed the mid-ocean ridge is the largest geological feature on Earth and thermal vents are found along the entire ridge as well as branches in the ridge, I believe we are underestimating their influence on the oceans. I know that there were several SW of southern Chile were the flow was greater than the Amazon. The Navy probably know since they have been studying the thermal structure of the oceans for a long time.
I doubt the volcanic ridges in the oceans add much thermal energy. Here is a map of the mean JAMSTEC MOAA temperature grid (mostly from Argo floats) at 2000 meters for 2014. No sign of any of the ridges. The temperature is a very uniform 2-3 degrees everywhere except the Atlantic where it is 3-4 degrees.
I can’t get it show up, but here is the link:
Andy May May 3, 2018 at 3:51 am
Agree.
Basic calculation:
Magma erupting through the ocean floor will cool down, and solidify becoming basalt. The amount of energy released can be estimated as follows. Specific heat (J/kg/K): water 4200, magma 1000, basalt 1400. Latent heat magma > basalt 400.000 J/kg
1kg magma cooling from 1300C > 1200C: 100.000J Latent heat magma > basalt: 400.000J Basalt cooling from 1200C > 0C: 1.680.000J Total: 2.180.000J
This is enough energy to warm 519 kg water 1K. Density of basalt is 3 times that of water, so 1 m^3 magma cooling down from 1300C to 0C can warm 1557 m^3 water 1K.
Total volume of the oceans ~ 1.400 million km^3, so it takes roughly 1 million km^3 magma to warm all ocean water 1K.
The spreading ridges deliver ~5-10 km^3 magma each year, so it takes about 100.000 to 200.000 years to warm ALL ocean water 1K.
The ~100 mW/m^2 Geothermal Flux takes only ~5000 year to warm ALL ocean water 1K.
Actual warming obviously depends on the amount of cooling by cold water sinking to the ocean floor near the poles.
“Here is a map of the mean JAMSTEC MOAA temperature grid (mostly from Argo floats) at 2000 meters for 2014. No sign of any of the ridges. ”
That would be a couple of thousand meters above the ridges. The effect, if any would only be noticeable close to the bottom.
As a matter of fact geothermal energy may well be of some significance to the thermohaline circulation. 0.1 W per square meter is fairly significant when applied over a 1,000 year interval.
And many other undersea volcanic flows are known and probably many others unknown. All adding heat to the oceans. Some are, have been, creating islands, some not yet or not now. Two sources of energy exist for the earth, the sun and geothermal. The former gets lots of attention the latter almost none. The on again, off again nature of many of the geothermal sources along with the complexity of the ocean currents cited by Andy, the Milankovich cycles variations, etc, result in a very complex climatological situation, one might say even chaotic over some periods of time, as many of the variables are presently numerically undefined.
I have no idea what the total heat would be or how it might manifest itself but the tidal work done by the moon especially but also the sun on our liquid mantle, oceans and atmosphere adds substantial energy over time. I assume somebody has calculated it.
Is the mantle heat sufficiently segregated from the surface that it has negligible effect? I have no idea.
The ocean area on the Earth is 3.6E14 square meters and each meter can receive ~340 Watts, which is a joule every second on average. It depends a lot on cloudiness and location, but it can. So the oceans, on a clear day, receive 1.2 x10^17 joules every second from the Sun. Encyclopedia Britannica estimates that the average natural escape of thermal energy on the surface is only 0.06 Watts per square meter. The entire surface of the Earth is 5.1 x 10^14 sq m, so this is 3.1 x 10^13 joules every second. Geothermal energy is trivial.
Andy May May 3, 2018 at 4:12 am
The oceans receive some 20 Mj/m^2 each day.
http://www.pveducation.org/pvcdrom/properties-of-sunlight/isoflux-contour-plots
This is just enough to warm 10 m water ~0,5K.
With mixing and conduction factored in the sun influences only the upper 250 m or so of our oceans.
All this energy is lost at the surface again and via the atmosphere to space.
Geothermal flux through the ocean floor is ~100 mW/m^2. The amount of solar energy reaching into the deep oceans is zero. So the effect of the geothermal flux on deep ocean temperature is infinitely higher than the solar influence.
But open waters of the oceans have an albedo of app. .04. And that applies to the full spectrum of solar energy that reaches the surface of the earth. The relative contribution of volcanos to the temperatures of the oceans in general is virtually nil even though it may be heating water intensely to very high temps in some locations. It’s the sun. Primarily in the tropical oceans, which if you look at a globe is a very large area that is receiving direct sunlight year round.
The fact that CO2 is a greenhouse gas does not necessarily mean it causes significant warming. In science, numbers matter. The effect is logarithmic, and is more or less maxed-out by 40ppm. We already have ten times that level, so adding more still will make no odds.
The established science that warming of seawater releases CO2, tells us that CO2 must have a very weak incremental greenhouse effect at present concentrations. If that were not the case, any warming for any reason would cause a runaway temperature rise.
The effect of CO2 absorption is logarithmic IF one considers a photon path length over which the probability of relevant IR absorptions are less than 100%, as in the original Tyndal experiment.
In Earth’s atmosphere, the CO2 IR emission is absorbed and emitted again many times. The log effect is of no consequence. The warming that CO2 produces is by a different process — changes in space emission height.
1- to see what the temperature of a planet without atmosphere at our distance of the sun is, look at the moon:
197K average surface temperature. Day-side is roughly in radiative balance with incoming solar, night-side is much warmer than radiative balance temperature (~3K)
2- assuming an increase of CO2 from eg 0,04% to 0,08% does have a slight effect on the temperature of the atmosphere and perhaps even the surface, how does this translate in an increase of the ocean floor temperatures? The only water that sinks to the bottom is cold (AABW and NADW). The return flow is heated by the geothermal flux (~100 mW/m^2) and loses this energy mostly around Antarctica.
Once you realize that the temperature (heat content) of the deep oceans is completely caused by geothermal energy, it becomes clear that the sun only slightly increases the temperature of the mixed surface layer. This energy is lost to the atmosphere again in autumn and winter.
The role of the atmosphere is now just reducing the energy loss to space. A surface at 290K radiates ~400 W/m^2 directly to space, the atmosphere reduces this to ~240 W/m^2.
So we have a balanced energy budget, NOT radiative balance.
(my emphasis) What I love about WUWT is commenters throwing out unsubstantiated assertions as if they were proven facts. We (skeptics) like to think we’re better than that.
Yes, Ben, traditional estimates of global geothermal heat flow are probably low because they were made before all these undersea volcanoes and vents were documented. But if you can prove that oceans don’t absorb and store solar radiation, please do so.
And please don’t forget that we have a tolerably good handle on the contents of the main radioactive elements (U, Th, K) in the mantle. These are the ultimate source of geothermal energy, so you can’t just inflate the numbers at will.
Smart Rock May 2, 2018 at 3:00 pm
I’m talking about the DEEP oceans. Solar is absorbed in the upper 10 m mostly and stored in the upper 250m or so. Below that NO solar influence detectable.
Typical daily profile:
Example of seasonal variations:
http://research.cfos.uaf.edu/gak1/gak1_MonthlyT.png
Absorbed solar energy is lost again at the surface, warming the atmosphere and eventually lost to space.
This solar warmed layer creates a perfect insulating layer for bottom warmed water. That water can only reach the surface at (very) high latitudes, exactly what the Thermohaline Circulation does.
Since the oceans were (very) hot during their creation (sitting on almost bare magma) their original heat content was delivered by geothermal alone. Since that time the GF only has to compensate the cooling effect of sinking cold water near the poles.
The ~100 mW/m^2 GF is enough to warm ALL ocean water 1K every ~5000 years. The GF delivers the total OHC every 1 to 1,5 million years. Yet the deep oceans have been cooling down the last ~85 million years after a major re-heat by large magma events like the Ontong Java one, a staggering 100 million km^3 event bringing enough energy to the deep oceans to warm ALL ocean water 100K.
So yes, I’m confident in stating that the heat content of the DEEP oceans is COMPLETELY caused by geothermal energy.
The albedo of Earth and Moon are very different. So, one cannot compare their so-called black-body temperatures.
donb May 2, 2018 at 8:09 pm
The Effective temperature for Earth is calculated as 255K, for the moon it is ~270K both taking albedo into account.
They both receive the same amount of solar energy per square meter.
Yet the average temperature for Earth is ~33k ABOVE the Effective temperature, the moon > 70K BELOW the Effective temperature.
What makes you think that the 255K for Earth makes any sense?
Making the atmosphere more humid raises the temperature at which water vapour condenses out into cloud droplets. Condensation occurs more readily at higher humidity levels.
Thus, by virtue of the lapse rate slope. clouds will form at a lower, warmer, height if non condensing GHGs lead to more evaporation.
Clouds at a lower, warmer, height will radiate more to space than they otherwise would have done which negates the effect of non condensing GHGs.
I suggested that mechanism to David Evans in support of his hypothesis that if one exit route for radiation to space is blocked then the system will use another route so as to maintain hydrostatic equilibrium.
If there were no water vapour (or any other condensing GHG) then the net vigour of convective overturning would change instead because that is what determines the rate at which atmospheric energy is recycled by conduction between surface and atmospheric mass.
So, one way or another, any theoretical warming effect from GHGs is neutralised.
Do we want to prove once and for all this is a religion? Here is how we do it; all of us who come on here and comment in the “echo chamber” out to do some actual work together and make a fool proof case to provide to the courts, illustrating, without doubt, that CAGW is religious in nature, and the “The government’s action must not have the primary effect of either advancing or inhibiting religion;”
What would it take?
each of us who has specific interest/knowledge/expertise, ought to write up a factual, provable section leaving nothing uncovered. We will provide an outline from its origin in the GAIA mother earth/pagan relgious roots, through maurice strong, through establishment of UN IPCC charter, through deceptive tactics, apostate style excommunication, etc… Let’s all get together and formulate a plan. Then we can get the signatures to file a class action lawsuit suing the government for violating the law, and demanding our money back that was stolen in free handouts to renewable companies. We could indict Mann, Hansen, Gore, Figueres, all the major players for conduct detrimental to national security, massive fraud, etc. I think I’m going to write an article briefly highlighting how this could work and maybe get some feedback from folks as to which courts, how to find lawyers, etc. Let us actually fight back for once instead of just sasslapping each other while levying jokes at the expense of the green religionists. Seriously folks. It is time to take action, and you are all capable, intelligent, awesome people who have what it takes.
I’ve highlighted a quick wikipedia section below.
Edwards v. Aguillard, 482 U.S. 578 (1987)[1], was a United States Supreme Court case concerning the constitutionality of teaching creationism.
On June 19, 1987 the Supreme Court, in a seven-to-two majority opinion written by Justice William J. Brennan, ruled that the Act constituted an unconstitutional infringement on the Establishment Clause of the First Amendment, based on the three-pronged Lemon test, which is:
The government’s action must have a legitimate secular purpose;
The government’s action must not have the primary effect of either advancing or inhibiting religion; and
The government’s action must not result in an “excessive entanglement” of the government and religion.
The Supreme Court held that the Act is facially invalid as violative of the Establishment Clause of the First Amendment, because it lacks a clear secular purpose (first part of the above Lemon test), since (a) the Act does not further its stated secular purpose of “protecting academic freedom”, and (b) the Act impermissibly endorses religion by advancing the religious belief that a supernatural being created humankind.[1]
honestliberty,
An interesting idea. However, there are no shortages of ideas in the world. What IS in short supply is someone willing to run with an idea and bring it to fruition. Since Rud’ Istvan is a lawyer, I’d appreciate hearing from him what he thinks is the probability of such a class action suit being successful, and how much money it would take to see it through.
I’m willing to put in the hard work, to contact everyone willing and take the coordination efforts to pull it together. I have a friend who is an editor who would need some extra work and would love to have her name behind it.
If anyone is interested in putting together a working outline, I can Skype, email, etc. I don’t give out my personal email on here to CMA, but anyone can reach me through word press
THE DANGER ( as I see it ) IS THAT WHEN ( not if ) THE EARTH BEGINS TO COOL DUE TO
A COOLER SUN-CYCLE , that Unholy Religion , the “Climate Catastrophists” , will make claims
that THEIR POLICIES TO REDUCE CARBON DIOXIDE ( which MOST governments are now
implementing ) ARE WORKING ! It’s OFFICIAL !
They will TAKE THE CREDIT for solving a non-problem AND THE MEDIA ( which is heavily
invested in this matter ) WILL SUPPORT THEIR EFFORTS.
This will allow governments ( local , state , national , international , World ! ) to keep imposing
TAXES and RULES and indulging in wealth redistribution WITHOUT ANY HINDRANCE.
.
So PROVING them WRONG is now an URGENT IMPERATIVE TASK.
.
So far , they have had the “inside running” and IF THEY CEMENT THEIR PLACE as
THE GOOD-GUYS in this matter it will become so much harder to OVERTHROW
and REFUTE their false-hoods.
TIME is of the essence……..and writing “blogs” is NOT going to bring about the
URGENT CHANGE IN PUBLIC OPINION that “we” need to achieve.
.
CAN’T “WE” PERSUADE MORE LEADERS TO “OUR” VIEWS ??????
.
That’s how I feel.
Here’s what we need: we who butt heads here all the time have got to get it together. It means individually accepting none of us will fully agree with the others, but still making a conscience decision to build our own developing consensus on solar activity in all its manifestations, and then taking it to the streets. We are the leaders and we don’t have to wait for someone else’s permission or validation.
@ Bob …I agree with that sentiment.
I agree because we are al trying to come up with an explanation which is very elusive .
I think all of us have some part of it correct and other parts wrong but which parts are correct which are wrong ? I hope the next few years will help clear matters.
@ Salvatore, that I can agree with. I look forward to finding out more over time as do all of us. All of us with the exception of the closed minded alarmists.
That won’t work because China and India wont stop increasing CO2 production
Exactly right. If the anthro-CO2 hypothesis is wrong (and it almost certainly is) it cannot be maintained much longer. The truth of the hockey stick graph is already destroyed, but liars and dissembles are carefully nursing the corpse and pretending it’s not dead. These same liars and dissemblers are also on the hook for advancing the silly notions that “free” renewable power makes for cheaper and better electricity generation and creates more job opportunities. They collectively insist that fossil fuels can be outlawed with no loss of human thriving. They must defend the idea that more atmospheric CO2 is bad for life. Failure in one aspect of the expert opinions (climate physics, biology, agriculture, economics) tarnishes the credibility of the whole.
All that’s necessary for a complete collapse in the consensus, is for the belief to grow in the general public that CAGW alarmist science is simple self-serving propaganda, controlled by corrupt, self-serving rent seekers. That picture is becoming more obvious to more people all the time.
Trevor – wouldn’t you need to see a convincing reversal in global temperatures to begin to falsify the assumptions of AGW?
So…….What do they get from being believed to be correct if their belief system is a construct of purely fantasies and delusions? Truth and reality will prevail. It may take a while, but in the end, truth and reality will prevail and will do so without there having to be some kind of a marketing and sales job to convince someone???? Who are we trying to convince, anyway. Politicians and bureaucrats? Haw, haw haw.
No evidence that temperature is responsive to changes in atmospheric CO2
https://ssrn.com/abstract=3170971
No evidence that atmospheric CO2 is responsive to emissions
https://ssrn.com/abstract=2997420
“Carbon dioxide is a noncondensing gas at normal temperatures and immediately radiates any energy it absorbs.”
This is not the case in the lower atmosphere, as CO2 thermalizes the energy it absorbs from OGLWIR. I stopped reading your article at this point, as this error is egregious and will surely poison any further opinions from yourself.
No one has been able to explain that if H2O is a positive feedback (if it isnt then the CAGW house of cards crumbles); then why is there not runaway global warming every time water vapour condenses releasing its latent heat? If all of that latent heat release escapes to space then H2O is not a positive feedback. If some of it goes back into the oceans or ground or even into the CO2 molecules, then every time that evaporation happens some of that latent heat that is eventually released with condensation will build up in the atmosphere or oceans till either the oceans boil over or the atmosphere becomes a runaway heating situation. Obviously the latent heat of condensation that is released must all be transferred into outer space. This happens because of convection that takes the H2O higher into the atmosphere where it is released into space.
H2O is a net negative feedback as evidenced by the fact that the wet lapse rate is significantly less than the dry lapse rate. More H2O reduces the insulation effects of the atmosphere.
“More H2O reduces the insulation effects of the atmosphere.”
Not exactly. What it does reduce is the temperature gradient required to lift heat a given distance. It also increases the amount of heat lifted by a given amount of air.
This is a wonderful example of a “false dichotomy”, or “the fallacy of the excluded middle”. Asking whether “climate change” (which the author has not defined) is from “solar variability or greenhouse gases” leaves out the possibility that it is from say a change in the cloud cover, or a change in the oceanic currents that move heat to the poles as part of the way that they earth shed its heat, or a change in the frequency of the El Nino/La Nina pump that moves warm water across the Pacific and both north and south.
Sorry, Andy, but you can’t just cut out the other possibilities by simply asserting a false dichotomy.
w.
It is also possible to waste time on a large number of false choices by just simply asserting another choice or possibility ad infinitum. That lacks intelligence. We are smarter than that.
“We are smarter than that.”
/sarc
Bob Weber
If “we ere smarter than that”
then the correct answer is
we don’t know what causes climate change.
There is no “false choice”
when one does not know
the correct answer.
Richard Greene
May 2, 2018 at 11:17 am
we don’t know what causes climate change.
——–
Richard, for those who want to see and can see…there is no problem, it is very obvious, the best and most certainly known is what does not cause or effect climate…..guess what is it Richard….U guessed correctly, it is the Sun, Richard…..Oh well that is so for as long as one does not flirt or start considering the idea that the man made CO2 emissions somehow have an effect on the Sun.
Any knowledge, data and observations in modern era do clearly falsify the Sun’s variation as a possible cause or effect of climate change…..especially wen that variation is non man made or under the effect of man.
These clever guys still do not even understand how silly such thing can be when considering that radiation imbalance is always positive, some thing that even Gore had no much problem understanding it…
A real waste, I must say, especially when even Salvatore at this point clearly understands that there is no way for the Sun’s TSI variation to really have any effect or even affect on climate, let alone it bean a climate change driver,,,,,,, and that may tell you a lot…:)
That guy gets it, but still he sees not the contradiction of it in it’s further approaches….:)
cheers
The collective “you” do not know what causes climate change because “you” can’t see direct evidence clearly in plain sight via the built-in biases over the years by those “controlling the debate”.
When I said ‘we are smarter than that’, that means choices can be made now based on current info, and we don’t have to sit around for another decade of new data. The people dragged their knuckles on this are all cut from the same clothe – wanting to be “the one” who has the final say. Too many of “you” are on a personal power trip because everything has to be your way.
At this pace the warmists are going to eat our lunch because “you” can’t even put up a cogent alternative argument backed with principled science or verified predictions as I can.
“You” TSI dismissives are guilty of not even being able to replay back to me what I have said to “you” over the past few years before “you” decide the fate of nations, because instead of asking decent questions and following the logic, you’re collectively “dismissives” first and foremost.
“You” are “our” worst enemy. The warmists call us dismissives, well as long as everyone keeps dismissing out of hand what they haven’t even seen before without asking questions, those of “you” whose egos need to be in control, who need to feel important, are those very ones undermining us right now.
I see too many closed minded control freaks holding up progress among “you”.
Who among “you” has even made a good faith effort to follow what I’ve said to at least know front to back what is being said. There hasn’t been a single one among “you” dismissives to make such an effort.
When whiten somehow thinks
“A real waste, I must say, especially when even Salvatore at this point clearly understands that there is no way for the Sun’s TSI variation to really have any effect or even affect on climate, let alone it bean a climate change driver,,,,,,, and that may tell you a lot…:)”
it is a clear sign the lemmings will follow the dismissives right over the cliff.
My prior post that disappeared with no moderation message:
The collective “you” do not know what causes climate change because “you” can’t see direct evidence clearly in plain sight via the built-in biases over the years by those “controlling the debate”.
When I said ‘we are smarter than that’, that means choices can be made now based on current info, and we don’t have to sit around for another decade of new data. The people dragged their knuckles on this are all cut from the same clothe – wanting to be “the one” who has the final say. Too many of “you” are on a personal power trip because everything has to be your way.
At this pace the warmists are going to eat our lunch because “you” can’t even put up a cogent alternative argument backed with principled science or verified predictions as I can.
“You” TSI dismissives are guilty of not even being able to replay back to me what I have said to “you” over the past few years before “you” decide the fate of nations, because instead of asking decent questions and following the logic, you’re collectively “dismissives” first and foremost.
“You” are “our” worst enemy. The warmists call us dismissives, well as long as everyone keeps dismissing out of hand what they haven’t even seen before without asking questions, those of “you” whose egos need to be in control, who need to feel important, are those very ones undermining us right now.
I see too many closed minded control freaks holding up progress among “you”.
Who among “you” has even made a good faith effort to follow what I’ve said to at least know front to back what is being said. There hasn’t been a single one among “you” dismissives to make such an effort.
When whiten somehow thinks
“A real waste, I must say, especially when even Salvatore at this point clearly understands that there is no way for the Sun’s TSI variation to really have any effect or even affect on climate, let alone it bean a climate change driver,,,,,,, and that may tell you a lot…:)”
it is a clear sign the lemmings will follow the dismissives right over the cliff.
@ Bob Weber,
” … Who among “you” has even made a good faith effort to follow what I’ve said to at least know front to back what is being said. There hasn’t been a single one among “you” dismissives to make such an effort. …”
—-
Bob, you need to consider the possibility that you’re a rather poor communicator of what you’re trying to convey. Clean it up, explain it as you would to a conceptually oblivious 10 year old from first principles, don’t use jargon or alphahet soup, plain English, finish your website to that end so you can reference ideas/suport, don’t act the victim and talk down to people, or lable them, it just turns them off. Your success or not is all up to you. Cheers.
Wx
The abusers have already set the agenda. They’re here every day, and pardon me for being human and being frustrated about them.
As to communicating. Did you ask me a question or are you lecturing me as the others?
Where’s your open mind?
No offense intended Bob. But you’re blaming others for you not getting your point accross. This is not our fault. I’m open to all evidence but you can hardly blame me or anyone else for being skeptical or guarded, especially with regard to the subject matter and its general lack of success.
It is unfortunate that many solar driven climate variability advocates take the us verses them mentality to essential and warranted skepicism. The onus is not on ‘us’ to believe ‘them’, it’s on advocates to furnish compelling evidence and logical insight, etc. The counterview is there still, because that is not occurring, it isn’t some plot to dig in heals and rain on your parade.
I will have clarifying questions for you, I hope you realise they’re genuine. May I suggest you relax some, you aren’t required to get up-tight, just enjoy it and just make what you’re saying clear. Cheers.
Another fallacy at play here is that of the false premise. The notion that the earth energy system is some how in equilibrium is risible. The disequilibrium between the day side and night side can never be resolved as we spin and arc through the seasons, around the sun. The biosphere breathes in and breathes out, day in and day out through the seasons. The fluids of the world’s oceans and atmosphere swirl and flow as the system chases it’s tail, always seeking equilibrium, always failing in it’s quest. What we call climate is a second or third order effect. Enjoy the magnificent ride.
Agreed. We don’t even know if the Earth’s total heat content is rising or falling at any given moment. We run around like ants on a basketball pretending we are the ones playing the game.
Mr. Eschenbach:
Excellent point.
Perhaps you should also mention
the possibility that the
average temperature
today is about the same as 1880,
but we fail to recognize that
due to poor quality surface
temperature measurements
and data compiler bias:
– Huge amount of infilling,
– Adjustments
– Re-Adjustments
– Re-Re-Adjustments
– Data compilers predicted
lots of warming and are biased
because they do not want
their predictions to look foolish.
In addition to all the usual
climate change causes we suspect,
I want to add the possibility that
extraterrestrial dust could affect
the amount of sunlight that
reaches the surface of our planet,
just like man made aerosols do.
Climate change blog
http://www.elOnionBloggle.Blogspot.com
Willis, I discussed the ocean cycles in the post, second paragraph and say pretty much what you say. Depending upon the time scale being discussed, they have an effect. But, they are not a primary source of climate change, they are secondary as explained in the post. I also discuss the effect of water vapor and cloud cover changes in Part B.
If you have any additional primary sources that you think are significant, I’m interested. I get into cosmic rays in Part B, but I’m not sure they are a significant primary source (or “forcing”). As far as I know, GHGs and solar radiation variability are the only significant known primary “forcings.” I hate that word, but sometimes it is useful.
Andy,
Yes, one has to make a distinction between the primary sources of heat for the surface of Earth, and secondary sources that are just re-distributing the absorbed heat.
Thanks, Andy. From my perspective, the real issue is not that you are looking at a limited subset of possible answers. The problem is that you are asking the wrong question.
The important question is not explaining climate change, which is generally taken to mean the changes in global average temperature.
To me, the real question is why there is such a LACK of change in the global average temperature. Some perspective:
• Over the entire 20th century, despite volcanoes, despite changes in GHGs, despite changes in aerosols, the temperature only varied by ± 0.3°C. This is about a tenth of a percent change in temperature.
• Despite being hit by asteroids, despite the coming and going of massive ice sheets, the temperature only varied by about ± 3-5°C. This is about a 1% change in temperature.
• Despite the sun heating up by about 30% since the dawn of life, the temperature now is about the same as it was then, not about 7% warmer as we’d expect.
• It’s not due to “thermal inertia”. We know this because of the big variations in temperature over the course of a year.
• The average temperature of the moon is about -77°C, despite getting the same solar input and only having about a third the albedo of the Earth. So we’re running something like 60°C above what might be expected without GHGs (including water vapor), clouds, and liquid water … so again, “thermal inertia” doesn’t explain the stability. Those things change all the time, and despite that, the temperature stays stable …
• The albedo of the southern hemisphere, with much more water, much less land, and much less land ice, is almost identical to that of the northern hemisphere. Again, what is surprising is the stability of this condition.
The astoundingly unvarying nature of the earth’s temperature despite all of these things, despite everything that the universe has thrown at it, is the real question that needs investigation.
Once we’ve figured that out, once we know why the temperature is so stable, we can start to wonder about the causes of the few tenths of one percent changes that you are investigating in this post … I say it is because of emergent climate phenomena that thermoregulate the surface temperature, and of course, YMMV …
Best regards,
w.
Willis,
You have been told several times why the system is so stable and how your convection observations fit in but you willfully refuse to accept it.
Willis Eschenbach May 2, 2018 at 12:47 pm
The fact that Earth is usually a liquid water world surely does serve to stabilize its average temperature (whatever that might be), thanks to homeostatic processes. However it isn’t always a strictly water world, but sometimes icy to one degree or another.
Temperature was stable during the Pliocene, but got much less so during the Pleistocene.
This shows that Earth, at least at Vostok, has fluctuated through some 11 °C there during the past five million years. I’d be surprised if this translates into a global swing of only three to five degrees C.
Going farther back in time, the variation has been much greater. If, as still remains somewhat controversial, Earth has suffered strict Snowball Earth episodes, with thick ice from the poles to Equator, then for up to 300 million years its average global temperature would have been around -50 °C. And during hot spells, such as the Permian-Triassic mass extinction event, estimates are that it spiked up to possibly 30 °C, with upper ocean temperatures as high as 40 °C. That’s a possible swing in the global average of ~80 °C.
So I beg to differ with your statement that, “Despite being hit by asteroids, despite the coming and going of massive ice sheets, the temperature only varied by about ± 3-5°C. This is about a 1% change in temperature.”
Both before and after the end Cretaceous asteroid impact, climate was warmer than 3-5 °C balmier than now. And during its effect, it would have been cooler than that range. For instance, during the PETM, best estimate is an 8 °C warmer global average temperature than today, similar to peak mid-Cretaceous heat.
Nor can you IMO conclude that a 30% weaker sun 3.3 billion years ago shows that the sun has no effect on climate. Earth was a very different planet then. The atmosphere was different, there was more water and less continental crust, to include relatively little mountain building. The chemistry not only of the air but also the oceans was markedly different. The Earth itself generated more heat, and there was more left over from its formation. Volcanism was more active. And life was less abundant and diverse.
Earth’s climate has been everything from covered in seas of molten lava to an ocean of solid ice. Even in the Phanerozoic Eon, ie the past 541 million years, global temperature has varied by seven degrees C higher than now for the average of the whole Cambrian Period. This implies intervals in that period in which GASTA was even higher than that.
Clearly, while within each climatic mode, Earth’s climate system is homeostatic to a large extent, phenomena emerging on a daily scale don’t stabilize climate enough to keep ice ages from happening, leading to big swings in GASTA on longer time frames. The more powerful Milankovitch cycles and solar activity fluctuations (with other longterm factors such as plate tectonics and location of the solar system in its orbit around the galactic barycenter) overpower the shorter-term self-regulatory processes, causing a switch, for instance, from interglacial to glacial mode.
Paleoclimatologists also have recognized in Earth’s current climate system (Pleistocene/Holocene) a third mode during the coldest phases of glacial epochs, associated with the period cold snaps called Heinrich Events, interspersed with with rapid warming D-O event cycles.
That’s my perspective, anyway, as a student of the cryosphere.
Erratum: Please read “periodic” for “period” before “cold snaps”.
Typing too fast with cold fingers.
Derivation of -50 degree C estimate:
http://www.astrobio.net/news-exclusive/improving-understanding-of-snowball-earth/
Bear in mind that that’s for the three Neoproterozoic glaciations. The Paleoproterozoic Snowball Earth episodes were even worse (from 2.5 Ga). So that degree of cold should be considered a minimal estimate for the worst global glaciations.
I also could have added to the differences between 3.3 billion years ago (the Archean Eon) affecting climate Earth’s rate of spin, its distance from the moon and sun. Milankovitch factors would have diverged significantly from now.
Stephen Wilde May 2, 2018 at 12:53 pm
Sorry, I must have missed it … and this is why I say PLEASE QUOTE THE EXACT WORDS THAT YOU ARE DISCUSSING. I’ve written over 600 posts on WUWT. Most of them have 100 comments or more. That’s some 60,000 comments, and you expect me to come up with what you’re referring to ???
I have no idea what you are talking about. If you wrote it, I may well have just skipped over it, your comments in the past have been … well … let me call them less than informative, and this one is no exception.
Regards,
w.
Willis,
We have had extensive, detailed discussions on the point in various threads so I have difficulty accepting that you do not recall it.
Convection changes so as to neutralise radiative imbalances and thereby maintains hydrostatic equilibrium so that an atmosphere can be retained and your thunderstorm hypothesis is one manifestation of the adjustment process in action.
Here is a fuller description once more:
https://tallbloke.wordpress.com/2017/06/15/stephen-wilde-how-conduction-and-convection-cause-a-greenhouse-effect-arising-from-atmospheric-mass/
Felix
You’re a positively confident guy.
Felix. That diagram has nothing to do with Vostok it is the LR05 stack of benthic D18O measurements.
Tty,
Thanks. Point about temperature range remains, however.
Except that on the time scales that matter, the variable sun is primarily (at least) responsible for changes in oceanic currents. On longer time scales, plate tectonics play a big role. On all time frames, changes in volcanism can be significant.
Some recent studies of connections among oceanic oscillations, solar activity and volcanism:
http://notrickszone.com/2016/09/22/4-new-papers-link-solar-activity-natural-ocean-cycles-to-climate-and-find-warmer-temps-during-1700s-1800s/#sthash.DYhF4ah8.dpbs
Felix, there’s more nonsense in solar claims than just about any field I can think of. Here’s an example from your link:
So what’s the problem? Well, the “Dalton Minimum” in solar activity goes from 1790 to 1830, right in the middle of the warm part of that record.
And despite that, the peer-reviewers passed it, NoTricksZone highlighted it, and presumably you believed it …
I’m sure you can see the problem. There is little to no criticism or investigation of solar claims, particularly by the peer-reviewers, but also once they get published. The readership seems to divide into two groups: those who ignore the solar papers as being meaningless babble, and those who swallow them whole without examining them with a scientific eye.
I’m one of the few people who takes the time and trouble to do the hard yards, analyze the papers, and point out once again that the Solar Emperor has no clothes …
Regards,
w.
http://notrickszone.com/wp-content/uploads/2016/09/Holocene-Cooling-China-Lyu16.jpg
The Chinese record shows the same LIA pattern as other proxies. The Dalton isn’t in the middle of a warm period. It’s in the less cold interval following the Maunder Minimum and the strong warm cycle in the middle of the 18th century. Both the cold Maunder and hot followup cycle are plain to see. Then, during the Dalton, climate cooled again.
The LIA bottomed in the Maunder, so naturally those cycles after it would be relatively warmer. What counts is that the high solar activity of the mid-18th century coincided with the sunniest interval in the LIA, just as its coldest coincided with the least sunny. The Dalton was cooler than earlier in the 18th century but warmer than the Maunder.
The pattern fits exactly with what would be predicted on the basis of solar activity. To me, this looks like the opposite of nonsense. It is strong confirmation of the solar hypothesis.
The LIA as a whole resulted from a number of solar minima bunched together. By contrast, during the preceding Medieval Warm Period and following Modern WP, solar maxima dominated.
IMO it’s plain to see to critical effect of solar maxima and minima during the LIA, not just in China but everywhere else. Honestly, I don’t see how you can dismiss such powerful evidence as nonsense.
So what’s the problem? Well, the “Dalton Minimum” in solar activity goes from 1790 to 1830, right in the middle of the warm part of that record. ?dl=0
?dl=0
The problem is you’re mischaracterizing the situation. The Dalton had the largest drop in temperatures.
I’m sure you can see the problem. There is little to no criticism or investigation of solar claims, particularly by the peer-reviewers, but also once they get published. The readership seems to divide into two groups: those who ignore the solar papers as being meaningless babble, and those who swallow them whole without examining them with a scientific eye.
I’m one of the few people who takes the time and trouble to do the hard yards, analyze the papers, and point out once again that the Solar Emperor has no clothes …
I can see what the problem is, you are careless and overconfident.
I examined your claim that there was no solar driver of the Dalton and find your conclusion unwarranted.
Felix – going back to Snowball Earth, the little I’ve read about it involves a good deal of speculation, but the theory (as it now stands) seems to require a buildup of CO2 to do global warming in order to get out of the snowball condition. Since most of us here seem to be convinced that the effect of CO2 on climate is small, why aren’t we still in a snowball earth that started in the Archean?
The article you linked to relies very heavily on CO2 to do the heavy lifting. Also,as I understand it, paleogeographic reconstructions (which demonstrate glacial deposits in tropical areas) rely on the magnetic poles always being close to the geographic poles. I do wonder about that, given the way the poles have been behaving lately. I think I’ll take the skeptical stance, thanks very much, and wait for harder evidence.
Smart Rock May 2, 2018 at 3:48 pm
Geologists have to kowtow to the “consensus” re. CO2. But the more liberated geologists have established that getting out of Snowball Earth episodes needs nothing more than tectonic changes. That’s why they last so long.
That the Equator was glaciated at sea level on land at many times in the past is well established. There is not a problem with magnetic reversals. The evidence is so overwhelming that paleomagnetism simply confirms what has been discovered by conventional geologic means. The evidence for at least land glaciation abounds everywhere on Earth during the Snowball intervals. Besides which, not just paleolatitude, but sea level reconstructions also show the signal of massive glaciations.
There is however debate over whether Snowball Earth episodes were “iceballs”, with Earth akin to Moon Europa, or “slushballs”, with at least seasonally ice-free oceanic bands at low latitudes.
But skeptical is always good.
And we appreciate your hard work Willis, and your smarts.
Felix, you might also want to consider the of bigger ocean, smaller continent, hotter more ductile mobile mantle, plate tectonic mode geodynamics, plus inhibited orogenesis. That’s a wee bit logically and physically problematic, no?
The many similar basic physical contradictions in the standard tales tell me the standard tales are not correct at all, and will change greatly going forward, or logical and physical inconsistencies will continue to prevail.
But it’s clear that our comprehension of most of geohistory and palaeo climate is too inadequate to be concluding much about Precambrian earth or climate range context (~90% of geohistory).
The real question is the extraordinary stability of the past 200 mya phase, in particular (~4% of geohistory), until the past 5 my (~O.1% of geohistory).
Even the current ice-age glacial convulsions since 2 mya are meta-stable and range-bound.
WX,
I have indeed considered bigger ocean, smaller continent, hotter more ductile mobile mantle, plate tectonic mode geodynamics, plus inhibited orogenesis. That’s why I mentioned them. Not the least bit problematic, IMO.
Dunno which standard tales you have in mind, but dangerous man-made global warming is among the biggest lies.
There is much which we can conclude about the Precambrian, and much of course which still remains controversial.
I beg to differ that the past 200 million years has been stable, although going back 100 million more years would pick up more instability and 300 million more a lot more.
As I showed, even just the past 200 million years shows large fluctuations in global warmth and cold. The PETM, for instance, just 55.5 Ma, was eight degrees C hotter than now, which means some 13 degrees (at least) hotter than the last glacial maximum.
Sorry, but I must beg to differ with your assertion that, “Even the current ice-age glacial convulsions since 2 mya are meta-stable and range-bound.” Your idea of metastability and range-boundedness must differ markedly from my own.
Sadly, your comments about “metastability” are so obviously falsified by the temperature record, whether of the past two million years, 20 million or 200 million years.
The Mesozoic didn’t suffer a global ice age because it was so secularly warm, despite the passage of our solar system below the galactic plane during it.
However the Carboniferous-Permian and current Ice House intervals have reverted to the cosmic norm. We basically skipped an Ice House because the Mesozoic was for other reasons unusually hot.
No CO2 buildup is needed to get out of a “snowball” state. A major magmatic episode or a major asteroid impact will lower the albedo enough to finish it abruptly.
Tty,
Couldn’t agree more. I mentioned tectonics, but not an asteroid.
In any case, Snowball Earth episodes tend to last a long time.
More aspects of CAGW don’t make any sense. The Mauna Loa CO2 readings show a constant zigzag of CO2 concentration where the trend is a 45 degree upward slope and the zigzag is the spring/autumn increase/decrease of CO2 caused by photosynthesis. Can someone explain to me that if the atmosphere contains ~800 megatons of CO2 and ~ 90 megatons of CO2 is exchanged between the atmosphere and the oceans every year, how do we get a nice neat zigzag line of CO2 increase? Oscillations according to Wikipedia:
the Quasi-biennial oscillation – about 30 months
the El Niño Southern Oscillation – 2 to 7 years
the Pacific decadal oscillation – 8 to 12 years? (not clear)
the Schwabe Cycle or sunspot cycle – about 11 years (may be discernible in climate records; see solar variation)
the Hale Cycle or double sunspot cycle – about 22 years[1]
the Interdecadal Pacific Oscillation – 15 to 30 years? (not clear)
the Atlantic Multidecadal Oscillation – around 50 to 70 years, but unpredictable
a 60-year climate cycle recorded in many ancient calendars[2]
the Gleissberg Cycle – a solar cycle of about 88 years[1]
the Suess Cycle or De Vries Cycle – a solar cycle of about 200 years[1]
the Hallstadtzeit/Hallstatt Cycle – a solar cycle of about 2,200 to 2,400 years[1][3]
North African climate cycles – tens of thousands of years
the glacial periods of the current ice age – period around 100 000 years (see Quaternary glaciation#Astronomical cycles and 100,000-year problem)
the Arctic oscillation – no particular periodicity
the North Atlantic Oscillation – no particular periodicity
the North Pacific Oscillation – ?
Surely the worlds oceans with all of the above oscillations would result in a chaotic trend line of CO2 in the atmosphere? Therefore I must conclude that either the CO2 readings from Mauna Loa are bogus or else CO2 has nothing to do with temperature variability. .
The other thing I don’t understand is if the Vostok ice cores show a steady CO2 level of ~ 280ppm for 400000 years, then why did the climate and earth temperature change so much in those 400000 years? I must conclude that the ice core data is also bogus or else CO2 has nothing to do with climate. Nothing about the CAGW thesis makes any sense.
Nice logic from top to bottom.
Especially your last paragraph, that is powerful.
“The added water vapor acts as a positive feedback and the temperature goes even higher.”
A positive feed back process if not controlled by negative feedback processes will in time run away. The climate system must have powerful negative feedbacks that will prevent this mechanism from running away.
well then the CAGW house of cards crumbles
As well it should.
Agreed, more on this in Part B.
Walter,
And since the “Tipping Point” hasn’t been reached after 4.5 billion years, it is strong evidence that there are “powerful negative feedbacks” in play.
It is far from clear that the water feedback is positive. It is more likely to be negative (increased cloudiness, lower lapse-rate, higher convective efficiency).
Remember that climate models don’t do convection. The “parameterize” it.
I agree.
If the net feedback be negative, then ECS would be less than 1.0 degree C.
Wholly beneficial and nothing to worry about.
Waaaaaay too much science. Science this, science that. Oooh look over there, science. Here comes the man from science, we are saved. Quick, more science, we’re sinking.
By Andy May
Well SURPRISE, SURPRISE, …….. you are actually knowledgeable about Henry’s Law.
But your abbreviated explanation of the functioning of Henry’s Law does not justify or give credence to your “pseudo circular reasoning” claims that atmospheric CO2 increases/decreases are the “driver” of the temperature increases/decreases of BOTH near-surface air AND ocean surface water.
What you are stating is that …… “the cause (CO2) is responsible for the effect (temperature)” …… except for whenever ….. “the effect (temperature) is responsible for the cause (CO2)”.
This proxy graph pretty much discredits any claims that atmospheric CO2 is a “driver” of air temperatures, to wit:
http://i1019.photobucket.com/albums/af315/SamC_40/1979-2013UAHsatelliteglobalaveragetemperatures.png
Samuel,
Just to be the Devil’s Advocate, how about re-doing your graph such that the scale for CO2 keeps the line within the bounds of the temperature running average? Would you be as confident in your assertion?
The 1984 low is associated with ~348 ppm CO2; the 1998 high with ~369; the 2000 low with ~371 and the 2016 high (lower than in 1998) with ~391. This doesn’t suggest a strong correlation to me.
More significantly, using the whole Mauna Loa record would show no correlation at all from 1958 to 1978, during which time Earth cooled while CO2 relentlessly climbed. Sadly, we lack directly comparable satellite observations for that period. If you go back to 1940, the cooling trend in even more dramatic.
Clyde Spencer – May 2, 2018 at 12:21 pm
Clyde S,
A little dab of “common sense” thinking, …… combined with a smidgen of “logical” reasoning, ……. should quickly inform one’s conscious mind that it wouldn’t matter one (1) twit what plotted ppm scale (righthand side of graph) was used for the atmospheric CO2 quantities, …… it would never show or prove a correlation between increases/decreases in near-surface air temperatures and CO2 ppm quantities.
But now, Clyde S, …… iffen you would like to see a remarkedly close correlation between an increase in temperature and the increase in atmospheric CO2 ppm as denoted on the above cited graph, ……. then take a “look-see” at the post-1978 average yearly sea surface temperature increases for Australia [Southern Hemisphere ocean water] as denote on the following proxy graph, to wit:
http://www.bom.gov.au/climate/current/annual/aus/2013/20140103_SSTa_plot.png
And PS, … Clyde S, ….. the above denoted post-1958 average yearly sea surface temperature increases also correlates quite nicely with “average yearly CO2 ppm increases” as denoted on the Keeling Curve Graph, to wit:
http://i1019.photobucket.com/albums/af315/SamC_40/keelingcurve.gif
The ocean waters have been slowly warming-back-up from the “cold” of the LIA and the sequestered CO2 is being outgassed back into the atmosphere. AKA: ….. Henry’s Law
Well, the smartest guy in the room, Dr. Lindzen, says the temperature will rise by about 1C per doubling of CO2. CO2 has gone up by a third since “pre-industrialization.” The temperature, according to some flawed data sets, is up 1C in the same time period. That very simple math tells you that about 0.7 degrees of the current warming is due to something other than CO2. I know there are a lot of people who will say Lindzen is a shill for big oil and can’t be trusted, but those people are idiots.
RH
Dr Lindzen calculates 1C per doubling of CO2.
That is yet to be proven as are many other factors.
Associating any part of any temperature rise to that cause without empirical evidence is misguided.
It is, and possible may always be difficult to appropriate temperature rise to any one factor.
And if it cools for a period as some predict, what are they going to attribute that to, or will they say that it would have cooled more if CO2 was lower.
Regards
Ozonebust, you are of course correct, but the natural variation of temperature is far to great to discern the affect of CO2. The best we can do is estimate it and nobody is more qualified to do so than Lindzen.
+ 1 degree C. is a worst case TCS
if you assume all warming
since 1979 was caused by CO2
(even though there is no scientific
proof that ANY warming since 1979
was caused by CO2.)
I use 1979 because that begins the era
of satellite temperature estimates,
with far less infilling than surface temperature
“data”.
“As carbon dioxide is added to the atmosphere, through burning fossil fuels, the atmospheric temperature goes up and this increases the specific humidity of the atmosphere through the Clausius-Clapeyron relationship. The added water vapor acts as a positive feedback and the temperature goes even higher. Specific humidity or absolute humidity is the volume fraction of the atmosphere that is water vapor.”
The contention that the “added water vapor acts as a positive feedback” is highly questionable.
The saturation humidity (mole fraction water vapor in air at 100% relative humidity) does increase with temperature, but for the absolute humidity of air to increase, liquid water has to evaporate into the air.
If we consider a volume of air in contact with a body of water below, initially at equilibrium, and the air temperature rises due to some external heat input, some water can evaporate into the air to maintain the same relative humidity. However, a large fraction of the heat input which raised the air temperature is used to provide the latent heat to convert liquid water to vapor (about 2,450 J per gram water evaporated). At typical ocean surface temperatures (10 to 30 C), the heat of vaporization can be 60 to 80% of the heat input that raised the air temperature. This can be demonstrated by a simple heat and mass balance, as a function of temperature and relative humidity.
This represents a strong negative feedback (-0.6 to -0.8) in the theoretical warming of the atmosphere due to increase in absorption of IR radiation by CO2. Can the global warming alarmists demonstrate that the additional IR radiation absorbed by additional water vapor can provide the heat of vaporization to the water?
Steve Zell, I agree the hypothesis that water vapor is a positive feedback is questionable. More on this and the Clausius-Clapeyron relationship in part B, which may go up tomorrow. In short, measurements have not supported the assertion that water vapor concentration goes up with CO2.
“As mentioned above … 99.9 percent of the Earth’s surface heat capacity is in the oceans and less than 0.1 percent is in the atmosphere. Further, CO2 is only 0.04 percent of the atmosphere. It beggars belief that a trace gas (CO2), in an atmosphere that itself contains only a trace amount of the total thermal energy on the surface of the Earth, can control the climate of the Earth. This is not the tail wagging the dog, this is a flea on the tail of the dog wagging the dog. Extraordinary evidence is needed to convince us of this hypothesis. Since the impact of man-made CO2 on climate has never been measured and is only crudely estimated with unvalidated models, the jury is still out on this idea.”
Andy May,
I agree with all the above, including other known limitations on CO2 forcing that we don’t have to bring up now. What is lacking, however, in most if not all analyses of climate sensitivity is “at what temperature exactly is CO2 interacting with solar radiant energy?” After all, photons are packets of energy, but their energy (temperature) ranges from ultraviolet, which for all I know might vaporize steel, down to radio waves measured in meters, which are probably scarcely above the universe’s background temperature.
So HOW HOT is the infrared radiation that CO2 interacts with to warm the atmosphere?
My first thought about infrared light is the heat lamp available at the hardware or feed store. I don’t think that wraps it. As I understand, at about the time Max Planck discerned quantum mechanics in the classical-physics curve of radiated energy, which most of us are familiar with, Einstein and Planck derived a formula for measuring energy based on frequency times a proportionality constant, the Planck constant, h. That is,
E = vh, with v the frequency, h the Planck constant, and E the energy, that is, temperature.
Since frequency relates inversely to wavelength (λ), “v” may be written as the speed of light divided by peak wavelength, or c/λ, which is Wilhelm Wien’s peak displacement law. It was written before Planck’s general framework and then modified for quantum mechanics. It is also called the Wien approximation. It states that wavelength (λ) for each black-body frequency peaks at a maxi¬mum, given by λ = b/T, with T in Kelvins and b the displacement constant (b ≈ 2900×K) applied to the wave¬length. Higher energy photons at higher frequency are at shorter wave¬lengths, so wave¬ length relates inversely to temperature. By that it is possible to calculate the peak energy or temperature for radiation with which CO2 is active.
If you divide 15μm into 2900°K you get 193°K or -80°C.
Also as I understand it, the Earth directly emits its highest energy IR photons, at 8-12μm wavelengths, through a window to space without interacting with any gases. Wien’s law shows that the 8μm photons exit the atmospheric window at 89°C and 12μm photons exit at -31.7°C, spanning a temperature drop of 120.7 Celsius degrees. By comparison, the “catastrophic” GHG, CO2, peaking 15μm wavelength (in a spread from 13.5 to 17 μm), absorbs and emits photons at a -80°C temperature. That is, by an established normal physical calculation. CO2 is interacting with radiant energy at minus 80 degrees Celsius. It raises the question how a gas interacting with radiation at 80 degrees cooler than ice threatens to warm the atmosphere at all.
I can hardly wait to see how the alarmists weasel out of this one, as weasel I am sure they will.
Yep …. 99.9% ocean, 0.1% atmosphere, CO2 0.04% of atmosphere, …… so CO2 total responsibility of heat in the earths budget …… 0.004%.
We don’t have thermometers that can measure the minuscule effect of CO2.
“By comparison, the “catastrophic” GHG, CO2, peaking 15μm wavelength (in a spread from 13.5 to 17 μm), absorbs and emits photons at a -80°C temperature.”
Picking out the Wien peak as the sole criterion is just wrong. CO₂ can absorb and emit photons at a range of temperatures. Here from Grant Petty’s textbook “A First Course in Atmospheric Radiation” is a measured spectrum, with the Planck curves shown.
here
The “bite” around 15μm is the main CO₂ region. It shows an apparent emission temperature of 255K. It is well to the high freq end of the peak. But that doesn’t mean that it can’t emit (absorption is independent of temperature). If you look at the lower curve, looking up from the surface, the bite becomes a bulge. It shows CO₂ emitting downward, at about 273K (it is over a thawing icefield). It can emit perfectly well at either temperature, even though it is not at the peak.
Here is the spectrum I meant to display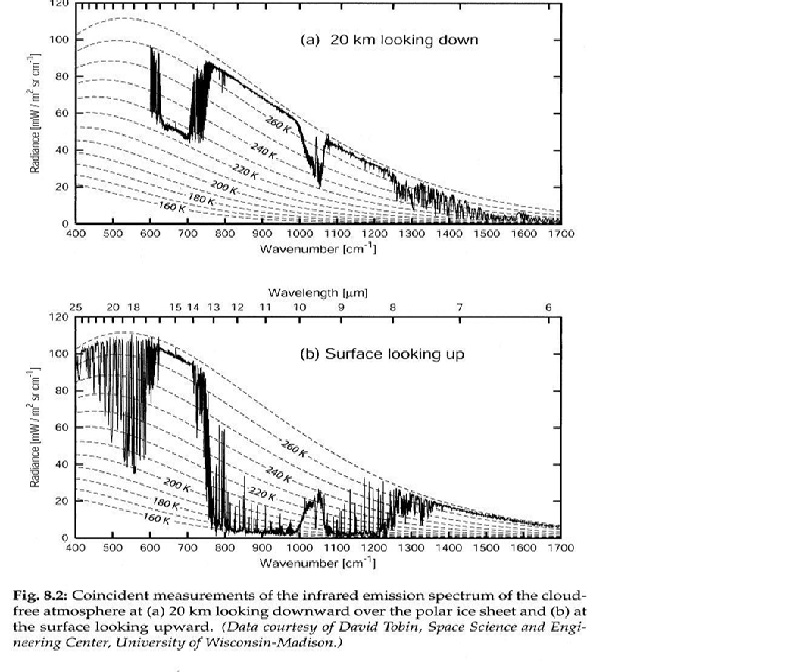
Climate change is due to solar variability, but not for the reasons you refer to. Science hadn’t documented the phenomena as for recent. You can read my papers to take an idea on the true mechanisms behind solar variability and climate change. Even the Svensmark hypothesis on gcr’s is proven wrong by the latest cloud experiment data at cern, if memory serves.
Andy
Your Fig. 3 – the IPCC estimate Earths temperature without Co2 increases.
From the oxford dictionary below.
The IPCC made a guess based on what they wanted to achieve. There is absolutely no credibility to their claim or in this case “judgement”,
Definition of estimate in English:
estimate
verb
[with object]
Pronunciation /ˈɛstɪmeɪt/
Roughly calculate or judge the value, number, quantity, or extent of.
If AGW may rightly, symbolically, could be considered as the Frankenstain’s monster, the ‘Sun is doing it stupid” could be considered as his Bride….
Regardless how much that monster may dislike and despise it’s bride, at some point it must accept it.
A stupendous marriage to be.
Stupid is as stupid does….
And what could be more stupid than AGW,,,, and when at least the AGW has a relief clause of it’s stupidity,,, the “wait and see” forever played limbo,,, as in, maybe not this year but next, or maybe not this decade but the next, or maybe not this century, but the next one most probably…the ever evading waiting clause on and about this silly AGW tipping point…not that much or as much stupid after all, when worse than it contemplated.
The Sun worshipers can not afford and do not have such luxury, of the silly “wait an see” inuendos , unless ready to wishfully jump and embrace the position of the marry go Monster’s bride…as so eloquently and so clearly and “cleverly” put, explained and proposed in this Any’s blog post…
A long stupid way to go still, before the bells ring right.
Oh well, good luck with this, whatever it actually is or it could be…
cheers
To those that say the title of the article presents a false dichotomy, I disagree.
If one considers the climate system as a whole, and defines climate forcings as forces acting on the climate from the outside, what is left are feedbacks that respond to changes in the forcings and/or their effects, and internal variability that essentially redistributes energy within the system.
When the system is defined in such way the external forcings worth of consideration are changes in solar energy (whether due to orbital changes or solar variability), tides, changes in greenhouse gases from human activities, and volcanic activity. The increase in anthropogenic greenhouse gases is a forcing because they come mainly from fossil fuels and thus outside the climate system. The CO2 released by the oceans is actually a feedback to temperature changes.
So far the evidence that cosmic rays can act importantly on the climate is not only lacking, but actually against the hypothesis. Clouds respond to climate changes and therefore are a feedback, and oceanic currents are internal variability.
While a reduction in volcanic activity and putative but unknown changes in tidal forcing might have contributed to the observed warming for the past 350 years, it is clear that the bulk of the responsibility must fall either on solar energy changes, or greenhouse gases from human activities, or more probably both.
Essentially there are no other known choices. Saying, for example, that the warming is due to less clouds would lead to the question of what is causing less clouds, and if it is a change of forcing that would be the cause, not the clouds. Same as changes in ice albedo, that is another feedback.
Thanks Javier, well said!
Javier you are wrong about the galactic cosmic rays while ignoring the evidence for it and the evidence of the earth’s geo magnetic field.
You are also wrong about the solar/explosive volcanic relationships.
Bu the upshot on this thread is everyone thinks they and only they are correct. I guess I fall into that camp to.
Salvatore, i always accept the possibility that I might be wrong about many things. However, to change my mind I require what I consider sufficient evidence, because in the absence of such evidence I don’t believe in anything.
The Laschamp event that took place ~ 70,000 years ago has left a huge mark on 10Be in ice cores indicating that for the past 100,000 years never was such a high level of GCRs. However it is impossible to discern a climatic effect on proxies from the time. This is pretty strong evidence against Svensmark’s hypothesis. And there is more evidence against it. Under such conditions it is impossible for me to believe that the hypothesis is correct, no matter how much I like it.
The evidence for a solar-volcanic relationship is circumstantial at best. Without evidence there is no believing. I leave the faith for the church.
“James Hansen (NASA, as quoted in Fischer’s Scientific American article cited above) once said “We are now completely in charge” of the climate.””
James Hansen has an ego the size of the Earth, Unfortunately, it is matched by an intelligence which would let a mouse down badly.
Rats OTOH are quite intelligent.
Mice, not so much. With miniaturization, something has to go.
In that case I can’t lump Michael Mann in with intelligent rats. In that case you would have to call him some lesser species.
Mickey is not a Mann but a mouse.
A mini-Mann.
Climate has and will continue to change with likely variable consequences – both good and bad. So called scientific analyses as to the cause, and there are countless volumes of publications and web reporting on the subject, will forever fail to predict with any accuracy the future climate. One has only to study past failed predictions, and not just those relating to climate, to observe this.
We can’t say precisely when the next “ice age” will begin, but we can be sure that it will happen. Unless that is humans are then able through heroic geoengineering projects to melt the snow every summer when it begins not to do so on its own.
@ GucciPIC,
All of the so-called “climate predictions” to date, are really weather cycle predictions, as 100% of the unambiguous global climate-change signal trend that we have now, is pre-industrial.
None of it has been produced within the lifetime of anyone reading this.
A low-ambiguity climate-change signal trend takes no less than 250 years to accumulate. Typically it’s closer to 500 years, to become quite unambiguous, depending on the rate of change in the change.
In the past ~4k years the rate of change in the recorded change has actually been slowly accellerating within climate records, because the amplitude has increased with each new major change, so the curve limbs have steepened. Meaning genuine global climate change has become more detectable over shorter periods, during the fastest phase of recent change (the fall into and rise out of the global LIA oscillation), but even then, it still takes a few centuries to see clearly that climate trend develop. And we can only see it retrospectively, hundreds of years in the past.
It is not possible for a global climate-change to be detected within our own lifetimes (thank goodness for that!).
The entire IPCC claim to propose to monitor and regulate “climate-change” on a human scale, is a rediculous absurd hoax, a pure ignorance laden con-job. They UN can do no such thing. Nor will they or any government, ever, as it’s 250 to 500 yrs to obtain the industrial era data then make a global policy, then another 250 to 500 years to see any sort of mitigation or regulation ‘response’!
Aaagghahaha! Oh just forget about that silly people.
Humans are a much too short-lived and so is human modernity to kid ourselves about that folly. We are light-weight flotsom in a super slow-motion storm and we have almost no contol of what happens to the flotsom, on that timescale. Can the flotsom control the storm’s amplitude, development, or path?
This is the absurd toothless hubris the UN IPCC is gaming us with, and the laughable futility of Western frankly quasi-democratic ‘market’ economies, to regulate the grand storm via useless sentimental love-of-Earth displays (oh, go hug a rock!), and pointless sacrificial economic self-destruction flagellating tokenism. Earth does not care if we love it or if we blow our feet-off economically, or if we destroy our political systems to save the world, or if we use coal, solar panels or cow-pats, or if we’ve convinced ourselves we control the Earth’s climate 5my old storm’s next move.
Nor if we have popularly deluded ourselves into thinking that we can see global climate change occurring, via satellite. aarrghhahaha.
No.
Wrong on all counts. What appalling mind boggling self-centeredness and futility our organising political power-centers exhibit.
An actual climate-change prediction today would predict the global climate in a year that’s not less than a minimum of 250 years into the future. i.e. not before about the year 2268 AD, for it to become clear as to the global climate-change, from pre-industrial, to 2018—to now!
People expecting the answers to emerge next decade, or next century, if X or Y prediction comes off, are just deluded. While the UN IPCC are just barking-mad if they imagine they have a clue.
There’s no nice way to say that, but plainly. The discussion here is about indirect solar noise inputs to Earth’s climate noise-making cyclicity patterns.
It aims to hopefully predict noise movements. i.e. the flotsom’s next few wave impacts.
But it’s the wrong scale to predict the intensity of sun-induced storm’s next rain bands and peak and 10-min wind strength, and resulting flotsom-relevant swell and wave highs.
The flotsom is along for the ride, so good luck with the next three waves.
However re: Agnotological Global Warming.
The new Anthropology Climate Disruption Cult [ACDC 🤣] won’t like this great post
“Another process, ocean CO2 uptake, may also contribute to longer term climate changes. The solubility of CO2 in water increases as the water temperature drops. When temperatures drop, as they did in the Little Ice Age, more atmospheric CO2 is taken up by the ocean and this accelerates the temperature drop. The reverse occurs when temperatures rise, as they have recently.”
During solar minima, the increase in negative North Atlantic Oscillation states drives warmer North Atlantic SST’s, reducing CO2 uptake. A warm AMO and increased El Nino conditions drives continental interior rainfall deficits, also reducing CO2 uptake.
******************************************************
Looking at the low sunspot counts the solar variability theory predicts that we ought top be in another Little Ice Age by now but we aren’t. Looks like the end of solar variability theory to me. As to the greenhouse gas theory, it is no damn good because it leaves out water vapor, the most abundant and common greenhouse gas. Everybody expects carbon dioxide to be the controlling gas but it is easy to convince yourself of the opposite. Look a the global temperature curve of HadCRUT3 and you find that global temperature goes up and down while at the same time carbon dioxide amount is absolutely steady, with only a slight curvature due to the constant addition of anthropogenic CO2. Any theory of global warming must account for these observations. And the temperature changes are not random which prevents you from creating those nice smooth averages in your computer.
Arno Arrak May 2, 2018 at 6:33 pm
The “solar variability theory” most certainly does not predict another Little Ice Age by now. Totally the opposite.
The several centuries of the LIA were characterized by frequent solar minima, to include the Maunder grand solar minimum. After many solar maxima in the Modern Warm Period, we are due for a multidecadal cooling cycle, but nothing at all like the LIA. For that we’d need a solar minimum or two, followed by minor warming cycles, then another grand solar minimum.
Not in the cards, IMO. But even if it were, we’re not heading directly into a Maunder-style grand solar minimum. A minimum like the Dalton, maybe.
False choice.
Climate theory holds that the temperature is a function of external forcing and internal variability.
External forcing comes in three varieties.
Solar…which is relatively constant
Ghg…which includes c02
Aerosols..
Not either solar or co2.. but rather the sum of all
Forcings.
When you explain climate as a function of these three,
You will be left with a residual..internal variability.
Not that hard.
I have problems with climate sensitivity calculations.
They fall into two types:
1. Historic data analysis: temperature went up by (x) during a certain time interval, and CO2 went up by (y) during the same interval. It assumes that you know what temperature would have done in the absence of a CO2 rise during that time interval. This is obvious from Andy’s fig. 3. But how can you know what temperature would have done if things had been different? You can be Lewis & Curry and make better guesses, or take what you think might be a more reasonable time interval, but it’s still just a guess. And that ignores the adjustment/homogenization issue: how do you really know what global temperature did?
2. Energy balance analysis. Basically, this relies on measuring the difference between energy in (from the sun) and energy out (LWIR radiated to space). These quantities are measured by satellites, but I wonder about “low angle” stuff. For example, I would ask about incoming SWIR at sunrise and sunset – how much is scattered by dust and stuff in the atmosphere and goes back out to space without being absorbed by the earth-atmosphere system. And then there’s reflection of solar SWIR from shiny horizontal surfaces, where it goes straight back to space (not the same as having an albedo of 1, like fresh snow that re-radiates in all directions). And since outgoing LWIR is radiated in all directions, I would worry about satellite sensors being able to measure LWIR coming at them almost from the sides.
Basically, the energy balance is estimating a very small difference between two very large numbers. And if there’s any uncertainty about the accuracy of either of those large numbers, the difference disappears into the margin of error.
There’s a third type of sensitivity analysis, that relies on established physical parameters and calculates from first principles. Basically, that’s what GCMs do, and they don’t seem to replicate reality very well at all.
Smart Rock, well said and I agree. See part B (up now) for more on your #2 and your comment on error of measurement in the energy balance. The energy flows are only known to +- 10 W/m^2 or so.
There is a problem here in how we think of weather does a specific area such as the UK have its own climate at all or is it warmed up by air coming from further south or colder air coming from the north, so that the sun does not shine or not shine on the UK in the same way as it does in the places that give the UK its weather. I think that at the actual surface of the UK which is static then solar radiation does change the temperature of the actual surface but there are movements of air and water around the globe which change the actual surface temperature more slowly, given enough time the actual surface will reach an equilibrium with the air lying over it but these air flows are usually always changing so that the actual surface temperature does not usually have enough time to reach equilibrium with the air overlaying it and it tends to follow the seasonal pattern of increasing or decreasing radiation for that area. The “beast from the east” had very cold day air temperatures but the rivers did not freeze in the UK as they did in the January of 2010 with higher but more persistent daytime mean air temperatures.
Andy:
One can check the validity or otherwise of the AGW proposition by simple step-by-step logic as follows.
1. Greenhouse Effect (G): The original & correct definition is that incoming solar energy into a container, such as a greenhouse, is trapped inside causing its air temperature to rise.
2. A planet’s greenhouse is its container, the atmosphere, which in turn, is held put by gravity.
3. G is a temperature, that results from the heat held by the gases of the atmosphere. It is usually reckoned to be about 33K (but that is shown here to be seriously in error).
4. CO2, whether natural or Man-made, is a greenhouse gas, but then so are ALL gases. Like all substances, all gases absorb heat in one way or another eg by radiation, conduction, convection and/or diffusion.
5. Therefore, the greater an atmosphere’s quantity of gas ie, its total pressure, the greater the amount of heat able to be absorbed.
6. …and the heat absorbed by each component of any gas mixture such as the atmosphere is roughly* proportional to its percentage in the mixture.
* This close proportionality becomes exact if the specific heat of each separate gas is included.
[Ironically, because CO2 has a 20% smaller specific heat than the average air molecule, it is actually a 20% lesser greenhouse gas than the average air molecule.]
7. Therefore, as carbon dioxide represents about 0.04% of Earth’s atmosphere, that’s about its contribution to the greenhouse effect; immeasurably small. Methane et al have an even tinier effect, and so none can change climate.
Secondly, I believe the Milankovich effect is only about 10% of that required to account for Earth’s temperature variability. And, among other things, the periodicity of solar variability does not match that of Earth’s temperature. There must be something else.
[Try my site at pjcarson2015.wordpress.com – from which the above is taken.]
“Therefore, the greater an atmosphere’s quantity of gas ie, its total pressure, the greater the amount of heat able to be absorbed.”
Correct, but one can add that the closer together are the molecules of gas (due to mass and gravity) the more readily those molecules will absorb energy from the surface BY CONDUCTION.
Thus one can regard the lapse rate slope as a marker for the increase in conduction relative to radiation as one descends into greater densities of gas.
The additional heat at the surface as compared to that predicted from radiation alone by the S-B equation is entirely due to conduction between the mass of the surface and the mass of the atmosphere.
Stephen: ??
More explanation required, please.
BTW: My density theory is quantitatively confirmed by the size of the Greenhouse Effect of each of the three rocky planets that have an atmosphere (Chapter 2A).
pjcarson2015
Start here:
https://tallbloke.wordpress.com/2017/06/15/stephen-wilde-how-conduction-and-convection-cause-a-greenhouse-effect-arising-from-atmospheric-mass/
and click on my name for my website.
I’ve been focusing on the density issue for over ten years.