How does urban-induced warming in Beijing interact with air temperature in summer?

Beijing has undergone several important urbanization development stages since late 1978. Linked with urbanization, the so-called “urban heat island effect” is a key problem caused by urban land expansion. Such changes in air temperature in Beijing inevitably have an impact on the daily lives of its inhabitants, and is therefore of considerable interest to scientists and the wider public alike.
Dr. Xiaojuan LIU and Associate Professor Guangjin TIAN from the School of Environment, Beijing Normal University, used the mesoscale Weather Research and Forecasting model coupled with a single urban canopy model and high-resolution land cover data to analyze the spatial and temporal patterns of summertime urban warming influenced by three stages of urban land expansion during 1990-2010 across Beijing. They found that urban-induced warming increased with urban land expansion, but the speed of warming declined slightly during 2000-10.
They further examined the impacts of heat waves and high-temperature weather on urban-induced warming and the mechanisms associated with the surface energy balance, and revealed an interrelationship between urban-induced warming and heat waves. Dr. Xiaojuan LIU explains their findings published in Advances in Atmospheric Sciences:
“Heat waves can increase surface air temperatures over both urban and crop areas. Our results indicate that heat waves enhance nocturnal urban warming in summer in Beijing and further cause a change in daily mean warming to some extent. That is, heat waves induce a higher increment of air temperature in urban areas than in crop areas. This implies that urban land expansion may heighten heat waves in urban areas. Therefore, urban-induced warming should be considered as one possible source of heat waves in urban areas.”
###
The paper: https://link.springer.com/article/10.1007%2Fs00376-017-7137-8
Modeling the Warming Impact of Urban Land Expansion on Hot Weather Using the Weather Research and Forecasting Model: A Case Study of Beijing, China
Abstract
The impacts of three periods of urban land expansion during 1990–2010 on near-surface air temperature in summer in Beijing were simulated in this study, and then the interrelation between heat waves and urban warming was assessed. We ran the sensitivity tests using the mesoscaleWeather Research and Forecasting model coupled with a single urban canopy model, as well as high-resolution land cover data. The warming area expanded approximately at the same scale as the urban land expansion. The average regional warming induced by urban expansion increased but the warming speed declined slightly during 2000–2010. The smallest warming occurred at noon and then increased gradually in the afternoon before peaking at around 2000 LST—the time of sunset. In the daytime, urban warming was primarily caused by the decrease in latent heat flux at the urban surface. Urbanization led to more ground heat flux during the day and then more release at night, which resulted in nocturnal warming. Urban warming at night was higher than that in the day, although the nighttime increment in sensible heat flux was smaller. This was because the shallower planetary boundary layer at night reduced the release efficiency of near-surface heat. The simulated results also suggested that heat waves or high temperature weather enhanced urban warming intensity at night. Heat waves caused more heat to be stored in the surface during the day, greater heat released at night, and thus higher nighttime warming. Our results demonstrate a positive feedback effect between urban warming and heat waves in urban areas.
now how would a climate scientist go about hiding this?
Well, a scientist wouldn’t.
But a climate pseudoscientist rent-seeker would simply call claim the increasing station temps are due to TheMagicMolecule. In conjunction they would simultaneously and systematically make large reductions in the rural station coverage such that infilling would result in apparent anomaly increases.
Maybe something like “When CO2 settles down to sleep at night in urban areas the blanket/ghg effect is greatly increased due to …………”.
It’s all Greek (Chinese ) to me ?
….algorithms and homogenization
how would a climate scientist
≠======
As I recall this was ‘the dog ate my homework’ explanation. Proving definitely that uhi didn’t exist.
Well, the good news is that this Urban Heat Island effect only alters the temperature in China. In the rest of the world based on the “best” information is that it doesn’t have much of this effect.
A June-July night in Phoenix Arizona (or one of it suburbs) provides plenty of evidence of the UHIE.
My Uncle Harry died some years ago in Phoenix on his way to visit relatives down there. He stepped off of the plane, and into that high summer heat. Poof, he fell down dead on the spot at around 80 years of age. What a way to go, quick at the least.
There is research done by University of Melbourne about that city 10 to 20 years ago I gather, that the UHI for that city is about 5˚C. I have heard of figures up to 13˚C for other large cities.
driving from one side of London to the other with an outside thermometer in the car on winters night some years back registered the fact that London was a couple of degrees warmer than its suburbs, and as much as 4 degrees warmer than the fairly unpopulated countryside where I live only 70 miles from London..
even going into he nearest town 10 miles way shows the magnolias in bloom at least 2 weeks ahead of out here in the countryside
LouMaytrees on April 22, 2018 at 8:06 am
You’re like a little child or the little yapping dog at someone’s feet. But still with nothing to back up your claims.
Btw, UHI effect was debunked long ago. I’m surprised you didn’t come across that in all your ‘years of climate research’.
[??? .mod]
UHI effect was debunked
========?
Every theory we currently have in science has been debunked time and time again.
Put 10 experts in a room and your will have 20 different explanation for X. All equally convinced they are right and the others wrong.
If climate is settled science why does climate science have so many different models each predicting the future. Surely 1 would be enough..
There were two studies, one by McKitrick & Michaels and another by a Dutch group that came to the same conclusion, half of recent temperature rise was due to UHI, using different data sets. https://www.rossmckitrick.com/uploads/4/8/0/8/4808045/mckitrick-michaels-cr04.pdf
One of the studies claiming UHI was not of significance, Jones et al (1990) (of Climategate fame), was debunked by Keenan : https://www.thegwpf.com/climategate-the-jones-keenan-affair/
Apparently many of the monitoring sites had changed location when the Jones study stated otherwise.
You may look further into it if interested.
John
To whom it may concern:
I am not a UHI denier. His name is LouMaytrees, a visitor here who is clearly a climate change denier. 😉
I promised Lou I would share his post.
Okay, I get it. This is not your opinion, but that of LouMaytrees. What they actually mean is, they have read/heard something somewhere (Internet probably) that said UHI was debunked. Thus confirming their biased desire for someone to say it. Now they can cite this as Gospel fact like it’s supposed to mean something,
Alot of text but no numbers or graphs? How much warming did the UHI cause?
“Alot of text but no numbers or graphs? How much warming did the UHI cause?”
It looks like in order to (possibly) learn that, you will need to spend $40 and possibly spend your evenings for the next few months learning to read Chinese.
应的日变化特征来看, 增温的最低值发生在中午, 之后增温强度逐渐增加, 并在日落时刻达到最高峰值. 在白天, 城市化增温效应主要是由城市地表潜热通量的减少引起的. 而夜间城市化
+10
Many bad things happen then (at night).
One (only?) thing that Google is good for is its auto-translate.
Except for one bad sentence break, pretty darn good.
Of course, I can tell you that UHI exists without any expensive (or cheap, for that matter) models – and even without instruments. I live about five miles from the county fairgrounds – they are surrounded by open range – the difference is immediately noticeable, and I live in the suburbs, not downtown. (Except in the rides section – that part is like an oven in the middle of it.)
That’s easy for you to say! 😉
@Peter Langtree
“A lot of text but no numbers or graphs? How much warming did the UHI cause?”
Yes, I see a lot of hand-waving and anecdotal data being presented in this discussion. But in this discussion I see no formal definitions or metrics being proposed.
Evidently, urbanization is changing the siting condition of Chinese thermometers (and elsewhere) over the centuries from mostly rural to mostly urban conditions.
Has anyone quantified the UHI problem in a formal way? How to proceed? Here is some more constructive hand-waving: :-]
First, a “global urbanization metric” is needed to study of urbanization effects. It simply denotes the degree of “urbanization” from zero to 100%. To see this more clearly, let’s use a little ‘thought experiment’ to imagine a parameterized model of the world, fully equipped with continents, oceans and environment. Now this model was written by a divine, omniscient oracle, so let us assume (for our little thought experiment) that it is 100% ‘faithful’ to Nature.
It is equipped with one big Control Knob, labeled “Urbanization”. When I turn the knob fully counter-clockwise to the Zero position. All of Mankind and urban areas completely disappear, leaving only rural areas over all of the land-mass areas. When I crank it up fully clockwise to the 100% level, all of the urbanized areas expand until they fully cover all of the land-masses. I.e. “wall-to-wall” cities. The oceans are not affected by Control Knob, but continue to react to the land mass changes, according to the laws of nature.
So the research questions are:
1. Does Urbanization affect global climate? For example what are the mean global temps as the Control Knob is advanced from zero to one hundred? (I suspect the fully urbanized World would be warmer than the fully rural World. But how much warmer? We need to formally quantify this, so a sub-model which predicts Temperature given Urbanization Coefficient must be developed (by the oracle, of course, because she is 100% faithful to Nature).
2. Compute the actually urbanization coefficient of this world. (I’m guessing less than 5%, but increasing). Does it predict a temperature close to what the oracle predicts?
Of course it does, because the oracle is perfect.
Now let’s change the experiment and let humans try to write this model, which introduces the likelihood of error (and other shenanigans). Could we prove that urbanization makes the world warmer (or colder, or no-change etc), incrementally according to the measured urbanization coefficient?
I assume someone has already tried this, but I’m not aware of the results. I think it is, at least, a useful way to think about quantifying the effects of man-made activities on the earth’s climate.
My guess is that three factors will greatly explain UHI:
1) Photosynthesis: The essential difference between urban and crop areas is the vegetation. Photosynthesis converts electromagnetic energy to sugar. I have noticed this effect, anecdotally, when riding a bike in the city. I gets cooler when you ride by a wooded area.
2) Albedo: Low albedo causes heat to be absorbed during the day, but reciprocally causes heat to be more efficiently radiated at night. So (according to paper) this nocturnal difference enhances UHI effect.
3) Transpiration: Urban surface areas tend to be dryer than crop areas. Evaporation has cooling effect,
It looks like the study is entirely based on models. 🙁
I wonder if Beijing’s heat island is exacerbated by the fact that it is somewhat surrounded by mountains, its pollution certainly is.
models and ” … high-resolution land cover data.”
Shocking news: UHI causes heat to build up in cities, especially in Summer. Further details available at the Institute of the Bleedingly Obvious.
The pollution over Chinese cities does a marvelous job of offsetting warming whether from GHGs or UHIEs
The real problem is that the pollution is not only over the cities, but in them at ground level also.
Gavin be lickin’ his lips.
For scale, it is about 100 km from Beijing to Tianjin. Geoff
For some months I have been chipping away at writing a paper dealing with UHI. Most historic data gives us mainly the daily Tmax and Tmin, recorded when thermometers designed for the purpose cause maker pegs to stop moving each day when the max or min is reached. For 100 years, that is about all we have to work with.
Now, Tmax and Tmin are rather special temperatures, because they are reached when an interplay of thermal effects reaches a described point. At Tmax, for example, there has been a steady T rise as the sun moves higher in the sky, the rise helped by convection of air with hot packets in it surrounding the site, held back if frost has formed overnight, complicated if there is snow around and water phase change effects need consideration, hindered or lagged by the thermal inertia of the screen surrounding the thermometer as the screen heats up. There can be interruptions when low cloud causes lower T, there can be nearby vegetation that casts a shadow on the screen sometimes, other vegetation effects like when mowed surrounding grass changes the effective height above ground of the thermometer, there can be a burst of rain that cools the surroundings – and so on into the night. The actual Tmax recorded each day is thus subject to some weather effects and some non-weather effects, acting in a way that was not observed and recorded at the time and so lost to us forever.
Tmin has a similar story, with not much in common with Tmax once the sun sets. There is only scientific nonsense in subtracting Tmin from Tmax to give a diurnal temperature range. There is also nonsense in taking their arithmetic average and calling it a mean daily temperature, because the factors that cause Tmax do not have much in common with the Tmin factors and we do not now know the past details of each.
When it comes to UHI, where typically comparisons are made between urban and rural settings, there is again nonsense in interpretations because the factors that caused a certain Tmax in the city need not be acting in a similar way at the rural setting. Sure, one can use a blunt object approach and say look, the measured T is higher in the city than its burbs, so there is a UHI effect. The success of this approach has been poor, with people resorting to measuring night light seen from above as an index of a variable affecting T, or using population density maps likewise, without systematic study of whether each perturbing effect is real and quantifiable. IOW, just guesswork.
Guesswork becomes humour when the effects are trivial, but here we have $$$billions at stake for remediation proposals and that is not funny. It is destructive of Science at a rudimentary level with high cost outcomes. Much pain, no gain.
A colleague and friend, Dr Bill Johnston, has been working for several years with data that relate Tmax and Tmin to rainfall. Rain cools. Years with higher rain will typically show lower Tmax than dry years, Up to 60% of the variation in T data over time can be statistically explained by brainfall. It can be used to find breaks in time series T data and to show what homogenization attempts have been up to. For some major Australian sites like Melbourne Regional and Sydney Observatory, Bill has given good evidence that there has been no temperature change since commencement about 1860, when you delete the effects of cooling rain.
No temperature change, no global warming. Arrived at through thought and observation of the original data and a life spent in relevant scientific fields.
If Bill is correct, UHI is a measurement artefact, as is global warming. Think about it. Like, do cities modify the rainfall effect on Tmax in different ways to rural places? Can anyone answer that? Geoff.
urban-heat-island effect and heatwaves are two different phenomenon.
Temperature inversion with pollution layer at inversion point define the night temperature patterns. These are local in nature. Within the city they vary depending upon several localised factors.
Heatwaves are associated with general circulation patterns. In India they are associated with western disturbances. These are not local in nature. The path of these waves depends upon several large circulation patterns in the path of the heat waves.
Dr. S. Jeevananda Reddy
Do folks who blame UHI for all or most of the recent reported surface warming also blame UHI for the similar warming reported in the lower troposphere by RSS and, albeit to to a slightly lesser degree, UAH?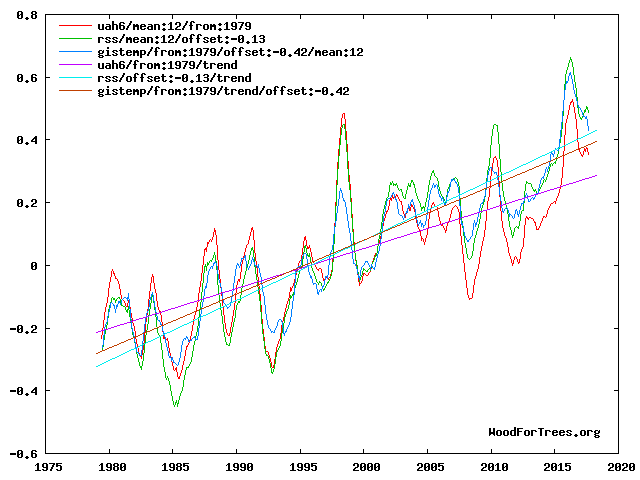
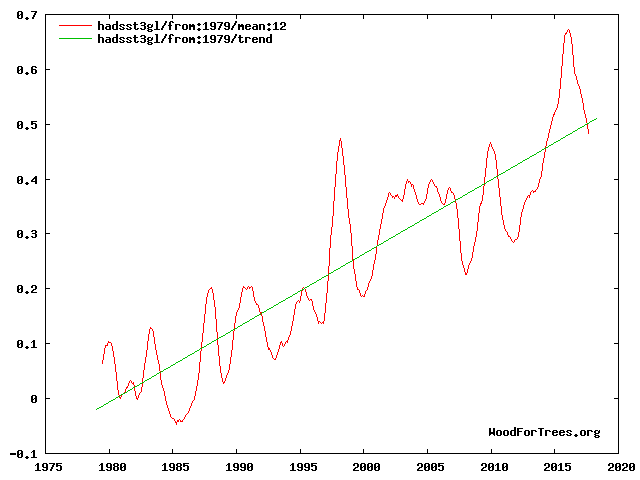
Similarly, do they also believe that UHI accounts for the observed concurrent increase in global sea surface temperatures?
If so, by what mechanism in each case? Thanks.
The mechanism is ocean cycles (PDO+AMO). Why do alarmists always deny the oceans drive the climate?
Not sure anyone’s denying anything so much as asking for an explanation of the alternative mechanism.
You suggest that the land and ocean surface and lower tropospheric warming observed since 1979 is accounted for by ocean oscillations. An oscillation, as the name suggests, is movement back and forth in a regular rhythm. So if an oscillation causes warming in one phase of its cycle it should cause exactly equal cooling in the reverse phase.
Some of us here are surely old enough to remember the various failed predictions of imminent global cooling due to a switch in PDO back in 2008 from folks here on WUWT; for example Don Easterbrook and David Archibald. They got it completely wrong. Their predicted PDO-induced cooling post 2008 has so far turned out to be a period of fairly unprecedented warming.
It’s hard to see how anyone can make such a glib and evidence-free claim like “The mechanism is ocean cycles (PDO+AMO)” when clearly there is no predictive evidence to support it.
Sorry, should correct to say that David Archibald’s post-2008 cooling prediction was based on reduced solar output during solar cycle 24, not PDO.
But here’s the rub: both Easterbrook and Archibald were correct back in 2008 to say that, respectively, PDO had recently entered a cooling phase and that solar cycle 24 would see reduced sunspot activity (reduced solar output). Both of those things happened. Yet the world continued to warm rapidly. Why?
DWR, there has not been any climate warming this century. Obviously, you are claiming El Nino events are climate. End of discussion. As long as you persist with such a ridiculous, anti-science position we will never agree.
Here’s what happened to your “warming”. It came and it left. Gone.
http://www.woodfortrees.org/plot/hadsst3gl/from:2014/to:2018
Anyone drawing a linear trend line going past 2014 is not interested in science. Here is a better view of what has happened this century.
http://www.woodfortrees.org/plot/hadsst3gl/from:2014/to/plot/hadsst3gl/from:2001/to:2014/plot/hadsst3gl/from:2001/to:2014/trend/plot/hadsst3gl/from:2016/to/trend/plot/hadsst3gl/from:2014/to:2016/trend
The data that supports the claim it is the AMO and PDO responsible for our warming is obvious. Even you mentioned the switch to the +PDO in 1977. The AMO went positive in the mid 1990s. After some initial warming, temperatures have now remained flat outside temporary ENSO variation.