You think we had a bad winter here in the USA? Look at Japan where they have walls of snow 56 feet tall (almost the height of a 6-story building).
There’s an avalanche of tourists coming to the Tateyama to see the walls of snow.
This spectacular mountain route, reopened on Sunday after being closed for five months during the winter, expects to receive a million visitors.
The Tateyama Kurobe Alpin Route is a major tourist attraction in Japan.
These large white walls are located in Murodo, at the highest point of the route at an altitude of 2,450 meters and are known as “yuki no otani”.


It has been a rough winter full of snow all over the northern hemisphere, as this newest NOAA-20 satellite image shows:
With stunning clarity and unsurpassed detail, the newest polar orbiting satellite in the NOAA fleet, NOAA-20, took this image of the North Pole. The satellite passed over this area of the Earth at least 14 times to capture it.

The VIIRS instrument onboard the satellite created this synthesized view of Earth with the North Pole directly in the center of the image. If you look closely, you’ll see the outline of the North American continent and the Baja Peninsula on the left hand side. Scientists use the data from the VIIRS sensor to create the ‘true-color’ product you see here. Like a photograph, the satellite reads the appearance of clouds, land, vegetation and water to create these images.
This is the image we have of our planet as it would appear if we could take a single photograph of the entire Northern Hemisphere. The swath line shown on the left hand side represents the start and end of the 24-hour period taken by the satellite to create the image.
Meanwhile the amount of snow we have in the USA is puny by comparison, but still impressive by Spring standards.
A late season winter storm brought heavy snow across a large part of the region on Wednesday, April 18th with a wide swath of 6 to 12 inches. The heaviest snow fell across northeast Iowa, far southeast Minnesota, and southwest Wisconsin. Snowfall rates of 1 to 2 inches per hour resulted in slick, snow covered roads for many areas.
…Snowfall Reports (5 inches or more)…
Location Amount
…Iowa…
…Allamakee County…
1 SE Dorchester 10.0 in
Harpers Ferry 6.0 in
6 NE Postville 5.5 in
…Chickasaw County…
New Hampton 8.0 in
Nashua 5.5 in
…Clayton County…
Monona WWTP 5.1 in
…Fayette County…
Waucoma 1WNW 5.0 in
…Floyd County…
Charles City 6.6 in
Nora Springs 6.0 in
Nashua 2SW 5.8 in
…Howard County…
Lime Springs 12.5 in
1 NNW Chester 11.0 in
Riceville 11.0 in
Cresco 1NNW 9.5 in
Cresco 1NE 9.0 in
Cresco 3N 9.0 in
…Mitchell County…
Stacyville 12.8 in
Saint Ansgar 11.0 in
2 SE Mona 10.0 in
Osage 8.5 in
…Winneshiek County…
9 NE Bluffton 9.0 in
3 ESE Bluffton 8.8 in
Bluffton 8.0 in
Decorah 7ENE 8.0 in
1 NNE Calmar 6.8 in
Decorah 6.0 in
Decorah 5ESE 5.8 in
…Minnesota…
…Fillmore County…
Harmony 10.0 in
Mabel 7.8 in
Peterson 1S 7.4 in
6 WSW Harmony 6.8 in
Preston 6.5 in
Fillmore 1W 6.5 in
2 E Whalan 5.0 in
…Houston County…
3 SE Spring Grove 10.5 in
4 SE Spring Grove 10.5 in
Caledonia 8.8 in
5 SE Spring Grove 8.0 in
Spring Grove 8.0 in
Hokah 4NW 7.9 in
Mound Prairie 7.2 in
La Crescent 7.0 in
…Mower County…
Le Roy 12.0 in
Adams 10.0 in
1 SW Austin 9.3 in
Taopi 8.5 in
Austin WWTP 8.0 in
Grand Meadow 7.0 in
…Winona County…
La Crescent Dam 7 7.5 in
3 S Ridgeway 5.5 in
Saint Charles 5.5 in
…Wisconsin…
…Crawford County…
1 SSE De Soto 10.0 in
DESOTO 1SE 10.0 in
Lynxville Dam 7.0 in
Prairie Du Chien 6.5 in
…Juneau County…
Union Center 7.5 in
Mauston 1SE 5.0 in
…La Crosse County…
La Crosse 7.3 in
Barre Mills 7.0 in
3 W Saint Joseph 6.5 in
5 SSE La Crosse 6.4 in
5 NNE Stoddard 6.4 in
1 W West Salem 5.8 in
1 SW Saint Joseph 5.5 in
1 N French Island 5.5 in
2 NNW Onalaska 5.3 in
Holmen 2S 5.3 in
…Monroe County…
Cashton 7.0 in
2 NE Sparta 5.8 in
…Richland County…
5 ESE Ithaca 7.0 in
Richland Center 6.8 in
…Vernon County…
Purdy 11.5 in
La Farge 9.5 in
3 SSW Westby 9.5 in
1 NE Genoa 9.5 in
Stoddard 9.3 in
Viroqua 9.2 in
Stoddard 5NNE 9.1 in
Readstown 9.0 in
4 NNE Westby 8.3 in
Coon Valley 2W 8.0 in
3 NE Stoddard 7.8 in
Hillsboro WSW 7.5 in
1 NW Valley 7.5 in
Westby 3ENE 7.2 in
2 NW Viola 7.0 in
3 SW Hillsboro 6.5 in
I’ll match your 56′ of snow and raise you 1 degree C.
RS – if the planet is warming slowly and the global circulations are gaining energy slightly (not easy to quantify) – polar air will be brought down more quickly (to the southeast) by the winter sequence of more intense cold core lows? Warmer oceans = higher snow amounts. Stronger trajectories vs modification = an increase in cold records being broken. This is speculative.
Fantasy. Not speculation.
ATheoK,
Not necessarily a fantasy. The great glacial periods have always been something of a puzzle because of the energy issue. Every bit of ice formed on land has to be first warmed from ocean water to atmospheric vapour for transportation inland. The formation of the continental ice fields represent an immense energy transfer, and since these ice fields are perched on land, there is an inherent gain in gravitational potential energy as well that doesn’t release until the ice sheets actually melt. I don’t know about other universities, but this topic absorbed a large amount of beer in lab bull sessions with no satisfactory resolution. This was in part because the actual ice ages are marked by cold dry climates rather than cold wet climates. You can see this in the Antarctic and Greenland ice core data. During the height of the glacial, precipitation is positively correlated with temperature, that is warming is matched by increased ice accumulation. But, after about 11,000 BP (the beginning of the Holocene) the pattern inverts. Interglacial climate shows an inverse correlation between temperature and precipitation. So currently we think of “colder” as corresponding to “wetter.” This stands out plainly in alarmist thinking about AGW. It may infact strongly bias their efforts to “explain” climate.
Thank you MIR – I was going to say, sarcastically, “I blame global warming” – but then it appears you already did so, and you were serious!!! Ha-ha Sir, hilarious!!!
ALLAN MACRAE
You are cruel sir.
🙂
mir,
Global atmospheric circulation would likely decrease in energy with global warming. A fundamental characteristic of global warming is that the poles warm more than the tropics thus reducing the tropic to pole temperature gradient. So speculate away but consider the fundamental thermodynamics.
Duster
l think ice ages reach there peak is due to the Atlantic becoming to cold to feed them with the amount of snowfall needed. Having watched this winter record snowfall amounts l now think it was the Atlantic was mostly feeding the great ice sheets with snow rather then the Pacific.
met in research
Does this extrapolate to a band of ice around the equator and palm trees at the North and South poles?
meteorologist in research – I’m speculating too, but what you say may be reasonable. The key is that there is a difference between “warm” and “warming”. When the world has warmed – is warm – then there will be evaporation from the ocean (taking up a lot of latent heat energy), followed by condensation and freezing in the troposphere (releasing that energy), followed by precipitation (some of it on land). The energy released in the troposphere will be largely lost to space, since much of it occurs at cloud-tops. So the whole process results from warmth but provides cooling. The process would presumably continue while Earth is “warm” long after it starts cooling. Since the process doesn’t seem to occur much during the warming phase, I would speculate there there is another factor somewhere that has changed recently and which contributes to the process – something which effectively changes Earth (or maybe just the NH at present) from warming phase to cooling phase. ie, the snow is a result of and contributer to the onset of a cooling phase, not its initiator. Or maybe it’s just an isolated event and nothing to do with a phase change.
To anyone with more or better ideas on this … I’m listening.
Robert Austin – “Global atmospheric circulation would likely decrease in energy with global warming. A fundamental characteristic of global warming is that the poles warm more than the tropics thus reducing the tropic to pole temperature gradient.”
The planetary wave number has decreased from 7 to 9 down to 5 to 7 in the last two decades. This does slow down the waves and they’re larger.
Mike Jonas – “Since the process doesn’t seem to occur much during the warming phase, I would speculate there is another factor somewhere that has changed recently and which contributes to the process…”
The planet hasn’t been warm enough until 2011 so we’re just starting to see these impressive winters under US and the European storm tracks. This is what we argue about here at the lab, the timing of this onset. Nobody is emotionally married to either side of the debate (but some of our VIPs are, like the posters in here). We (who have to work with each other every day) agree to agree that it’s too early in the warming to find good evidence for the causes of circulation changes.
simpler explanation:
CO2 has a forcing of <1, averaged over the diurnal/annual cycle.
Warm arctic = increased cooling, due to enhanced gradients at night.
high CO2 precedes ice ages. Which have started, as evidenced by the vertical ice tunnels NASA blames on seals but are in fact due to super cold air.
flow – At present the axial tilt isn’t at one of its extremes. The orbit is near its least elliptical shape and precession has us closest to the sun only a few weeks after the December solstice. An ice age would require how many years of solar minimums? That would be interesting to estimate from historical cooling data, if possible.
Notice how, when a prediction is proven wrong, this can be explained away by inverting cause and effect. The prediction is that from (blah, blah, blah) there will be warming is a conclusion. Now the warming does (blah, blah, blah), and becomes a new effect called cooling. Since warming is still in the discussion, the swapping of warming and cooling from an effect to a cause is okay by those this low standards and a problem comprehending English.
“The planet hasn’t been warm enough until 2011 so we’re just starting to see these impressive winters under US and the European storm tracks”
thus speaks someone ignorant of weather history.
Donald Kasper – As I remember the predictions, gradual warming with small variations, no statistically significant cooling (trends), more flooding, more droughts, more heat waves, cold records being broken, stronger thunderstorms and blizzards, fewer hurricanes but stronger hurricanes, seasonal delays and shifts in storm tracks.
These all seemed plausible from what we already knew about each mechanism.
John Endicott –
I hadn’t noticed a pattern trending before 2011, and then it was interrupted for a year and a half by El Nino.
This is what NASA is supposed to be doing.
No…NASA should be concentrating in Space and Space Vehicles. This is the job of NOAA and the US Weather Bureau. NASA is being redundant.
NASA’s climate program is one of the $240 billion in duplicative program the US taxpayer fund each year. One of the reasons government, state and federal, fund duplicative or overlapping programs is that it allows policy makers to pick and chose whose so called “expert” advice they take. If they don’t like one answer they can always go to the another program. Like why does the USA need 16 different intelligence agencies?
OMG
Gosh. Walls of climate change!!!!
Does the snow melt entirely during the summer? What does the runoff look like?
Does the road stay open, or are there avalanche issues?
I want to see the machine that digs the trench doing its thang.
Some of it available here
We have an almost identical machine here in my hometown (Fitchburg, MA). During the big winter recently here in Mass, (2015, I think) they pulled it out of mothballs and the mechanics got it going. Impressive to watch. I watched it fill open tractor trailer beds in about a minute. The major slowdown was waiting for the next truck.
No matter what the weather does, CO2 is still responsible.But only anthropogenic CO2, the natural kind is harmless.
Because anthropogenic CO2 is from un-natural beings who blame themselves for every event on earth
Actually less then 4% of it in the atmosphere is anthropogenic making its effect insignificant.
http://www.atmos-chem-phys.net/14/7273/2014/acp-14-7273-2014.pdf
Jon Aldritt,
I do no know where you got your number of only 4% CO2 due to human influence.
Humans are producing each year a surplus of 4ppm CO2. Half of it is swallowed by the biosphere. Half of it remains in the atmosphere and is added there. Starting from WWII we have added about 30% to the atmosphere. It would be double, if mother nature would not help reducing it.
I didn’t say that more CO2 is bad.
Johannes Herbst
Thank you.
You have largely confirmed my belief that man contributes 2ppm (net) to atmospheric CO2.
For that paltry ‘contamination’, we received 14% global greening over the last 30 years of satellite observation.
Is there any observable, net, detriment to humanity, approaching that scale, caused by increased atmospheric CO2 at 2ppm?
I also note you don’t say CO2 is bad.
But please try to keep the argument in context when you play devils advocate.
It sure looks like our children will never see snow again.
They won’t see the glacier for the snow.
Ben Gunn
s’now way!
🙂
What an appropriate story on Earth Day.
Ha ha ha ha ha!
First chuckle of the day.
Tho not mentioned in the article, it is a regular occurrence for there to be TONS of snow at 8,000 ft on Tate Yama. Its at one of those special spots where the great northern winter airmass of Asia confronts tendrils of moisture laden semi-tropical air from down south. The wind patterns result in plenty of mixing. Snowfall as much as 100 feet (30+ meters) is not all that unheard of.
I kind of wonder how long it takes to melt the stuff. I recall tho’ that rather like the American New England states, Japan has huge swings in winter-summer seasonal temperatures and precipitation patterns. New England regularly has 50% of its precipitation days as snow days between November and April. Yet, it also has a mean daily temperature of over 25℃ for all of the summer. That melts snow pretty darn quick.
Even on America’s equivalent of Tate Yama, (Mount Washington), where 6.5 m (21 ft) of snowfall is average, there are years where it gets 300% of normal. 60+ feet. And sure enough, its nearly ALL gone by August (unless there’s a summer snowfall – also quite common!)
GoatGuy
The snow is only 2 meters deep. The Japanese are just really really small.
That’s very big of you to say so.
Oh good. I didn’t want to sound belittling.
Question: how will this much late snow affect the albedo and what effect will that have on the northern hemisphere temps this summer?
I would think a slightly cooler summer?
From beautiful and cold NW Montana
…. and is it having a measurable effect on sea level ??
The video was worth watching just for the song.
There’s a helium anomaly over Japan.
You wonder how they manage to clear a route through the snow. It must take dome impressive machinery and use lots of fossil fuel.
That was my question as well and a quick search didn’t explain much. Do they have, like, 30′ high snowplow blades or 30′ tall snowblower inlets? Don’t the walls cave in sometimes?
My first thought, after “Wow!” The walls are so clean. Inquiring minds want to know.
Bulldozers push the snow away till 6′ above the road, then blowers come in and do the rest.
See https://www.atlasobscura.com/articles/snow-canyon-japan
SadButMadLad
And yet the report is as though we should celebrate having to spent vast amounts of money clearing roadways of snow. Just to satisfy an old man as to his memories of his village, when a Sat Nav, mobile phone equipped snow plough wasn’t invented!
Seriously, I think this is progress. Snow is the invention of the devil, but somehow, the alarmist’s revere the stuff.
Happy Earth Day comrades.
Tonight vee dreenk wodka to celebrate when global Marxist Leninist communism vil krush Amerika like puny leetle eensect.
You should be careful with moonshine. It’s often poisonous.
Max Photon
Ve dont beeleeve in AGW eether comrade.
So ve shall strangle ze concept until you vestern suckers finally submit to our Capitalist future! Vich is probably more honest than your own socialist contaminated alt capitalism.
Ve haf publicly abandoned communism, just as you asked, yet are still treated as ze enemy, how dus zat vork?
Ve might not be entirely nice, but zen neither is ze Vestern vorld.
Give uz a break VVS!
Postcript……Bit of fun.
After listening to that song, I feel like collecting them all. I’m not sure why, or what I’m even collecting, but need them all.
I saw that and I wondered if the state of California is still sending people out to measure the snow pack in the mountains, the way they used to do in the 1940s, 1950s and 1960s.
In the North Pole shot, on the lower right hand side, Africa shows nicely, Is that white stuff a snow pack in the Atlas Mountains? It’s just to the right of an anticyclonic cloud formation.
I think I read some place that Japan sometimes gets 200 feet of snow on that area. Arigato for the article!
Hi Sara, enjoy your posts. Here is a link for a volunteer network that measures precipitation. There must be someone living in the mountains that records snowfall. In the Rocky Mountain Park system they have houses at 10K feet that someone lives in over the winter.
https://www.cocorahs.org/
Hi Sara,
No, at this scale that’s cloud cover over Morocco and parts of Algeria on 12 April 2018.
Zoom in on this image of 16 April for a better look at the remaining snow on the High Atlas.
How do they plow that high and straight?
They cut it with Gundams.
” I wondered if the state of California is still sending people out to measure the snow pack in the mountains, the way they used to do in the 1940s, 1950s and 1960s.” Yes, they do it every year to determine how much water we’ll have for agriculture, industry, and home use.
I just wondered. Thank you!
have a peek here http://thelostboylloyd.com/2017/05/tateyama-kurobe-alpine-route.html they appear to be using a loader !
I really would love a summer / winter view of this setting
There’s a lot of snow pack east of the Great Lakes in Ontario. http://www.nugget.ca/2018/04/18/snow-pack-breaking-records
The average depth at all three sites (North Bay Golf and Country Club, Corbeil Conservation Area, Shirley Skinner Conservation Area) is 43.4 cm, 613 per cent of normal for this time of year.
Average snow water equivalence is 132.7 mm, an equally incredible 575 per cent of normal.
Side note: If they were writing about a heat wave they would be using __% ABOVE or HIGHER than normal’s – they can barely write the truth about factors that aren’t following their narrative.
~ldd
Luc and other experts on here, a question for you.
Am ‘re-reading “The great Hunger” by Cecil Woodham-Smith about the Irish potatoe crop failure and attendant genocide.
In 1847 thousands of poor typhus infected Irish landed in the quarantine station on the beautiful Grosse Isle in the St Lawerence.
The ice bound river received its first sail ship on April 17th. The writer states that due to the severity of that winter, that was the latest date in many years.
My convoluted question is, due to global warming is the St Lawrence open to shipping many weeks earlier nowadays?
How on Earth do they plow that? Looks a little deep for a four wheel drive Dodge Ram.
Here’s an article on plowing Going to the Sun road here in Montana
http://flatheadbeacon.com/2018/03/30/snow-stacked-high-crews-begin-plowing-glaciers-sun-road/
The Beartooth Highway is not expected to open until May 27, normal. It can still close for snow in June.
“Mt. Tateyama receives too much snow and is too remote to receive continual snow plow treatment, thus for much of the winter snow is allowed to bury the pass. Sometime in early March, a bulldozer specially equipped with both a GPS and a mobile satellite phone is sent up the mountain and over the Snow Canyon. The GPS and sat phone work in tandem to provide the driver a detailed video screen image of the dozer’s location in relation to the center of the snow-buried highway. This driver’s job is not to clear snow, but simply to lay out an accurate track of the road itself. Following the GPS dozer is a team of dozers that will begin the clearing operations. The first bulldozers will push and carry the snow forward, to areas where depths are lower and it can be pushed aside or dumped. Backhoes are used to help widen the road. When the bulldozers have come within six feet or less of the road, the rotary blowers can begin their work, and help to at last reveal the long buried asphalt.” link
Some of the April 18th snow is still on my roof – I was planning to work on the gutters this weekend but I’ve had to put it off.
Big Cottonwood Canyon just east of SLC gets over 400″ a year. I’ve seen people’s driveways look like that.
man, long weird month. morning of 4-19-2018 was 27 deg F here, 4-20 was 31 deg F here mid-maine.
stuff is not growing like it should, for first time in decades father is not able to get any maple syrup as local climate has screwed the trees minds up.
forgot to mention, on 4-19-2018 had snow flurries here. and many places around still have snow cover on ground.
It’s not climate change. It’s something else.
M I R
Indeed.
I think it is the Adjustocene Rising.
Auto
Trees with leaf buds are finally starting to open up, just a little bit.
Cold nights are slowing the process, but clear skies and lots of sunlight are helping. I’ve turned the furnace down, but not off.
Upper northeast corner of Illinois, Lake County, 35 miles north of Chicago, 5+ miles west of Lake Michigan.
Sara … even here in Northern California, and with the benefit of the Pacific Ocean all vegetation/trees are experiencing delays in budding/new growth. This is a shift of the climate which has now made itself clearly visible.
Awesome ‘polar view’ image of the Arctic and northern hemisphere ice and snow pack!
RE: “How on Earth do they plow that?”
Looks like a combination of a large track hoe pulling snow down and cutting the side walls, followed by a powerful articulated snow blower truck blowing the snow up over the side walls.
https://youtu.be/_8gLFJG6UpY
This road was identical last year. I remember the photo.
Ja, ja
it is warming, in the NH!
Must say, I could not find any warming here in the SH.
New Zealand has been looking downright nippy of late. All of the alarmists down there may start rethinking their energy strategy by the end of this upcoming southern winter.
Goldminor
by my results, Christchurch ‘warmed’ by -0.004 K/annum since 1974
in other words: it cooled by -0.18 degrees C
almost 0.2K
….on average…
https://www.google.com/amp/s/www.cbc.ca/amp/1.4628156#ampshare=http://www.cbc.ca/news/canada/newfoundland-labrador/polar-bear-population-hunt-nunatsiavut-1.4628156
What a wasted opportunity, they could have used the equipment to make the world’s biggest snowboard half-pipe.
Its still supposed to be warmer than average in the US. https://www.ncei.noaa.gov/news/national-climate-201802
Hard to believe.
I’d like to see video of them in the process of clearing that road.
See video attached to
J Mac
April 22, 2018 at 9:46 am
Has there been is a bad weather alert for NE USA for next weekend.?
As there looks like there will be a slow moving low tracking across that area between the 27th-30th. Watch out for the chance of some record breaking late season snowfall.
The numbers are in for my town (central Tohoku).. This winter we had 11.5 metres of snow. The records go back to 1959. Average winter snowfall is 9.7 metres and the maximum was 16.3 metres in 2012. That was fun (not).
These numbers are taken in the town, not up the mountain. Spring is here and the local farmers are setting up to prepare for rice propogation and planting.
Serious question here. How do they know where the road is and how do they cut the snow banks vertical?
See Mark’s comment further down. The ‘snow walls’ are produced artificially by bulldozers operating on the road every spring; they are not cut vertically and the surrounding snow is nowhere near that deep.
All that high albedo, acrross the high latitude northern summer, will add up to a great deal of global cooling. Standby for Arctic sea ice to extend this comming summer and winter.
R
Am I correct in understanding there are mainstream scientists in the US who are saying that this is exactly what the science of global warming aka climate change was predicting,namely “climate disruption”?
I have a quote to this effect from Will Steffen in Australia.
No doubt earlier WUWT posts have dealt with this.
Actually, this is exactly what we once expected–and observed–during periods of global cooling.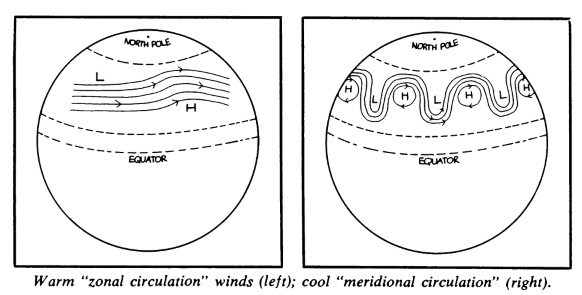

Chilling Possibilities, 1975:
” During warm periods a “zonal circulation” predominates, in which the prevailing westerly winds of the temperate zones are swept over long distances by a few powerful high and low pressure centers. The result is a more evenly distributed pattern of weather, varying relatively little from month to month or season to season. During cooler climatic periods, how- ever, the high-altitude winds are broken up into irregular cells by weaker and more plentiful pressure centers, causing formation of a “meridional circulation” pattern. These small, weak cells may stagnate over vast areas for many months, bringing unseasonably cold weather on one side and unseasonably warm weather on the other. Droughts and floods become more frequent and may alternate season to season, as they did last year in India. Thus, while the hemisphere as a whole is cooler, individual areas may alternately break temperature and precipitation records at both extremes. “
================
United Nations Fisheries and Aquaculture Org (circa 2000)
http://www.fao.org/docrep/005/y2787e/y2787e03.htm
“It was found that “zonal” epochs correspond to the periods of global warming and the meridional ones correspond to the periods of global cooling. (Lamb 1972; Lambeck 1980).”
===============
Feb 2018 – the new “Arctic amplifier” story:
“Climate change, true to the predictions of the past half century [snowfalls are a now just a thing of the past!],has led to faster warming in the Arctic than in the temperate zones. So the temperature difference between the two regions has been lessening.
Research suggests that this reduction in the temperature difference is robbing the jet stream of some of its strength, making it wobblier and contributing to more temperature extremes. ”
(insideclimatenews)
====================
Anything that happens today “was expected” –retroactively via new conjectures–by the high priests of the climate cult.
But that isn’t how a real science works, Herbert.
That is just the neatest thing! I would love to see that much snow in one place! Thanks for sharing the article.
Cool pics, thanks WUWT!
Think the title of this page should be “Thing of the past” in Japan 56 feet high!
If you are going to be intellectually honest here you should point out that the roads walls are artificial in that they are created that high using a snow plow. It is created every year. I’ve been there myself. Whether this year is a record I don’t know. You don’t seem to say. But the implication of the article is that it was unusual to have this much snow in Japan and you then linked it to record snows around the globe. This is a bit dishonest. I see you pointing out this kind of dishonesty (linking unrelated effects to push a narrative) from the other side so it is disappointing to see it here. I remember a climate change advocate using this Japan example in a slide show to show effects of extreame weather. Be honest and explain things for what they are. Not what you want them to be.
If you were going to intellectually honest you would admit that you are making stuff up. Those walls are cut by a tracked hoe using a big bucket on a long arm. The snow is then trucked out. If you look at the photos above you can clearly see the bedding structures formed as the snow accumulated at different rates. I can also see what I think is cross-bedding from drifting. These are primary depositional structures, similar to those that form on my garage roof and become readily apparent in spring.
Opposite my house is the station carpark. This is used to store snow. The ploughs come through and move the snow to the side of the road. After they have finished the blower comes through and pumps it into the carpark. When the pile gets to be about two stories high (as high as the blower can effectively pump it), the pile is dug out and trucked out. This pile looks like mulch and never has bedding structures.
I know how this is done because I have lived in northern Tohoku since 2002. In my town at 80 metres ASL we average about 9.5 metres of snow every winter and can get more than 16 metres. The western slopes of the western mountains get far more than that.
Japan gets this amount of snow from the Lake Effect, with the prevailing NW wind flowing out from the Siberian High, loading with moisture when it crosses the Sea of Japan and dumping when it meets the mountains. The difference between the NA and Japanese sytems is the fetch: across the Sea of Japan is greater than 1,000km, and the Sea never freezes.
Individual locations may have seen colder than average temperatures, but according to the UAH satellite TLT database, both the northern hemisphere and the US lower 48 states were, on average, warmer than normal during the northern hemisphere winter just past (Dec 2017 -Feb 2018): https://www.nsstc.uah.edu/data/msu/v6.0/tlt/uahncdc_lt_6.0.txt
Last winter was the 3rd warmest across the northern hemisphere according to the UAH TLT record, which starts in 1978. The only warmer NH winters since 1978 were those that occurred during the 1997/98 and 2015/16 El Nino events. The fact that this winter occurred during what NOAA has now officially classified as La Nina conditions is all the more remarkable: http://origin.cpc.ncep.noaa.gov/products/analysis_monitoring/ensostuff/ONI_v5.php
Perhaps the combination of La Nina conditions and above average winter temperatures contributed to the snowfall events referred to?
Maybe its just me, but the engineer in me says what could go wrong with cutting a big trench across the slope of a large mass of material with naturally occurring planes of weakness…….
@dean. Excellent question, The answer is yes and no. 🙂 Avalanches generally occur when loosely packed fresh snow lets go. That’s not to say that packed snow won’t collapse too.
What is certain is the snowpack has been building and compacting under its own mass since late autumn. As well as the compaction, the slidy-snowflakes have been sublimating and precipitating as interlocking cubic crystals. That ice mass has tensile strength which is why floating ice sheets remain detached to land, glaciers have snouts and the mass of ice and snow hanging off my roof is trying to crush my eaves rather than falling to the ground. I have to get under the “glacier” with a blade on a pole or get up on the roof with a shovel to cut it. Its serious work.
The definitive part to yes and no is that snow is never stable. It is always mobile: compacting, re-precipitating and flowing downslope. It flows off my garage roof with a 2 degree slope and by spring I’m hacking at the overhanging ice that formed in late December. When I first moved to Japan, I was shocked to see all the mountain road crash barriers as lengths of twisted steel attached to flattened poles. Those ARMCO type barriers are being replaced by steel cables. The cables can restrain a vehicle while allowing the ice mass to flow past. Dealing with Japan volume snow isn’t simple. I’ve put a lot of thought and effort into winter preparation, and every spring I have to make repairs and re-confugure stuff.
“56 feet” is that a typo? About 56mm of snow caused the UK to grind to a halt recently.
Look at the picture. By the way, “yuki no otani” translates as “big snow valley”.
Yeah yeah yeah, but South Australia has been warm.
“There’s an avalanche of tourists coming to the Tateyama”. It is absolutely negligent for tour companies to put that many people on a slippery hill above a city. How many injuries and deaths were there?
Meanwhile in Montana… broke our seasonal snowfall record today, and it’s still coming down hard across much of the state.
https://www.weather.gov/byz/2018SeasonalSnowfall
Why do journalist believe buildings are 10 feet per floor?
An apt. bldg., maybe, not typical high rise bldgs.