This came to me via a tip, but to be honest I get so many daily emails and comments I’ve lost the original source of the tip.
This is via the Canadian Ice Service, and it’s a view I have not seen before. It shows a polar view looking down at the North pole which is a composite of several days worth of MODIS views via NASA Goddard to create a Composite of the Arctic image. The actual image is very high resolution and I can’t show it fully here, but the detail is quite good. To help orient you, I’ve annotated some landmarks on this preview image.

You can see the full image here, and click the image again to zoom in on it. The sheer magnitude of area covered by ice and snow is quite impressive, and it’s a useful image to show to “I read the headline only” alarmists who believe that the North pole is either burning up, missing most of its ice and snow, or both.
I’d love to include this on the WUWT sea ice page, but unfortunately, Environment Canada has chosen to produce this image from a Perl Script, rather than an image URL, and I have no way that I know of to parse the most current image out of the URL:
http://ice-glaces.ec.gc.ca/cgi-bin/getprod.pl?prodid=MODISCOM-T&wrap=0&lang=en
If anyone has any ideas, please leave a comment.
Honestly, the alarmists will be more interested in the finger of blue near the North Pole than the two feet of snow in Wisconsin in April.
Anthony, How does this look?
OK not much better than yours 🙂
Well at least you have it as a .jpg file, rather than a URL with a .pl on the end. For it to work on my end, we need a URL that serves the JPG from the source, so that when the image changes, the image in the Sea Ice Page changes.
Well full sized version can be found here “https://rogerfromnewzealand.files.wordpress.com/2018/04/arctic-ice-2018-22.png” I have put it in quotes in case it jams your site. Hope this helps.
Sorry I cant help with the interactive.
Looks like a proprietary product designed to resist real-time reproduction. You need script that renames the downloaded images for wordpress. The original image size (3902×4106) might also be more than is practical.
Nothing unusual about open water in the Barents Sea.
Courtesy of the North Atlantic Drift, extreme reach of the Gulf Stream.
“Nothing unusual about open water in the Barents Sea.”
Or anywhere else in the Arctic, any time of year. Weather moves ice => open water.
Icepilot,
Yes, tragically and inviting open lead is what led the Franklin Expedition to its doom.
Do our resident sea ice fretters realize that less than 40 years after the ‘year without a summer’ folks were attempting to navigate the northern passage, drawn by the lure of open water only to have weather doom their attempts?
Don’t forget that the USS Skate surfaced at the North Pole during winter.
“While the Skate was unable to surface on its first voyage to the pole, on 17 March 1959, she became the first submarine to surface at the North Pole with Calvert describing the historic moment in his book, saying, “Slowly we blew the tanks and the Skate moved reluctantly upward. It was apparent we were under heavier ice here than any we had experienced before.” While at the pole, Calvert and the crew planted an American Flag in a cairn they built out of ice blocks and put a waterproof container in the cairn with a note commemorating the event. The crew also held a ceremony for the late Arctic explorer Sir Hubert Wilkins and committed his ashes at the pole. In 1931, Sir Hubert had conducted an Arctic expedition in the disarmed research submarine Nautilus (ex-USS O-12). After reaching the Pole, the Skate continued its mission to pioneer arctic operations during periods of extreme cold and maximum ice thickness. When the submarine returned to port, she was awarded a bronze star in lieu of a second Navy Unit Commendation for demonstrating “… for the first time the ability of submarines to operate in and under the Arctic ice in the dead of winter….”
https://archive.org/details/20184AtSeaWithTheUSSSkate
“In August the Arctic was at its bland best, with continual daylight and temperatures above freezing. Cruising under the 10-foot-thick ice pack, we repeatedly had found open water where we could surface.
Now in March the Arctic was at its worst. There would be only partial daylight, the temperature would average 30 deg below zero, and the welcoming leads (elongated cracks in the ice) and polynyas (larger, lakelike bodies of water) would in all probability be sealed. But we hoped to prove conclusively that arctic submarine operations are possible at all times of the year. We were going back, and what was more, we intended to surface.”
https://books.google.de/books?id=YEgEAAAAMBAJ&pg=PA130&lpg=PA130&dq=skate+1959+arctic+journeys&source=bl&ots=Q3SNvUY9j0&sig=GBb9WYXOOntQ_VvyWeDr7uueJ6s&hl=de&ei=r0ClS4v_DsvDsgb8w_3JCA&sa=X&oi=book_result&ct=result#v=onepage&q&f=true
John
So what is your point? Are you trying to say the ice back then was not as substantial as now, because if you are, the fact that the submarine surfaced proves nothing.
Funny how important a single data point can become, depending on whether it supports or undermines your point.
Simon, I was replying to renbutler’s comment “the finger of blue near the North Pole”. As USN Commander (James Calvert) observed there were numerous “elongated cracks in the ice” and “polynyas” which he hoped would have thin ice cover for him to surface at the pole during his winter voyage.
BTW, I didn’t realize you were acting as a grumpy site moderator.
[The mods are not grumpy.
Unless their coffee is cold.
Or their cup empty.
Or both.
Or their mug is only half-full. .mod]
FYI – Subs don’t surface thru multiyear ice (the ice that survives the summer), only first year ice. The recently frozen seawater is consistent, flat as a pool table & rarely exceeds six feet. It’s also much weaker, since the salt has yet to migrate out of the ice. Multiyear ice turns that aqua blue of fresh water, because it is. Two inches of fresh water ice will hold a person. That takes six inches of frozen seawater … & you don’t want to stand in the same spot for too long.
You could always display the image on your screen as large as possible, then do a screen capture to the clipboard (Alt-PrtSc), open your favorite photo editing tool, paste in the image, crop it to remove extraneous window frames and such, save it as a JPG, then upload to WordPress. It wouldn’t have all the original detail or resolution, but it would be good enough to get the message across, and you could still link to the original.
Anthony- Download and install Irfanview if you don’t already have it (you’ll love it). Save the file as a .pl file and open it in Irfanview. There will be an error message that the file a .jpg that has an incorrect file extension. Let it rename the file and save it. viola!
Here is your Jpeg file: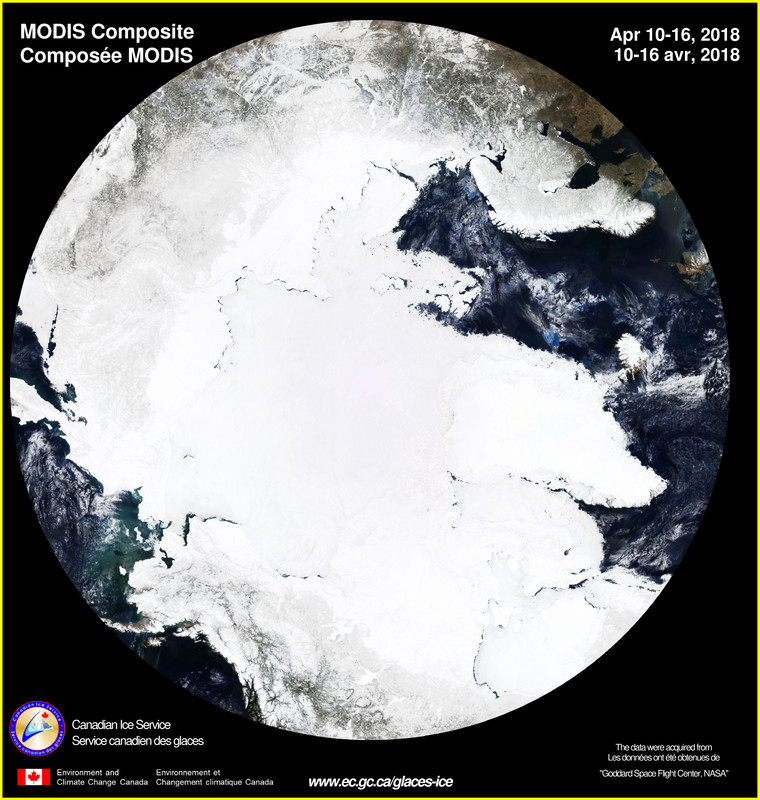
“Canadian Ice Service”
Sounds like a company that leases Zambonis or something.
I uploaded a 2 megabyte file and it’s reduced to 92 KB here on wordpress, bummer.
Pop, I call them when my drink gets warm while watching hockey playoffs. Take off, eh!
Right-click the image, click save as, will download as pl file. open folder on desktop right-click image, rename as a gif file. Walla.
If I do that, Irfanview tags it as the wrong file extension again. Irfanview is free, easier to use than Photoshop and will use many photoshop add-ins.
https://www.irfanview.com/main_download_engl.htm
Sorry to be pedantic, but the word is not “Walla,” it is “Voila,” with a grave accent over the “a”.
and to be more pedantic, if you are going to point out that it is it wrong you might as well point out how to spell it the right wrong.
“wa-lah”
I do not think you are really sorry at all.
Anthony, I just sent you an email. its from my job (bank mail server in Colorado)
It’s a JPEG.
Anthony, I just sent you an email. its from my job (bank mail server in Colorado)
It’s a JPEG.
I think you just put the url in your sea ice page. be sure to scale the image. I assume the image changes daily or something. Of course they may not want you to link to it externally so you may need a script to download a fresh copy daily.
hm it removes the url I send, trying again:
src=”http://ice-glaces.ec.gc.ca/cgi-bin/getprod.pl?prodid=MODISCOM-T&wrap=0&lang=en” width=”50″ height=”50
You realise that when all that ice melts it will alter the salinity of the Ocean and stop the Gulf Stream.
This is a vision of the day after tomorrow’s disaster!!!
Don’t forget it will also expose the “dark ocean” and heat it up like a mall parking lot.
Stop the Amazon that way, no need for pesky dams
Dogs and Cats, Living together! Etc. etc.
Emailed it to you, Anthony. MODIS is a good imager. Only two were built. They are on the Aqua and Terra satellites.
Good image. How many wadhams is that?
13. RECORD LOWEST for the date for the satellite period. From JAXA:
https://forum.arctic-sea-ice.net/index.php?action=dlattach;topic=2223.0;attach=99720;image
they are all over the place….
http://ocean.dmi.dk/arctic/plots/icecover/icecover_current_new.png
“for the satellite period”
You say that is if it meant something.
Not according to NOAA.
http://nsidc.org/arcticseaicenews/charctic-interactive-sea-ice-graph/
Arctic sea ice minimum extent has been growing since 2012, after falling from its near-century high in 1979. Meanwhile, Antarctic sea ice grew from 1979 to its record high in 2014. So increasing CO2 explains neither observation. Sea ice grew from the late ’40s to late ’70s despite rising CO2.
As with so many climatic phenomena, sea ice fluctuates in ~30 year cycles. Nothing the least bit out of the ordinary is happening with global climate.
“they are all over the place….”
Except higher.
“Arctic sea ice minimum extent has been growing since 2012, after falling from its near-century high in 1979.”
The linked graph doesn’t show that at all.
http://nsidc.org/arcticseaicenews/charctic-interactive-sea-ice-graph/
Got any evidence?
Arctic sea-ice volume has crashed and global sea-ice area is also way below the average. Looks to be 4σ and past a tipping point.
Keep up fellas.
I not only have evidence, I have NOAA’s own NSIDC Charctic charts and data:
http://nsidc.org/arcticseaicenews/charctic-interactive-sea-ice-graph/
Minima:
2012: 3.387 million km^2
2013: 5.064
2014: 5.029
2015: 4.433
2016: 4.139
2017: 4.636
Clearly you have not been watching sea ice for the past decade.
Where ice is now doesn’t signify, as we keep having to teach each new CACA Koolaid drinker who shows up here. If in fact you are different drinkers.
zaza….how much ice should be in the Arctic?
There are always freak weather events, such as the summer cyclones which produced the low years of 2007, 2012 and 2016, but odds are that the 2012 record won’t be broken for about 55+/- years.
The five year average for 2008-12 was also lower than for 2013-17, IIRC. The trend is definitely up.
Sorry. Please try to keep up to date. Thanks.
Also, the trend line for the past 11 years, ie 2007-17, is up.
Chimp, the minima for the last three years are lower than the previous 2, so how can you say the area is growing?
Because all of these are greater than the 2007 and 2012 minimums.
By the way, less Arctic sea ice at spring maximum = More heat loss to space from the newly-exposed Arctic ocean.
Less Arctic sea ice at fall (September) minimum = More heat loss to space from the newly-exposed Arctic ocean.
Less Arctic sea ice at winter = More heat loss to space from the newly-exposed Arctic ocean.
It is only those few short weeks between mid-April and mid-August that more short wave solar energy is absorbed by the exposed Arctic Ocean than is lost from the open Arctic ocean by increased convection, long-wave radiation, and evaporation.
Krisiti, and they are all bigger than 2012, so how can you say it is not growing?
BTW, the recent years are recovering from an El Nino, which always is a big ice melter.
Kristi
This is another way to look at the ice. The ice today is clearly thicker than it was 10 years ago. Let’s see if it presages a recovery with the sea ice extent expanding as well.
http://notrickszone.com/wp-content/uploads/2018/04/Arctic-ice-volume-2018-April-2008-comparison.png
Kristi Silber April 19, 2018 at 6:36 pm
I’m glad you asked.
The record low of 2012 was an historic low of the natural ~30 year cycle. Its like is unlikely to be seen again for decades, barring an extreme random WX event.
The five years after that low were the first such interval since 1979 in which a new, lower low was not made. The five years after that record low averaged higher than the five years containing that record low.
By whatever statistical prestidigitation you want to use, Arctic sea ice is growing. The anomalous low of 2016 owed to yet another Arctic WX phenomenon, as in 2007 and 2012, but this time boosted by the super El Nino. The huge rebound in 2013 and 2014 owed to so much heat having been blown off in 2012.
There is no CO2 signal in sea ice. Fat Albert Gore’s question, if not man, then what accounts for declining Arctic sea ice after 1979 has been answered exactly as we pro-science skeptics always said it would be, ie natural variation. Arctic sea ice is still way above its average for the Holocene.
Where is the crash of sea ice volume? According to Danish research institutions like DMI the 2018 sea ice volume was in line with 2016 & 2017. Since march it is increasing sharply.
http://polarportal.dk/en/sea-ice-and-icebergs/sea-ice-thickness-and-volume/
“Arctic sea-ice volume has crashed ”
Here are the only existing measurements of sea-ice volume:
http://www.cpom.ucl.ac.uk/csopr/sidata/thk_ts_0.large.png?version=1
Doesn’t look like much of a crash to me….
Nice polar shot! Does this mean I should get more frozen pot pies ASAP
Eskimo Pies too!
Sara! Whatever floats your boat, nowadays I guess. I didn’t know they were putting pot in pies now!
It is 420 day today in California, the day it became legal.
Here is a spot which I have been watching for the last year. I chose the location as it was a boundary line for some time between colder arctic waters, and warmer waters to the east. That has now changed since January of this year where the sst has changed from 33 C on Jan 1st to 28.8 C current as of today. This is the coldest temps at this location since I have been keeping track. Imo, this is an important sea change as it could well herald the return of the missing sea ice which has been gone from this area for some years now. … https://earth.nullschool.net/#current/ocean/primary/waves/overlay=sea_surface_temp/orthographic=3.90,78.61,672/loc=45.390,75.522
Do you 33F and 28.8F?
Yes, I meant to say Fahrenheit. I didn’t sleep well last night, and this mistake was a result.
True, there has been unusually much ice in this area this winter. On the other hand there has been less ice than usual north of Svalbard, so it could be that the western branch of the Gulf Stream is stronger and the eastern weaker this year.
goldminor,
I really like the nullschool site, but don’t always understand it. I get that the color scale is showing cooler to warmer, but is there a temperature scale that it correlates with? For example, which area/color are you looking at that represents 28.8 (~29) °F?
You get the temp/wind/moisture content at any spot by clicking on any given location. For ocean temps you have to click on oceans and then either sst/ssta for the readout. The spot marked. Here is the boundary spot which I have been observing for a few years. …https://earth.nullschool.net/#current/ocean/primary/waves/overlay=sea_surface_temp/orthographic=3.90,78.61,672/loc=45.390,75.522
goldminor,
Got it, thanks for the response. I look at this site just about any time someone posts something about it, but do not know all the ins-and-outs. Thanks for an additional tidbit of information.
I keep it tabbed to my upper toolbar and run it from time to time to get a better idea of incoming weather for our region, along with satellite/radar composite at Accuweather. Still playing around with the different functions.
@ Phil and 2hotel9 …I have a folder with around 18 links which allow me to view what I consider as important spots to watch. I then save daily pics as screenshots to the appropriate folders. I now have a nice library which I can instantly reference as needed. It also allows me to respond in comments to where I can quickly point out that this is what happened on this day of the year at this spot on the globe.
Nice! I am only semi-computer literate so it takes me a bit to finger things out. I have several folders set up for hurricane tracking, other than that I just put science and climate links in a science&climate folder in bookmarks and then have to scroll through it looking for things. I ought to separate all the space related links into their own folder. By far the largest collection of items in folders I have is USG documents from Thomas Law Library and Library of Congress, plus piles of discs with same. Funny how when you go back to either source things change or disappear, almost as if they do not want people to follow what they have and are doing. I have 36 discs just of Obama Care crap.
I’m with you on the semi literate computer skills thing. I was a late comer to computers. Good organization using folders helps a good deal in being able to readily access information. It is especially helpful when one’s thoughts are flowing swiftly so that you don’t break your the thought stream.
I actively fought the computer age for quite a few years. My first computer experience was in early ’80s in US Army, and boy did they suck! Wasn’t until 1999 that I gave in and bought first computer, been banging away ever since. Got a laptop in 2002 and really got hooked. Used to do a lot of physical records research and can run micro fiche like nobody’s business, got a nasty lung infection from dust mites in GU’s old library annex. Now its all digital download, burn discs and run through cases of paper and printer ink. Oh, well, somebody has to keep track of what “they” are doing! : )
Anthony ==> This url will load the image as a jpg in a browser window:![]() http://ice-glaces.ec.gc.ca/cgi-bin/getprod.pl?prodid=MODISCOM-T&wrap=0&lang=en&format=jpg“> construct on the Sea Ice Page — maybe.
http://ice-glaces.ec.gc.ca/cgi-bin/getprod.pl?prodid=MODISCOM-T&wrap=0&lang=en&format=jpg“> construct on the Sea Ice Page — maybe.
http://ice-glaces.ec.gc.ca/cgi-bin/getprod.pl?prodid=MODISCOM-T&wrap=0&lang=en&format=jpg
I don’t think this solves your problem of needing a jpg to load under WordPress rules….
I think you can use the above URL in an
I’ll try that again:

WordPress shuttles all image requests through a process that disallows anything with ? attributes….chops them…decides they are illegal scripts or html.
A script on a local machine that downloads that URL as a jpg above and loads it to file location that can be accessed with a simple url ending in “.jpg” will do the job. (I don’t have a server that is available 24/7).
Canadian Ice Service, eh? I wonder if Climate Barbie has had a look at this.
Phantor48 …
Unless McKenna has called you something (like a Denier ).. I don’t think disparaging her in that way is helpful. She got the job because she is a competent zealot not because she resembles a stereotype.
It’s comforting, though, to realize she is forced to publicly support a pipeline from Alberta to the coast. That must burn both her zealotry and her activist sentiments. Such is life when you commit to activism through political office.
Well anybody that will work for a PM that fiddles as Rome(Canada) is burning deserves any epithet you want to hurl at her. My country is going down the tubes ( Ex: open warfare between 2 provinces which is still heating up) and the greenies are just staring at this as if zombies. See one of the latest WUWT articles about this.
“She got the job because she is a competent zealot not because she resembles a stereotype.”
Do you have proof, or even just hint, of that?
As long as everyone is disparaged just like she is, and such is the case, why would she got a free pass out of satire and mockery that every politician has to endure?
Now, I won’t use “climate barbie”. This is insult to barbie.
‘Competent’? You missed the prefix.
Isn’t a competent zealot itself a stereotype?
Her zealotry is suspect due to her established ability to stand in the background smiling while more senior cabinet ministers support the Trans Mountain pipeline. Her competence is suspect due to the fact that she doesn’t understand how fatally flawed Climate “science” is and she can’t make a case against O & G development. Barbie is all she has left.
She works very hard each day to keep that cultivated barbie look. She likes it.
Why would it be an insult to let her know that she is succeeding, in the area which she has worked hard, almost every morning for the last 10 years.
http://www.maxphoton.com/wp-content/uploads/2015/01/ice-capades.png
XLNT
You made me roar out loud with that one! Keep them coming!
The “Arctic Ice Keepers” use the Northern Pacific Ocean as part of the Arctic Ice. Now the Northern Pacific Ocean is South of the Bering Strait, Northern Siberia is not included, since it is land. One can only surmise that the “Arctic only includes water”, not a circle around the North Pole. Down South, they include an enormous “circle” around the South Pole.
“How deception is created”, I wish I had a book…
The Sun’s output is reduced. Wait until next year, and the year after, then lets talk!!!
There is no sea-ice on land. I wonder if Watts has the guts to post September’s version along side this one in a few months.
Now the troll is getting insulting, just because nobody else pays attention to it.
The sea ice pages are posted everyday with full history.
So your insults about courage fall low, just like your IQ.
Regardless, the current numbers don’t mean what you desperately (and ignorantly) want to believe they do.
Wow! Don’t understand the importance of springtime combined ice and snow cover, huh? I personally hope for an El Nino to bring me a cool summer and extended fall again. If early snows in the upper mid-latitudes come despite a warm winter in the arctic, I will consider that Joe Bastardi has much of this figured out.
Anthony has regularly posted sea ice pages since before 2008; and a few years ago, added a “Sea ice” page where one can get the most recent images.
Unlike those warmist sites that fail to update charts when the data is inconvenient; sometimes for years.
Here’s a sea ice chart for you:
http://ocean.dmi.dk/arctic/icethickness/images/FullSize_CICE_combine_thick_SM_EN_20180418.png
zazove, you are a clown. if you followed this blog you would already know anthony never shies away from posting anything climate related. so much for the arctic amplification nonsense given what the ice has done post 2012. your links to supposed volume are nonsense. i don’t care how many holes they drill in the ice , anyone claiming they know arctic ice volume to any significant degree is a clown, just like you.
now the amo is past the peak arctic alarmism and its proponents are in for a rocky ride.
Only an idiot doesn’t know he maintains a sea ice page. Troll.
Like most religious zealots, zazove, you get testy when the basis for your superstition is questioned with logic and facts.
Zazy: You are free to return in Sept. (and apologize to our host) and find out on your own time. Even if Mr. Soros puts you on some other task, which he probably will do since your work here is not getting it done.
Wow, zazove, I thought you were serious. Maybe you’re just new and don’t know how to navigate this site.The links are on the right side of the articles/comments. Look for “Sea Ice Page”. You can also type F and enter “Sea Ice Page”. Try it! It’s pretty easy, but if you still have problems, you should be able to find a child who can help. I don’t find them all that bright, myself, but they can handle this problem,
On a slightly different note, here in Columbia, Maryland we are having day after day of fully overcast days. When you look at the AccuWeather forecast it only has ever predicted 2-3 full sunshine days for the whole month. And its been windy and cold.
Why the unusual overcast, is it happening elsewhere?
Baltimore, perhaps, but nowhere else is it cloudy.
Just kidding.
Its called weather.
Not kidding.
Damn sun won’t stop shining here in Western Canada! Even at night! ( But it is about 15C below normal and has been for two months)
Here in Florida we have had even more than our usual amount of nearly constant sunshine.
Since right after the hurricane.
Same as last year…sunny and dry.
It has rained about three times, none of them more than half an inch, since mid-September here in eastern Lee county.
I am hoping for some clouds one day soon.
Ice ball Earth…..
Who the hell cares about anything else, Scotland got a mention at last!
🙂
Goddam, you beat me to it, though I’m usually only there by parentage.
michael hart
Nonetheless, a Scot.
Shouldn’t you be off sharpenin’ yer claymore?
It’s been lookin’ like the haggis Commies are trying to get the best of you.
HotScot,
With a bit of ‘zoom’ on the hi def image, I do believe I can see the Isle of Colonsay!
My ancestors hailed from there…
HotScot, it’s about the only place that isn’t under ice. No wonder you guys can wear skirts!
John harmsworth
Distinct difference between a skirt and the Kilt.
Single piece of multi pleated tartan fabric, secured around the waist to form a double layer at the front Vs a hoop of single layer material.
The pleating gives us room to perform hazardous and intricate dances e.g. the famous sword dance.
The Kilt also has the enviable ability to attract members of the opposite sex who have been known to ask me “what’s worn under the Kilt” to which I always reply “there’s nothing worn under my Kilt, it’s all in perfect working order”.
🙂
John harmsworth
“Centuries ago, Highlanders not only hunted and fought in their plaid, they slept in it! The expression, “the whole 9 yards”, came from the amount of material (approx. 9 yards) used to outfit our hearty ancestors.”
I’m not sure I know of any skirts that use 9 Yards of material.
Once and for all, the Gulf Steam is a heat engine period. The Gulf Stream is driven by warm waters at the Equator and cold waters at the Poles. A heat engine, moving heat from hot to cold.
The fresh water happen 20,000 years ago when the “Mile High Club” melted. Yes, it changed the salinity also, duh.
Today, none, none, none, of that happens. HEAT ENGINE.
A curious thing, heat at the equator stays relatively constant. Heat near the poles varies. Quiet Sun, colder poles…more ice, duh.
They won’t tell you, but the Gulf Stream is 1/4 of what it was in 1900. Warming, due to the Sun, has raised the Arctic and Antarctic Ocean temperatures, BUT, not the temperatures at the equator. Less temperature differential, less flow.
Now the Sun is Quiet. How long? I hope it doesn’t get too cold, or joining the “Mile High Club” could have a totally different meaning….
jlurtz
That’s it, I’m moving south when I retire in 5 years!
jlurtz, I am sorry where is the data from 1900 Gulf Stream?
Edward: The Gulf Stream has been tracked (and discussed and re-discussed in ever greater detail) ever since Ben Franklin’s began analyzing it to recommend faster colonial ship tracking and planning to and from England.
No its a gravity engine driven by the earths rotation.
The gulf stream is driven by the trade winds.
It’s a public service from Al Gore.
Nope, it is augmented a little bit in places. The earths rotation does the heavy lifting
There is a strong current that runs from the southwest tip of Africa right up into the gulf of Mexico, and other water pushing into there from the east.
The rotation of the earth and the prevailing winds and all the water pushing it all along ensure a continued flow.
There is no where else for it to go.
And imagine the moment of inertia of all of that water.
It will stop when the Earth stops spinning and the wind stops blowing.
The idea that some fresh water will stop all of that water from moving is positively inane.
http://www.indiana.edu/%7Egeol105/images/gaia_chapter_4/oceancirculation.jpg
Before the formation of the Isthmus of Panama, that current from Africa could flow into the Pacific rather than being turned NE to run along the Atlantic coast of North America, thence across the ocean to Europe, carrying moisture with which to make ice sheets.
Yes, the closing of the Isthmus at Panama is perhaps the most cited reason for the onset of ice age conditions.
However this is not 100% accepted by everyone.
Although the timing seems correct, I have not personally seen a detailed explanation for how such a seemingly small change caused the entire planet to cool off, the deep ocean abysses to switch from warm to frigid, and permanent ice to form at both poles where before life had prospered.
I am not saying I disagree or have an alternative explanation of any refutation of this assertion.
Just that it is not exactly obvious how this closing led to such a drastic alteration of the planet.
But I think we can likely agree with some degree of certitude that, before it was the way it is now, it was different.
Typo:
…or any refutation…
Me,
There are lots of papers detailing how that should be.
But please bear in mind that Earth had already been in an Ice House phase since the formation of the Southern Ocean about 34 million years ago. The formation of the Isthmus just added ice sheets in the NH to those on Antarctica. The increase in albedo and other changes caused the whole globe further to cool as a result.
There have been attempts recently to challenge this standard explanation for the Pleistocene glaciations, but IMO none have been convincing. Here’s the standard hypothesis:
http://www.whoi.edu/oceanus/feature/how-the-isthmus-of-panama-put-ice-in-the-arctic
Chimp,
Thank you for this.
I will read it tonight.
Most welcome.
Old, but not totally outdated.
There has actually been a lot of scientific investigation and, dare I mention, computer modeling, around this question.
Some of the controversy centers on when precisely the oceanic circulation through the strait that used to exist between the two Americas would have been affected by the shoaling from tectonic forces.
The timing of the land connection is much less controversial, thanks to evidence from the inter-American exchange of terrestrial species.
Hmmm…I am not sure about this paper.
It is very long on suppositions and assertions, and short on evidence and consistency.
There seems to be some of what I would consider problematic assertions.
And I am not finding the entirety of it to be particularly factually and logically consistent.
Again, I am not disagreeing, but I think we both find that there are too many climate researchers who are committed to hammering a square theory into a round hole of facts, and I think that paleoclimatology suffers from the same lack of rigor and high standards of evidence and logic.
I am pretty tired, it is the middle of the night here.
I will try to get back tomorrow and explain a little better what my specific issues are.
Thanks again.
That is just what Arctic ice looks like when it’s getting ready to scream.
The colder they are, the louder they scream…once you get ’em warmed up.
The impressive Arctic image shows the main culprit with ice free regions only above the Norway side. Where the AMOC and warmer circulated ocean surface waters warm it up significantly compared with the rest of the Arctic region. Temperatures there well below freezing blown over that ice free region make no difference to the sea because it is warmed so much from below.
When the AMO becomes consistently negative and therefore the AMOC slows down more. This region will soon restore sea ice back again and change the cycle of generally continued declining Arctic sea ice to generally increasing Arctic sea ice.
Typo in first sentence Anthony.
Another one in the second paragraph as well.
“cab’t”
Give voice to text software a try. It is fun and entertaining.
It is all cleaned up now.
…looks damn cold!
A wee iinconvenient truth.
All that ice north of us acts like a big slip and slid that allows for that cold Hudson Bay air to race down to Chicagoland. So far this April, we have averaged 36.9F, which puts us second coldest as 1881 was the coldest but we beat 1884. We have been colder than Anchorage Alaska this month. That MJO in phase 3 just opened the barn doors and made me shovel the driveway this morming. What’s up with that? Just image how much colder we could have been if it wasn’t for Global Warming, or Climate Change or whatever they call it now. Stay warm my friends!
1000 miles West of you and a little North with very much the same story. Much below normal here for the past two months. Yet the anomaly maps show we are warmer than normal! Nowhere near correct.
Two words my friends, PEAK ICE!
IMO, the multidecadal build started in 2012 and should run until c. 2042+/-.
Peak ice should occur around then, then decline for ~30 years, then gain again to round out the century in a too icy world, as at the turn of the 19th to 20th centuries, 18th to 19th and 17th to 18th (Maunder Minimum).
Nice image.
Thanks.
I am unfamiliar with WordPress markup rules. Are IMG tags allowed directly?
no
Bummer, I can host a scaled down image in .jpg format if you wish. Since the perl script returns a byte stream, I’ll have to do a little programming, but I don’t mind. Might take another day or so before I can get to it if you are interested.
By the way, the image is not present in the url. The url is actually a web service (SOAP/ReST) in which everything after the ? are name/value pairs, ie. prodid=MODISCOM-T is telling the web service (PERL Script) to return a product id of MODISCOM-T. If you are interested, the following url describes the web service’s parameters: http://ice-glaces.ec.gc.ca/cgi-bin/getprod.pl
There are other solutions that I can provide (at no cost). Are you running on a Windows, Linux or Apple box?
Looking at the help page for the image service that Troy linked…
This URL gives you a listing of available images for that particular service product:
http://ice-glaces.ec.gc.ca/cgi-bin/getprod.pl?prodid=MODISCOM-T&format=jpg&q=all
Clicking on one image, you may notice that URL is the actual image file. This is the one you posted in the article:
http://ice-glaces.ec.gc.ca/prods/MODISCOM-T/20180416000000_MODISCOM-T_0009985850.jpg
I can check if the server has Indexes off by removing the image from URL.
http://ice-glaces.ec.gc.ca/prods/MODISCOM-T/
And, it looks like the server allows listing of all the files in directory.
With a little bit of coding, it is possible to retrieve the latest image and transfer it to your WordPress blog… however, it may be a good idea to check if the data owner is OK with that first.
If all you want to do is retrieve the latest image manually, you can use this link:
http://ice-glaces.ec.gc.ca/cgi-bin/getprod.pl?prodid=MODISCOM-T&format=jpg&wrap=0
**** I remember some problem relating to updating http linked images vs. https linked images. It doesn’t look like the given subdomain has a https link available.
This one line BASH script will return the actual URL to the latest image:
curl -s -d "prodid=MODISCOM-T&format=jpg&q=all" http://ice-glaces.ec.gc.ca/cgi-bin/getprod.pl |grep -m 1 href | awk -v baseurl="http://ice-glaces.ec.gc.ca" -F '"' '{print baseurl $2}'
If you have a GNU/Linux box with curl, grep, and awk installed … you can simply copy the one-liner and hit enter to obtain the URL.
This next line will return all the image links:
curl -s -d "prodid=MODISCOM-T&format=jpg&q=all" http://ice-glaces.ec.gc.ca/cgi-bin/getprod.pl |grep href | awk -v baseurl="http://ice-glaces.ec.gc.ca" -F '"' '{print baseurl $2}'
It’s the same except leaving off the “-m 1” option in grep.
As a .png, it is over 13MB, and it doesn’t look like the resolution comes out any better than the .jpg.
Rob,
IMO it’s pretty easy to make out the coastlines.
For me, parts of it are as easy as the continental coastlines, but other parts less so. However, IMO pretty much all the coastlines are discernible, especially in high res,
Please go to the Canadian link and maximize.
To me, the GIS is discernible as the whitest portion. The intermittent ice caps and fields on the coastal areas show up in different shades of white, the snowy uniced over land in yet another and sea ice still another shade.
Rob Bradley April 19, 2018 at 5:52 pm
They are close enough for government work, although granted, NIST is also a government entity.
“.IMO it’s pretty easy to make out the coastlines”
In some areas (e. g. Greenland) yes, but in northern Siberia the “coastline” is actually the edge of the fast ice. For example Severnaya Zemlya looks like part of the “mainland”.
Rob Bradley,
Not sure what you’re talking about, but I see a pretty good representation of mountains and valleys.
tty April 20, 2018 at 2:38 am
If you go to the full image link and zoom in, the Siberian coast is distinguishable from the shorefast ice around the Arctic Islands.
I also can clearly discern the coastlines. But if you cannot, here is what you do: Go get your globe, and set it next to the screen you are looking at.
Anyplace that shows as land on the globe is snow and land ice coverage, and all the places that show as water on the globe are sea ice on the corresponding map/picture screenshot.
Places that are not white are not snow or ice.
You will get the hang of it Robby…just keep coming back and we shall walk you through it at your own pace.
It just takes some people longer…do not feel bad or inadequate.
Menicholas – if the planet is warming slowly and the global circulations are gaining energy slightly (not easy to quantify) – polar air will be brought down more quickly (to the southeast) by the winter sequence of more intense cold core lows? Warmer oceans = higher snow amounts. Stronger trajectories vs modification = an increase in cold records being broken. This is speculative.
I there any way to tell how much of the white is ice and how much clouds?
One would expect that if any portion of the image were clouds with no snow or ice underneath, it would show somewhere on the Southern edge of the image. It does not. So I assume it is all ice and snow.
I think none of it is clouds…that is one reason for stitching together a composite.
And the extent and persistence of clouds in these regions in Winter is one reason why overhead satellite photos cannot be used to directly visualize daily ice extent.
It is just really cloudy up there in Winter.
Definitely a late winter in the NH with that being a true snapshot of mid April with a very high Albedo, especially with the SH rapidly slipping into fall/winter. Since weather generally goes in a trend, I am sure hoping this isn’t the start of the dreaded cooling trend. It will knock the socks off of CAGW, but everyone will suffer in a cooling world for the next 30 years.
Socks-knocking-off would be the silver lining to the cloud of cooling.
IMO, but for the super El Nino of 2015-16, the cooling would already be evident, as shown by Arctic sea ice surge since 2012 and a host of other data.
Perl is disgusting. It’s good for writing obfuscated code. That’s a bad thing.
Programs almost never exist for long without requiring ‘maintenance’. Code that is hard to understand is unmaintainable (even by the person who wrote it). Edsger W. Dijkstra makes the point eloquently in his essay “Go To Statement Considered Harmful”. Code must be readable by humans.
Perl is easily the most disliked language. link
Government of Canada computer services are really bad. link, link The existence of a Perl script is a symptom. Yech!
Given the choice of a 50 line Perl script and a 5000 line ‘C’ program, neither of which I’d seen before and told to make a quick change in it. I’d pick the ‘C’ program every day.
This is heavily off-topic, but given the very different nature of languages, I think, comparing them is not that practical. I’d say well-written 5000 lines of Perl are more capable of doing things than 5000 lines of C, so it might be the 5000 lines of C are equal to 2500 lines of Perl. I think the wood for trees daemon makes a good case of this.
Professionally, I have started to enjoy C++. But it depends on what one does. The last thing I want to do is to maintain code that’s been put together in haste, unprofessionally. Climate models anyone? Well, not necessarily all of them are as bad. I’ve heard only rumours from more than a decade ago. OTOH, code has a long lifetime.
The density of Perl comes from the heavy use of libraries. I can shrink a ‘C’ program by offloading portions of it to a library as well.
Why is that!?
Are you measuring sea ice grids?
Very doubtful.
It is an excellent map of the North polar area.
Especially since that massive white area absorbs very little sunlight.
Making any cries of “cherry picking” sheer laziness and prejudice.
Rob,
As noted, I can indeed discern the differences among snow on land, isolated ice on land, the Greenland Ice Sheet and sea ice. You could too if you took the time to look.
Rob really does work hard to explain away anything that doesn’t support his religion.
Even if he has to make it up on the spot.
Utter ignorance, falsehoods and specious strawmen are your only methods.
Map, definition according to Merriam-Webster
As expected, rbby’s (rb bradley), twisted belief and incorrect knowledge of words and their meanings is wrong.
Then there is rbby’s “cherry picking claim, where rbby wants next summer’s polar map instead of April 18th’s polar map.
It’s rbby who demands his preferred cherry pick.
Loser.
Snow and ice reflect sunlight. Greater area of snow/ice cover causes a much greater loss of incoming solar energy.
Contrary to warmist religious beliefs, CO₂ is unable to manufacture heat by itself. Leaving the polar regions without even the miniscule amount of warming 0.04% CO₂ could manage.
Thicker ice over a larger area, cold Arctic temperatures, near total loss of incoming Arctic solar energy; makes it out to be a very long dismal summer for warmists wishing Arctic ice will vanish.
Frankly, we’d all appreciate a little warming and Arctic wildlife, just as all of Earth’s wildlife, will prosper.
Only, CO₂ just isn’t the warming engine warmists claim.
Just as activists incorrectly predicted an early spring this year, it appears warmists will maintain their 0.0% successful predictive skills throughout 2018.
rbby take the customary adolescent alarmist position of “double down” and refuse to admit error. rbby’s attempt in this matter is all bluster, bluff and vacuous ignorance.
rbby does this by refusing an official dictionary’s word definitions and the customary colloquial meanings for “map”.
rbby, uses the logical fallacy of Argumentum ad Ignorantiam (appeal to ignorance) by inventing it’s own meanings for words.
Then rbby applies another of it’s false strawman by claiming a picture is distinct from a “map”.
Hahahahaha!
The idiocy of that attempt is quite funny!
Then, in spite of all the images already provided on this page, rbby pretends it is somehow crippled, which we do not doubt, and unable to find any of the copious Arctic images available. rbby commands that I provide rbby with said image.
Ergo, another of rbby’s false strawmen; and again extremely funny for sheer idiocy.
While, I can not substantiate rbby’s claim that it provided a picture of Stormy; I am unsurprised that rbby keeps a picture of a prostitute porn star blackmailer extortionist nearby.
I am sure rbby is quite capable of recognizing Stormy; which rbby itself accomplishes by easily recognizing the map a picture provides to unique features, color, textures and patterns.
Meaning rbby is waving around a map to Stormy, but is too ignorant to recognize that fact.
So far in this thread, rbby; you have been egregiously wrong on every claim.
Crawl back under your swamp pad and take your map of Stormy with you.
Provide your own d^mn image of Arctic ice, since you are ungrateful for the ones we’ve shown here.
As to the difference between a map and a picture, it’s obvious that once again Rob’s only desire is to distract and obfuscate.
It’s not like he’s ever given any useful information.
rbby,
see again: “a diagram or other visual representation that shows the relative position of the parts of something”
depending on the use, almost anything can reasonably be used to as a map. If measuring symmetry, the photo could be characterized as a map. but, I’m guessing that you don’t have that photo handy for symmetry studies ….
Not a bit.
Unlike rbby, who refuses to read and understand common dictionaries; I provided a link above for rbby to read the definition for a map.
Horse to water and all that. That horse is desiccating.
Note how rbby fakes amusement, after I was highly amused by rbby’s childish attempts to insult and distract.
rbby’s pathetic adolescent response shames first graders; double down, bluster, bluff, fakery and lie every chance it gets.
Obviously, that swamp pad was too nice for you. Your neighbors, the nematoda, annelida, arthropoda cancelled your lease; for damaging their property values.
Seriously Robby my boy, you need to step up your trolling if you want to tussle with the grown up laddies.
This aint yer (un)Skeptical Science sand box, so quit treating it as one.
Around here, people are expected to do their own homework, know the definition of words, understand shades of meaning, know the difference between someone saying something and putting words in their mouth ans calling them their own, and in general just know what the hell you are talking about and be up to date with recent discussions, general knowledge, etc.
You might also want to drop this notion that posting am image of current or recent conditions is somehow cherry picking, not to mention the notion that the phrase is some scary bogey man that will make serious people run away in a tizzy.
If a satellite composite of current conditions seems like cherry picking to you, you got a lotta schoolin’ to do yet.
Visit http://ice-glaces.ec.gc.ca/cgi-bin/getprod.pl for instructions and parameters e.g. appending &q=0 gives latest image
Wow, how they gonna do this years Hair Rock Cruise to the pole? Oops! Sorry, that is not the pole they intend to cruise to. Never mind.
That is an awful lot of ice, snowed here in western PA today, again, still.
Oh, and thanks for that image link, its going into the science and climate folder!
Rob, so how exactly is the image worthless? Anthony didn’t say it proved or refuted anything. Though I imagine it cause you heart burn and to twitch a bit. You probably would have only been happy if there was an image showing an April day with an ice free Arctic Ocean.
Rob,
What would be even more telling would be the same image from the same date in prior years.
But you wouldn’t like that comparison.
Please take the trouble actually to look closely at the image. The different shades of white are quite discernible. If you don’t see that, it must be because you don’t want to do so.
Rob,
Because this has been a snowier than 30-year average year, as should be obvious.
Not just North America suffered record-breaking snow and cold this winter and spring. So did much of Asia and Europe.
Dunno where this year will finish overall, but it’s right up there with the North American record snow years of 1969, 1978, 2010 and 2014. Well do I recall the winters of 1968-69 and 1977-78, when the PDO flipped.
Rob Bradley April 19, 2018 at 6:29 pm
But the data do. And the April snowstorms this year set records in the US and Japan. Dunno about rest of Asia and Europe, so yes, this picture is off the charts unusual.
Rob,
I don’t know where you live, but no American or Canadian would doubt that this winter and spring have been snowier than the 30 year average. By a lot.
It has been in all the papers and on TV and radio, in case you’re lucky enough to live in one of the few states not affected by the record snow and cold. No province has gone unaffected.
You just make yourself look totally out of it for questioning that that image is unusual, without further comment. At least to anyone who has been paying attention for the past 30 to 70 years.
Rob, if the image showed the arctic to be free of ice, would you be so quick to declare that it has no “scientific” value?
Or for that matter, the past one to 29 years.
Nor I might add, would citizens of Japan and Britain and points in between doubt for a second that recent winters have been exceptionally cold and snowy, compared to what they were used to based upon the 30 years after chilly 1978.
Not to mention South America and Africa!
Rob,
My reply with links to the records broken in Asia, Europe and North America this winter is apparently lost in cyberspace, perhaps due to too many links.
But were you the least bit interested in truth, you could easily find all the data showing record-breaking snow and cold this winter clear across the NH, and in the SH during the austral winter, and now, an unusually cold and wet autumn.
Maybe WordPress will allow me one from the middle of North America, out of all those from the three northern continents I posted before:
http://minnesota.cbslocal.com/2018/04/04/record-snowfall-april-minnesota/
OK, then why don’t you do that? google is your friend, if you know how to type, spell and read, so use it and prove everyone wrong.
rbby,
so, I can imagine a stand alone summer image (with absolutely no ice anywhere).
If such a real world image were produced, but I can’t imagine that you would say it is a worthless image.
(it is easier to imagine an ice free world than it is to imagine a true hypocrite can be reformed)
“It is worthless because it has no scientific value.”
I will take this as proof that Robby is likely not past the wiping-nose-on-sleeve stage of his childhood.
I can assure you Robby, that a bunch of scientists somewhere who built and launched satellites, compile and analyze photos of the Earth, post them on websites for informational purposes, and get paid lots of money to do so, as well as all the people who apportion these tax dollars, and the ones who pay the taxes, will be very glum to hear your pronouncements that the end product of all of this time and money are of no value.
Personally, I just want to thank you for this first hand reminder of the extent and scope of warmista jackassery.
Robby,
You said “Show me data, your opinionated hand waving doesn’t cut it.”
Once again demanding someone else go do your homework for you.
Statements of an obvious and factual nature cannot be rebutted by demanding some proof, and requesting that someone else go fetch some info you can as easily get your own self as ask for from someone else just demonstrates once again that your purpose is not to inform or further any part of the conversation, but to obfuscate and distract…IOW, to troll.
I can promise you, not one person here gives one tiny rat’s tuchus what does and what does not “cut it’ for you.”
If you can refute, then do so.
Your lazy, lackwitted demands, and nonsensical attempts at criticism, are all quite tiresome.
Persisting in them and repeating yourself over and over is not cute or clever, it is churlish, childish and boring.
jeez, there seems to be an increase in bampots visiting wuwt recently. what rob bradley is hoping to achieve by criticizing an image for the date it was taken i have no idea. i too would like to see the summer image,but i am not stupid enough to think that anyone is trying to cherry pick anything by posting the current image that is available.
if rob thinks it has no scientific value perhaps he should contact the people that made it and tell them they are wasting their time ? i can think of a myriad of images used in climate science that have no scientific value, a polar bear sitting astride a small lump of ice springs to mind. there are many more (mikees hockeyschtick anyone), this image isn’t one of them.
Rob specializes in two things.
Obfuscation and distraction. Review past articles, it’s all he’s ever done. He picks some nit-picky little thing and continues to whine about it until everyone gives up on him. Then he declares victory and finally goes home.
MarkW,
I’d say that that sounds like a stealth Nick Stokes, except I think Nick is actually pretty smart (just beholden to the CAGW meme).
It looks like Bradley’s understanding of science is reflected in the picture he posted at 7:22 pm.
Well, that picture has made Rob Bradley go blind already.
Obviously, it also highlights his failure to stay abreast of the topic at hand, imo. As he is continually buffeted by the twin peaks of fantasy and delusion.
Maybe he thinks she would look better covered in ice. sad.
Their image from last summer near the minimum extent:
http://ice-glaces.ec.gc.ca/prods/MODISCOM-T/20170911000000_MODISCOM-T_0009631928.jpg
Greenland sure is well named. sarc
Unknown: Thanks for filling Mr. Bradley’s request. He’ll be along soon to tell you this is worthless because it looks nothing like Stormy Daniels last April.
Download TinyTake free photo software that will allow you to take a picture of a picture and save it as a png. Real simple/ It will look just like what you posted https://tinytake.com
On Linux use
wget -r http://ice-glaces.ec.gc.ca/cgi-bin/getprod.pl
In the file :-
Latest ice conditions –
https://www.canada.ca/en/environment-climate-change/services/ice-forecasts-observations/latest-conditions.html
Image Archive –
https://www.canada.ca/en/environment-climate-change/services/ice-forecasts-observations/latest-conditions/archive-overview/interesting-image.html
PS: have a look at the robots.txt file that is also downloaded.
the products are in http://ice-glaces.ec.gc.ca/prods/
http://ice-glaces.ec.gc.ca/prods/MODISCOM-T/20170911000000_MODISCOM-T_0009631928.jpg
RE: robots.txt
curl http://ice-glaces.ec.gc.ca/robots.txt

User-agent: *

Disallow: /cgi-bin/

Disallow: /IceGraph/

Disallow: /IceGraph103/

Disallow: /CISCalendar/

Disallow: /prods/

Disallow: /web_apps/wwwroot/prods/
I flew from Baltimore to Denver (over Chicago) and then up to Calgary today. Almost the entire route was covered in snow. It is almost unbelievable that this late in the year there is still that much snow.
Awww.
I think the pic is cute, and against the message. Note the small dark spot north of Spitzbergen. That’s climate change.
Environment Canada keeps a daily plot, updated almost daily. Snow Cover Extent. The one for NH was last updated on April 14. For early and late in the season, it has been on the high-side of the standard deviation band.
The NA chart has not been updated since the 10th, when the plot was unusually above the high-side of the band. Early winter polts were also on the high-side. As was the plot during August and into September, the seasonal low. That means above average alpine and far-north coverage.
Sorry, I don’t know how to put in the link and can’t remember how I found the site. I have it bookmarked.
Bob Hoye
There’s Ice at the North Pole!…. I thought it was all supposed to be gone by now. Well there you go. Wonders never cease.
Just write an aws lambda function that scrapes it once a day, shrinks it and sticks it in an S3 bucket. It should be 30 lines of python.
Embed this
If you just want to include the current image, putting it inside an iframe is the simplest option.
http://ice-glaces.ec.gc.ca/cgi-bin/getprod.pl?prodid=MODISCOM-T&wrap=0&lang=en
A more sophisticated approach would be to use PHP’s CURL function to get the data, and then GDImage to resize it.
This image now available as an hourly updated jpeg at
http://gridwatch.templar.co.uk/downloads/MODIS.jpg
I used C CURL lib to get the image, and placed it on the server n an accessible location.
This server is 100% 24×7 .
I hope that helps, Anthony.
Oh drat it. WordPress has eaten the URL
http: // gridwatch.templar.co.uk / downloads / MODIS.jpg
remove spaces
I’d have thought that image is misleading unless you know the altitude or define the horizon. After all a camera in your hand pointed at your feet will show all white to the horizon.. That proves nothing about the extent of Arctic Ice. Adding geography as Anthony did helps, but it is such an unusual view that it needs a bit more thought than just ‘golly there’s a lot of white stuff there’.
The image is centered on the North Pole and the edge is at 55 degrees of latitude, i. e. about 2400 miles from the pole or 39% of the distance to the Equator.
I suggest it is very obvious form the image directly – Greenland, Northern Norway to Murmansk, Alaska, Aleutian chain and Sakhailin are all very, very obvious. Draw your own latitude. Roughly 70 degrees plus or minus. A basic knowledge of global geography is required to study and hence be able to comment meaningfully on global climate, I suggest.
You mean Kamchatka. Sakhalin is outside the image.
Muddled my peninsulas. Point is the same, latitude is plain to see by goegraphic imputation. Not misleadig at all. As long as you have the basic formation required to discuss the image meaningfully.
I agree, there are ample visual clues to the exact extent of the image.
Misleading to post a photo that shows what it shows?
I say it is misleading to suggest there is anything misleading about it.
The .pl extension is a red herring; the file is a PNG and can be saved with that extension.
No. it is a jpeg
RACookPE, 1978. Sorry but I once knew several of the top oceanographers and remote sensing experts studying the Gulf Stream System. While you are correct the Gulf Stream System has been studied since Ben Franklin, actually before that if you know about the Basque Cod fishermen, we knew damn little about the system until the 20th Century. Until then we generally were looking just at the surface, at the most the top hundred meters. For example, warm Core and Cold Core eddies were considered extremely rare events. Then, as my remote sensing friend told me, “when I was in grad school no one studied the Gulf Stream anymore because we were convinced we knew everything we needed to know about the system; then we put a satellite up, looked back and realized almost everything we knew was wrong.” For example, eddy formation is common, though when formation starts was not appreciate until the late 20th Century. One of the oceanographers I knew was working on mass flow of the Gulf Stream/ Florida Current. He had a large grant. He a hydrographic array stretching across the Straits from Florida to the Bahamas at about 26 degrees north. One of the issues he was concerning with was how much mass flow changed as at that time the tropical oceans heated up. The hypothesis was that either tropical storms carried the energy north or the Gulf Stream. At the time we were in a relatively slow period for tropical cyclones. While the Stream moved east and west, sometimes fairly dramatically (my professional interest at the time), mass flow was relatively constant. I can go on for a couple of hours but that is enough, I haven’t even started discussing the Loop Current in the Gulf of Mexico. Like most components of our climate system, including Western Boundary Currents in the northern hemisphere while some, even so called climate experts believe we somehow know everything, we have at best an incomplete understanding of the individual components and at worse a very poor understand of some very critical components.
From such a deficit as this is settled science crafted! Remarkable achievement! What could be accomplished if absolutely nothing was known?
Thank you, Edwin! I think you illuminated the state of climate science quite a bit. All the so-called scientists who could be studying actual climate factors are programming computers to prove what they already think they know.
Rob Bradley
What I see is a vast area where nothing is growing and people need to buy and wear warm clothing and find money and materials to heat their homes. the AGW apparently believes that we should have more of this white area for more of the year and at even lower temperatures.
I don’t call that a useless image. I say it’s a wake up call!
Hey Rob Bradley: Does the picture distinguish between sea ice and open water? If so, then it’s not worthless, because it debunks the meme of alarmists that sea ice is “crashing”. To be worthless + distracting, one could post a picture of a porn actress at the (excuse the expression) “tail end” of her career, seeking new sources of revenue. But nobody would go that low, would you?
Perhaps the 2nd most striking element outside of the vast coverage is the obvious impact that the ocean currents play on the ice extent. It always amazes me how people forget the awesome power of nature and so they think CO2 controls sea ice, but the image shows it is the ocean currents that does that.
Europeans should know this well because despite their warm climate, Europe is actually positioned to the north but is warmed by ocean currents. The city of Quebec in Canada is south of Paris France, but Quebec is far colder. That is ocean energy not your cars that makes Paris warm and Quebec cold.
I think Europeans who were listening in class knew that. But thanks for the lesson, for those under 11. It’s also why solar PV is utterly pointless in Northern Europe, at 50 degrees North there isn’t enough sun of adeqaute intensity during the average 12 hours of daylight, especially when it’s needed for long winter nights WE don’t have aircon in homes, because its not hot enough long enough. Offices are a different problem. The subsidies for those who get them at everyone else’s expense are the only significant benefit, for a rich few and less affluent but still wealthy property owning minorities outside cities. And we are all doomed, like Canada and Russia, when the next real climate change occurs, and the ice returns to claim the Northern hemisphere, as it has every 100K year Milankovitch eccentricity maximum for the last 900K years. THAT is climate change, not interglacial noise.
Another interesting thing is how well the northern forest limit shows up. Pure white = tundra. Light grey = forest.
Do you know what the vivid and bright blue areas east of Greenland are?
great image. thanks!
Why cant I find this at the Canadian Ice Service web site?