A tide gauge record must always start about the time of low ENSO waters and possibly include a datum shift
Guest essay by Albert Parker
In addition to the case of Aden, discussed in Parker & Ollier (2017) and Parker & O’Sullivan (2018), that is only one of the many where the data proposed by the PSMSL are not trustworthy, another example recently added to the long list is Guam (Parker & Ollier, 2018).
Guam, Apra Harbor
For the tide gauge of Guam, Apra Harbor, www.psmsl.org/data/obtaining/stations/540.php, recently analysed in Parker & Ollier (2018), the PSMSL only mentions one of two data shifts following recent earthquakes, the one less evident of the two likely in the data. This datum shift is then used by NOAA to compute the rate of rise of the sea levels starting from low ENSO waters. The computation also suffers of the undetected datum shift, further magnifying the apparent sea level rate of rise.
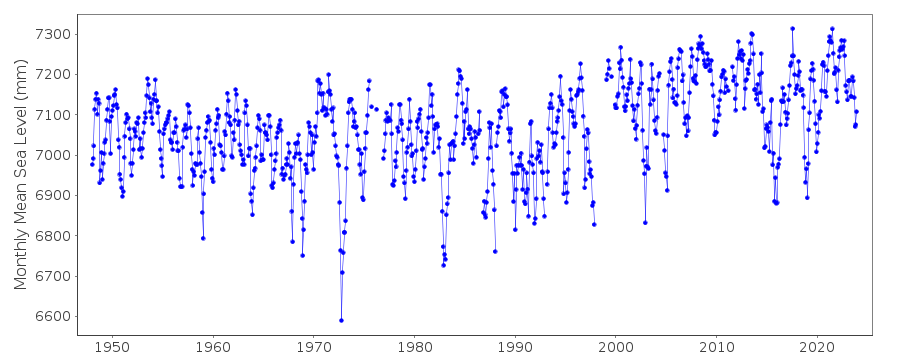
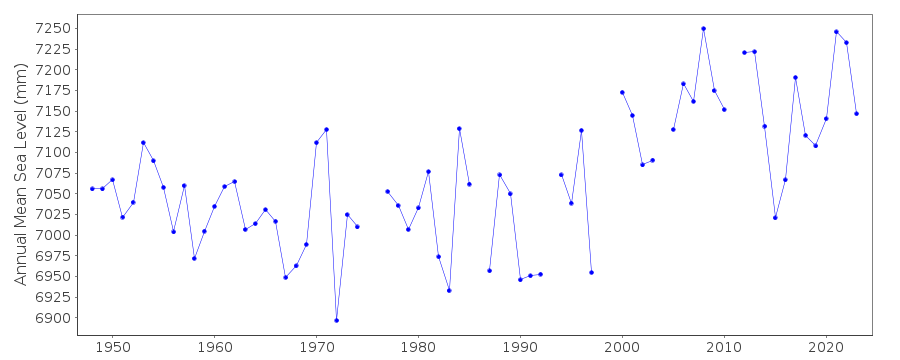
Here below, Figure 1, the monthly and annual mean sea levels from PSMSL.

www.psmsl.org/data/obtaining/rlr.monthly.plots/540_high.png

www.psmsl.org/data/obtaining/rlr.annual.plots/540_high.png
Figure 1 – Monthly and Annual mean sea levels from PSMSL.
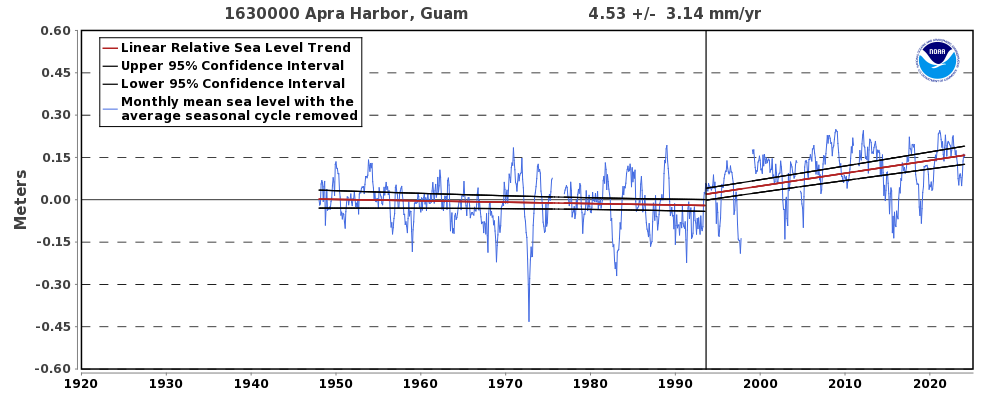
According to NOAA at, http://tidesandcurrents.noaa.gov/sltrends/sltrends_station.shtml?id=1630000
“The relative sea level trend is 5.04 millimeters/year with a 95% confidence interval of +/- 4.15 mm/yr based on monthly mean sea level data from 1993 to 2017 which is equivalent to a change of 1.65 feet in 100 years.”.
Figure 2. The monthly average mean sea levels have the seasonal cycle removed.

Figure 2 source – Sea level trend analysis from NOAA. tidesandcurrents.noaa.gov/sltrends/plots/1630000_meantrend.png
The sea levels of Guam have been recently analysed by Parker & Ollier (2018), Figure 3 the monthly average mean sea levels.
 a
a
 b
b
Figure 3 – Monthly average mean sea levels (MSL) in Apra Harbor. (a) linear fittings. (b) 12 months moving averages. Data are from www.psmsl.org, the image is from Parker & Ollier (2018).
As shown in Figure 1, 2 and 3, we may note:
- There is a gap of 2 months in January and February 1993, before the August 1993 earthquake, but no gap after the earthquake. There was no disruption of measurements following the August 1993 earthquake. The pattern before and after the earthquake seems marginally different.
- There is a long gap of 14 months from December 1997 to February 1999. It follows the April 1997 earthquake, but it started 6 months later. It is trailed by two other gaps of 2 and 3 months, June to July 1999, and then September to November 1999. Basically, from December 1997 to December 1999, there have been difficult measurements or no measurements at all. While the pattern does not seem different before and immediately after the earthquake, it seems very different from the time the measurements restarted after the 14 months disruption.
- The relative sea levels have been continuously reducing from January 1948 to August 1993 at a rate of -1.08 mm/year.
- In August 1993 there is a likely datum shift of 20-30 mm following the 7.8 Mw Mag., IX MMI earthquake.
- In February 1999, when the measurements restart after an interruption of 14 months following the April 1997 6.5 Mw Mag. VII MMI earthquake, there is the impression of an even larger second, additional datum shift of not less than 30-40 mm.
Now, PSMSL reports on October 16, 2002
“Guam – suspected land movement of 2-3cm in 1993 following earthquake.” Then, PSMSL reports on July 18, 2011 that the stability of the tide gauge is a concern. “The operators of the Guam tide gauge Centre for Operational Oceanographic Products and Services (CO-OPS) part of NOAA note that a change in the sea level trend occurs after the 1993 Guam earthquake. The stability of the tide gauge datum for the post earthquake is therefore a concern.CO-OPS continue to monitor the site.”
Surprisingly, there is no note in PSMSL explaining the reason why the measurements were discontinued for 14 months, and why they have been erratic in the following 6 months, following the April 1997 earthquake.
Similarly, surprisingly there is no mention in PSMSL of a possible second datum shift that seems very likely from the data, certainly more likely than the first.
Since January 1999, the sea levels have been continuously falling at a rate of -1.15 mm/year.
By accounting for the two datum shifts of 30 mm since September 1993 and another 30 mm since February 1999, and clearing the MSL time series of the subsidence rates of the inland domes of GUAM and GUUG, the absolute MSL is completely detrended only showing oscillations since January 1948 (Parker & Ollier, 2018).
The sea levels have been reducing in all the 3 periods of nearly continuous measurements separated by the two very likely datum-shifts (break-points).
Every alignment technique adopting break-points to analyse time series will evidence the magnitude of the two datum shifts as soon as their existence is admitted.
A datum shift is likely to have occurred in August 1993, the same time as the earthquake, and then before measurement restarted in February 1999, after the 14-months gap that followed the April 1997 earthquake. The two unaccounted datum shifts are 20-30 mm, and not less than 30-40 mm.
By neglecting the data collected prior of 1993 because of the “suspected land movement of 2-3 cm in 1993 following earthquake” as then done by NOAA, and neglecting the datum shift of February 1999, the analysis of the short record starting from low ENSO water levels of Figure 2 then provides a large, apparent, rate of rise exceeding the 5 mm/yr..
This rate of rise is then used as a proof of accelerating sea levels in the EPA pamphlet https://19january2017snapshot.epa.gov/sites/production/files/2016-09/documents/climate-change-gu.pdf where it is written:
“Sea level has risen by about four inches relative to Guam’s shoreline since 1993. If the oceans and atmosphere continue to warm, sea level around Guam is likely to rise one to three feet in the next century. Sea level rise submerges low-lying areas, erodes beaches, and exacerbates coastal flooding from typhoons and tsunamis. Coastal homes and infrastructure will flood more often as sea level rises because storm surges will become higher as well. Homes, businesses, roads, and the Port of Guam are vulnerable to the impacts of storms and sea level rise.”
It does not seem appropriate to notice an everything but clear datum shift in 1993, while neglecting the more evident datum shift in 1998, to support NOAA position of computing the rate of rise of the sea levels in Guam by only considering the data since 1993, about low ENSO water levels, also including in the trend a very likely offset further increasing the rate of rise. The The EPA claim of four inches sea level rise since 1993 does not seem that “solid” science.
References
[1] Parker, A. & Ollier, C.D. (2017). Is the Sea Level Stable at Aden, Yemen?, Earth Systems and Environment, 1(2), p.18.
[2] Parker, A. & O’Sullivan, J., (2018), The Need of an Open, Fair Peer Review of Sea Levels Data, accepted paper, in press.
[3] Parker, A. & Ollier, C., (2018), The sea level of Guam, accepted paper, in press. Also www.preprints.org/manuscript/201803.0196/v1
Yes, it’s a bit of a worry if the PSMSL data is being “adjusted” too. Funny how all the adjustments seem to only go one way.
The models have already told us what the correct answer is. We must adjust the data until it matches what the models say.
I am so sick of sea level measurements. You can prove anything by simply taking your choice of measuring sticks AGW measuring stick or skeptic measuring stick. Then you can decide which locations AGW friendly locations( those where tectonic plates shifted downwards) and skeptic friendly locations(those where the plates shifted upwards). Then you can massage the data in AGW friendly data labs like NASA and NOAA or massage it in skeptic friendly labs. Global warming will not be overturned or upheld on sea levels unless Greenland or Antarctica melt. There are 100 other points to which AGW alarmists have no answers to. The house of cards will tumble soon.
The difference is that climate skeptics are not paid the big bucks to massage the data. And they do not have the media on their side.
Also, they are rather honest and wouldn’t even think of fiddling the data.
Climate skeptics tend to be real scientists who despise witch doctors and their trickery.
I guess it should be “The house of curves will tumble soon.”…
The responsiveness of SLR to emissions
https://ssrn.com/abstract=3023248
The average person would miss the “relative to Guam’s shoreline” qualifier in the EPA’s statement. This completely negates the need for mentioning the datum shifts due to the earth movement.
Remember the EPA is more about feelings than science, so by leaving out the science from their statements they can focus on the feelings that they wish to generate about their chosen target.
Not to worry. Guam will tip over long before it is submerged by sea level rise
Lol…+10…forgot about this!….
He’s on record as saying he was making a joke. I’ll give him credit for making the admiral hold back a chortle, but the truth is, he’s actually on record as being an ignorant politician.
Back in December 2017 there was this article in the news
that claimed that the Permanent Service for Mean Sea Level PSMSL was adjusting the the data, but when you looked into it, it turned out to be NOAA that did the adjusting. No surprise there.
Anyone with coastal property please contact me. I am willing to take your soon to be submerged property off your hands 😉
Seeing just how much variation there is in the monthly data v. yearly reports, plus several clear artifacts from either earthquakes or moving the instrument, would lead me to conclude there is no clear pattern of either rise or fall.
… sea level trends.

Bosporus, Istanbul – Constantinople – a city since a couple of thousand years at the waterfront. One can step out from a boat directly on the pavement.
This is a particular city as the waves are limited the year through, so the buildings went very close to the sea, however it is connected to the global ocean…
Where are those 40 cm sea level rise since the 90s? Oh yeah, the water ‘accumulated’ somewhere in the Pacific Ocean ?
Xerxes may have been more successful in taming the tide than he suspected. Three hundred lashes and chains were expended in this early climate control experiment. By the way, he was the first modern Green. His goal was to make the world a garden by bringing irrigation to the ignorant Greeks. After, of course, first adjusting their population to properly sustainable levels.
Sea level change of the North Sea with respect to the zeropoint New Amsterdam Level (NAP) from 1890 to 2014: 23cm, that is 1.9mm/yr. The text says no accelleration in this data, obviously, but nevertheless contains a sop to the global ‘accelleration’ due to ‘climate change’.
http://www.clo.nl/sites/default/files/styles/clo_infographic/public/infographics/0229_001g_clo_09_nl.png?itok=YFOndXuf
Detailed analyses of the Guam (Apra) data set using cusum techniques agree quite well with your analyses. I detect two major shifts (jumps) in level, the first becoming evident in June 1993, with a duration of only about 3 years. The second (according to me!) started in the period of 14 or 15 missing observations that included the whole of 1998. The step size was roughly the same as for the first changes, but since that time the increase has been non-significant (Prob 0.3). The decrease in the period preceding June 1993 (1.16mm/Yr) is significant – prob < 1E-5.
It is interesting to read the account of the meta data regarding volcanic activity for this period. Thanks, Albert.
Guam is the result of two volcanoes, a sheet volcano to the north and a cone volcano to the south. It is between the Marianas Trench and a relatively shallow portion of the Philippine Sea. The whole area was formed by plate buckling in collision between the EurAsian plate, the Philippine Sea plate, and the Pacific plate. The idea that a tide gauge in such a place would have a stable base is pretty laughable. In my time there in the late 90s, I compared the waterline with photos taken during the landings in the 40s and in the 50+ years, there was little to no change in the pattern of the shoreline, certainly not feet of difference.
Why is it that the authors of these papers on sea level rise never use the physical photos available to determine if their statistical manipulations are correct? it’s like the temperature manipulations that never use written physical descriptions of history to validate climate.
If the models don’t match reality then of course reality must be wrong. /sarc
So if an earthquake pushes the tide gauge down, and the tide gauge reads higher numbers, does that mean there’s really more water in the ocean?
Hopefully no one tries to do that to gasoline gauges in cars. People will run out of gas when the gauge says 1/4 of a tank!
This is the first time I’ve seen sea level records annotated with earthquake events, and of course earthquake-caused land drops are interpreted as rising seas and earthquake-caused land rises are adjusted out. Was there ever any other possibility?