In Feburary 2018, the temperature in the Arctic region went up considerably, prompting the usual caterwauling from climate alarmists worldwide. It looked like this at Vox, they saw red, and the caption is theirs:

The temperature plot from the Danish Meteorological Institute showing the spiking temperatures about 80°North:

Source: http://ocean.dmi.dk/arctic/meant80n.uk.php
Predictably, excitable pundits went nuts over this, adding to the “climate change” conversation. For example, Zack Labe at Vox went with this language:

I particularly enjoyed this bit of alarmism int he caption for the first graphic above:
“The Arctic was 5.1 degrees Celsius warmer than normal on February 27, following several days of unusually hot weather.”
Well it was more like 10 degrees Celsius, if you look at the DMI temperature graph, but what really grabbed me was the “hot weather” definition. The DMI graph is in Kelvins, and if you convert that peak temp of ~ 245K to Celsius, you get: -28.15°C or -18.67°F. I challenge any sensible person to call that “hot weather”.
But more importantly, there’s this claim by Zack Labe:
We’ve seen an unprecedented pattern of high temperatures in the Arctic in recent years
Um, no. Once again, these climate noisemakers don’t pay attention to climate and weather history, probably because it ruins their narrative, like this graph does:

We have only a short record of the Arctic temperature, going back to 1958, just 60 years. Yet somehow, back in 1972 and 1976, when CO2 was at approximately 315-320 PPM, virtually the same event happened in the Arctic. Twice.

So much for “unprecedented”. And what about those claims that we need to get back to 350 PPM, the “safe level” of CO2 in our atmosphere, the number that 350.org was founded on.
Dr. James Hansen, the top climate scientist in the US has just announced his retirement from NASA. He’s been one of the best advocates a planet could ask for — he even gave us our name when he wrote that 350 parts per million is the safe level of CO2 in the atmosphere.
How could such tragic “unprecedented” temperature events in the Arctic happen at 315 to 320 PPM? Inquiring minds want to know.
Could it just be that it’s just weather, and CO2 has nothing to do with it? Nah, there’s no grant money in that.
But wait, there’s more.
Alarmists like to point to the recent low sea ice years of 2007 and 2012 and being “proof” of carbon dioxide’s effect on the north polar region. They see it as a consequence of “polar amplification“.
Yet, the temperature spikes for those years don’t seem to be inline with that narrative, and aren’t nearly as large:


Source: http://ocean.dmi.dk/arctic/meant80n.uk.php
Note that during the summer melt season, when those “historic unprecedented low sea ice” conditions occurred in 2007 and 2012, but the summer melt seasons had near normal temperature, the mean temperature was near climatic normal (the green line) both times.
What I do see though, is that during the springs of 2007 and 2012, there was a lot of fluctuations in temperature that were above the climatic norm. This suggests, like we saw in February 2018, that weather events changed the temperature, perhaps setting the stage for more flushing of ice out of the Fram strait.
Arctic sea ice occupies an ocean basin mostly enclosed by land. Because there is no landmass at the North Pole, sea ice extends all the way to the pole, making the ice subject to the most extreme oscillations between wintertime darkness and summertime sunlight.
…
During the “positive” phase of the Arctic Oscillation, winds intensify, which increases the size of leads in the ice pack. The thin, young ice that forms in these leads is more likely to melt in the summer. The strong winds also tend to flush ice out of the Arctic through the Fram Strait. During “negative” phases of the oscillation, winds are weaker. Multiyear ice is less likely to be swept out of the Arctic basin into the warmer waters of the Atlantic. Source: NASA
Nature surely is inconvenient when she doesn’t conform to alarmist expectations, isn’t she?
A more likely explanation for Arctic ice loss is the +AMO weakening and thinning the sea ice allowing winds to more easily transport it into the N. Atlantic where it melts.
If I’m right we should see the ice return when the AMO goes negative.
“There are three kinds of lies: lies, damned lies, and statistics.” Mark Twain
And….”Figures don’t lie, but liars figure”.
lies, damned lies, statistics and model projections.
Earthling2 – And Mark Twain attributed that nugget to Britain’s Benjamin Disraeli.
“I only trust statistics I forged myself”. Attributed to Churchill, for some reason (may because he indeed told that; or just because it is so Churchillian…)
A long list of funny one here
https://stats.stackexchange.com/questions/726/famous-statistical-quotations
Does Churchill qualify as a statistician?” – “If he ever faked some data, then sure”
“Anyone can make up meaningless statistics, 17% of people know that” -Homer Simpson
I was just looking at DMI as I run through my morning routine.
No wonder it is so fricking cold lately. Look at all the heat the planet lost after that warm spike went out to space.
Fricking cold – yes in a goodly sized region of North America, but not the planet. According to the global temperature index most favored by skeptics (UAH v6 lower troposphere) global temperature anomaly was +.24 degree C in March, and that one’s baseline is 1981-2010.
Yes, the DMI measures temps in the NH. Very good.
Can’t climatologists pick a single reference baseline and stick with it, please? The constant shifting from baselines from 1950-1980, or 1961-1990, or 1981-2010 is enough to make a mockery of the science itself.
That has to been one of the most sorry and useless comments I have ever read in my many many years of reading comments on WUWT.
@AZ1971;
You’ll have to take that up with the WMO. Current climatology is defined as the most recent 30-year period ending in the most recent decade, so the current climatology is 1981-2010. The real sticking point is that not everyone actually uses it. Some go back to 1951, others use the entire record, and others roll their own.
WJRussell,
Because climate is defined as the most recent 30-year period, it is expected that will be continually updated and moving forward. However, unless there is some special point to be made by using a particular reference period, it is best the everyone agree on a single reference period for comparisons. When you have several standards, you don’t have a standard! If the point is that industrialization has altered the climate, and that is demonstrated by comparison to recent 30-year averages, then a pre-industrial 30-year period should be used as the standard to compare to. As it is, all kinds of claims can be and are made, but without a score card, one doesn’t know who is on first and what’s on second. Climatologists (WMO?) should pick a single pre-industrial 30-year period and use that as the base-line for all subsequent comparisons! Anything else should be justified with why it was used.
The satellite measurement starts in 1979. Its been consistent with a climate oscillating with a 60 year period. Its a fraction of a degree warmer than 1940 rather than the same because of the thermometer record – or, more accurately, a reconstruction by activists who took the opportunity of there being only about a quarter of the data to get a global average and made up the rest.
+ 0.24 deg C for the globe? OK. What’s the margin of error?
+.24 degree C in March Compared to what exactly? Last year? That’d be +24 C per century. Everything would be dead. .24 C per decade. You might want to specify that next time.
If you look at the slope of the line from 1979 to 2015 it’s pretty flat though. More in the .3 C over 30 years or .1C per decade 1C per Century range.
http://www.drroyspencer.com/2015/04/version-6-0-of-the-uah-temperature-dataset-released-new-lt-trend-0-11-cdecade/
AZ1971
I totally agree. Graphs can be so deceptive, especially with intent. (Ross Perot,Al Gore, etc)
The same pattern we’ve seeing for the last several years. But the alarmists are so stupid they don’t get the fact that it will take the red line staying well above the blue line for a much extended period for their dream of a “virtually ice free arctic” to be realized.
Lol – stupid alarmists and there stupid graphs. All fake.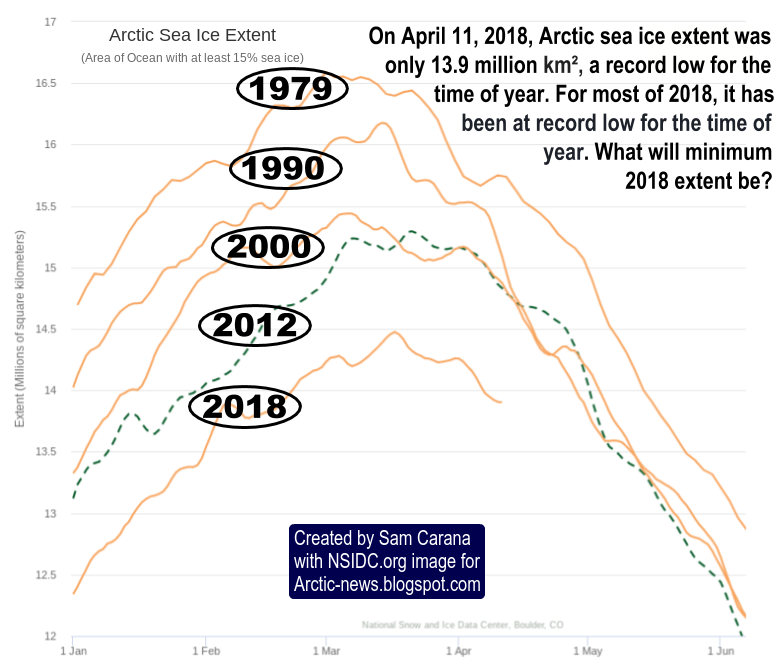
https://lh5.googleusercontent.com/ir_r9rJE4FkwMyPmuPEsPBd-W6gyaqjOS2AiAN5swMh-6_0TixNrTBf_sLOF-N7fMRvmaRg9bFwzaiAl=w1360-h637-rw
fake news indeed,
this graph cherry picked some years to show some regular diminishing trend, which doesn’t exist at all.
and to make it some bad news, when the news is, at worst, neutral, and more probably all good (the less ice extend, the better, not the worse !)
Alarmism in a nutshell:
* take neutral truth
* make it scary through cherry-picking
* create a trend out of natural variability
* make it a sin of man. WASP preferred.
* use it to control, tax and command people
Sea ice in 2016-2017 was almost a million sq km lower than 2017-2018. It actually went up, so how is it at record lows? I am looking at the Nation Snow and ice data center. http://nsidc.org/arcticseaicenews/
Yep, satellite image does not lie, Arctic Sea covered with ice, just like it is every winter. I can’t wait for this summer’s crop of warminista morons getting stuck in the sea ice and screeching for help. Only thing that could make it better would be drone footage of their yachts sinking and them desperately trying to inflate their life rafts.
The Arctic ocean only covers around 7.2 million km2 and is covered all winter every year with sea ice. The seas and basins around it are having the slight fluctuations that give the winter anomalies. These mainly on the Russian side are to do with the AMOC and nothing to do with actual air temperatures or these areas would had frozen too.
Inconvenient truth.
http://www.woodfortrees.org/plot/nsidc-seaice-n/from:1979/normalise/plot/esrl-amo/from:1979
What will 2018 extent be?
The AMO has recently declined significantly so this will reduce sea ice melt later this year.
http://www.woodfortrees.org/plot/esrl-amo/from:2017
June 1977 had very similar Arctic ice extent to June 2000 being just one example, using sample ice grid in digital form data.
Something else that amazes me about these alarmists is that none of them seem to be capable of analyzing what the hemispheric consequences are after this warm surface flow came to an end. How can that be? Even alarmist scientists don’t seem to get it. I find it hard to comprehend how they can be so blind.
Just a guess, but I’m thinking it has something to do with their wishing to continue riding on the CAGW Gravy Train Express. If it doesn’t fit the Warmist doctrine, then a ginormous flashing neon sign above pointing to it still won’t allow them to see.
Stupid is as stupid does.
Hi Goldminor ! IT IS CALLED WILLFUL BLINDNESS….and a serious LACK OF MORAL and ETHICAL STANDARDS.
.
In an “honourable profession” one would be obliged to RESIGN in disgrace………..which NONE DO………
and that says a lot about the character and quality of the “scientists” involved in the Catastrophic AGW.
They are shameless and probably the ones that Prof.Jordan Peterson would describe as
” POST-MODERN NEO-MARXISTS ” , emotionally driven by IDEOLOGY and a LUST FOR POWER.
FACTS are often an inconvenient intrusion into the CAGW PROPONENT’S agenda !
So don’t expect REAL FACTS but do expect lots of ABUSE and DENIGRATION of your character
and lots of “scrambling for the high moral ground ” on their part !
Regards , Trevor.
“There are none so blind as those who will not see.” Pretty much nails it, really.
It’s not about facts. It’s about how they feel. They ‘feel’ the earth is doomed. That’s all you need these days.
I would think if the graphs shown had included error bars which I believe are small during the summer and very large during rest of the arctic year there would be less disagreement.
Regarding the 1972 and 1976 graphs: In 1972 the spike was about 3 degrees K cooler and in early March, not late February. In 1976 the spike was about 1 degree K warmer and about a month later, in late March.
The article was about spring warming events.
Spring warming events? What about the headline ‘Remember that “unprecedented” Arctic heating event in February 2018? Never mind.’?
That’s when the most recent spike was.
Only the terminally clueless would insist that any comparable spike must also be in February.
What relevance does that have on anything? Were you under the impression that WUWT readers can’t decipher a simple graph?
It’s not all that obvious how much later in the year the spikes were in the 1972 and 1976 graphs than the spike in the 2018 graph is, without paying some attention beyond a usual glance at a graph. Something I did see is that these graphs were brought in to make it appear that the February 2018 spike is nothing new.
The OP quoted a claim about “unprecedented pattern of high temperatures in the Arctic”. The graphs show that the temperature *isn’t* high, and that large spikes aren’t unprecedented. The claim rebutted wasn’t about “unprecedented not-quite-as-bone-chilling cold in the Arctic in February”, and if it were the record is far too short to make claims that spikes in February are somehow anthropogenic in a way that past spikes in March are not.
Donald, are you really going to try to hang your hat on a difference of a couple of days in when the spike occurred?
Do you take lessons in how to make yourself sound desperate?
What’s “couple of days” when one of these spikes was a whole month later?
Wow, weather events in 1972 and 1976 did not happen on the exact same day as in 2018?
billw1984,
Yes, I remember when I lived in Vermont, we didn’t get snow (18″) until Christmas Eve in 1966; However, there was snow on the ground in October in 1967. Hey, wasn’t there a movie with Bing Crosby about desperately needing snow in Vermont before Christmas? I guess nobody told Mother Nature she was supposed to have snow on the same day every year.
I will never forget last year’s freakout when temperatures in the Arctic were “20 degrees above average”. It was an event described as “freakishly warm” and “super hot”. When I looked at the accompanying chart, I could see that they were still talking about temperatures well below freezing. A little later, all of the articles deleted the chart so you couldn’t see the actual temperatures being discussed.
I want all the 97% of scientists to get together, preferably in a tropical island 5,000 mile from anywhere, and put together EXACTLY what we are to expect in the next 2 years, 5 years, 10 years and every 5 years after that until 2070. Not this maybe stuff. Then we will have one set of written predictions we can measure them against.
What exactly are the global temps going to be. How much Arctic ice will there be (if it matters). What will the tide gauges at 20 of stable locations around the globe be showing. It needs to be put up or shut up. No excuses. And the temperature and tide data has to be totally transparent and stored by a third disinterested party.
Can we hope that the tropical island is a dormant volcano that suddenly goes active and sinks into the Pacific? They would enjoy that and we could pretend we cared.
No worries … everyone knows that if you do that and climate change continues, the island—like Guam—will tip over.
Their output will be a spaghetti graph, rbabcock.
The IPCC politicians/bureaucrats have already determined what AR6 will say. I hope people will comment on CMIP6 models.
Ok, so let’s take their output and get a chimp and a dartboard to come up with a competing spaghetti graph and have a contest between the two. Take it out to Las Vegas and get a betting line put on it.
I’m already in Las Vegas, so I’ll hold the bets.
That should work. I’m pretty sure the chimp is already teaching climate science at Penn State, so there’s that!
+1, John.
Seriously, though: I hope people won’t allow a repeat of the RCP 8.5 travesty and the AR5 trick of arbitrarily reducing modeled temperatures in the near term, leaving the overheated out-years unchanged.
The U.S. members of the IPCC oversight body should shut down the SPM abuses. And demand abolition of bureaucratic jargon.
Meanwhile, here in flyover, USA we are still digging out from a spring blizzard that brought record setting cold and near record snow to several states. My own area had a high 30°F below seasonal average and set a record low for the day a full 7°F below the old record. With that came about a foot of snow. Yeah, I know — weather. But if anybody up North is short of ice or has kids that “don’t know what snow is” we’d be glad to loan them some.
Western Canada has been 10-20C colder than average for most of the last two months. Somehow it shows as slightly warmer on the heat anomaly maps. It is to laugh!
April 16th, an half an inch of global warming west of Chicago this morning.
28 degrees F.
Not looking good for the vegetable garden for another week at lease.
Our local Little League usually has their opening day parade on the first Saturday in April. Spring cleanup is usually 2 weeks earlier. The last 2 years they’ve had to push it back by 3-4 weeks. Hard to rake up the detritus on the field when it’s under 6″ of snow. This year they didn’t even try. Opening day will be April 21.
Failing to note the “record heat” was -18F was a bit of an oversight?
I don’t know where that “peak temp of ~ 245K” comes from, because the 2018 graph shows the February spike peaking at about 263 K, which is about +14 degrees F. And that is for the region north of 80 degrees N as a whole. The news articles that came out then mentioned record-high temperature above freezing for some specific place there.
@ Donald ,,,the spot that went slightly above freezing was on the northeast corner of Greenland along the coast. It looks like it went above freezing for around 48 hours at the height of the warm flow. Also a small section of water at the very edge of the arctic waters looks like it rose to perhaps 38 F on the 24th and the 25th of February.
I noted that also. It still has nothing to do with global warming or global temperatures. It reflects a change in Arctic winds that bring open water ( marine) temperatures into play to affect thye aggregate.
I was in the arctic archipelago for the big temperature spike of 1976. I can tell you that it sure didn’t feel like a temperature spike.
The other thing that occurs to me is that there have been plenty of times in recent years when the arctic temperature spiked 5 degrees above normal. Are these people not paying attention.
So now we have normal and cold in the Arctic, cold in the U.S., and normal ice and cold in Antarctica. That all amounts to no news.
Great take-down by Anthony using cold hard facts.
“Shooting them is like shooting rats …… The strange thing was, as soon as one went down, another would take his place. ….. They never seemed to learn.” LOL
https://www.americanrifleman.org/articles/2018/2/28/the-genesis-of-sniping-part-6-soviet-sniping-1939-1945/
Anthony used the term Whack-a-Moley some years ago to describe how when punched down on one item, climate zealots pop up on another. I detect the tone has gotten more testy as their position gets more difficult to rationalize.
They never really recovered the puff they lost with climategate and they lost all shame with brute manipulations llke the Karlization maneuver to kill the dreaded “Pause” on the eve of Tom Karl’s retirement. This sort of deceit comes back and kicks butt. The hope has been that eventually the heat will be back and they can readjust this back down again when nobody is paying attention.
They used to argue ENSO was neutral on temperature hot and warm cancelling out and that natural variation was small. Now, like the first landfalling Atlantic Hurricanes in 12 years, they are desperately all over ENSO or any thread of false hope to convince mainly themselves that climate doom is moving inexorably forward.
I think we are due for another pandemic of Climate Blues like the first one set up by Climategate and then addition of the last straw of the “Pause”. Trump upped the ante loading their psyches with an unthinkable end to the scherade. The Soroses, Steyers, Rockefellers …are looking suddenly even older. Planck famously said science advances one funeral at a time.
I checked out your link, and just happened to notice that R. Lee Ermey died yesterday. RIP, Gunney.
How dare they send nice, warm Hawaiian air to
….a dark place the sun don’t shire
to chill out!!
The nerve… errr…it will come back to haunt them!!
Meanwhile at 45 N in Ottawa, Canada we have had nights as low as -7C over the past week and freezing rain today as it climbs to 1 to 3C. More on the way.
Too many climate scientists have become enamored and immersed in their models and global temperature. They have essentially become “gamers” ignoring the real world and living in their virtual world which doesn”t really exist. When was the last time you read a paper that blamed changes in a population on plain old habitat loss or human interaction? Lately, everything is because of climate change. Polar bears, penguins, this bug or that bug, this animal or that animal you’d think the world was already 20 degrees warmer than 1940. If only some of the scientists predicting catastrophe would look around and see that too many things are being blamed on temperature rises that haven’t even happened yet then we might see some backtracking.
I went to the south at the Provence where it should be 17-20°C with peaks already to 25°C… well this is normal… or should be normal. Great was our amazement that we had… SNOW in april and a “whopping” 1.5°C or nearly 20° below average.
Of course this is also weather but in the other way round. When it is somewhere ways warmer to normal Elsewhere it is lots colder then normal….
FYI the Province is southern France forgot to mention 🙂
Who can forget where that great Provencal cheese comes from?
When you spelled it correctly, I knew where you were. Most people here did also, I am sure.
Absolutely correct about weather patterns, too. I’ve had it quite warm here in southern Arizona this winter, while seeing the Midwest and East being hammered by cold.
A few years ago, though, I had snow on the ground here in Tucson at this time (briefly). Several nights of temperatures in the single digits that winter, too. While at the same time it had been unseasonably warm to my east.
“..Unusually Hot Weather”
The test would be someone in swimming shorts or maybe speedos just sitting out in a chair where and when this ‘Hot’ weather took place. Hot weather for me is where sun tan cream is required and the time in the sun is rationed to avoid getting heat stroke or dehydrated. I have never considered that unusually hot weather could lead to hypothermia but I have a sneaky feeling that sun bathing where ever this ‘event’ took place wouldn’t end well if you behaved as if on holiday in Crete.
A cooling planet is going to change the conservation.
It is interesting that there was a massive increase (200% average) in mid-ocean seismic activity for the entire warming period (1996 -2016) as compared to the cold period (1979 to 1995), see figure 2 in the linked to study.
The spikes in mid-ocean seismic activity highly correlate with increased Arctic temperatures and El Niño events.
There has been a sudden drop in mid-ocean seismic activity. Based on analysis of the record, there is a two-year lag in time from when the change in mid-ocean seismic activity occurred and when there is a change in planetary temperatures.
h/t to the NoTricks Zone.
http://notrickszone.com/#sthash.BlxTY2Yc.EpayRG49.dpbs
https://www.omicsonline.org/open-access/have-global-temperatures-reached-a-tipping-point-2573-458X-1000149.pdf
Interesting. +10
Global SSTs have dropped about 0.3 degrees since the 2016 peak:
http://www.climate4you.com/
(Click “oceans”)
This study from the University of Alberta claims one-degree C rise at a High Arctic lake is disrupting the entire local ecology. https://www.folio.ca/one-degree-rise-in-temperature-causes-ripple-effect-in-worlds-largest-high-arctic-lake/?utm_source=facebook&utm_medium=bp&utm_content=180410&utm_campaign=hazen-lake
Does this pass the smell test?
Do you mean IS THIS ON THE NOSE ? ( as in IT STINKS ! )
Well…… given the present Canadian Government…………….it’s about right for another grant I think !
So the climate hippies or CAGWers or Warmian groupies think that Doomsday is looming on the – ummm…. the next seasonal temperature variation?
Doomsday. Why is it that cult followers always, always, always expect the End of the World any minute now? It’s kind of like finding some of those old black-and-white sci-fi movies like ‘THEM!’ or “Spider vs the Earth’ running on the evening movie special, instead of on Yertoobe or a DVD. The Dodos in ‘Ice Age II’ were like this bunch. Doom on You!!!
They should be careful what they wish for. Maybe we could get them all together in one place and tell them “Doomsday is coming. Just wait for it” and then just leave.**
The rest of us will just get on with our lives.
**N.B. I hope everyone understands I’m being sarcastic.
Hey, the doomsayers are probably right, they just can’t seem to get the date right. But then, what is an error of a million years or so. The point is you can’t prove them wrong when they say the end is near. And if they are right, there will be no-one to say I told you so.
If Mystery Science Theater 3000 did An Inconvenient Truth, I might actually watch it.
SARA, In addition, I’ll want a generator, an inverter, a solar battery charger — and plenty of storable food, water, and water filtration devices as well as a shotgun, rifle, pistols and a red rider B.B. gun with a compass in the stock.
You’ll shoot your eye out, kid!
The climate that matters – the only climate that matters – is that experienced by farms where our food is grown. And this spring, the farmers in Britain are not happy – as even the Guardian is compelled to report.
The UK’s Guardian talks about a “disastrous late spring” in Britain:
https://www.theguardian.com/environment/2018/apr/14/farmers-crops-livestock-turmoil-beast-from-east-climate-change
And needless to say it’s all evidence of manmade climate change, the “theory” that no conceivable observation could ever falsify. Unbelievable that they keep this up with a straight face. At least their last sentence is along the right lines:
“We need to remember that it’s reckless to take food production for granted…”
Some of the folks which I interact with on FB are from Canada. One in particular, J Fournier, has been posting pics of the frozen landscape, and it is not over as of yet. The farmers there will be over 2 months behind on their planting. That is presuming that the weirding doesn’t hold through May, or into early June.
Thanks for that link, Phil.
Northern hemisphere sees in early spring due to global warming
Guardian, March 2017
British farmers in turmoil as delayed spring plays havoc with growing season
Guardian, April 2018
Anthony, I am surprised to see that your fact-checkers have not already alerted you about the incorrect figures in your article “The DMI graph is in Kelvins, and if you convert that peak temp of ~ 245K to Celsius, you get: -28.15°C or -18.67°F.” below the Vox screengrab. I think you intended to write 265 K, converting to -8 deg C & 18 deg F (approximately)
And again simply falls into.the range of previously ohserved natural variability. i.e.
Urban-Heat-Island effect overprinting of natural variability = Myth of human-induced climate-change.
Anthony,
“…alarmism int he caption…” Needs to be fixed.
Look at this new post at Dr Spencer’s page. …http://www.drroyspencer.com/2018/04/midwests-april-chill-most-unusual-on-earth/#comments
I have a hard time understanding why this inflow of warm air has anything to do with heating of the region?
How is it measured-at stations or from satellites?
How many stations are there and have all the same spike?
It was only a momentary heating ( 4 days total) , after which all of that heat was lost to space. The cold immediately returned with a vengeance afterwards. Many locations around the NH have since stayed well below average. The satellites observed the entire episode.
The summer temps can never rise much above freezing so the end bit about the temps being near normal is a red herring. It’s a physical limitation that sea water won’t get colder than -2C and the solar energy goes into melting the ice, not warming the surface in the summer. It’s predictably 0C during the summer (fresh water ice) with no variation and that’s very clear from graph. Even the most extreme warming scenario will not have the north pole surface above 0C ever.
“Unprecedented” is the most overused descriptor used when wanting attention. Don’t make a drinking game using the word when watching the next Olympics unless you want alcohol poisoning.
So, yet another lie from the political left. Surprising? Hardly.
Dumb alarmists
Anthony, I see someone did try to get the DMI’s Arctic Temperature graph on the Sea Ice Page to update after I mentioned the problem a few weeks ago, but now it’s stuck at about Day 55 or so and still isn’t updating on a daily basis. Since it’s the basis of the discussion here today I thought I’d mention it again.
It’s a worthwhile exercise to click the DMI link below the graph in the article and then click through all the years from 1958 to 2018. Unquestionably, the 1960’s experienced far colder winters in the arctic than recently with winter months consistently falling below the 1958-2010 average line. Then for about 30 years, up to 2000, it’s hard to detect any consistent trend away from the average. After 2000, more and more years see winter temps above the average with the last few years being especially warm. 2016 was noteworthy.
The summer months are constrained by the melting ice and summer temps track quite close to the average for the entire six-decade time frame.
P.S. For the conspiracy-minded, the 2002 graph shows overlapping of blue and red lines when I believe the measurement system was transitioned to a new methodology, right before things really started to warm up. Personally, I doubt there has been any tinkering but thought it was worth noting.
With the exception that the Arctic Sea is still covered with ice every winter, and the temps are still FAR BELOW freezing, whats your point? Sea ice freezes and melts, over and over and over and over. That is what it does and humans are not effecting it at all. Unless you want to count all the Russian, Norwegian, Canadian and Chinese icerbreakers churning their way through it, when it finally gets thin enough in that window of a few months each year. My favorite in recent years was the Russian CNG tanker which had to be abandoned and left to breakup when it got caught in the sea ice in August. Bet that effected the sea ice coverage for about 10 minutes as the wreckage burned while being consumed by that helpless sea ice.
Rod, I think you are right on. It’s the less cold winters that are creating less mass of ice; since in the summer roughly the same mass of ice melts, the net mass change is negative because of winter, not summer.
You can’t deal with Apparatchiks and their minions from the press. Just ignore them.
A very important point to consider in regard to Arctic temperatures is that there has been a dearth of drifting buoy observations in the Arctic this winter, especially those with reports being relayed in the global synoptic data network in near real-time. This winter there were no synoptic reporting buoys within 7 degrees of the North Pole and the closest air temperature measurement location was actually the land station at Kap Morris Jesup (04301) at the northern tip of Greenland, about 6.5 degrees south of the North Pole (or about 450 miles). All inferences of temperature near the North Pole this winter have been derived from weather models like GFS and ECMWF, which are better than nothing, but no match for having reliable measurements.
I found additional buoy reports that were not in the synoptic reporting network available in near-real-time here (and historical data too), but none with air temperature close to the North Pole:
http://iabp.apl.washington.edu/maps_daily_table.html
I don’t know if data from any of these additional buoys are later ingested into the Reanalyses for the GFS and ECMWF. However, I found that some of the few Arctic buoy reports in the synoptic network were incorrectly reporting the hull temperature as air temperature. Most buoys have both air and hull temperatures when they are first deployed, but over time one or both sensors fail. When the buoys are trapped in ice, the hull temperature is often much higher than the air temperature when both are available. The hull temperature yields water temperature when no ice is present, or ice temperature when the hull is trapped in ice.
An additional problem in cold climates is that rime icing can encapsulate air temperature sensors in ice, making them tiny igloos that are insulated from colder air outside the ice covering. This problem causes sensors to read too high when outside air is very cold and too low when outside air temperatures go above freezing initially and until the ice melts. Effectively, getting accurate air temperature measurements in the Arctic is a difficult challenge, but you’d think with all the fuss about a recently warming Arctic there would be more and better measurements and not fewer and lower quality measurements.