Holocene Sea Levels were 2 Meters Higher
1. Are Modern ‘Anthropogenic’ Sea Levels Rising At An Unprecedented Rate? No.
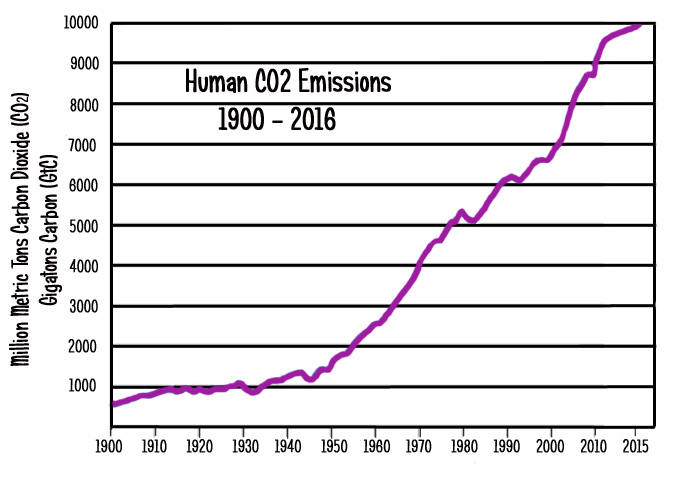
Despite the surge in CO2 concentrations since 1900, the UN’s Intergovernmental Panel on Climate Change (IPCC) has concluded that global sea levels only rose by an average of 1.7 mm/yr during the entire 1901-2010 period, which is a rate of just 0.17 of a meter per century.
During the 1958 to 2014 period, when CO2 emissions rose dramatically, a recent analysis revealed that the rate of sea level rise slowed to between 1.3 mm/yr to 1.5 mm/yr, or just 0.14 of a meter per century.
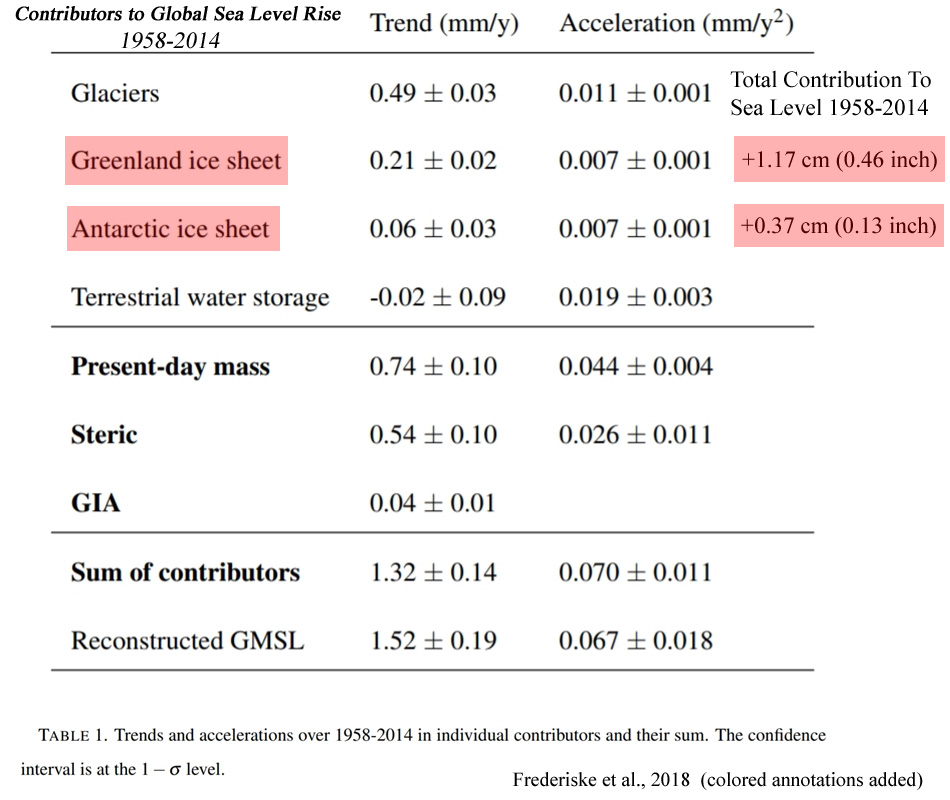
Frederiske et al.,2018 “Anthropogenic” Global Sea Level Rise Rate (1958-2014): +0.14 of a meter per century
“For the first time, it is shown that for most basins the reconstructed sea level trend and acceleration can be explained by the sum of contributors, as well as a large part of the decadal variability. The global-mean sea level reconstruction shows a trend of 1.5 ± 0.2 mm yr−1 over 1958–2014 (1σ), compared to 1.3 ± 0.1 mm yr−1 for the sum of contributors.”
2. ~15,000 – 11,000 Years Ago, Sea Levels Rose At Rates Of +4 to +6 Meters Per Century
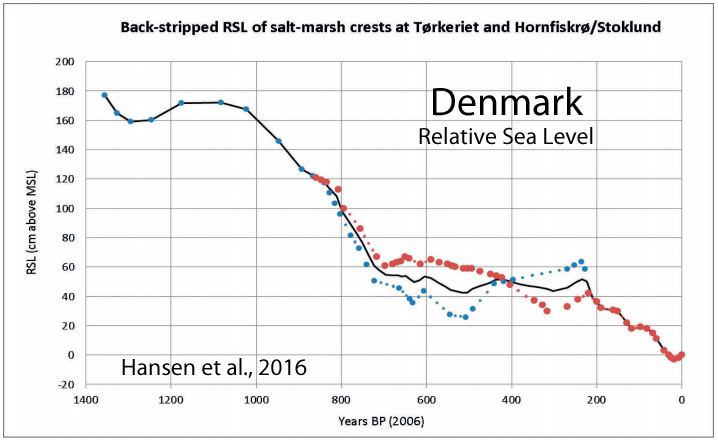
In the past few thousand years, sea levels in some regions rose and fell at rates of + or – 0.5 to 1.1 meters per century. Sea levels during the Medieval Warm Period were+170 centimeters higher than today.
Hansen et al., 2016 Denmark, +1.7 meters higher than present during the Medieval Warm Period

“Continuous record of Holocene sea-level changes … (4900 years BP to present). … The curve reveals eight centennial sea-level oscillations of 0.5-1.1 m superimposed on the general trend of the RSL [relative sea level] curve [relative sea levels ~1.7 m higher than present from 1400 to 1000 years ago].”
Cronin et al., 2017 Global Sea Level Rise Rate: +4 meters per century (14,500 to 14,000 years ago)
“Rates and patterns of global sea level rise (SLR) following the last glacial maximum (LGM) are known from radiometric ages on coral reefs from Barbados, Tahiti, New Guinea, and the Indian Ocean, as well as sediment records from the Sunda Shelf and elsewhere. … Lambeck et al. (2014) estimate mean global rates during the main deglaciation phase of 16.5 to 8.2 kiloannum (ka) [16,500 to 8,200 years ago] at 12 mm yr−1 [+1.2 meters per century] with more rapid SLR [sea level rise] rates (∼ 40 mm yr−1) [+4 meters per century] during meltwater pulse 1A ∼ 14.5–14.0 ka [14,500 to 14,000 years ago].”
Abdul et al., 2017 Global Sea Level Rise Rate: +4 meters per century(11,450 to 11,100 years ago)
“We find that sea level tracked the climate oscillations remarkably well. Sea-level rise was fast in the early Allerød (25 mm yr-1), but decreased smoothly into the Younger Dryas (7 mm yr-1) when the rate plateaued to <4 mm yr-1here termed a sea-level “slow stand”. No evidence was found indicating a jump in sea level at the beginning of the Younger Dryas as proposed by some researchers. Following the “slow-stand”, the rate of sea-level rise accelerated rapidly, producing the 14 ± 2 m sea-level jump known as MWP-1B; occurred between 11.45 and 11.1 kyr BP with peak sea-level rise reaching 40 mm yr-1 [+4 meters per century].”
Ivanovic et al., 2017 Northern Hemisphere Sea Level Rise Rate: +3.5 to +6.5 meters per century (~14,500 years ago)
“During the Last Glacial Maximum 26–19 thousand years ago (ka), a vast ice sheet stretched over North America [Clark et al., 2009]. In subsequent millennia, as the climate warmed and this ice sheet decayed, large volumes of meltwater flooded to the oceans [Tarasov and Peltier, 2006; Wickert, 2016]. This period, known as the “last deglaciation,” included episodes of abrupt climate change, such as the Bølling warming [~14.7–14.5 ka], when Northern Hemisphere temperatures increased by 4–5°C in just a few decades [Lea et al., 2003; Buizert et al., 2014], coinciding with a 12–22 m sea level rise in less than 340 years [3.5 to 6.5 meters per century] (Meltwater Pulse 1a (MWP1a)) [Deschamps et al., 2012].”
Zecchin et al., 2015 Regional Sea Level Rise Rate: +6 meters per century(14,500-11,500 years ago)
“[M]elt-water pulses have punctuated the post-glacial relative sea-level rise with rates up to 60 mm/yr. [6 meters per century] for a few centuries.”
3. Over 70 Papers Affirm Sea Levels Were 2+ Meters Higher Than Now A Few Thousand Years Ago When CO2 Levels Were ‘Safe’
70+ Papers: Sea Levels 2+ m Higher 9,000-4,000 Years Ago While CO2 Levels Were ‘Safe’ (265 ppm) More Here
Before the advent of the industrial revolution in the late 18th to early 19th centuries, carbon dioxide (CO2) concentrations hovered between 260 to 280 parts per million (ppm).

Within the last century, atmospheric CO2 concentrations have risen dramatically. Just recently they eclipsed 400 ppm.
Scientists like Dr. James Hansen have concluded that pre-industrial CO2 levels were climatically ideal. Though less optimal, atmospheric CO2 concentrations up to 350 ppm have been characterized as climatically “safe”.
However, CO2 concentrations above 350 ppm are thought to be dangerous to the Earth system. It is believed that such “high” concentrations could lead to rapid warming, glacier and ice sheet melt, and a harrowing sea level rise of 10 feet within 50 years.
To reach those catastrophic levels (10 feet within 50 years) predicted by proponents of sea level rise alarmism, the current “anthropogenic” change rate of +0.14 of a centimeter per year (since 1958) will need immediately explode into +6.1 centimeters per year.
The likelihood of this happening is remote, especially considering Greenland and Antarctica combined only contributed a grand total of 1.54 cm since 1958 (Frederiske et al., 2018).
It is becoming more and more apparent that sea levels rise and fall without any obvious connection to CO2 concentrations.
And if an anthropogenic signal cannot be conspicuously connected to sea level rise (as scientists have noted), then the greatest perceived existential threat promulgated by advocates of dangerous man-made global warming will no longer be regarded as even worth considering.
Read more at No Tricks Zone
So you’re saying that Hansen is going to look like an idiot when the Westside Highway isn’t under water in 5 years?
We don’t need to wait 15 years to make that assessment.
RWturner April 12, 2018 at 9:27 am
So you’re saying that Hansen is going to look like an idiot when the Westside Highway isn’t under water in 5 years?
No need to wait:
https://twitter.com/ABC7NY/status/860571609127686146/photo/1
http://i.cdn.turner.com/ireport/sm/prod/2012/10/29/WE00847493/2266885/DPP2134jpg-2266885_p9.jpg
Do we really need to explain the difference between flooding from rain and transgression from the sea?
Apparently you do.
RWturner April 12, 2018 at 1:32 pm
Do we really need to explain the difference between flooding from rain and transgression from the sea?
OK since you’re so clever tell us which of those photos was flooding from the sea?
And where did Hansen say what type of flooding it was?
Of course it isn’t the same Westside Highway.
Another sophist inventing specious new meanings to maintain their bias and religion.
Hansen, explicitly is describing a sea level rise; not temporary flooding or a rain event. Sea level rise that according to Hansen, before apologists started changing his words, would occur within twenty years.
A sea level rise that, according to Hansen, would continue to rise endangering coastlines worldwide.
Phil, sea level rise would produce a permanent situation, yes?
We have that kind of flooding all the time. Of course, we are 1000 miles from the Atlantic Ocean. On the other hand, we are only 90 miles from Lake Michigan, so maybe the Great Lakes are doing it.
If warmists want to be taken seriously, they ought to learn something about the real world.
Hansen’s prediction was based on a doubling of CO2 which will not happen in the next 5 years.
5 years… damn typo
This is all such total BS….enough ice can melt in Greenland, Antarctica, etc to raise sea levels….pumping ground water can raise sea levels….the floor of the ocean is going up…or down…..it can rain enough in one small area of Australia to lower sea levels by 1/4 inch……these clowns are all over the place
…and yet we hear constantly about erosion, islands sinking, dead zones from sedimentation, beach restoration, entire areas sinking because the sedimentation that used to build them up is now directed to the oceans…..there’s more shore line erosion and sedimentation pumping crap into the ocean than melting ice ever will
The SLR is hiding in the deep oceans, biding its time along with its pal, Heidi Heat.
Does this mean it’s ok to flush now?
But I don’t understand.
Boston gets ~ 10 feet of sea level rise every day!
Actually Boston SLR happens twice a day, so it is really fair to say that Boston experiences ~20 ft. SLR daily.
We even measure and keep track of it with gauges and everything.
Pevensey Castle was originally built as a coastal fortification during the Roman Warm Period. It sits over a mile from the sea today, and the large bay it once overlooked is all farmland.
Similarly for Rye, once one of the Cinque Ports , now 2miles inland, on the same South coast , and on the Welsh coast there is Harlech Castle (13thCent) of which Wiki says :
– It was built next to the sea, but changes in the coastline mean it now lies on a cliff face, about half a mile (800 m) inland.[4] “-
The archeological site Ephesus, in modern Turkey, was once among the largest cities in the Roman Empire. It was a major port at that time but is now 5 miles inland from the Aegean Sea. I suppose that when Goreball Warming arrives in the near future the cruise ships will be able to anchor just off of the site in stead of at Kusadasi.
Welcome to Thermopylae pass. It’s now 3 km to the Malian Gulf. but at the time of the battle in 480 BC it was 30 m wide.
We need to be careful of the examples we use to support a position, Pevensey Castle is no longer on the coast because of natural river slitting of the bay and reclamation of the marshes for farm land. Just so you know I believe a warm climate and loads co2 in the air is good, I generate as much co2 as I can to give gov Moonbeam the finger.
Cheers
Harlech Castle was built at the end of the Medieval Warm Period. Like Pevensey Castle, it was on the [coast] and is now well inland.
Sea level rise is the favorite theme for hysterics when they are not showing polar bears on photoshopped ice floes. There is about the same level of unreality to both.
In Paul Homewoods excellent “Not A Lot Of People Know That” last week featured an article about the Maldives and that they are building a new runway at their international airport. It will be 3,400 metres long and 60 metres wide. Another case of do as I say not what I do?
A pretty strong argument for falsification of the CAGW theory!
Oh My! Sea levels rising 1.5mm/year? Why, that’s nearly 0.06in/year or 6 inches in the next century! We’re Doomed (echos and fades) – Doomed, I tell you!! /s
Irrational fear mongering rises to a new (1.5mm) level…..
At this rate we will be back to medieval sea level in 280 years. Then, no doubt our civilization will also be medieval. I guess that’s how they have it figured.
By the time 280 years rolls up, we will have Star Ships with warp drive to deal with our problems. Gene Roddenberry will be proven a visionary. If I am proved wrong, sue me.
Yeah, I agree J Mac. The scare-mongering about sea-level is one of the lamer issues (they’re pretty much ALL lame). If you’re scared about sea-level, move. There’s plenty of time.
In addition to these papers pointing to the lack of observational support for alarming sea level rise, there is also the fact that physical forces operating upon the globe constrain where any added water will go, and thus which places will be affected. Those physical forces also create large depressions and ridges affecting water accumulations. A recent study explains:
“This study is based on the geophysical aspects of the earth wherein shape of the earth is the fundamental component of global sea level distribution. The physical surface of the earth adjusted to the mathematical surface of the earth is spheroidal. This spheroidal surface always coincides with the global mean sea level (Fig. 3). Having relationship between the shape of the earth and the global sea level, gravitational attraction of the earth plays a dominant role against sea level rise. Gravity is a force that causes earth to form the shape of a sphere by pulling the mass of the earth close to the center of gravity i.e., each mass-particle is attracted perpendicular towards the center of gravity of the earth.”
Synopsis and links at https://rclutz.wordpress.com/2018/03/26/co2-rise-≠-sea-level-rise/
Water is free to flow, adjusting to the forces on it. These include gravity (the geoidal surface is not a sphere – there is a profound depression in the Indian Ocean for example), the rotation of the earth, and dynamical forces due to ocean currents.
http://4.bp.blogspot.com/-AnkxnwhN0HA/UmZmYHjFs5I/AAAAAAAAANg/jMGuJ-fdgQQ/s1600/geoid-c2.jpg
The consensus is melting… causing blood pressure to rise. CAGW is real, but mischaracterized.
Maligned would be a better word.
Sea levels change (one way or another) for a lot of reasons. It almost seems we ignore geological factors.
I was about to say this looked like a No Tricks Zone article when I saw the link. While I applaud the amount of bibliography they review, one has to be careful about their claims and check what the paper actually says.
Javier –
I would like to see Kenneth Richard’s excellent and very labour-intensive efforts at NTZ given more of an airing here (if Pierre and Kenneth would be agreeable). The commenters at NTZ are rather limited and, dare I say it, devoid of heavyweights. The much wider exposure that goes with a WUWT post would be welcome
Sure, what Kenneth does could be regarded as ‘selective’, and some of the authors whose work he highlights may be absolutely furious, and call it misrepresentation. Well, Kenneth is building a case, and can be forgiven for not giving all the pros and cons from each paper he cites. That’s not his purpose, and such criticism is misplaced. He seeks, repeatedly, to undermine the ‘consensus’ by alluding to the utterly massive volume of work in the mainstream literature itself that questions and/or contradicts, either in total or in part, the major tenets of the CAGW case. Even if the authors are not explicitly saying so. He does it rather well, and perhaps that is why he gets ignored.
mothcatcher, as I said I appreciate Kenneth Richard’s work and I check regularly No Tricks Zone. Some of the articles I read I discover them there. However I have found that it is better to exert some skepticism and double check, because sometimes the claims cannot be sustained on the evidence presented in the article. As an example the Denmark graph in this post has nothing to do with sea level rise and all to do with isostatic rise.
Sure, that’s right. No contest. If you were thinking to use any such paper as an example, you’d do well to check it first. The Danish paper is of limited relevance and rather a strange choice, Upon your comment I just glossed through it. Quite fascinating stuff, nice pictures
“questions and/or contradicts, either in total or in part, the major tenets of the CAGW case”
But mainly it doesn’t. He just goes through proxy stuff and shows extracts where something rose, or fell, or something long ago. And it has nothing to do with AGW.
Almost all the papers highlighted here are about the rapid rise that occurred at the start of the Holocene (deglaciation). There is nothing new there, and nothing that contradicts AGW.
“Sure, what Kenneth does could be regarded as ‘selective’, and some of the authors whose work he highlights may be absolutely furious, and call it misrepresentation. Well, Kenneth is building a case, and can be forgiven…He seeks, repeatedly, to undermine the ‘consensus.”
So, Kenneth can be forgiven for misrepresenting the work of scientists? Is that one rules of the game? Misusing scientists’ work to legitimize his own ideas. It’s nice to finally see it put into words by someone else, this phenomenon.
There is much here of which to be skeptical if you dig a little.
Seei9ng as “sea level” is not “rising”, as anyone with a functioning brain can easily see, you leftards are full of [pruned]. And lets us be clear! 0.00009 percent “increase” in “sea level” is not an increase. It is “variability”. Look that word up, apparently your college edumacation did not include it. Bet you are all “woke” about “microaggressions” though, aren’t you?!?!?!
[Language. Again. .mod]
Kristi
The MSM either selectively highlight or exaggerate what climate scientists say all the time. The difference is that NTZ has a much smaller readership than say the NYT or WAPO.
I became a skeptic after repeatedly discovering that the claims in the MSM were, more often than not,
wildly off target. Now, when I read a story, I automatically do my own research to see what the actual science says. Unfortunately, even some of the climate science papers get carried away.
Cerescokid:
“The MSM either selectively highlight or exaggerate what climate scientists say all the time.”
This is a good reason not to go to the media for one’s information about climate change; it is not an excuse for anyone misrepresenting scientists’ conclusions.
“The difference is that NTZ has a much smaller readership than say the NYT or WAPO.”
If NYT or WaPo consistently misrepresented scientists’ conclusions enough to make them angry, I bet their readership regarding climate change would plunge, too.
“Now, when I read a story, I automatically do my own research to see what the actual science says.”
This is good practice in general, as long as one applies the same level of scrutiny regardless of the stance of the writers.
“Unfortunately, even some of the climate science papers get carried away.”
I’m not too sure what this means. As is true in all fields, not all climate scientists are good at all they do. When one sees the same wild predictions by fringe scientists get repeated as if they were the opinions of the consensus in general, it’s a good indication that bias in reporting is playing a role. Although everyone seems aware that media bias is present, that’s not enough. People need to learn to recognize the signs of bias in media supporting their own views. Look at all the people mistaking this article for rational argument that “Today’s Sea Level Change Indistinguishable From Noise.” Because you do your own research into the reasoning behind the claims, you, too, must have realized that “an anthropogenic signal cannot be conspicuously connected to sea level rise (as scientists have noted)” is bosh – the four papers to which the NTZ writer refers do not support this general assertion.
On the other hand, sometimes scientists break with the pack for good reasons, suggesting alternative climate change scenarios. The paper suggesting potential for “sea level rise of 10 feet within 50 years” could be one, because it is based on a range of data types from different labs that, when combined, form a cohesive hypothesis explaining some recent past regional climate changes that earlier models don’t. I haven’t gotten to the original paper yet (it is very long), but I’ve read a shorter document explaining many of the findings in layman’s terms, as well as making several predictions for the next decade. (http://www.columbia.edu/~jeh1/mailings/2015/20151012_IceMeltPredictions.pdf) It’s also an example of scientists suggesting earlier models are biased, illustrating the fact that “groupthink” doesn’t prevent criticism or the evolution and expression of alternative ideas in climate science. (This doesn’t mean I’m going to put my trust in this new idea, but I will take it into consideration.) (Interestingly, the authors chose to have an interactive online peer review/discussion instead of the traditional one. I’ve lately also seen the peer review published along with the final document. I think this kind of transparency is a good thing.)
However, CO2 concentrations above 350 ppm are thought to be dangerous to the Earth system.
“Thought to be?” By whom, exactly? Based on what? “Thought to be” is a journalistic weasel phrase, in the same category as “some say.”
Many past instances of “dangerous” state of CO2 without any apparent effects. Good or bad. As if we have any business even determining what that means.
We passed through 350ppm years ago, and no problems have been found.
There’s a big difference between “no problems have been found” and “problems have been denied by many skeptics.”
High levels of CO2 are correlated with dinosaurs. Everyone knows that dinosaurs, at least the meat eaters, are deadly.
People used to see levels when there weren’t any. This was called the flat earth theory.
It’s “funny” that this article’s quote from Frederickse et al. (2018) omits the very next sentence: “Over the same period, the reconstruction shows a positive acceleration of 0.07 ± 0.02 mm yr−2, which is also in agreement with the sum of contributors, which shows an acceleration of 0.07 ± 0.01 mm yr−2. Since 1993, both reconstructed sea level and the sum of contributors show good agreement with altimetry estimates.”
See (sealevel dot info), with a new tool for analyzing and viewing sea level data from 1200+ worldwide tide gauges. Shows worldwide average rise of +1.56 mm/yr with NO STATISTICALLY SIGNIFICANT acceleration or deceleration.
From the article: “Sea levels during the Medieval Warm Period were+170 centimeters higher than today.”
Logic would tell us that it must have been warmer in the Medieval Warm Period than it is today if the sea levels were higher then than now.
It was warmer ONLY where the sea level was higher. So not “global.” /sarc
Seriously, you would think all of the logical contortions would at some point cause any honest scientist to admit the CAGW BS story is simply wrong. But then again, I did say HONEST scientists, not the agenda-driven Climate Fascist types.
Indistinguishable from noise … that seems to be the only signal these days that pokes its head above the noise.
The usual notrickszone tricks. This time there is only one graph shown, and the actual graph material seems to be intact. But the usual false and misleading heading added – “Denmark relative sea level” and a pointer indicating “human influence. And it is nothing of the kind.
The heading says “Back-stripped salt-marsh crests of Tarkeriet and …”. And the y-axis label says “RSL (cm above MSL)”. There is a clue. It is not a plot of MSL. It is a plot of the differential of some coastal markers above MSL, at a specific location on a small island. The caption says
So what does it mean? Why the difference? One example:
” Also in raised saltmarsh landscapes, here classified as condensed low-ridge plains (low-rippled washboard plains), swale levels are generally slightly higher than the mean sea level of the time because the beach ridges are formed by vertical accretion during high water, so that the sedimentary process may also affect the nearest hindlying swale during storm surges. “
Hansen et al., 2016
http://www.bioone.org/doi/10.2112/JCOASTRES-D-15A-00004.1
“For the convenience of the readers, our basic results are shown in Figure 1. We identified five individual oscillations (upper panel), including a sea-level amplitude of 70 mm (top–bottom [t-b]) of the 18.6-year oscillation caused by the lunar nodal oscillation (LNO) … Together with a general sea-level rise of 1.18 mm/y, the sum of these five sea-level oscillations constitutes a reconstructed or theoretical sea-level curve of the eastern North Sea to the central Baltic Sea (Figure 1, lower panel), which correlates very well with the observed sea-level changes of the 160-year period (1849–2009), from which 26 long tide gauge time series are available from the eastern North Sea to the central Baltic Sea. Such identification of oscillators and general trends over 160 years would be of great importance for distinguishing long-term, natural developments from possible, more recent anthropogenic sea-level changes. However, we found that a possible candidate for such anthropogenic development, i.e. the large sea-level rise after 1970, is completely contained by the found small residuals, long-term oscillators, and general trend. Thus, we found that there is (yet) no observable sea-level effect of anthropogenic global warming in the world’s best recorded region.”
http://notrickszone.com/wp-content/uploads/2017/06/Sea-Level-Falling-Denmark-1.jpg
“Hansen et al., 2016”

That is a different paper (actually a reply to a comment) in a different journal by a different group of authors (same lead). It isn’t about paleo; it is about tide gauge readings. And they certainly don’t say
“Today’s Sea Level Change Indistinguishable From Noise”
The part you have bolded says there was a large sea-level rise after 1970. So far from “indistinguishable from noise”noise, they claim to have identified “five individual oscillations (upper panel), including a sea-level amplitude of 70 mm (top–bottom [t-b]) of the 18.6-year oscillation caused by the lunar nodal oscillation (LNO)”. They have a theory that the rise is due to lunar tidal effects associated with the shape of the basin in the area. But the rise is there, and local basin effects won’t help with global GMSL rise.
Here is their plot.
The steady line is their sum of five supposed cycles. It seems strange to me that anyone would try to use periodic functions to model such a sustained rise, but if you take enough of them, you can. Some people just love cycles.
The “indistinguishable from noise” characterization is in reference to the 70 papers and how the global “anthropogenic” changes since the late 1950s – a change rate of merely 0.14 of a meter per century – would not even be significant enough to be recognizable on a graph of Holocene sea level changes considering sea levels were 1.0 to 6.0 meters higher than present about 4,000 to 6,000 years ago throughout much of the world.
In contrast to the “anthropogenic” centennial-scale change of merely 0.14 of a meter per century, the Hansen et al. (2016) paper in question “reveals eight centennial sea-level oscillations of 0.5-1.1 m” during the last 4900 years. In other words, sea level changes that are about 4 to 7 times greater than the changes occurring during 1958-2014. That’s consistent with saying modern changes are “indistinguishable from noise”.
And that’s why, in another paper by the same lead author, when there was a “large rise” in sea levels since 1970 detected for the region, Hansen et al. (2016) conclude that “We found that there is (yet) no observable sea-level effect of anthropogenic global warming in the world’s best recorded region [near Denmark].” The recent rise isn’t even detectable against background.
Rashid et al., 2012
http://www.sciencedirect.com/science/article/pii/S1367912012005391
“The abundant marine diatoms and mangrove pollens indicate the highest RSL [relative sea level] transgression in Bangladesh at approximately 6000 cal BP, being at least 4.5 to 5 m higher than the modern m.s.l. [mean sea level]. … The curve indicates that at approximately 5000 cal BP and onwards, the RSL started to fall towards its present position, and the present shoreline of Bangladesh was established at approximately 1500 cal BP and has not noticeably migrated inland since.”
Bradley et al., 2016
“In general, the data indicate a marked slowdown between 7 and 8 kyr BP, with sea level rising steadily to form a highstand of ~2-4 m [above present sea level] between 6 and 4 kyr BP [6000 and 4000 years before present].”
http://notrickszone.com/wp-content/uploads/2016/12/Holocene-Cooling-Sea-Level-China-Bradley-16.jpg
Dura et al., 2011
“A prominent feature of southeast Asia Holocene sea level records is the mid-Holocene highstand (Geyh et al., 1979; Tjia, 1996; Scoffin and Le Tissier, 1998; Hanebuth et al., 2000), which in Western Sumatra, varies in timing and magnitude from 3000 to 5000 cal years B.P., and +6 to +2 m above present-day sea levels (Horton et al., 2005).”
http://notrickszone.com/wp-content/uploads/2018/04/Holocene-Cooling-Sea-Level-Indonesia-West-Sumatra-Dura-2011.jpg
Yu et al., 2007
“Superimposed upon a smooth pattern of local sea-level rise, acceleration occurred ca. 7600 calibrated (cal) yr B.P., evidenced as a nearly synchronous flooding in six elevated basins ranging from 3.0 to 7.2 m above present sea level.”
http://notrickszone.com/wp-content/uploads/2018/04/Holocene-Cooling-Sea-Level-Scandinavia-Yu-2007.jpg
“The “indistinguishable from noise” characterization is in reference to the 70 papers and how the global “anthropogenic” changes since the late 1950s – a change rate of merely 0.14 of a meter per century – would not even be significant enough to be recognizable on a graph of Holocene sea level changes considering sea levels were 1.0 to 6.0 meters higher than present about 4,000 to 6,000 years ago throughout much of the world.”
That doesn’t mean currently measured levels are indistinguishable from noise. There is nothing new about the very large rise with deglaciation, which the papers of Abdul et al, Ivanovic et al, and Zecchin et al, which are featured here are concerned with. The AR5 says, in FAQ 13.1
“For example, during the transition from the last glacial maximum (about 21,000 years ago) to the present interglacial (Holocene, last 11,650 years), fossil coral reef deposits indicate that global sea level rose abruptly by 14 to 18 m in less than 500 years.”
Old news, and nothing to do with AGW.
As to Holocene changes, your characterization that “sea levels were 1.0 to 6.0 meters higher than present” does give an indication of the uncertainty of paleo measurement. But the issue for us and AGW is not whether the changes would be recognisable on a graph of Holocene changes, or show out against paleo uncertainty. It is whether sea level is rising now, and whether we can measure that now, and what it means for us now. They did not have waterfront cities 5000 years ago.
Only one of your papers cited here actually deals with instrumental readings, and the period where AGW effect can be seen. That is Frederiske, who found that not only was SLR distinguishable from noise, but so was the acceleration.
Since AGW is wedded to the claim that CO2 concentrations are primary determinants of trends in sea level rise and fall, and sea levels have historically risen 30-40 times faster than now….
Ivanovic et al., 2017″
[~14,700 to 14,500 years ago] “Northern Hemisphere temperatures increased by 4–5°C in just a few decades (Lea et al., 2003; Buizert et al., 2014), coinciding with a 12–22 m sea level rise in less than 340 years [3.5 to 6.5 meters per century] (Meltwater Pulse 1a (MWP1a)) (Deschamps et al., 2012).”
…while CO2 concentrations remained stationary (~14,700 to 14,500 years ago)…
http://notrickszone.com/wp-content/uploads/2017/04/CO2-Concentration-25-ka-to-1800-AD-Kawamura-2003.jpg
…this would indeed imply that the link between CO2 concentration change as a primary driver of sea level changes has yet to be established.
I assume you believe, though, that CO2 concentrations did not drive past sea level changes, but that they primarily began to do so beginning in the 1950s, when human emissions began rising. If so, it’s rather interesting that the fastest rates of multi-decadal sea level rise in the modern era occurred prior to the 1950s, and that multi-decadal-scale sea level rise has decelerated overall since then (down to ~1.4 mm/yr between 1958-2014 per Frederiske et al., 2018) .
Holgate, 2007
http://onlinelibrary.wiley.com/doi/10.1029/2006GL028492/abstract
“The rate of sea level change was found to be larger in the early part of last century (2.03 ± 0.35 mm/yr 1904–1953), in comparison with the latter part (1.45 ± 0.34 mm/yr 1954–2003).”
For many regions of the globe, sea level is rising now. (Some regions have stable or falling sea levels.) But in the areas where sea levels are rising, it’s so insignificant that the land area above sea level, the world’s coasts, have nonetheless grown, expanded since the 1980s. Sea levels aren’t rising (or falling) significantly enough (at a rate of a paltry 0.14 of a meter per century between 1958-2014!) to keep up with the natural geophysical changes (subsidence, uplift) that do indeed drive relative sea level changes.
Donchyts et al., 2016
http://www.nature.com/nclimate/journal/v6/n9/full/nclimate3111.html
Earth’s surface water change over the past 30 years [1985-2015] “Earth’s surface gained 115,000 km2 of water and 173,000 km2 of land over the past 30 years, including 20,135 km2 of water and 33,700 km2 of land in coastal areas.”
Press release for the Donchyts et al. (2016) paper:
“We expected that the coast would start to retreat due to sea level rise, but the most surprising thing is that the coasts are growing all over the world,” said Dr Baart. “We’re were able to create more land than sea level rise was taking.”
Perhaps worth a read…
“sea level rise is not the primary factor controlling the shoreline changes”
http://notrickszone.com/2018/03/26/groundbreaking-new-paper-finds-global-warming-ice-melt-not-related-to-sea-level-rise/
You say that the issue is “whether sea level is rising now”. So what if it is if the tiny rate of rise that has occurred since the late 1950s (0.14 of a meter per century) has had so little effect on the Earth’s coasts relative to geophysical processes? The more salient question is: Is the land on the coasts rising or falling? On the U.S. Gulf coast, subsidence is an enormous problem. New Orleans is sinking into the sea. On the Alaskan coast, sea levels are plummeting at rates of -10 to -15 mm/yr due to land uplift. This is “what it means for us now”.
And as for detecting/measuring an anthropogenic signal, even in areas where sea levels are rising rapidly the anthropogenic fingerprint has not yet emerged from natural variability (i.e., noise).
Palanisamy, 2016
https://tel.archives-ouvertes.fr/tel-01317607/
“Building up on the relationship between thermocline and sea level in the tropical region, we show that most of the observed sea level spatial trend pattern in the tropical Pacific can be explained by the wind driven vertical thermocline movement. By performing detection and attribution study on sea level spatial trend patterns in the tropical Pacific and attempting to eliminate signal corresponding to the main internal climate mode, we further show that the remaining residual sea level trend pattern does not correspond to externally forced anthropogenic sea level signal. In addition, we also suggest that satellite altimetry measurement may not still be accurate enough to detect the anthropogenic signal in the 20-year tropical Pacific sea level trends.”
Hadi Bordbar et al., 2016
http://adsabs.harvard.edu/abs/2016EGUGA..18.3411H
“Here we address the question as to whether the recent decadal trends in the tropical Pacific atmosphere-ocean system are within the range of internal variability, as simulated in long unforced integrations of global climate models. We show that the recent trends are still within the range of long-term internal decadal variability.
Yes, a lot of uncertainty, but that spread is about regional differences primarily. Sea level rise and fall is relative to the region (see the U.S. Gulf Coast vs. Alaskan coast), not the globe, again to geophysical processes (primarily). In some areas, like around Bangladesh, sea levels were 4 or 5 meters higher than now about 5,000 years ago. Around the GBR Region, sea levels were 1-2 meters higher than now. That’s the primary reason for the 1 to 6 meters range stated.
Yes, Frederiske et al. (2018) point out that during the 56-year 1958-2014 period, when anthropogenic CO2 emissions exploded from about 1.5 Gt/yr (1958) to 10 Gt/yr (2014), sea levels rose by a rate of between 1.3 mm/yr and 1.5 mm/yr (hence the oft-stated 1.4 mm/yr or 0.14 of a meter/century). As pointed out above, this isn’t even close to a significant change relative to the geophysical changes affecting coastal expansion. And this 1958-2014 rise occurred at a lower rate than occurred during the first half of the 20th century, when anthropogenic CO2 emissions were largely stable and hovering around 1 Gt/yr. The post-1950s deceleration can be observed on the top right of this Jevrejeva et al. (2008) graph:
http://notrickszone.com/wp-content/uploads/2017/05/Sea-Level-Rise-Rates-1700-2003-Jevrejeva-2008.jpg
But, of course, Frederiske et al. (2018) get an acceleration by starting their acceleration trend at one of the lowest rate of rise of the 20th century (the late1950s) and ending in the recent decades. That’s how claims of alarming acceleration are generated: by selecting a low starting point and ending at a much higher point. If we looked at it from a longer-term perspective, conclusions about acceleration can be much different.
http://notrickszone.com/wp-content/uploads/2017/10/Lack-of-Sea-Level-Rise-Acceleration-Parker-Ollier-2017.jpg
“Since AGW is wedded to the claim that CO2 concentrations are primary determinants of trends in sea level rise and fall”
Not at all. In the paleo past, the big changes you refer to have been associated with the ending of glaciation events. No-one thinks that these were terminated by CO2.
The AGW proposition is that if you put CO2 in the air, it will cause warming, and consequent sea rise. That is all. There is no claim that every such event in the past was caused by CO2.
“And as for detecting/measuring an anthropogenic signal, even in areas where sea levels are rising rapidly”
But the claim here is that sea level change is indistinguishable from noise. Not that the attribution is uncertain. On that, you quote an unpublished student thesis (it’s not clear for what degree) and a paper about Tropical Pacific by Bordbar where it’s most unclear that the bolded part is referring to overall sea level at all.
No, the AGW proposition is that close to or more than 100% of the warming and consequent sea level rise since the 1950s has been caused by anthropogenic CO2 emissions. And yet the rate and magnitude of the rise during 1958-2014 — about 0.14 of a meter per century and just 3.1 inches overall (Frederiske et al., 2018) — doesn’t even come close to exceeding changes from the recent past (i.e., Hansen et al., 2016: There were “eight centennial sea-level oscillations of 0.5-1.1 m” during the last 4900 years.) Even the first half of the 20th century experienced faster change. We’re talking magnitude. And the magnitude and rate of change for the modern sea levels aren’t even detectable against background noise.
So if not every sea level rise event was caused by CO2 in the past, but some were, could you identify these CO2-caused sea level rise events? As shown above, the 14,700-14,500 event (+4 to 5 degrees C of NH warming in a few decades and the subsequent 3.5 – 6.5 m per century rise) had stationary CO2 levels throughout, so that wasn’t it. So which span of years could the CO2 change caused sea level rise? For that matter, considering CO2 has been rising since the Early Holocene, and sea levels have been oscillating centennially but falling over the long-term, there would appear to be an anti-correlation between sea level rise and CO2 rise. How would that be supportive of the claim that the more CO2 there is in the air, the more warming and the more sea level rise? Ocean heat content reconstructions reveal the same anti-correlation:
http://notrickszone.com/wp-content/uploads/2016/11/Holocene-CO2-and-Pacific-Ocean-Heat-Content-Rosenthal-2013.jpg
An anthropogenic fingerprint can’t even be clearly detected in 20-year tropical Pacific sea level trends (where sea level rise is pronounced). So why would it be so unusual to claim that the tiny modern changes (relative to the far-more-pronounced long-term magnitudes and rates of sea level change) are likewise “indistinguishable from noise”?
Palanisamy et al., 2015
http://iopscience.iop.org/article/10.1088/1748-9326/10/8/084024
“[B]y making use of 21 CMIP5 coupled climate models, we study the contribution of external forcing to the Pacific Ocean regional sea level variability over 1993–2013, and show that according to climate models, externally forced and thereby the anthropogenic sea level fingerprint on regional sea level trends in the tropical Pacific is still too small to be observable by satellite altimetry.”
“Furthermore, regressed CMIP5 MME-based sea level spatial trend pattern in the tropical Pacific over the altimetry period do not display any positive sea level trend values that are comparable to the altimetry based sea level signal after having removed the contribution of the decadal natural climate mode. This suggests that the residual positive trend pattern observed in the western tropical Pacific is not externally forced and thereby not anthropogenic in origin. In addition the amplitude of the sea level spatial trend pattern from regressed CMIP5 MME is low over the altimetry period in the tropical Pacific. This amplitude is significantly lower than the expected error in trend patterns from satellite altimetry (in the order of 2 mm yr-1 to 3 mm yr−1, Ablain et al 2015, Couhert et al 2015) and suggest that satellite altimetry measurement is still not accurate enough to detect the anthropogenic signal in the 20 year tropical Pacific sea level trends.”
Is that the noise that comes from CNN?
“This period, known as the “last deglaciation,” included episodes of abrupt climate change, such as the Bølling warming [~14.7–14.5 ka], when Northern Hemisphere temperatures increased by 4–5°C in just a few decades [Lea et al., 2003; Buizert et al., 2014],”
Until this is fully explained AWG is BS.
Once it is fully explained, I’m pretty sure AGW will still be BS.
LMFAO – me too!
classic!…….thank you John!
“70+ Papers: Sea Levels 2+ m Higher 9,000-4,000 Years Ago While CO2 Levels Were ‘Safe’ (265 ppm)”
Do any of them actually say that? He et al is quoted as saying “Northeast China, +2 m higher than present”, but the abstract seems to be talking about changes in relative sea levels caused by sedimentary changes, nothing to do with a drop in global sea levels.
I’m hardly an alarmist about climate change, but this post is unpersuasive because it does not address obvious rebuttals the other side would surely make.
Yes, according to the IPCC, 1901-2010 sea level rise rate was 1.7mm/yr. However, the IPCC also states that between 1993 and 2010, the rate “was very likely higher at 3.2 mm/yr.” While that could be a short-term fluctuation, it might also be the start of a long-term acceleration. At this point nobody knows which it is.
I also realize the 3.2mm/yr estimate is based on satellite data that conflicts with tide gauge data. That also requires a long discussion, because when it comes to global temperatures, we skeptics typically argue that satellites are more accurate than surface monitoring systems.
Yes, sea level rise was much more rapid in the Holocene optimum. But that’s to be expected given the greater levels solar insolation at the higher latitudes combined with the greater quantity of ice left over from the preceding glaciation.
In short, just because CO2 levels have been lower when sea levels were higher does not mean CO2 is not a greenhouse gas or that rising CO2 concentration cannot induce positive feedbacks that accelerate sea level rise beyond the 20th century rate.
Nothing says certainty like a phrase like “However, the IPCC also states that between 1993 and 2010, the rate “was very likely higher at 3.2 mm/yr.” “Very likely?” Do they know or don’t they? These reports sound like an exercise in creating phrases that sound like science but really aren’t.
“These reports sound like an exercise in creating phrases that sound like science but really aren’t.” Bingo! The intent is to advance a political agenda covered with a thin veneer of “science” which most people simply accept at face value. The decades long campaign to undermine public education, thus stripping the majority of people of the very tools they need to understand basic science and easily perceive political skullduggery is working quite nicely for the warministas. They can boldly and openly lie and people just accept it. Well, some people do.
The opposite. It is unscientific to claim to “know” anything.
If you don’t “know” anything why should anyone listen to you?
In the guidance for contributors to IPCC the term ‘very likely’ is used when there is a 90-100% of the outcome.
Phil.
In the real world of publication and politically-based funding applications from the bureaucrats, “very likely” means “We cannot prove it, but we want it to be true so we will extrapolate based on our worse-than-worst-case guesses.”
I also realize the 3.2mm/yr estimate is based on satellite data that conflicts with tide gauge data…
This isn’t true. Tide gauge data also indicate global SLR of 3+ mm/yr since 1993. Claims of a mismatch stem from inappropriate comparisons over different time periods e.g. comparing the altimeter trend since 1993 with the 20th Century tide gauge trend.
“I also realize the 3.2mm/yr estimate is based on satellite data that conflicts with tide gauge data. That also requires a long discussion, because when it comes to global temperatures, we skeptics typically argue that satellites are more accurate than surface monitoring systems.”
Sorry but no, that’s a mighty short discussion. There’s a huge difference in trying to measure choppy, flowing water (i.e., sea level) with sub-mm accuracy from satellites and measuring temperatures over a more extensive area and with less possibility of non-climate variables interfering with the observations. AND there’s a big difference between data that CONFLICTS with tide gauges vs. data that is CONFIRMED by weather balloon data.
Add to that the “inconvenient truth” that you have no empirical evidence that CO2 is the cause of the warming that supposedly is the cause of the rise in sea levels to BEGIN with, and the “other side’s” arguments don’t hold water. No pun intended.
Why don’t they all just admit that they can’t measure sea level to that degree of precision?
Exactly the same “quotient” of error for political measure. Almost like there is a ideological bias, hmmmmmm.
Said it before, will say it again. KR searches out all publidhed papers supporting his (correct, IMO) skeptical perspective, without doing any post peer review QC. This is self evident by actually going and reading some of his cited papers here. Selfevident problematic in comments is the Denmark bog SLR nonsense paper confounding GIA with SLR (true SLR must be preadjusted for vertical land motion, see guest post here “SLR, acceleration, and closure” for details.)
I gave up doing KR QC years ago. Read his stuff with interest, maybe try to cherry pick a few papers he spots to read that are surficially credible. But KR is uncritical IPCC level macrostudy tactics, with which I vigorously disagree. For explicit reasons, read several chapters of my The Arts of Truth ebook.
Ristvan, please define KR QC. Thanks.
Here is the text that I sent today to my new Department in Canada called Environment and Climate Change Canada.
“According to the Wikipedia website there are 800 billion tons of CO2 in our atmosphere with an input every year of (90 billion tons from the oceans, 9 billion tons from burning fossil fuels, 60 billion tons from microbial respiration and decomposition, and 60 billion tons from plant respiration) . The output every year is (90 billion tons from atmosphere to oceans, 120 billion tons from photosynthesis, 3 billion tons from agriculture, and 2 billion tons from mans activities that switch CO2 into the oceans. I dont know what that 2 billion tons represents exactly but since it is small I dont care. Since the total inputs is 219 and total outputs is 215 we have a net input of 4 billion tons which is what the Wikipedia site agrees with. Climate scientists say that the CO2 on average stays in the atmosphere for hundreds of years. They need that statistic to justify having a catastrophic turning point of global warming so that we wouldnt have enough time to cut back as soon as we saw the temperature accelerating. However a child in grade 6 can tell you that you cant have a 27% turnover to a reservoir per year and yet have the individual input to that reservoir remain in that reservoir for hundreds of years. At most the residence time can only be on the order of magnitude of 800 /219 = 3.65 years. Your climate arithmetic does not add up. I have uncovered 100’s of other discrepancies in your supposed climate science which I believe is a religion. “
Actually since 1750, 1.5 trillion tonnes of anthropogenic CO2 has been dumped into the atmosphere. http://cdiac.ess-dive.lbl.gov/ftp/ndp030/global.1751_2010.ems
As a non-condensing GHG, CO2 is persistent.
Using carbon isotope analysis the 40% increase in CO2 over the past 2.5 centuries can be directly attributed to the burning of fossil fuels. The current level of CO2 has not been observed for 3 million years.
OK…now throw away all the data before 1985 or so. It is useless.
And the pre-1985 data is useless because ….
More CO2 means more and healthier plant life. We need to increase our CO2 output, for the good of the planet!
At 550 ppm CO2 affects the nutritional quality of food crops.
https://www.nature.com/articles/nature13179
Higher levels of CO2 result in increased predation by pests.
https://www.ncbi.nlm.nih.gov/pubmed/18375762
Higher levels of CO2 affect human cognition.
ehp.niehs.nih.gov/15-10037
The 3 million year argument is silly. Over the past half billion years CO2 has averaged over 1000 ppm and been over 4000 ppm during an ice age.
The CO2 effect on plant growth is also well document and completely beneficial.
It is this kind of cherry picking that has proven that alarmists are not interested in science.
Our food crops evolved and were domesticated in an atmosphere that never exceeded 300 ppm CO2 for the past 800,000 years at least.
At 550 ppm CO2 affects the nutritional quality of food crops.
https://www.nature.com/articles/nature13179
Higher levels of CO2 result in increased predation by pests.
https://www.ncbi.nlm.nih.gov/pubmed/18375762
Richard M:
“The CO2 effect on plant growth is also well document and completely beneficial”
This oft-repeated idea is symptomatic of the over-confidence people have in their knowledge of a topic. The effect of increased CO2 in nature is very different from that in a greenhouse. It varies by species and environment, and can have a diverse array of effects on the environment in return, positive and negative, from nutrient cycling to regional climate. It’s impossible to know the net impact of all the effects, and it is folly to say they will be completely beneficial.
Another paper that shows that Nils-Axel Mörner has been right all along, by using observation and real data.
Here’s an interesting read I hadn’t seen before:
Technical Report NOS CO-OPS 053
SEA LEVEL VARIATIONS OF THE UNITED STATES 1854-2006
It seems to be where that NOAA statement:
comes from.
“Today’s Sea Level Change Indistinguishable From Noise”
Todays Anthropogenic Global Warming indistinguishable from noise.
All that catastrophic Caterwalling kind of noise.
The computer age and matching education system sure seems blind to the error of very precise nonsense.
Why would anyone put any stock in the musing of Kenneth Richard of NTZ?
https://tinyurl.com/ya9bgc9w
Here is the value of NTZ. It highlights papers that have come out recently. No one has time to sort out all the climate science papers that have been published, so this is one way of finding those papers.
It’s incumbent on the reader to sort out the significance of the findings. Some are of value, some are not. But it is a better source than the MSM which usually hyperventilates at the mention of AGW. Stopping at NTZ is just the first step. It leaves much more work to be done. Most warmists seem to allow themselves to be spoon fed the information that they want to believe without using any critical thinking skills they might have.
NTZ has documented reputation for misrepresenting science and and for using predatory journals. It is the last place I would look. The first place I look is the original published peer-reviewed science.
BTW – did you follow the link provided?
“Most warmists seem to allow themselves to be spoon fed the information that they want to believe without using any critical thinking skills they might have.”
The same could be said around here, could it not? How many readers do you think look at the literature?
The trouble with using a skeptic blog as a starting point is that you are still going to get a biased view of the literature. What’s more, reading the articles is not a harmless pursuit. The more you read an idea presented as fact, the more it seems to be one unless one is mindful of the alternatives. It can be little things that escape one’s vigilance, getting slowly absorbed by the mind. And prejudice is natural, it’s human. I’m prejudiced, and I’d hope knowing that it helps me be a little more understanding, but it’s not easy when comments like yours are so common. I don’t think deniers and skeptics are dumb, and there are many here who know more about climate than I. I think the political has gotten too mixed up with the science resulting in a partisan-based inability to bestow trust where trust is due or discuss the subject constructively.
Kristi Silber
Well, I’ve read some 1,200,000 replies on this web site, 800-900 “of the literature” articles, and few hundred books on various nuclear and particle physics and thermodynamic physics and related scientific and engineering topics, and now have been practicing 40 years of post-graduate “science” … How many have you read?
Why would anyone put any stock in anyone who puts a link to Sow Le Fou in his comment?
The link is to a Google search. There are plenty of other links for you to follow.
Meanwhile click on kenneth_richard in this post ( https://wattsupwiththat.com/2018/04/12/70-scientific-papers-say-todays-sea-level-change-indistinguishable-from-noise/#comment-2789410 )and see where it takes you.
How is it that marine charts, upon which peoples lives depend, show a datum correction for GPS and magnetic declination, but not for SLR?
Until marine charts show a SLR datum correction you can be 100% confident it is not significant.
The reason is simple. Water depth is everything. With a sea level rise shorter routes open up which are worth billion of dollars.
Eg. Malacca straits vs Java straits. 1500 mile savings if you are within the controlling depth. 10 meters under the keel. 1500 miles is a huge saving as it cuts 3 to 5 days off the passage.
A SLR datum correction of 1 foot would allow passage of vessels with 9.8 meters clearance. Currently they must take the more expensive route around Java.
Australia’s CSIRO agree-
“We have used a combination of historical tide-gauge data and satellite-altimeter data to estimate global averaged sea level change from 1880 to 2014. During this period, global-averaged sea level rose about 23 cm, with an average rate of rise of about 1.6 mm/yr over the 20th Century.”
But you can see that a global average like that hides some local variations like the 0.85mm average annual rise for Port Arthur in Tasmania between 1841 and 2000
http://www.cmar.csiro.au/sealevel/sl_hist_few_hundred.html
None of it seems to be murdering seaside real estate prices anywhere reasonably desirable in Australia
The 9 Metre Sea Level Scare charted. ?w=676
I think it’s interesting the way the conclusions of these 70+ papers about climate change in the Holocene are interpreted by many here. Most seem to compare the changes with what has happened so far. I, on the other hand, see this info and think, “Is this what is in store for us?” Looking at past climate oscillations, there often appears to be some “tipping point” that leads to a dramatic reversal in warming or cooling trends, leading to positive feedback mechanism(s) that results in rapid change. It seems to me likely that this has something to do with the interplay of the cryosphere with ocean mixing and currents. Because of the likelihood of a lag time between atmospheric warming and a potential tipping point such as Arctic sea ice melting enough to lead to a slowing or halt of the AMOC, it could be that we have not yet seen the full effect of current warming.
I picked up the latest issue of Scientific American in the airport yesterday, and a quick browse revealed that in the past 3 years, 12 Arctic records have been broken, such as SST and mass and extent of sea ice. It’s very hard for me to understand how skeptics can maintain that this is not significant or problematic.
“I picked up the latest issue of Scientific American in the airport yesterday, and a quick browse revealed that in the past 3 years, 12 Arctic records have been broken, such as SST and mass and extent of sea ice. It’s very hard for me to understand how skeptics can maintain that this is not significant or problematic.”
How long have we had thermometers or the satellite capability to measure these things? How does that stack up against the geological record? The answer is it’s so infinitesimal in the broad sweep of things that to think it’s important to us and what’s more that we mere mortals can change any of it is monumental hubris. I just don’t have that big an inflated opinion of myself and my capabilities and flatly refuse any such pretence. You can please yourself but I can only suggest pride cometh before the fall.
The silence on an ~16-18% expansion in forest cover over 35 yrs due to the greening of the planet is deafening. This fact is the only dramatic climate change from rising CO2 that can be unequivocally demonstrated, but it sits undisturbed as an elephant in the corner of their living rooms for good reason. Along with doubling of harvests, this enormous expansion of habitat confirms CO2 to be an overwhelming net benefit to the planet’s biosphere. Big Oil and coal, should there not be a big cheque in the mail with your names on it.
Moreover, the greening is exponential and, horrors, endothermic (cooling, its main effect coincided with the Pause contributing a little to it – a negative feedback?).
Most surprising of all, this elephant also sits in the sceptics living room! Whatever for? Take away the “cost of carbon” and this sick CO2 puppy is dead. Also SLR is even deader than it seems today. I’ve tried to analyze the greening phenomenon since it was reported in 2012 and have come up with (not updated):
1) 3 trillion trees on the planet
2) 420B new ones with half life of 15 yrs
3) Sequestered ~100Gt carbon over 35 years.
4) ‘Heat’ sequestered = that equivalent of 125% of that from burning 100Gt of anthracite.
I can’t even get sceptics to comment on the idea and we are showing that the outcome is really a “Garden of Eden Earth”. I guess I have to hope a historian will unearth the beginnings of this new dawning. Hey the mods even will likely throw this away!
CO2 is only temporarily sequestered by forests. When trees die, decompose and rot or burn they release the stored CO2. Canada’s forests are now net emitters of CO2.
http://www.nrcan.gc.ca/sites/www.nrcan.gc.ca/files/forest/sof2017/SOF2017_net_carbon_emissions_3_875px_e.jpg
See also – https://wattsupwiththat.com/2018/04/12/70-scientific-papers-say-todays-sea-level-change-indistinguishable-from-noise/#comment-2789334
New trees are largely growing around arid areas (like the Sahel inAfrica) with the lower demand for water resulting from higher CO2. Burgeoning crop harvests in North America are growing on much smaller acreage and surplus land is going to trees.
Yes forests (and add other plant growth and phytoplankton, etc.) eventually come into balance flattening the rising CO2 curve from emissions, net release looks to be well off in the future.
Historically, all but the grasslands and and deserts were forested. Europe and Noth America chopped its forests down to build ships and buildings, make potash fertilizer, and clear land for agriculture. With even lower CO2 in the atmosphere then supporting probably double what we have now, the ‘equilibrium’ is likely not for the next century or two.
Remember, climate science is highly politicized and scientists rely on dire futures to keep the grants coming. You will remember if you have been following this topic more than a decade the fuss caused by the 18yr pause in temperatures. It even caused an epidemic of depression among a number of scientists popularly known as the climate blues which was career ending for many.
Polar bears and penguins are back and as it turns out earlier low estimates of the former arose because of vigorous hunting. Temperatures forecasted in the early hype phase (I had no reason to doubt them back then) turned out to be 200% too high. We’ve passed a dozen tipping points including in 2002 UK Met office’s bemoaning that in a few years, children won’t know what snow is.
Last I heard Canada’s boreal forests are a major carbon sink. Here is a link on peat bogs/wetlands which cover huge tracts of northern Canada (I know from walking through and around countless bogs mapping geology for many years). This from a water fowl ecological site.
http://www.ehjv.ca/2017/02/17/canadas-peatlands-one-worlds-largest-carbon-sinks/
We can trade links forever and pick and choose what we want to hear. I studied paleoclimatology a long time ago before it was politicized and I try to choose literature generally acceptable to my critics and it usually isn’t gov’t sourced needless to say.
You heard wrong about Canada’s boreal forests.
“In 2015, total net emissions of carbon dioxide equivalent (CO2e) from Canada’s managed forest (see sidebar) were about 221 million tonnes (Mt).
Total net emissions are calculated by adding emissions/removals caused by human activities to emissions/removals caused by large-scale natural disturbances in Canada’s managed forest.
Human activities in Canada’s managed forest accounted for removals of about 26 Mt CO2e in 2015, while large scale natural disturbances accounted for emissions of about 247 Mt CO2e in 2015. In this way, the 247 Mt CO2e emissions minus the 26 Mt CO2e removals equals the 221 Mt CO2e net emissions.”
http://www.nrcan.gc.ca/forests/report/disturbance/16552
Peatlands are a CO2 sink and a CH4 source.
https://www.ncbi.nlm.nih.gov/pmc/articles/PMC5513236/
For someone who claims to have studied paeloclimatology, your knowledge of talking points that are dismissive of climate science is rather extensive.
Gary,
“We can trade links forever and pick and choose what we want to hear.”
Well, you can pick and choose what you want to hear, but I don’t – I try to consider all arguments that are backed up by evidence. I don’t believe many of the assertions you are wont to make – and why should I, if you pick and choose like you do? Besides, you rarely provide evidence and I know you make erroneous assumptions.
“New trees are largely growing around arid areas (like the Sahel in Africa)” This is at least partially in response to rainfall. I think you are attributing all the greening to increased CO2, when that is not a safe assumption.
“1) 3 trillion trees on the planet
2) 420B new ones with half life of 15 yrs
3) Sequestered ~100Gt carbon over 35 years.
4) ‘Heat’ sequestered = that equivalent of 125% of that from burning 100Gt of anthracite.”
I see. 3 trillion trees? How did you come up with that number? Depending on what you define as a “tree,” I bet you are off by an order of magnitude. What about the half life? You must have taken a wild guess on this one, too, but in any case it’s a meaningless number when it comes to CO2 sequestration.
What on Earth does this mean, Gary? It’s just a bunch of wild guesses!