From NASA Goddard:
Sea ice in the Arctic grew to its annual maximum extent last week, and joined 2015, 2016 and 2017 as the four lowest maximum extents on record, according to scientists at the NASA-supported National Snow and Ice Data Center (NSIDC) and NASA.
On March 17, the Arctic sea ice cover peaked at 5.59 million square miles (14.48 million square kilometers), making it the second lowest maximum on record, at about 23,200 square miles (60,000 square kilometers) larger than the record low maximum reached on March 7, 2017.
More significantly from a scientific perspective, the last four years reached nearly equally low maximum extents and continued the decades-long trend of diminishing sea ice in the Arctic. This year’s maximum extent was 448,000 square miles (1.16 million square kilometers) — an area larger than Texas and California combined – below the 1981 to 2010 average maximum extent.
Every year, the sea ice cover blanketing the Arctic Ocean and surrounding seas thickens and expands during the fall and winter, reaching its maximum yearly extent sometime between late February and early April. The ice then thins and shrinks during the spring and summer until it reaches its annual minimum extent in September. Arctic sea ice has been declining both during the growing and melting seasons in recent decades.
The decline of the Arctic sea ice cover has myriad effects, from changes in climate and weather patterns to impacts on the plants and animals dependent on the ice, and to the indigenous human communities that rely on them. The disappearing ice is also altering shipping routes, increasing coastal erosion and affecting ocean circulation.
“The Arctic sea ice cover continues to be in a decreasing trend and this is connected to the ongoing warming of the Arctic,” said Claire Parkinson, senior climate scientist at NASA’s Goddard Space Flight Center in Greenbelt, Maryland. “It’s a two-way street: the warming means less ice is going to form and more ice is going to melt, but also, because there’s less ice, less of the sun’s incident solar radiation is reflected off, and this contributes to the warming.”
The Arctic has gone through repeated warm episodes this winter, with temperatures climbing more than 40 degrees above average in some regions. The North Pole even experienced temperatures above the freezing point for a few days in February.

In mid-March, cooler temperatures and winds pushed out the edge of the sea ice pack and caused a late surge in ice growth that brought the maximum extent closer in line with the past few years.
In February, a large area of open water appeared in the sea ice cover north of Greenland, within the multiyear ice pack — the Arctic’s oldest and thickest ice. Most of the opening has refrozen but the new ice is expected to be thinner and more fragile, and a new opening might appear during the melt season. This could make the ice in this region more mobile and prone to exiting the Arctic this summer through either the Fram or Nares straits, ultimately melting in the warmer waters of the Atlantic Ocean.
“This old, thicker ice is what we expect to provide stability to the Arctic sea ice system, since we expect that ice not to be as vulnerable to melting out as thinner, younger ice,” said Alek Petty, a sea ice researcher at Goddard. “As ice in the Arctic becomes thinner and more mobile, it increases the likelihood for rapid ice loss in the summer.”
Despite the fact that this year’s melt season will begin with a low winter sea ice extent, this doesn’t necessarily mean that we will see another record low summertime extent.
“A lot will depend on what the wind and temperature conditions will be in the spring and summer,” Parkinson said.
Starting March 22, Operation IceBridge, NASA’s aerial survey of polar ice, is flying over the Arctic Ocean to map the distribution and thickness of sea ice. In the fall, NASA will launch a new satellite mission, the Ice, Cloud and Land Elevation Satellite-2 (ICESat-2), which will continuously monitor how sea ice thickness is changing across the Arctic.
For NSIDC’s analysis: http://nsidc.org/arcticseaicenews/2018/03/arctic-sea-ice-maximum-second-lowest/
But, they seem not to be paying attention to this:

A warmer start to the year (weather related) is now back to near normal. The Arctic ice looks like this now:

I just can’t get too worked up about a second lowest maximum extent.
from the link is this yawner….
“The decline of the Arctic sea ice cover has myriad effects, from changes in climate and weather patterns to impacts on the plants and animals dependent on the ice, and to the indigenous human communities that rely on them. The disappearing ice is also altering shipping routes, increasing coastal erosion and affecting ocean circulation.”
So what!
It has been far less ice for thousands of years in the early part of the Holocene, did the world go into a tailspin kill off millions then?
Grown tired of the spin these dishonest researchers bring up in recent years. They NEVER show the big picture (12,000 years), just a little wallet size one (35 years) is all they moan over.
Snicker.
it’s so warm in the arctic walrus are having to visit scotland to cool down https://stv.tv/news/north/1410707-walrus-spotted-enjoying-the-sun-on-highland-beach/ 😉
Of course the hole north of Greenland was caused by 50 Chinese and Russian Subs punching through the ice so they would have sufficient cubes for their drinkey parties
The US was there too:
https://www.strategypage.com/military_photos/20180313204950.aspx
BEAUFORT SEA (March 10, 2018) The Seawolf-class fast-attack submarine USS Connecticut (SSN 22) and the Los Angeles-class fast-attack submarine USS Hartford (SSN 768) break through the ice March 10, 2018, in support of Ice Exercise (ICEX) 2018. ICEX 2018 is a five-week exercise that allows the Navy to assess its operational readiness in the Arctic, increasing experience in the region, advance understanding of the Arctic environment, and continue to develop relationships with other services, allies and partner organizations. (U.S. Navy photo by Mass Communication 2nd Class Micheal H. Lee)
I’m not aware of any Chinese subs breaking through Arctic sea ice, but then I’m long gone from the submarine community.
It’s true! I have run several models in my bathtub to prove the Chinese have been there.
Well, models never lie, so I must be wrong. Yet again.
Jeez they can’t even see that this statement is blatant self-contradiction ?
Remaining nearly equal for four years means it is NOT continuing the decades long decline.
This page is black, just like all the other white pages in this book
How do they even keep a straight face ?
Question: Does anyone know what the correlation between Artic sea ice extent and Artic sea ice volume is? Is there a web site I can go to that contains information on both the Artic Sea Ice extent and the Artic sea ice volume that are based on two different measurements (i.e. one is not derived from the other)?
This is a good start …. others can tackle the relationship question http://ocean.dmi.dk/arctic/icethickness/thk.uk.php
Ice thickness is important and it has been growing since 2008. The winds push the ice around and pile it up. Once piled, it lasts through multiple summers. I believe this is the base from which Arctic ice extent will grow. The area is one factor and the average thickness across that area is the factor that gives volume. I believe area is fairly stable at a low level now and volume is growing, soon to be followed by growing area. The North is now getting colder.
All this, even with positive ocean oscillations dominating the NH (well, at least up to 2017).
I think there’d be some heat stored in the polar oceans, still to be released for a few years.
Packing of ice by winds is what makes these indices of ice cover poor indicators of reality.
John, it’s also notable that Arctic summers are not anomalously warm, only winters. If satellite data went back to 1940, would things look similar in the record somewhere between the and now? My gut says “bet on it”.
Stewart Pid & John harmsworth, Thanks for the information.
As far as I know they are both derived from sea ice concentration, which is the pixel value (0-250) that corresponds to the average microwave signal brightness for a given area (at least for the NSIDC).
It looks pretty icy to me and I can’t see many sea routes. Time to bring out the Ship of Fools again.
Interesting they didn’t mention volume, which, per DMI, is significantly greater than 2016 and 2017, indicating more ice, less spread out . Vs. their claim that wind pushed up the extent. I notice they also mentioned very high positive temperature anomalies in February, but not the recent plunge to below normal temps.
We’ll see where PIOMAS is by the end of the month, but there is a small possibility that the peak in extent has not been reached. MASIE has been bouncing around, so let’s wait a bit before declaring victory.
…and the second they start in on extent….you know to look at volume…..and visa versa
The north pole ice is much thicker 10 years later and with Greenland ice sheets that melt from the bottom because of volcanic ridges that extend all the way to Iceland and with the Antarctic ice sheet extent dead flat line practically for last 40 years both in maximum and minimum the Alarmists have absolutely no evidence to say that any of the 3 big ice sheets are doing anything other than natural variability.
THIS WHOLE GLOBAL WARMING IS THE BIGGEST HOAX EVER PERPERTATED ON MANKIND. Im so sick of this
You are correct.
But how do we combat this fraud?
“It’s a two-way street: the warming means less ice is going to form and more ice is going to melt, but also, because there’s less ice, less of the sun’s incident solar radiation is reflected off, and this contributes to the warming.” They like to keep repeating that myth, even though it’s been debunked countless times. It’s part of the “death spiral” fantasy.
Aren’t we in the warm phase of the Pacific Decadal Oscillation (PDO). Its a long twenty to thirty year cycle. Not including this in the analysis of sea ice extent leaves me wondering.
The AMO is the one in its warm phase and it had a few months last year with record highs. Since the N. Atlantic is pretty tightly connected to the Arctic through ocean currents that warm water will naturally affect the sea ice.
The AMO is likely to go into its negative phase in the next 5-8 years.
The only way ‘warmth’ can enter the Arctic in February is in the form of Water Vapour.
When Water Vapour arrives in a space where the temperature is MINUS 10˚C what happens to it?
Could this be where the Greenland Ice Mass Gain comes from?
…well that and the Atlantic current….but yeah, it’s the world’s largest lake effect snow….how else would it get it
Yup. This is the effect of the climatic change to the 30 year natural cycle of North Atlantic meridional gyre weather patterns associated with long term global cooling.
For example here is a meandering jet stream (time stamped 26Feb2018 1200Z) with a gyre elongated north-south sending snow onto the coast of east Greenland.
“I just can’t get too worked up about a second lowest maximum extent.”
Sounds like an alarmist talking about record lows. It’s just weather, eh?
Bruce, who has debunked it?
Latitude, does your graphic not say that volume is lower since 2014 than in the previous decade? I hate those changing graphics.
Just barely…but then around Jun/Jul it went a lot bigger
Yes, for four months of the year (mid-April through mid-August), more solar energy is absorbed by the exposed central Arctic Ocean (latitudes 70-90 north) if arctic sea ice is lost. The remaining 8 months of the year, enough additional heat is lost from the exposed arctic waters to make a year-long negative: Less arctic sea ice = more cooling of the newly exposed arctic ocean into the air and then into the infinite blackness of space.
More heat is lost all year round when he water isn’t covered by ice.
It’s just that for a couple of months, some of that lost heat is replaced by increased heat from the sun.
Why does NSIDC and DMI data disagree by almost 1 million sq miles in what the record low sea ice extent is?
http://ocean.dmi.dk/arctic/plots/icecover/icecover_current_new.png
http://nsidc.org/arcticseaicenews/charctic-interactive-sea-ice-graph/
NSIDC is notorious for doing a poor job with summer extent, even though they are supposedly the “standard”. They have a low resolution (fewer pixels) than most other sources, and their algorithms are often fooled by “melt pools” on the ice that they think are open water. The other differences have to do with how the various sources mask out coastlines and ice edges – makes winter and summer both somewhat unreliable and hard to compare. From NSIDC, I then to use MASIE, not this NSIDC main page graph.
Some folks prefer JAXA, another source of extent and other metrics. Personally, I prefer DMI, not sure why, but they seem to have less agenda than NSIDC.
Finally, the hilarious thing about NSIDC is that their own site says don’t trust their day to day numbers, just compare the monthly trends (because of the data issues), but then they declare a particular day the “peak”, and announce the extent to the nearest ten thousand square kilometers. Ridiculous, IMHO, given their pixel size is 25km by 25km (525 square km), that they are trying to determine is 15% covered with ice.
BTW, sorry to not clarify my graph references – the graph you posted is the DMI version – note that they are pretty close to NSIDC this year, with MASIE a bit higher at a peak of about 14.8 million km squared. Where they tend to deviate is summer, for the reasons given above.
Possibly because they make different assumptions and use different corrective algorithms on the raw data. I know that one agency gets the sea ice extent product (raw data that has undergone “quality control”) from the NSIDC, and then reverse engineers it to remove their assumptions and corrections to get to the raw data, and then applies their own assumptions and corrections. I can’t remember if that agency is DMI.
Denmark uses EUMETSAT as its data source. There is no need to reference US data at all. If the resolution is better, perhaps it is because Denmark has a vested interest in that ice blocking their shipping and fishing industries. Having that obstacle in your face for a good part of the year probably focuses yourr attention wonderfully.
NASA Goddard is making a big deal out of a lack of ice extent in one place: Bering Sea. Everywhere else is ordinary, with Barents and Okhotsk higher than usual. Since Bering melts our every summer anyway, why raise alarms about this? If the worry is about warm water into the Arctic through Bering Strait, the focus should be on the North Atlantic where 90% of the warm water comes in.
https://rclutz.wordpress.com/2018/03/23/arctic-ice-stays-put-mar-22/
Yes Ron, and it’s interesting to compare the central arctic “thickness” from DMI this year. Looks like you could nearly walk from Siberia to Canada on 3 meter ice – that’s certainly not been the case in previous years, and that, together with the lower extent causing the water to cool, may make for an interesting summer melt season.
BTW on that topic, I’m a bit surprised to see the acceleration of sea ice extent in the Antarctic this month – it’s taken off like a rocket, and is back in the 2SD range, after a very low summer there. Not only rapid gains, but early as well – will be interesting to see what the Max is this year, after several below normal extents in their winters.
Befote the
” warmers”” say told you so,, the artic is a mix of open sea, islands & strong wind.
Always look at the other end of the world for any indication that its getting warmer.
But even in ” recent ” historical times the atctic has been either open or much smaller.
Mjd
Ron C
Yes warmth in the Bering sea suggests that the warm imput to the Arctic from the Atlantic Gulf Stream, accumulated from all the high AMO years, is starting to flush out of the Arctic to the Pacific via the Bering sea. So this could be the last hold-out of residual AMO heat.
Every time a cold blast of Arctic air blasts into N. America or Europe, a warm blast of non-arctic air blasts into the polar region.
The somewhat lower than average arctic ice this winter is the result of the wobbling jet stream, not a warmer planet, which by the way has been cooling for two years.
The winter extent is not very meaningful, it’s the September minimum that matters.
That’s what we were being told a few years back when winter extents were high.
It’s -19° in Cambridge Bay. The Arctic says, “Don’t cry for me.”
The ocean cooling cycles are just getting started so it will be interesting to watch new NASA monitoring programs that are starting measurements from this point.
Arctic ice in the news.
Why don’t we talk about desertification and the snow on Kilimanjaro and the Antarctic ice cap? They used to be all the rage.
Except the Antarctic ice cap.
It’s almost as though this is the last canary still showing signs of malaise.
A one off isn’t just cherry-picking.
It’s meaningless.
Anthony,
Here is a Google translated link to the FMI webpage that shows a movie of the Arctic Now Snow and Sea ice with the open water polynya north of Greenland on 25th February 2018.
h/t Timo V
The local wind pattern at the time was a southerly near gale (31 kn) driving the sea ice north away from the coast as shown on Earth nullschool for 24 Feb 2018.
Meanwhile, the Antarctic extent has recently advanced to within 2 SDI of the mean for this day. Time will tell if this is a fluke.
Long range Antarctic forecast extremely cold. Sea ice should return to historic mean, as highs will be -20 deg. F.
https://www.timeanddate.com/weather/antarctica/south-pole/ext
For six months a year open water is negative feedback, as the exposed water radiates heat to space, and reduces the heat content of the oceans. For six months it is positive feedback as the sun’s rays warm the open water. Sounds like a method of maintaining the heat content of the Arctic Ocean, within a narrow band by radiating more when it is warmer than average, and retaining heat with an insulating ice layer when it is colder than average. How come we only hear about one side of this process?
Given the angle of incidence, it’s a tossup as to whether or not the Arctic Ocean is actually warming to a significant extent during the summer.
No, when you look at an 24 hour, day-by-day comparison of every day of the year, the four months of mid-April to mid-August DO show a net heat gain for the Arctic Ocean. (This is in large part (but not all!) due to the large ratio of diffuse radiation to direct (beam) radiation that far north: The diffuse radiation does not have an “angle-of-incidence” albedo change as the solar elevation angle changes each hour.
Offsetting this increased absorption of the solar energy by the water is the very large amount of solar energy absorbed by the very “dirty” low-albedo average arctic sea ice in late June, all of July, and early August. Dr Curry’s team measured mid-summer arctic sea ice with daily albedoes as low as 0.39 in late July, and an average day-to-day average of less of than 0.46. The difference in energy is not all that much as you would expect.
@RACookePE1978;
Do you have any numbers to go along with that? How does it compare to the equator during the same season, for example?
Yes, I will develop that comparison separately – It will take several articles to explain/justify each number of the comparison though.
Trebberth’s “average flat earth” model that receives 342 watts/m^2 averaged a 24 hour day averaged over the entire year, for example, is actually pretty close. For the latitudes between 25 north and 56 north. (But that is where his audience in the capitols of Washington, UK, Paris, BRUSSELS, Rome, Berlin, and so on lives!) But between 25 south and 56 south, his average earth albedo is woefully inaccurate – there is almost no land down there, and the open ocean DOES have an average albedo of 0.066 as conventional wisdom holds. So his assumed “whole earth” albedo of 0.15 is not right.
Up north, there is relatively little sea area, no sea ice at all, and the approximation holds modestly well.
Even further south, at Antarctica’s sea ice maximum, the Antarctic land ice + the fixed shelf ice around Antarctica + the sea ice = an area larger than all other land areas south of the Equator. Combined.
To illustrate: Right now, just after the spring equinox, the Antarctic sea ice is recovering from its annual minimum, and the northern edge of the Antarctic ice is beginning to expand north from its -68.0 south latitude. The northern sea ice is at its annual spring maximum, and has expanded down to 70.9 north latitude.
All regions of the earth receive 12 hours of sunlight, the radiation received at top-of-atmosphere (TOA) is 1371 watts/m^2 (close to its yearly average value of 1362 watts/m^2), both northern and southern sea ice are at approximately the same latitude, and both arctci and antarctic sea ice are “clean” and at their yearly maximum albedo. You’d think that – if any single day of the year were to “be average” it would be the spring equinox. Yet the north and south sea ice receive much less in those twelve hours than anywhere in the tropics or temperate zones.
To illustrate this point, use Trenberth’s 1997 Flat Earth values.
Date = Every day, Latitude = All
TOA = 1368/4 = 342 Watts/m^2 avg
342 TOA – 77 (reflected by clouds) – 67 (absorbed by atmosphere) = 198 available radiation on ground
or, looking at the other part of the diagram,
30 watts/m^2 reflected by average surface
+168 watts/m^2 absorbed by average surface
198 watts/m^2 total reached ground (Horizontal Irradiation)
Now, look at the real world.
Beam Direct Horizontal Irradiation (ignore diffuse for now), atmosphere transmittal = 0.805, clear skies
March 22, DOY = 81,
TOA = 1371 watts/m^2 (close to Trenberth’s average of 1368 watts/m^2)
12 hours darkness (every latitude), 12 hours sunlight. (Matches Trenberth’s 1/4 sphere surface = disk area averaging)
BHI = Beam (Direct) Horizontal Irradiation. (Watt-Hrs.)
Clearly, Trenberth’s Flat Earth average values are correct. For latitude = 45, for the spring and fall equinox days.
His approximation fails under any other circumstance.
Now, look at sea ice.
Now, the Antarctic sea ice minimum actually averages 22 February (DOY = 53), but it has not expanded very much by March 22 (DOY = 81). On March 22 per Cryosphere’s original sea ice area reports, Arctic sea ice area = 13.968 Mkm^2.
The southern edge of a cap of that much sea ice centered on the north pole is 70.9 latitude.
On March 22, Cryosphere original Antarctic sea ice average area = 2.832 Mkm^2.
The northern edge of its sea ice averages -68.0 latitude.
March 22, DOY = 81,
(Arctic and Antarctic are very close, at least in March)
(At the September Arctic sea ice minimum, only 616 watt-hrs even strike the Arctic ice. And that is the HIGHEST radiation level for all of the Arctic, totaled for the entire day. What is absorbed into the exposed ocean at that latitude is even less, and the difference between the amount of radiation absorbed in the ocean and in the sea ice is less than half of that: 306 watt-hrs over the 24 hour day (17 watts/m^2 each hour averaged)
What exactly is catastrophic, or even slightly bad, about a slightly less fatally frigid Arctic wasteland?
Do we really think that the colder and icier up there, the better?
Are they insane?
Dunno about insane. But, yes, LESS sea ice is desirable.
How much ‘heat energy’ kilojoules is required to melt that amount of ice? I suspect that the heat in the atmosphere is insufficient as it is subzero and very low humidity. So the heat must be coming from ocean currents the ice free warm ocean is therefore radiating huge amounts of energy to space. The Earth will be cooler as a result.
What l think is more important in the Arctic and its link with climate change. Has to do with the amount of warm air been pushed into the Arctic and the cold air been flushed out. lts this increased movement of air in and out of the Arctic for me is of greater importance then sea ice extent.
Because if this flushing of cold air out of the Arctic extends into the spring. Then that can lead to a real climate changer. The extending of the spring snow extent.
If you follow Joe Bastardi at Weatherbell.com you will find that this year has many analogous counterparts in the meteorological record. they were not beginnings of a trend, but do follow the same patterns as other highly analog years.
I would hazard a not so wild guess that these changes are climate shift related in action. Earthnullschool allows us to watch ongoing climate shifts in weather patterns over time, imo. The other pole is of greater import though. Watch the changes on the south over the next several years, mainly in changes to sst and ssta.
goldminor
Now the warm air push into the Arctic that l forecast has now arrived, l think it will show why l think its so important. Because notice the areas where it ends up flushing cold air and the risk of snow in the NH, and then notice how closely these areas match up with where it got coldest during the ice age.
“But, they seem not to be paying attention to this:”
Correct. Air temperature does not drive early melt season. They are correct to ignore that and focus on what they do focus on: Export. The thinner ice is now more mobile, more easily exported via the Fram and Nares and even the CAA. During the early season guess what factors matter most?
Exporting to cool the lower latitudes ?
What thinner ice Mosher? Are you ignoring data? As usual,
No he is not.
Thick ice is more apt to block the outlets he mentioned.
Thin ice is more easily broken and moved — south to melt in warmer water.
I think it was 2007 when this was recorded by satellite Images and put into animation.
You can look it up.
The DMI chart for temp had a big swing of some 10 K. Up and recently down. An experienced financial researcher would say that it was very “overbought” on the spike up. And became very “oversold” at a seasonal low.
100% confident it will rise to a seasonal high in the summer.
Oh, that was a taxing decision. Time for an early Friday evening drink.
🙂
If the Arctic ice was a perfect circle, then the maximum ice extent of 5.59M sq mi for 2018 would mean this circle has a radius of 1,334 miles. Add to the 2018 area 448,000 sq mi to obtain the 1981-2010 average area of 6.038M sq mi and now this circle would have a radius of 1,386 mi. So, the difference is an annulus of ice that is 52 mi wide (52.4 mi). This is 3.8% of the 1981-2010 average radius. If I recall correctly, this is the 15% ice extent area. I would like to know what is happening with the 30% ice extent area. Is that reported anywhere now?
30 % extent used to be reported by DMI, along with 15%, I found it useful to try to see if extent was being driven by a lot of scattered ice ( in the case where 30% was much smaller than 15%, or ice is relatively compacted, in the case where the measures are close. Sadly, they no longer offer that choice, at least not that I can find. Maybe other readers can suggest a source.
I haven’t tried this, so I can’t tell you if it works, but it looks like you can calculate any % sea ice extent yourself using NSIDC images and ImageJ software package.
Here’s instructions – https://serc.carleton.edu/files/usingdata/accessdata/workshop07/using_raw_si_data.doc
No, you need to use the 3D (beanie cap) spherical shape, not a circle.
I’d lay 50-50 that the maximum hasn’t yet been reached with the Arctic currently so cold with potential ice growth in far Northerly places.
Imteresting but not very ifnformative discussion of a few aspects of Arctic warning. What stands out is complete absence of any reference to my paper in 2011 that explains it all. Its title is “Arctic warming is not greenhouse warming.” To hear a true believer say that probably means instant excommunication from his source of public funds that pay his salary. Along with that fact I also notice a total avoidance of claims that Arctic warning has anything to do with the greenhouse effect, like they used to do before I wrote the paper. I would like to encourage those who have obviously read it to bring out some facts their readers are kept ignorant of. For example, fact is that for 2000 years before the start of Arctic warming there was nothing there but slow, steady cooling. And the fact that Arctic warming started at the beginning of the twentieth century when a rearrangement of north Atlantic flow systems took place. And the fact that the initial warming fluctuated and did not become a steafy warning until the late seventies. And the fact that those studying it got started in the late seventies and don’t have clue abut the previous 200 tears of Arctic history, Or the important fact that Arctic warming is caused by redirection of the Gulf Stream by the rearrangement if the north Atlantic current system to deliver more warm water into the Arctic Ocean. That’s enough. Read it and teach yourself some Arctic science.
“The decline of the Arctic sea ice cover has myriad effects, from changes in climate and weather patterns to impacts on the plants and animals dependent on the ice, …”
Hasn’t Crockford’s diminishitique taken most of the air out of this puffed-up concern?
For “diminishitique” read “critique”
Roger Knights
March 23, 2018 at 7:11 pm
Oh, I thought diminish worked quite well….
Ice, or lack thereof, observers might be interested in this. Shocking.
“On February 16, 2018 Vox.com published an article by Brian Resnick on a shocking record-breaking decline in Arctic sea ice during the last 1500 years (see above graphic).”
From http://lacoastpost.com/blog/?p=54731 “What will it take to shake the GOP disbelief in climate change?”
Graphic not up to date. This is a biologist who did good research, but may have been too long in state government. He does have some handles on problems. In 1899 Mississippi River ice made it to the Gulf. Any prognostications?
I’m getting insecure warnings on WUWT recent posts. Had an obvious scam that may have come through Science link.
It all depends how you look at graphs:
14.48 Wadhams, aka million square kilometers
When it is down to 13.5 msk, wake me.
Fascinating how the perspective changes when you ‘zoom out’. Things lose their immensity when compared to something bigger.
Kind of like how CO2 is dwarfed by H2O in the troposphere.
Why do not they map it using aerial photography and then correlate with the satellite readings and some fixed survey stations?
I believe that the Arctic is cloud-covered about 90% of the time in the winter. It would be very difficult if not impossible to do comprehensive aerial surveys.
It’s always dark, too. Rather complicates a simple approach.
Why don’t they map it using aerial photography and then correlate with the satellite readings and some fixed survey stations?
Why don’t we simply forget all about it. We’re questioning a propaganda machine posing as a “scientific consensus”. And while we discuss in detail all their outright bizare claims they screw us over ten fold.
A total waste of time and effort. Recycling claims and arguments really isn’t very helpful.
That is one of the many things that Dr Curry-Dr Perovich did during their 1997-1998 SHEBA over-winter expedition – used aerial surveys from C-130 flights and satellite surveys to compare with what the people on the ice were looking at. Couple of other expeditions since then have done it too.
But if we look at winter snow extent, it has been increasing for decades.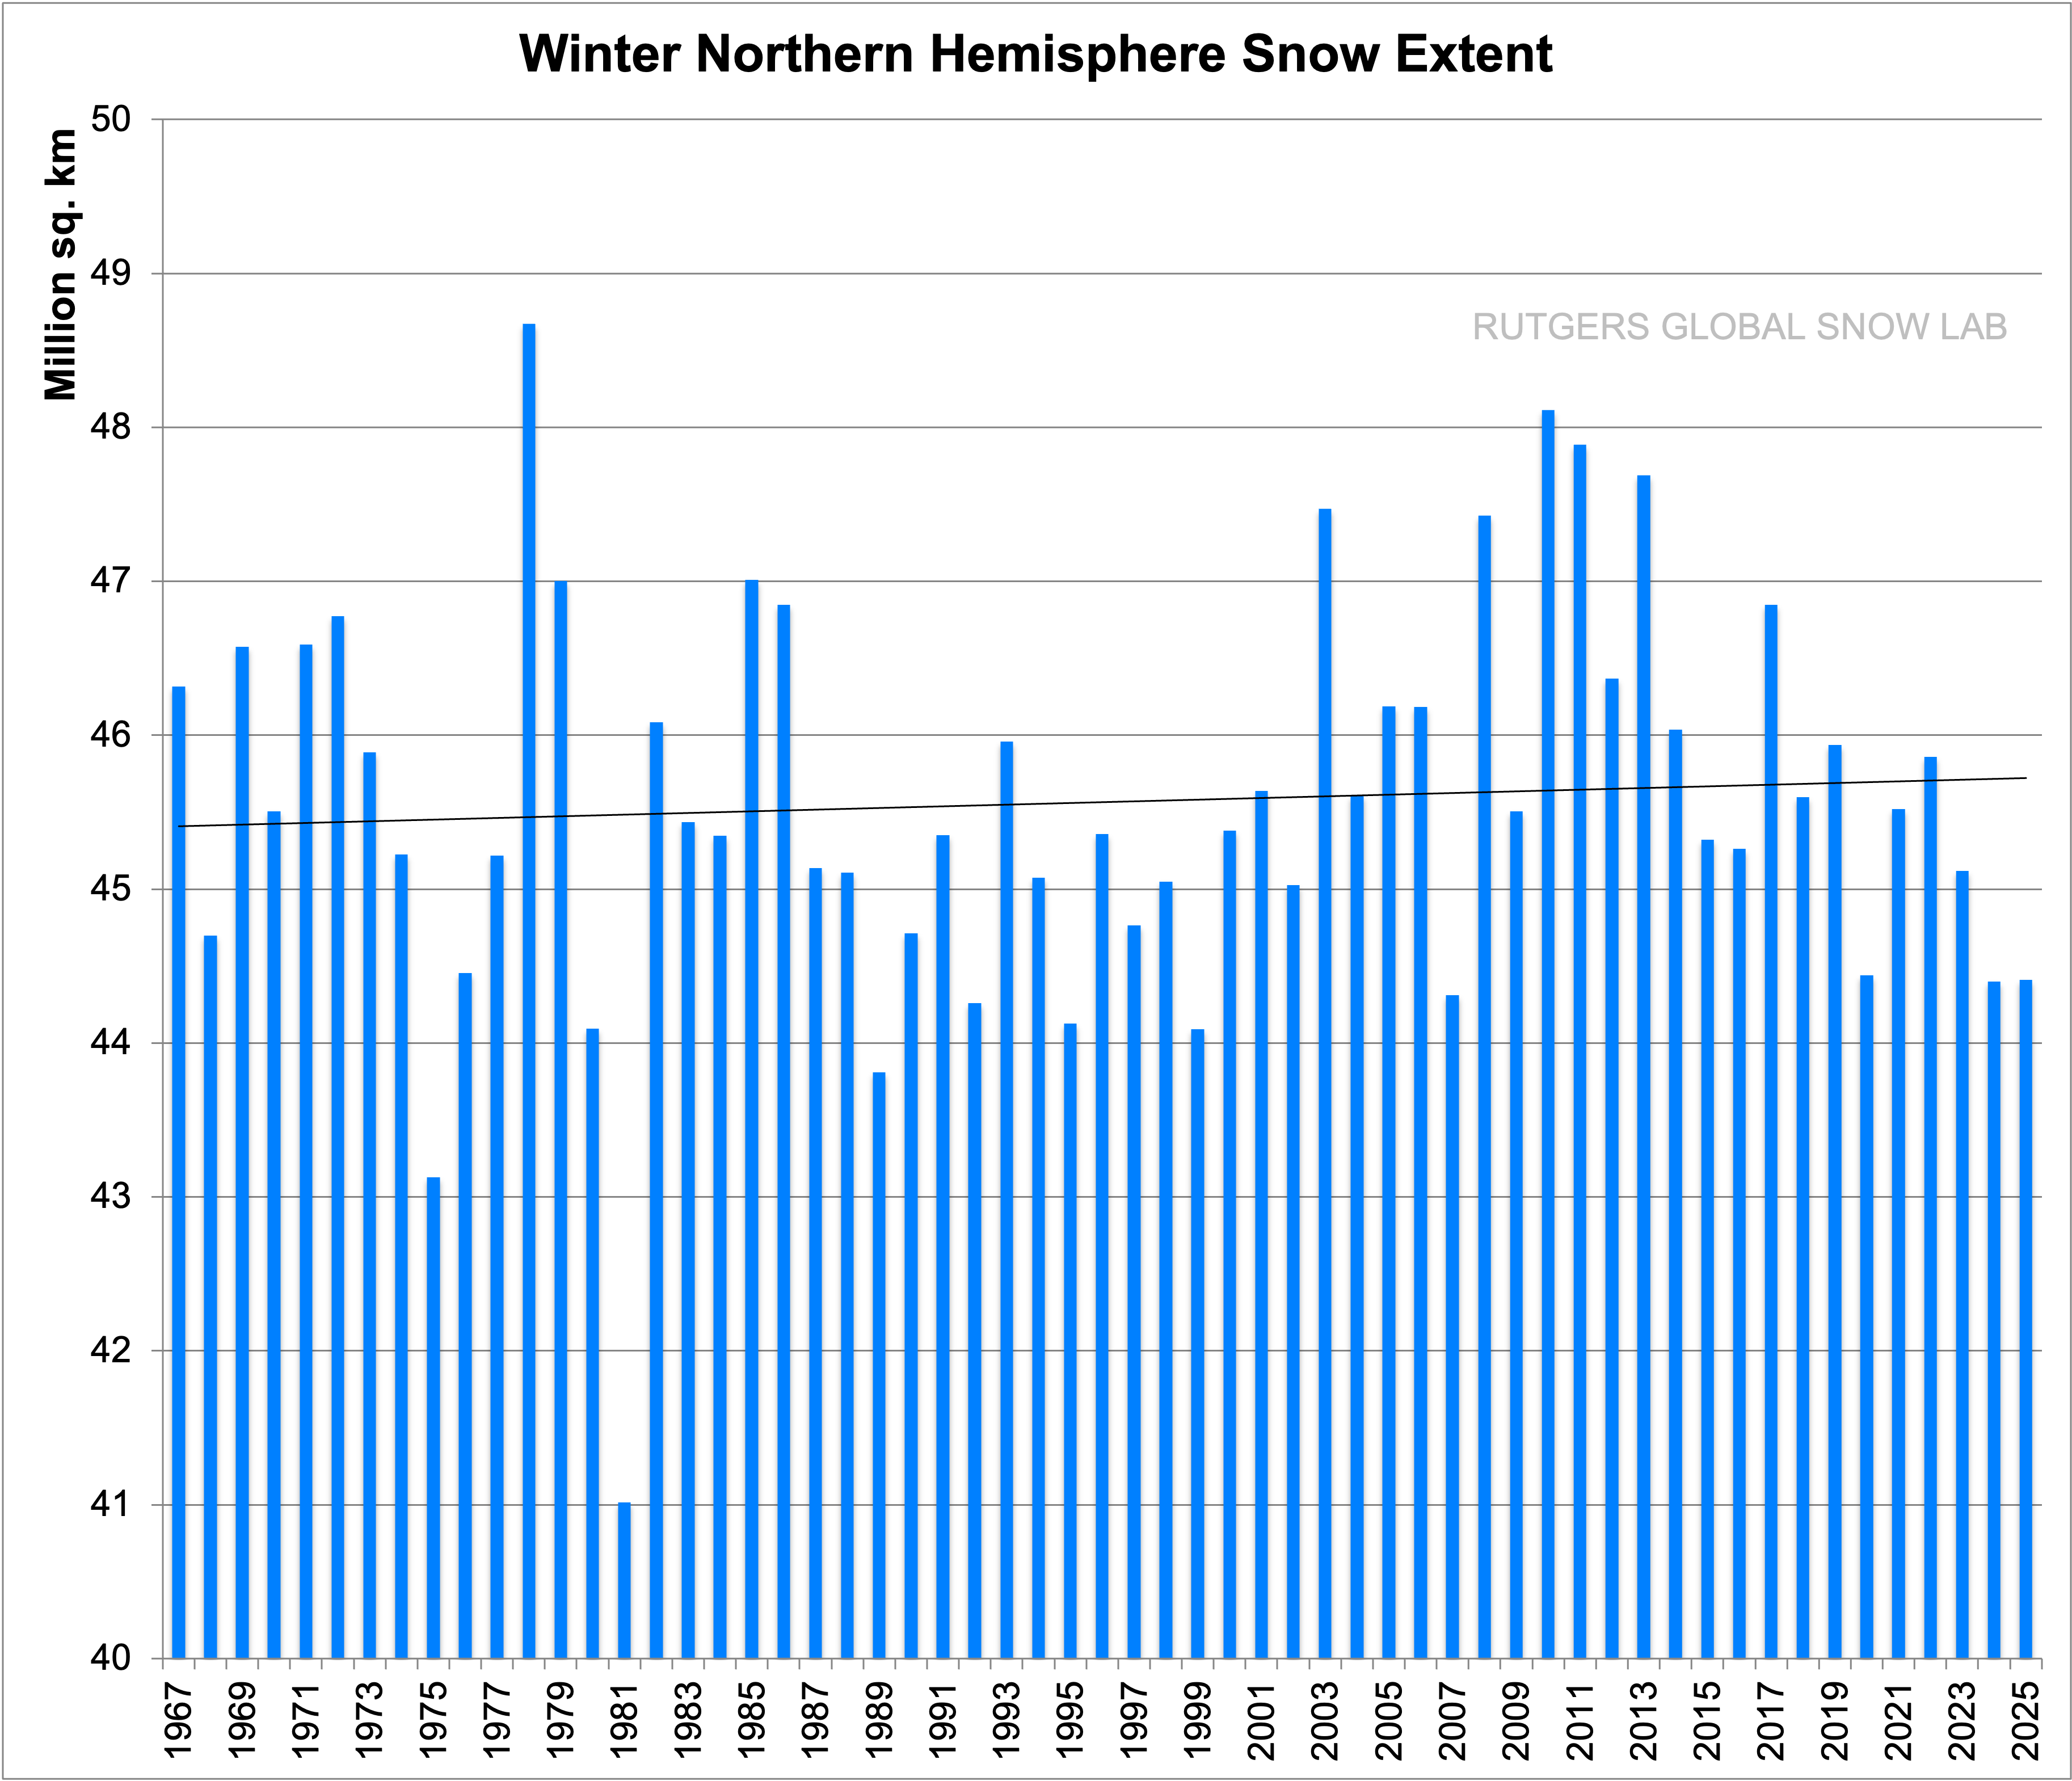
Conversely, NH spring extent has been decreasing for years. There may be a correlation here, with albedo playing its part in warming, and with Arctic ice-sheet melt. The early spring snow-melt lowers the albedo and allows much more insolation absoption and warming across Canada and Siberia, assisting in the melt of the Arctic ice sheets.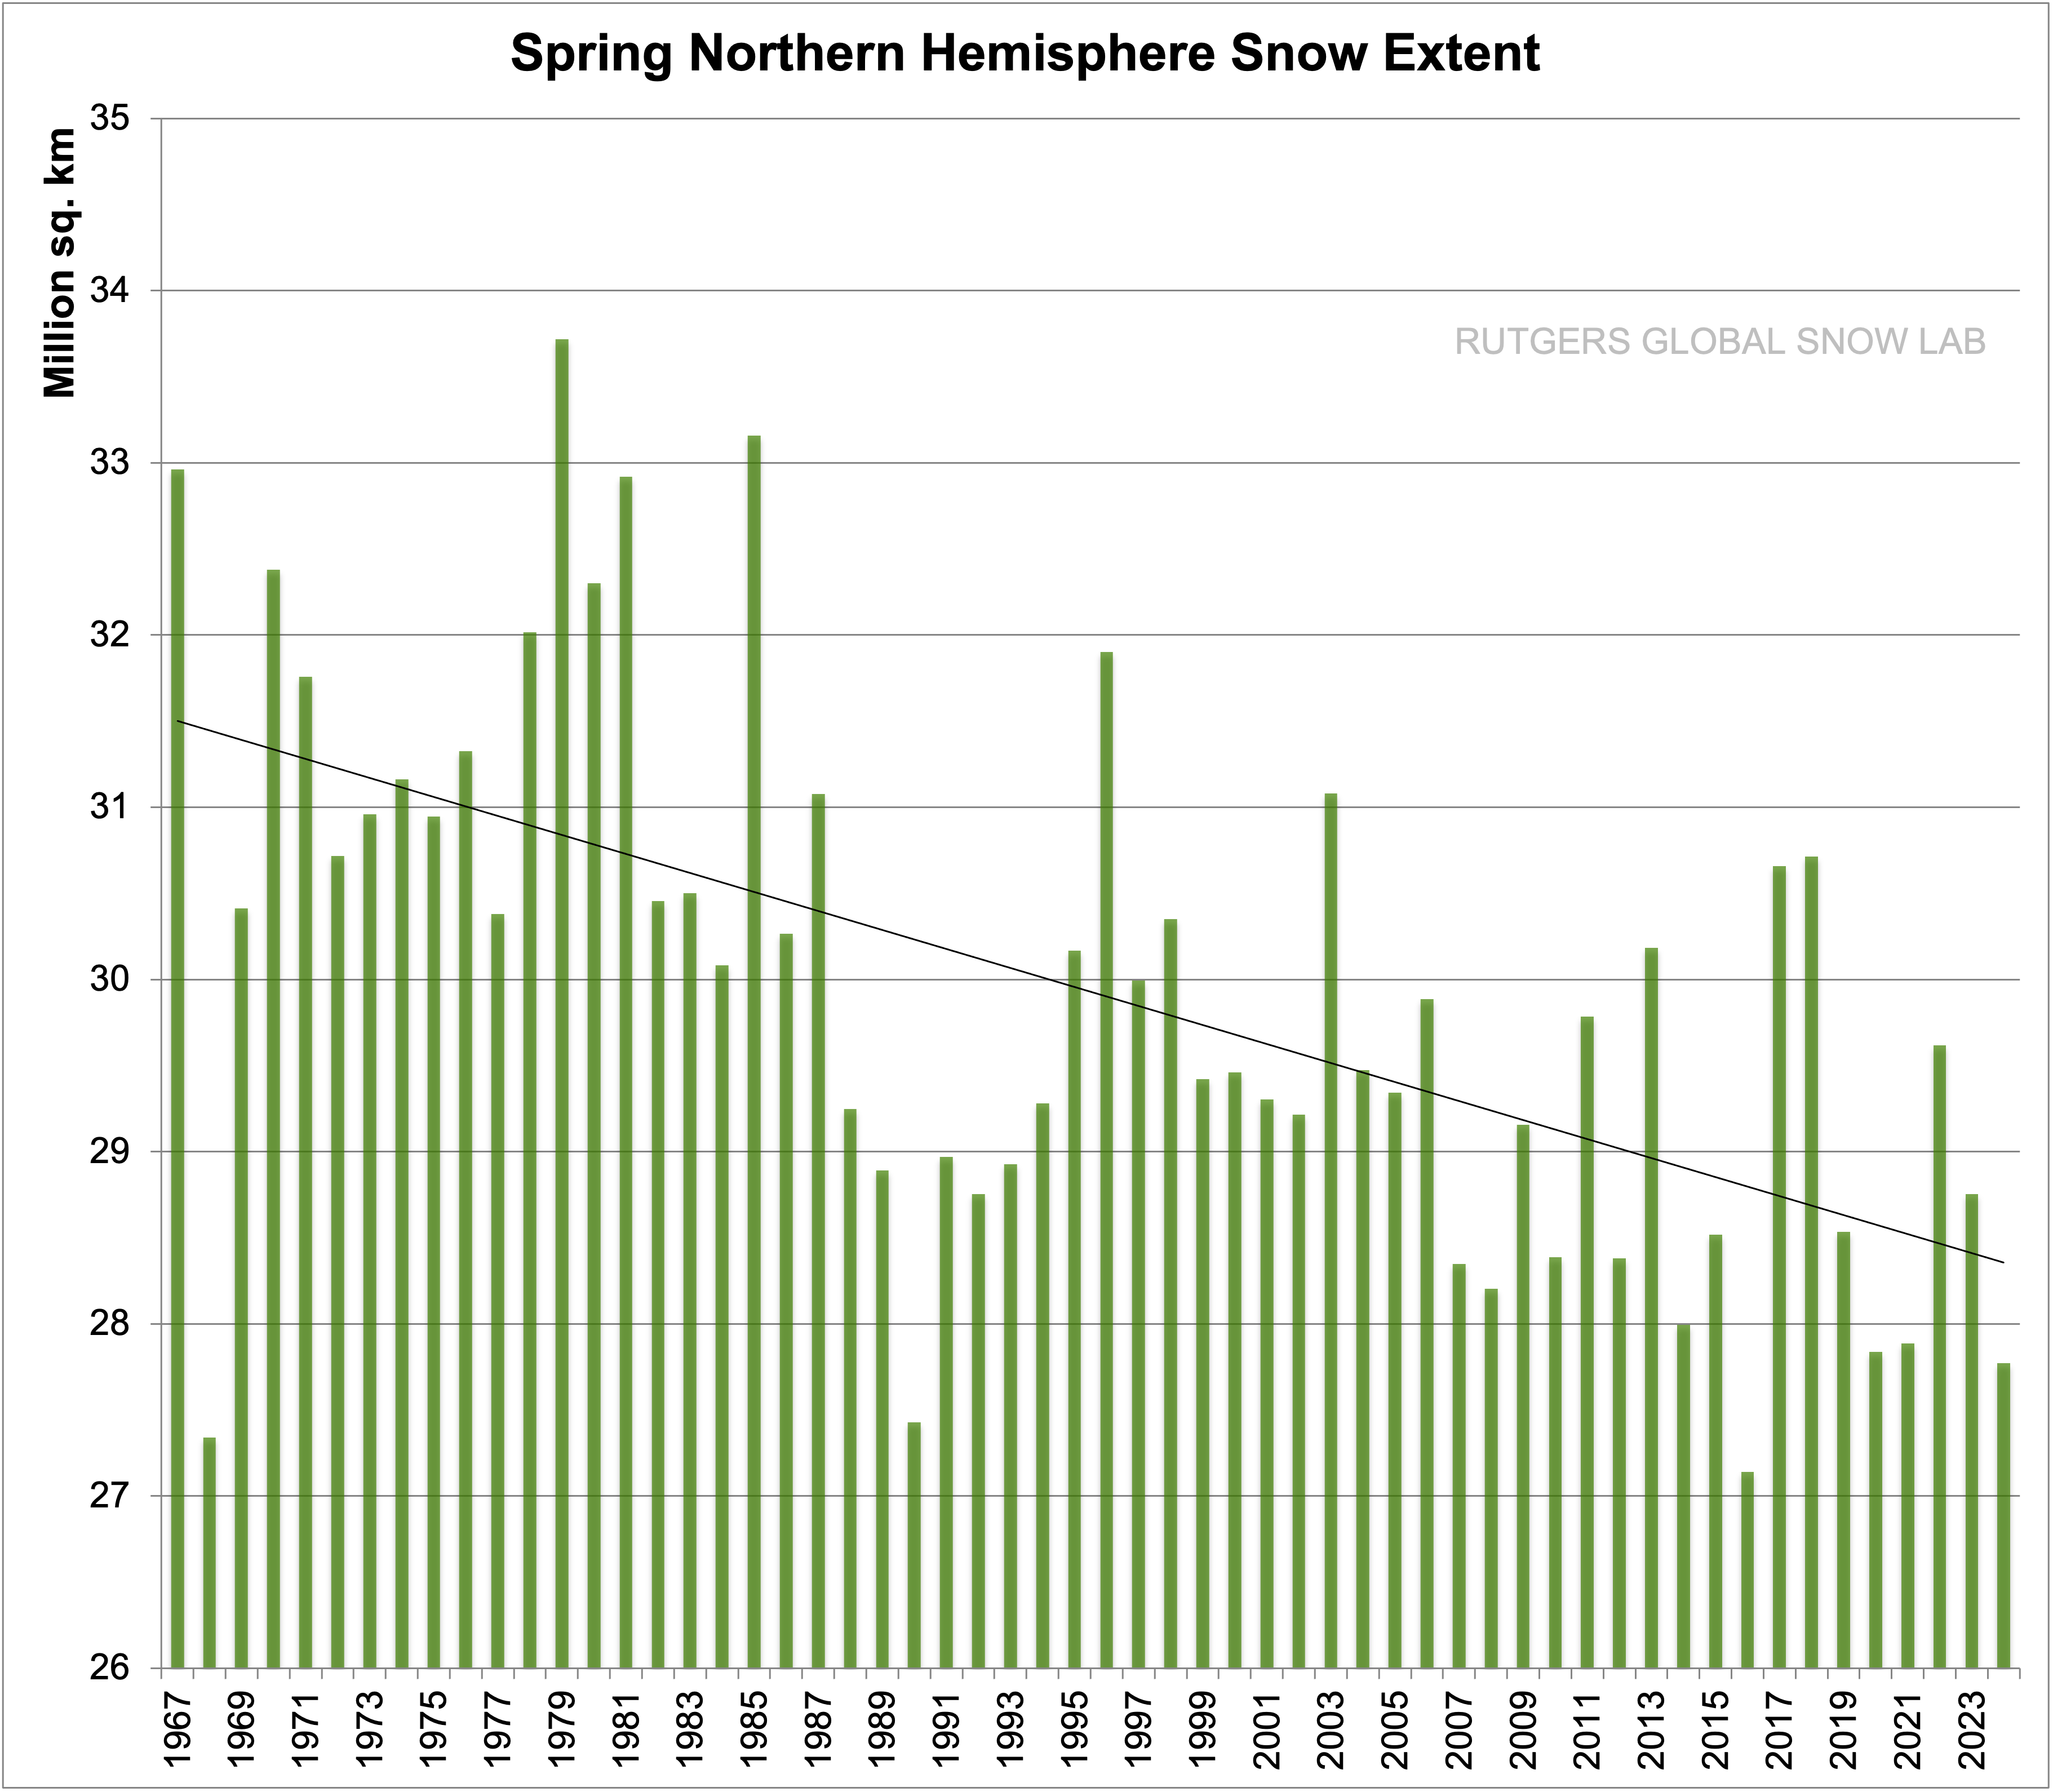
If so, the later spring snow melts of 2017 and 2018 may increase NH albedo, reflect away the spring insolation, and reduce the ice sheet melt. It is as good a theory as any….
Anyone who can’t find the major El Nino events on those graphs, I feel sorry for you, but the latest rebound is way more like 1969 than is is like 1991. If 2018 looks like 1970, we may consider a repeat of that cycle could be occurring. The AMO will have to drop more and get cooperation from the PDO and southern oscillations, but somebody needs to tell the Goracle that snow is not going away anytime soon.
The maximum arctic sea ice extent this year is no different than it was in 1974 (14.4 million square kilometers according to JOURNAL OF GEOPHYSICAL RESEARCH, VOL. 94, NO. C10, PAGES 14,499-14,523, OCTOBER 15, 1989).
Based on the historical record, this is exactly what one would expect. There is a natural, approximately 70 year, cycle to the arctic ice coverage, as obvious from the 100 years or so of Danish records of monthly Arctic sea ice extent. The late 30’s/early 40’s is a known time of peak warmth, and this period coincided with the first vessel passage through the Canadian Northwest Passage (the RCMP wooden vessel St Rock – using no modern navigational aids). Then 70 years later – now – we end up with diminished ice coverage again. However, in between, we had heavy ice conditions, especially from the mid 70’s to mid 80’s, as those working on Arctic offshore oil exploration through that time, can attest.
This paper reports a paleo proxy in the Arctic which shows that, with the exception of the LIA, Arctic sea ice extent is currently the highest that it has been in the entire Holocene.
https://onlinelibrary.wiley.com/doi/pdf/10.1002/jqs.2929
“Death spiral” is thus a very poor characterisation of current oscillating Arctic sea ice extent.
It makes good sense that temperatures in the Arctic should be elevated if the mechanism I proposed in https://wattsupwiththat.com/2015/12/22/volcanoes-and-ozone-their-interactive-effect-on-climate-change/
is correct, since the maximum effect of ozone layer depletion has been shown to occur in the polar regions (e.g., the well-known Antarctic ozone hole.)