Before we get to my geological perspective of the Greenland Ice Sheet (GrIS), let’s first have a look at the NASA perspective:
Greenland Ice Loss 2002-2016
The mass of the Greenland ice sheet has rapidly declined in the last several years due to surface melting and iceberg calving. Research based on observations from the NASA/German Aerospace Center’s twin Gravity Recovery and Climate Experiment (GRACE) satellites indicates that between 2002 and 2016, Greenland shed approximately 280 gigatons of ice per year, causing global sea level to rise by 0.03 inches (0.8 millimeters) per year. These images, created from GRACE data, show changes in Greenland ice mass since 2002. Orange and red shades indicate areas that lost ice mass, while light blue shades indicate areas that gained ice mass. White indicates areas where there has been very little or no change in ice mass since 2002. In general, higher-elevation areas near the center of Greenland experienced little to no change, while lower-elevation and coastal areas experienced up to 13.1 feet (4 meters) of ice mass loss (expressed in equivalent-water-height; dark red) over a 14-year period. The largest mass decreases of up to 11.8 inches (30 centimeters (equivalent-water-height) per year occurred along the West Greenland coast. The average flow lines (grey; created from satellite radar interferometry) of Greenland’s ice converge into the locations of prominent outlet glaciers, and coincide with areas of high mass loss.
However, the rate of ice loss has more than doubled in less than a decade. The rate of ice loss over the 2008 to 2009 period was 286 gigatonnes per year.
Wait a second! Manhattan-sized icebergs don’t look very big compared to the GrIS. Did you ever wonder why melting ice and calving icebergs are always compared to Olympic-sized swimming pools, Empire State Building-enclosing ice cubes, Manhattan Islands and Grand Duchies of Luxembourg? Why aren’t these catastrophic events ever compared to the size of the GrIS itself? Could it be that they don’t appear very catastrophic, or even anomalous, when compared to the GrIS?
How Big is the Greenland Ice Sheet?
According to U.S. Geological Survey Professional Paper 1386–A (2012), the volume of the GrIS is 2,600,000 km3. The USGS cites a 1954 reference for this number and also cites Bamber et al., 2011, which puts the volume at 2,900,000 km3. Bamber has subsequently upped his estimate to 2,960,000 km3. This is funny. Either the GrIS added 360,000 km3 of ice from 1954-2013 at a time when NASA said the GrIS was losing 4,089 km3 or the uncertainty of the volume of the GrIS is about 1,000 times the annual ice loss that is asserted with such precision by Amazing GRACE.
How Does the Recent Ice Loss Compare to the Volume of the Greenland Ice Sheet?
According to Kjeldsen et al., 2015, the GrIS lost over 9,900 km3 of ice from 1900-2010 and an article in The Economist asserted that the GrIS lost 375 Gt/yr (409 km3/yr) from 2011-2014.
1900–1983
75.1 ± 29.4 gigatonnes per year
1983–2003
73.8 ± 40.5 gigatonnes per year
2003–2010
186.4 ± 18.9 gigatonnes per year
km³/yr
gigatonnes/yr
1900–1983
(82)
(75)
1983–2003
(81)
(74)
2003–2010
(203)
(186)
2011-2014
(409)
(375)
Here’s a graphical depiction of this projected up to 2017:
99.58% of the Greenland Ice Sheet has not melted since 1900.
For a little more perspective, let’s convert this to ice cubes.
Based on the asserted loss of ice since 1900, the GrIS has lost the equivalent of a Lake Superior-sized ice cube. However the GrIs remained larger than the Gulf of Mexico (by volume) despite losing a Lake Superior. The Gulf of Mexico has a volume of about 2.5 million km3. If the GrIS melted, the volume of water would be about 2.71 million km3. Before losing Lake Superior, the water volume was 2.72 million km3.
That’s all well and good for the 20th and early 21st centuries; but it doesn’t provide much of a geological perspective.
A Geological Perspective of the Greenland Ice Sheet
How does all this compare to the evolution of the GrIS in the Late Pleistocene and Holocene? For this perspective, I relied on Tabone et al., 2017. They devised a model to simulate how the GrIS has evolved over the past 250,000 years.
To study how oceanic changes impact the evolution of the GrIS over the last glacial cycles, we performed a set of sensitivity tests by perturbing the two key parameters of the basal melting rate equation (Eq. 10): the estimated present-day submarine melting Bref and the heat-flux coefficient κ. For each experiment we ran an ensemble of simulations over the GrIS domain throughout the last 250 ka. In this study the model is initialised by the present-day Greenland topography (Bamber et al., 2013), the characteristic relaxation time for the lythosphere is set to 3 ka and the sea level is maintained constant in time at its present-day value.
[…]
Figure 2 shows the evolution of the grounded ice volume (a) and area (b) for the simulations obtained for different values of the reference melting rate Bref and κ = 0. In this experiment the maximum ice volume reached at glacial times ranges between 3.2-3.9 million km3, just 8-32 % higher than the observed present-day ice volume (Bamber et al., 2013), suggesting that under constant oceanic forcing, the GrIS is limited to a configuration close to that of nowadays. The highest glacial ice volume is reached by imposing a null basal melting to the GrIS margins (Bref = 0), which corresponds to a simulation forced solely by paleo atmospheric variations.
Figure 2 from abone et al., 2017. It’s interesting to note how the GrIS reached its maximum volume just before the Eemian and current interglacial. It’s also interesting to note that the Eemian GrIS shrank so rapidly. Recent studies indicate that temperatures in Central Greenland were 5-8 °C warmer during the Eemian than they are today.
Using the maximum basal melting scenario (Bref = 40), I tacked the modern GrIS volume profile on to the model.
Who would have guessed that the “Anthropocene” GrIS is actually larger than it was during the Late Pleistocene? WUWT? X-axis is in calendar years AD(BC).
Notice something funny? The GrIS may have actually been smaller than it currently is from 35 ka to 15 ka. And, this actually might make sense. Of course, the lower basal melting scenarios would reverse this… And they would also make the modern ice loss even more geologically insignificant.
Greenland Ice Sheet Stratigraphy
The image below is a GPR (ground-penetrating radar) cross-section of the GrIS. It is literally a work of art. GPR is analalogous in many ways to the reflection seismic data that we use in oil & gas exploration. If you click on this link, you will see a full-size image of the cross-section. Note that most of the ice is above the 12 ka horizon. This is very close to the Pleistocene-Holocene boundary. It indicates that most of the ice was deposited since the end of the last Pleistocene glacial stage (ice age in layman’s terms).
Distilling Art from the Figures of Science: “This is a cross-section through the Greenland ice sheet collected with airborne ice-penetrating radar. The radar echogram is displayed as a 3D surface illuminated from above, creating the illusion of texture and emphasizing the layered internal structure of the ice sheet. Composition by Michael Wolovick.”
Earlier in this post I took a swipe at NASA for having the wrong perspective of the GrIS. Maybe I was mistaken… Or maybe NASA is a science savant… Because this is from NASA:
Greenland Ice Sheet Stratigraphy
Visualizations by Cindy Starr Released on January 23, 2015
For nearly a century, scientists have been studying the form and flow of the Greenland Ice Sheet. They have measured the change in the elevation of the surface over time using satellites. They have drilled ice cores in the field to reveal a record of what the past climate was like. They have flown aircraft over the surface of the ice sheet laden with instruments to gleen information about the interior of the ice sheet and the bedrock below.
Now a new analysis of this data has revealed a three dimensional map of the age of the ice sheet. This visualization shows this new 3D age map of the Greenland Ice Sheet, explains how it was created and describes the three distinct periods of climate that are evident within the ice sheet.
The airborne GPR coverage of the GrIS is quite impressive:
Greenland Ice Sheet Stratigraphy: “This print resolution still image shows the flight lines where aircraft have flown over the surface of Greenland collecting data on the ice sheet. Lavender lines indicate flights flown by Operation IceBridge while gray lines indicate prior flights.”
The GPR profiles are tied to ice cores in much the same manner that we tie seismic lines to wells:
Greenland Ice Sheet Stratigraphy: “This image shows the layers from radargram data that were collected by an Operation Ice Bridge flight over the Greenland ice sheet on May 2, 2011. An overlay of colored lines traced along layers indicates the age of individual layers across the ice sheet. The age layers are colored by the period colour, with Holocene layers shown in green and those from the last ice age shown in blue. Labels indicate the age of various layers. The 1966 Camp Century ice core is shown on the left.”
One common feature is that the volume of Holocene ice appears to be as large or larger than the volume of Pleistocene ice.
Greenland Ice Sheet Stratigraphy: “This print resolution image shows one cross-section of the age of the Greenland Ice Sheet as determined by MacGregor et al. (See citation under the ‘More Details…’ button below) Layers determined to be from the Holocene period, formed during the past 11.7 thousand years, are shown in Green. Age layers accumulated during the last ice age, from 11.7 to 115 thousand years ago are shown in blue. Age layers from the Eemian period, more than 115 thousand years old are shown in red. Regions of unknown age are filled with a flat gray colour.”
It’s particularly notable that in Central Greenland there is still a significant remnant of Eemian ice. In much of Central Greenland about 12,000 years worth of Holocene ice is thicker than over 100,000 years of Pleistocene ice. This is due to the fact that glacial stages (AKA ice ages) are very cold and very dry. The snow accumulation rate during the Holocene has been much higher than that of the last Pleistocene glacial stage.
How Does the Recent Melting of the Greenland Ice Sheet Compare to the Early Holocene?
Short answer: Same as it ever was. Vinther et al., 2009 reconstructed the elevations of four ice core sites over the Holocene. There has been very little change in elevation of the two interior ice core sites (NGRIP and GRIP), while the two outboard sites (Camp Century and DYE3) have lost 546 and 342 m of ice respectively.
Most of the melting since the beginning of the Holocene has occurred on the outboard, lower elevation portions of the GrIS – Same as it ever was. X-axis is in calendar years AD(BC). Elevation reconstruction data from Vinther et al., 2009. Map from Weißbach et al., 2015.Elevation profiles: End Pleistocene and 2000 AD.
Conclusion
From this geological perspective, the Greenland Ice Sheet is not behaving badly.
References
Bamber, J. L., J. A. Griggs, R. T. W. L. Hurkmans, J. A. Dowdeswell, S. P. Gogineni, I. Howat, J. Mouginot, J. Paden, S. Palmer, E. Rignot, and D. Steinhag. A new bed elevation dataset for Greenland.The Cryosphere, 7, 499–510, 2013 www.the-cryosphere.net/7/499/2013/ doi:10.5194/tc-7-499-2013.
Kjeldsen, Kristian K., Niels J. Korsgaard, Anders A. Bjørk, Shfaqat A. Khan, Jason E. Box, Svend Funder, Nicolaj K. Larsen, Jonathan L. Bamber, William Colgan, Michiel van den Broeke, Marie-Louise Siggaard-Andersen, Christopher Nuth, Anders Schomacker, Camilla S. Andresen, Eske Willerslev & Kurt H. Kjær. Spatial and temporal distribution of mass loss from the Greenland Ice Sheet since AD 1900.Nature volume 528, pages 396–400 (17 December 2015) doi:10.1038/nature16183.
Sutterley, Tyler C., Isabella Velicogna, Beata Csatho, Michiel van den Broeke, Soroush Rezvan-Behbahani and Greg Babonis. Evaluating Greenland glacial isostatic adjustment corrections using GRACE, altimetry and surface mass balance data. Published 15 January 2014 • 2014 IOP Publishing Ltd. Environmental Research Letters, Volume 9, Number 1.
Tabone, Ilaria, Javier Blasco, Alexander Robinson, Jorge Alvarez-Solas, and Marisa Montoya. The sensitivity of the Greenland ice sheet to glacial-interglacial
oceanic forcing.Clim. Past Discuss., https://doi.org/10.5194/cp-2017-127. Manuscript under review for journal Clim. Past. Discussion started: 8 November 2017.
Vinther, B.M., S.L. Buchardt, H.B. Clausen, D. Dahl-Jensen, S.J. Johnsen, D.A. Fisher, R.M. Koerner, D. Raynaud, V. Lipenkov, K.K. Andersen, T. Blunier, S.O. Rasmussen, J.P. Steffensen, and A.M. Svensson. 2009. Holocene thinning of the Greenland ice sheet.Nature, Vol. 461, pp. 385-388, 17 September 2009. doi:10.1038/nature08355.
Weißbach, S., A. Wegner, T. Opel, H. Oerter, B. M. Vinther and S. Kipfstuhl. Spatial and temporal oxygen isotope variability in northern Greenland – implications for a new climate record over the past millennium.Clim. Past, 12, 171–188, 2016 www.clim-past.net/12/171/2016/ doi:10.5194/cp-12-171-2016.
Williams, R.S., Jr., and Ferrigno, J.G., eds., 2012, State of the Earth’s cryosphere at the beginning of the 21st century–Glaciers, global snow cover, floating ice, and permafrost and periglacial environments: U.S. Geological Survey Professional Paper 1386–A, 546 p.
Fun Stuff
The Cold War connections to some of the ice core sites is really cool! The DYE-2 and DYE-3 ice core locations were once part of the DEW Line.
DYE-2 – a relic from a not so distant past
The dart is still in the dartboard and the beer is still on the counter in the bar. So untouched is DYE-2. Slowly, the weather and wind have encroached and in a few years it will probably be difficult to get in and see this unique, American cold war relic on the ice sheet in Greenland.
Text: Toke Brødsgaard, greenland today July 2015
There is an air of mystery when you move around the now abandoned DYE-2 radar station which is located quite a long way out on the ice cap in Greenland. The site remains so untouched that it is as if everyone left the place at the same time when it was abandoned in October 1988.
Moving around the build-ing, you can see rooms, bars and workshops in the same state in which they were left. The only evidence that time has passed, is that the weather has broken some windows and the snow has sneaked in and disturbed the peace.
[…]
Map showing the »Distant Early Warning (DEW) Line« which DYE-2 was part of.
The Distant Early Warning Line
DYE-2 was a major undertaking. At its most active, there were 60 men at the station. The fact that the building was able to accommodate such a large staff during periods when it was impossible to go outside because of cold and storms says a lot about its size.
Strategically, DYE-2 was in an important position, since it was a part of the Distant Early Warning (DEW) radar line. It was established to warn of any Soviet air attacks against the USA during the cold war. The DEW Line consisted in Greenland of DYE-1, which is located just outside Sisimiut, DYE-2 and DYE-3, which are located further to the east on the Greenland ice sheet and DYE-4 which is located not far from Kulusuk in East Greenland.
DEW was a chain of a total of 60 radar stations stretching over a 5,800km long line along the 69th parallel north from Alaska over Canada via Greenland to Iceland. The actual radar chain was active from July 31st 1957 until the end of the 1980s.
The main trench at Camp Century in Greenland led to an underground city carved out of the ice. PICTORIAL PARADE/ARCHIVE PHOTOS/GETTY IMAGES
Mysterious, ice-buried Cold War military base may be unearthed by climate change
By Julia Rosen Aug. 4, 2016 , 11:00 AM
It sounds like something out of a James Bond movie: a secret military operation hidden beneath the Greenland Ice Sheet. But that’s exactly what transpired at Camp Century during the Cold War.
In 1959, the U.S. Army Corps of Engineers built the subterranean city under the guise of conducting polar research—and scientists there did drill the first ice core ever used to study climate. But deep inside the frozen tunnels, the corps also explored the feasibility of Project Iceworm, a plan to store and launch hundreds of ballistic missiles from inside the ice.
The military ultimately rejected the project, and the corps abandoned Camp Century in 1967. Engineers anticipated that the ice—already a dozen meters thick—would continue to accumulate in northwestern Greenland, permanently entombing what they left behind.
Now, climate change has upended that assumption. New research suggests that as early as 2090, rates of ice loss at the site could exceed gains from new snowfall. And within a century after that, melting could begin to release waste stored at the camp, including sewage, diesel fuel, persistent organic pollutants like PCBs, and radiological waste from the camp’s nuclear generator, which was removed during decommissioning.
If these predictions come to pass, the researchers… [blah, blah, blah]…
It is interesting how (indicated by the graphics) 10,000 years ago there was almost 1/3 less ice there than today and a clear demarcation between Ice that is 7-10,000 years old and Ice that it >90,000 years old
It is as if 10,000 years ago a massive amount of ice melted away…
and the world didn’t flip over
and the Polar Bears didn’t starve
and the climate didn’t tip
and the Arctic MUST have been SIGNIFICANTLY WARMER than today
The reaso the ice volume was smaller in the Early Holocene is not only that the Arctic was warmer (which is true), but also that the icecap was larger in area and calved into the sea. Such an icecap always has a flatter profile. As the ice margin retreated onto land where the ice must melt “in place” rather than calving the profile grew steeper.
There is actually good evidence that during the Eemian when the icecap was perhaps a third smaller in volume, the central part was actually slightly thicker than now.
Let me see if I get this. During the Pleistocene, it didn’t snow much (too dry), so not a lot of ice built up even though it was cold. Then as the Holocene kicked in, it was still fairly cold, but there was more snow, so the GrIS grew rapidly. Now, well into the Holocene, it is finally too warm and the GrIS is shrinking. Sounds like it is doing what it always should.
Just think when the GrIS is gone and the land is usable and occupied. People will think like we do “good thing that ice is gone. Can you believe the ice was km thick right here where our house is?! I still have a hard time imagining the Laurentide ice sheet covered my home.
Thank the Laurentide and Cordilleran ice sheets for the wonderful loess farmlands of North America. And the wind.
The mills of the gods grind exceeding fine.
“ The Laurentide ice sheet wouldn’t cover your home… It would grind it into very fine grained particles… LOL!”
Me thinks the above comment just might incite the asking of ….. “Which came first, the chicken or the egg” …… type of question.
For instance, did the one (1) mile thick Laurentide ice sheet that covered New York City, Long Island, etc., some 20,000 years ago actually form there in place as a result of thousands of years of snowfall ……… or did it actually form farther to the north in Canada and then slide MELTINGLY & GOUGINGLY “downhill” past NYC and LI into the north Atlantic Ocean …..due to the force of gravity?
Or was it the “post-glacial melting” remnants of the one (1) mile thick Laurentide ice sheet that once covered New York City, Long Island, etc., some 20,000 years ago …… that was doing the “SLIDING & GOUGING” of the topography in question?
Here is one of those Pleistocene Glacial Deposits in Pennsylvania…Funny that the article doesn’t even mention it as a glacial deposit. But you can hear the sounds of the rocks ringing. I took my family with a bunch of hammers there and you could hear these same sounds: https://www.atlasobscura.com/places/sonorous-stones-ringing-rocks-park
From Wackapedia (sorry, I have always called it that, probably from around the time I knew that the global warming thing was a sham):
“…Although the Newark series diabase sills crop out in a belt throughout the length of the Appalachian Mountains, only a narrow band of outcrops in southeastern Pennsylvania and New Jersey develop ringing rock boulder fields. The probable reason is that these areas were at the southern edge of the Pleistocene glaciers, and would have been subject to extreme periglacial conditions. Periglacial boulder fields are a common feature in Pennsylvania and New Jersey…”
My alma mater in New Haven CT (not Yale) sits in the shadow of a Triassic diabase sill (West Rock). This particular outcrop was covered by the Laurentide ice sheet and exhibits many glacial features:
West Rock Ridge is composed of igneous rock that formed when magma intruded into sedimentary rocks and cooled. These rocks formed between 220-200 million years ago during the late Triassic and early Jurassic periods of geologic time. More recently, during the last Ice Age (about 20,000 years ago), glacial ice about 1 mile thick scraped across West Rock. The ice created parallel grooves (glacial striations) on the rock. When the ice melted it deposited unsorted glacial debris (glacial till) and large boulders (erratics) on top of the rock.
Thanks, David M, I hadn’t seen that graphic before now.
The Hudson Canyon has always intrigued me because it explicitly shows the extent of the meltwater “outflow” erosion of the Hudson River during glacial periods when sea levels were 450+ feet lower than they currently are.
A great view of glacial scouring can be seen from the top of Cadillac Mountain in the Acadian National Park. Cadillac Mountain and several other mountains that are in view are a clear demonstration that the Laurentide Ice Sheet formed to the North and ground its way to Manhattan where it displaced the prehistoric progressives of the day.
mikebartnz
March 22, 2018 3:59 pm
They say that Antarctica is losing ice when overall it is actually gaining ice.
That’s what I have been seeing lately. The same for the Greenland Ice Sheet…both are gaining ice volume recently…(Do I have to provide links to scientific papers?)
Between WW2 and 1988, part of Greenland gained 260 feet of ice.
Six American fighter planes and two bombers that crash-landed in Greenland in World War II have been found 46 years later buried under 260 feet of ice … link
When I get back off the road I’ll post a little essay I wrote based on source material from WW II that explains why P 38s were flying the northern route in the first place and why the effort was ended.
David Middleton
March 22, 2018 at 4:17 pm
It gained ice at the top and lost it from the bottom. The geothermal heat flow melts the ice from the bottom.
———————
It seems like the numbers used and the explanation given in the back bone of it all, it puts the actual natural factor in percentiles at about, 60-70% from below versus 30-40% from above, on the amount of ice mass subject to melt, the amount that consist as green in the graphic above.
A clever attempt to show that a possible anthropogenic signal impacting Greenland Ice sheet, a “straw that may brake the back of the camel”, so to speak, can be claimed.
But still this consist as nothing burger as per AGW support, as it requires data that clearly support that the thermal force below the Ice in the land is strong and very strong as expected to be, in a 60% melting path.
Which will put Greenland in a special position compared to the rest of the globe.
And also there should be a better explanation why there should be not more ice gain to Greenland during a glacial period when in the same time North America gows full Laurentide.
Another such explanation will put Greenland to a further special grounds about the climate signal, where the extraction of the anthropogenic “straw” will be just silly.
That position is a silly stitch up burger, which requires significant explanation that makes the case of anthropogenic forcing in this particular aspect meaningless, as Greenland under such intricate explanations becomes very special in its own with not much help towards AGW, where G stands for global.
Otherwise attempting to change the numbers will move the percentiles move towards and growing in favor of the melting mass, more as for and from the surface, which defaults the melting observed so far within the natural limit.
Mathematically, from my position and understanding, the extraction of an anthropogenic forcing from this angle happens to be impossible, even when seeming so tempting to have a go at it.
What in a essential here, is a stitch up stage where the melting of ice from above is considered as more extensive than expected or more extensive than supposedly it could be as per nature, when this happens to be stitched up at some silly value as per nature at ~60-70% from below versus 30-40% from above.
When a claim like this could produce that “straw”…..but it still fails by default, as far as I can see and say.
Hopefully this will be understood as put.
Thanks
Ok as promised above for anyone interested: https://www.warhistoryonline.com/military-vehicle-news/15-p-38-glacier-girl-pictures.html?utm_source=dlvr.it&utm_medium=facebook&src=fba&type=wca&page=who
The reason those aircraft were there was because of the Battle of the Atlantic. For the US to become engaged it had to get it’s fighting forces and their equipment to where the action was. With the German U-boats sinking so many allied ships during 1942 and early 1943 shipping, especially across the N Atlantic, was a big problem. The allies would not truly gain the upper hand in the Battle of the Atlantic until May of 1943.
In April 1942 the US Army Air Force (AAF) began it’s initial deployments to England which was the beginning of what would be come the Eighth, Ninth, and Twelfth Air Forces. The heavy bombers, at this point all B-17s, could fly over on their own but what about fighter aircraft? At the time the Lockheed P-38F and G models were the only combat worthy US fighter aircraft ready for deployment that had the range to make it to where fighter aircraft were needed.
They would be staged across starting from Goose Bay, Labrador with stops in Greenland and Iceland before landing in Scotland. Of course this had to be done over vast stretches of deadly cold water across a region of the world with some of the worst and least predictable weather on the globe during a time when the tools for weather forecasting and navigational aids were nothing like what we have today. Add to that the Germans broadcasting false navigation beacon signals.
Because of the navigation involved and the need for long range CW communications a B-17 was assigned to be the mother ship for each flight of six P-38 fighters.
This was a wise decision though the fact that out of the first flight of B-17s attempting the flight across the N. Atlantic three were lost (crews recovered) gave reason for some worry.
The situation was so desperate that the AAF determined that a loss of 10% of the aircraft and pilots in transit would be an acceptable loss.
In the end a total of 179 P-38s made it across the N. Atlantic in 1942 out of 186 that attempted and only one pilot was lost. The N. Atlantic route was considered closed during the winter months but it was a quite impressive performance for the time.
By the summer of 1943 the Battle of the Atlantic was well on the way to being won and the miracle of production from US yards was beginning to show up. It was much cheaper to ship the aircraft and a scheme for carrying them on the decks of oil tankers worked so well that the numbers being shipped were more than adequate so there was no reason to ferry the P-38s over the great white north again.
However if things had not gone well and the allies had not gained control of the shipping lanes the Army already had a contingency plan to ferry 4,000 aircraft across the Atlantic in 1943.
BTW the F & G models were the first combat worthy P-38 models but still had plenty of problems including compressibility. In later models all the problems were ironed out but before then the US almost decided to quit producing them in favor of more production of more recent designs. William Knudsen the man who above all others can be credited with coordinating the effort to make Roosevelt’s “Arsenal of Democracy” a reality took a trip out to the Pacific Theater to meet with the military leaders there to determine what war materials they needed most. Army Air Force General George Kenny convinced Knudsen of how important the P 38 was for operations in the Pacific and thus the P-38 was the only fighter aircraft that remained in front line service from before the war until after VJ day. The fact is that the top two US aces of WW II, Dick Bong and Tommy McGuire got all of their kills flying P-38s.
On 21 September 1942 the 39th Squadron began operations in their new P-38 Lightnings. General George Kenny, Commander of the Fifth Air Force, made a statement that he would personally present an Air Medal to the pilot that downed the first Jap in combat while flying a P-38. According to records, one day a gentleman from Missouri by the name of Faurot was on a mission over the Japanese Air Base at Lae, New Guinea. For days previous the American pilots had been radioing insults at the Japanese, trying to make them engage in combat. Faurot was leading a flight of four P-38s loaded with 500-pound bombs to be dropped on the airstrip at Lae. As the flight approached Lae, the insults to the Japs began again and Faurot observed a Zero starting to take off. He dived to intercept. Faurot remembered that he still had two bombs under his wings and could not engage the Jap Zero with them, so he quickly released the bombs and pulled back hard on the control yoke to escape the blast of the bombs. He then swung back around to engage the Zero. As he watched, the bombs hit the water and exploded just as the Zero passed over them. The Zero lurched crazily, “winged-over” and crashed into the ocean.
At a “medals” ceremony some time after reading Faurot’s submitted mission report, General Kenny (in his memoirs) had this to say, “I asked Faurot if he was going to claim the “FIRST NIP” in air combat in this theater by a P-38. Bob just grinned and asked if he was going to get the Air Medal for his official victory. I answered, “I want you to shoot them down, not splash water on them”. General Kenny, whose relationship with “his kids” was marked by the humor of a crusty father, presented Faurot with the Air Medal and whispered in Bob’s ear as he pinned it on, “You had better keep this whole matter quiet.”
http://cobraintheclouds.com/majorrobertlfaurot.html
Sadly Robert Faurot was killed in action a short time later during the Battle of the Bismarck Sea.
The 5th AF and “Kenny’s Kids” are one of the most interesting subjects of WWII history.
RAH,
Thanks!
Not to take anything away from Pacific Theater P-38 aces, they were flying a heavily-armed, bomber interceptor against Japanese fighters, which were flammable kites.
Good analysis of German subs’ effect on the B-17/P-38 route.
PS: McGuire probably died because of his desire to surpass Bong.
IMO the even greater heroes were those Marine and Navy pilots who fought the Empire of Japan to a standstill in 1941-43 in inferior aircraft like Wildcat and Dauntless.
David,
My brother is the world’s leading expert on naval aviation.
Foss and Carl were among his best friends. He was supposed to visit Carl when the slimeball who murdered him invaded his house, but our mother had just died. Oregon still hasn’t killed the subhuman felon. Carl was suffering from Alzheimer’s at the time, or the mutant would have died then and there.
Boyington and the Black Sheep certainly got more publicity than they deserved; but, despite all of his flaws, Boyington was a great fighter pilot and squadron leader… in his own unconventional ways. The fact that Boyington accomplished what he did, despite a total disdain for military discipline is kind of amazing.
“PS: McGuire probably died because of his desire to surpass Bong.
IMO the even greater heroes were those Marine and Navy pilots who fought the Empire of Japan to a standstill in 1941-43 in inferior aircraft like Wildcat and Dauntless.”
In my view WW II history and historians have given short shrift to the whole SW Pacific campaign in all of it’s aspects as compared the South and Central Pacific Campaigns and those in N. Africa and the ETO. In fact the only campaigns that have gotten less print than the SW Pacific are those that took place in the CBI (China Burma India Theater). Both are treated as back waters compared to what have been deemed the main shows. The fact is that the Army carried out far more amphibious operations in the Pacific during WW II than the Navy did, engaged far more Japanese troops than the Naval operations did, and actually had more vessels in numbers but not tonnage than the Navy did in the Pacific but the average person would have no idea of these facts based on the most popular histories that have been written.
The SW and S Pacific campaigns complemented each other right up until they isolated Japanese forces on New Britain. Neither could have done it without the other during those darkest days in 42 and early 43 but Watchtower (Guadalcanal Tulagi) and subsequent operations in the S Pacific have gotten far more press because, in part, it was there during that period the US Navy engaged in more surface and carrier against carrier actions than at any time in their history and because of the desperate nature of the fight for Guadalcanal.
The 5th Air Force in the SW Pacific theater, in particular, is fascinating. Kenny’s Kids (like Bong, McGuire, Lynch, etc.), Pappy Gunn and his Commerce Destroyers (skip-bombing B-25 gunships) and Airfield Busters (para-fragging A-20 and B-25 gunships).
“Between WW2 and 1988, part of Greenland gained 260 feet of ice.”
No, 260 feet of (compacted) snow. It is only at about 300 feet that the pressure gets high enough for the the compacted snow to turn into solid ice.
Chimp March 23, 2018 at 6:57 pm
…..”Not to take anything away from Pacific Theater P-38 aces, they were flying a heavily-armed, bomber interceptor against Japanese fighters, which were flammable kites.”…………..
True the Japanese aircraft at that time lacked armor and self sealing fuel tanks. Their flammability however was something that resulted from the pilots eventually learning the type of ammunition to use. And those American pilots often flew 100s of miles before they got into combat and were fighting the some of the best pilots in the world at the time. P-38s took on the IJN pilots frequently during the fight to neutralize Rabul and they were prewar trained. The best Nippon had. Tommy McGuire died trying to save one of his pilots from an Oscar flown by Akira Sugimoto, one of their top aces. https://www.pacificwrecks.com/aircraft/p-38/44-24845/mason/index.html
Sugimoto was experienced, but not an ace, let alone a top one.
The whole fighter sweep was initiated by McGuire with the express purpose of upping his tally.
That’s exactly what fighters do. Bong and McGuire in a friendly but tough competition. They flew together until Bong was grounded and sent home. Then Tommy was grounded to prevent the chance of his surpassing Bongs record before Bong had received the MOH. And Sugimoto was most certainly a top ace: http://456fis.org/THE_DARK_SIDE_OF_FAME_THOMAD_B._McGUIRE.htm
“Unfortunately for McGuire, the pilot he attacked was NAP 1/c Soichi Sugita, at that time the top-scoring surviving IJN ace with 80-odd kills scored over Rabaul, a master at the controls of a “Zero”. In the ensuing fight, Sugita managed to shoot down one of McGuire’s wingmen, and severely damage the other two. He then went after McGuire. Low over the jungle, heavy with fuel, McGuire stalled out trying to get away from Sugita and crashed to his death, a pointed example of the dark side of the lust for fame and glory.”
One other note: Hap Arnold declared that without the P-38, Torch, the invasion of N. Africa could not be carried out. The Allied pilots flying in the early stages of that campaign in N. Africa suffered deprivations ,odds, and losses every bit as severe as those suffered by the Marine pilots on Guadalcanal did. In some cases they didn’t even have tents and slept on the open ground between sorties during the first few weeks of that campaign.
It should be understood that no country in the world during the whole war other than the US could have carried out two major amphibious campaigns across the vast expanses of the worlds two largest oceans as Torch and Watchtower did in late 1942. Both initiated less than a year after the attack on Pearl Harbor.
Yes it did until they ironed out the bugs in the late models. Before that they had big problems with the turbos and engines and pilot comfort at high altitude. And then there was the problem of compressibility which prohibited the pilots from following the German 109s and 109s in steep dives. For these reasons Doolittle decided to reject the P-38 as the primary long range escort fighter for the 8th Air Force and go with first the P-47s and then the Merlin powered P-51s as soon as they became available. Many a historian and WW II aviation buff has wondered what would have happened had the decision been made to produce P-38s with Merlin engines instead of retaining the Alison. They tried a prototype but decided to dedicate the US Packard Merlin production to the single engine P-51.
Concerning firepower. The P-38 with it’s guns in the nose made an excellent gun platform as compared to fighters with all or most of their machine guns or cannon in the wings.
For those interested which haven’t seen it. The late Jeff Ethell takes you on a walk around and flight of a late model P-38. https://youtu.be/Y3nddCJbcdI
Since in the wierd world of ice and snow we know that both can increase or decrease in response to either cooling or warming.
So if Greenland ice mass is decreasing we don’t really have a clue what this means – either warming (snow melting) or cooling (less snow falling).
And… The myriad assertions of recent ice mass loss are heavily dependent on deglaciation scenarios and glacial isostatic adjustments (GIA)… which have far more uncertainty than the myriad assertions of recent ice mass loss… 🤔
Rob, as the data is so good, can you supply the academic qualifications of the people who took the real-time measurements of the GrIS way back at the LGM?
No, I didn’t think you could. Methinks there were not too many Inuit there to see the ice sheet 12,000 years ago, let alone measure it’s size. Modern day estimates of it are just guesses, not data, & the errors involved in the calculation render it useless for anything other than navel-gazing speculation.
Actually the GPS data are fairly good for Greenland – there is solid rock available almost all around the periphery. However there is still some uncertainty about GIA under the central part of the icecap, and about volcanic activity/heat flow. However it seems clear that the Greenland icecap is losing mass.
This is vastly more uncertain in Antarctica. The “raw” GRACE data does not differ significantly from zero, so the putative ice-loss is 100% GIA adjustment. Furthermore there are several GIA models that differ by a factor 3, and there are very few GPS station. To finish this tale of woes none of the GIA models come even close to matching the GPS measurements.
The only non-GRACE data (from Icesat) suggest that the ice is actually growing, but have large uncertainties too, though they are much less affected by GIA.
All of this banter is irrelevant. Probably the major reason that the Greenland ice sheet ebbs and flows is the volcanic hot spot that Bradley’s linked study talked about. Until the researchers can pin down exactly how much melting is due to the hot spot they are just whistling in the dark. If there was real global warming we would see the same melting everywhere. We dont see the same melting everywhere because to melt these sheets and Antarctica would take a hell of a lot more temperature increase than the fraudulent temperature increase that even the IPCC says there is. I am not worried even if everyone of the 200000 glaciers all melted to the very last drop of ice. It would only increase sea levels by 40mm. Anyone that thinks that the Antarctica and Greenland ice sheets are going to melt significantly needs to move to another planet. Start packing now and I will pay for your rocket ship ticket; one way of course. What a bunch of idiots we have on this planet !!!!.
If you read one of the posts below it proves that the icesheet is melting from below. That isnt because Greenland is sitting on the ocean. Greenland is sitting on land. That is why the word land is in Greenland. Sheeeeeeeeeeesh. The hot hot hellishly/ sarc hot air from global warming is NOT melting the ice sheets. Volcanic ridges under Greenland and Iceland are what is doing it. Every researcher has to attribute global warming as a cause in any of their reports or else they wont get peer review pass. The result is that this makes every climate researcher look like an idiot. This global warming hoax is really getting to me now. We are in a world controlled by the OZ police.
true enough. However, this melting (end flow, where relevant) is not new, and I assume it has been, is, and will be pretty steady. So what matters for the mass-change is how much new ice is formed. That is, how much is it snowing.
Ice loss comes from three processes:
1. Basal melting due to the combination of geothermal heat flow and pressure of ice overburden.
2. Surface melting, primarily in lower elevations.
3. Calving of icebergs from outflow gaciers.
4. There is a number 4: – sublimation, transition from a solid ice directly to water vapor (a solid to a gas). I don’t have a figure, but over the vast dry area of Antarctica this should be substancial and measurable: https://www.bas.ac.uk/data/our-data/publication/the-seasonal-cycle-of-sublimation-at-halley-antarctica/
From the above:
“…During the winter months, sublimation losses are negligible, but between November and March sublimation removes around 25% of the snowfall. Surface sublimation and sublimation of blowing snow make roughly equal contributions to this total. Estimates of sublimation using micrometeorological data agree well with estimates made from daily snow-stake measurements…”
That is also what happened at the top of Mt Kilimanjaro, which is normally below freezing.
I guess they will have to measure the temperature at these areas of concern, rather than theorize about the cause.
Kristi Silber
March 22, 2018 4:42 pm
The growing and shrinking of the ice sheet in the distant past vs. present doesn’t mean much without a rate. I’m afraid that despite all the “cool” graphics, I’m not really sure what the point of this exercise is. I’m sure I’m missing something.
“If these predictions come to pass, the researchers… [blah, blah, blah]”
What does this mean? The predictions won’t come to pass, or we don’t have to worry about hazardous waste being leached into the environment, or it’s not worth worrying about because it’s so far in the future? Is there a particular reason you ridicule this paper, David?
“But meltwater percolating down through the ice sheet could pick up and wash abandoned waste downstream decades sooner.” This doesn’t seem to me to be very funny even if I’m not around to see it.
Why is it that skeptics have no problem using models as evidence to support their ideas but say that mainstream AGW models are useless and wrong?
Most of are able to realize that some models are useful, and some aren’t.
Each model has to be judged on it’s own merit.
Models used to design circuits and buildings (not the same models mind you) are useful. Precisely because their output has been compared against reality and found to match.
Climate models, when compared against reality have failed miserably.
KS,
Well, if you want something to worry about, do an online search for Camp Tuto. Tuto was the staging area for building and supplying Camp Century. A tunnel was driven into the Snout of the glacier a few miles outside of Camp Tuto. A reservoir was created below the tunnel by melting the ice and pumping the water out. It was then filled with (as I recollect) about 50,000 gallons of diesel fuel to supply the generators inside for heating and electricity. When the Army pulled out about 1968, they just left the diesel fuel behind, as well as the sewage from the GIs living there and in Camp Tuto. The logistics and cost were considered prohibitive to remove it all. While there, I was told a story about how one bored GI filled out the paper work for 100 power lawn mowers. After they were delivered, the camp commander decided that it was more expedient to just put them out on the ice of a nearby lake and let them sink to the bottom during the next Spring thaw, rather than ship them back to the States.
Camp Century is of course not much of a problem. Ultimately (several thousand years hence) it will calve into the sea. It will not “melt out”. Examination of the sediments at the bottom of the Camp Century ice core shows that the site has not been ice-free for at least 1.5, and probably 2.4 million years http://adsabs.harvard.edu/abs/2014EGUGA..1610721F
This is not really surprising since this area actually is the snowiest in all of Northern Greenland. So, about the time forests start growing in Northern Greenland, then Camp Century will be melting out.
What is your problem Kristi, Iceland has more ice than the last ice age. Do a bit of real thinking and research and you will find that old sol when he has a sabbatical has other tricks up his sleeve. They include an increase in volcanoes and the heat in the hot spots all over the world. Iceland as is the Antarctic are getting their bums warmed, this is normal. Strangely our weather and climate over the entire world is normal also.
“I’m sure I’m missing something”
Yes Ms Silber, we share your confidence in that.
MarkW
March 22, 2018 4:45 pm
It’s still using GRACE data, which is in reality a disGRACE.
The best guess adjustments for iso-static rebound are several times larger than the ice melt they claim to have identified.
You can measure the current uplift with a great deal of precision using GPS. However, this doesn’t differentiate crustal rebound from changes in ice mass. You still have two big uncertainties:
Uncertainties in GIA models come from a lack of constraints on global ice sheet history since the Last Glacial Maximum (LGM), and the Earth’s internal rheological structure (Ivins and James 2005).
“How elastic is the crust and upper mantle?”
The answer to that is “it depends”. In Scandinavia (a very stable precambrian shield) the isostatic rebound is still going strong 12,000 years after the ice melted. In Iceland (where the lower crust and mantle is presumably considerably less viscous) it only took a few thousand years to reach equilibrum.
Greenland is mostly rather similar to Scandinavia geologically (they were part of the same continent until c. 65 million years ago). The big problem is that the Iceland hot-spot passed under Greenland at about that time. How much of “low viscosity track” has it left? Nobody knows and getting at the details of the geology below the ice is rather difficult, to put it mildly.
I would like to add this borehole temperature profile on the Greenland ice-sheet.
Basically, at the bottom of almost all the Greenland ice-sheet, the temperature is now -3.0C or -2.4C or -1.0C due to heating from the bedrock below. Given the pressure from all that ice above, these temperatures are enough to melt the ice.
There is no ice on Greenland that is more than 130,000 years old. The vast majority is in the 50,000 years to 100,000 years old category. The melted water gets squeezed out somewhere and is no longer part of the bottom of the ice-sheet.
This temperature profile is from NGRIP. None of the ice was more than 110,000 years old. The last ice age maximum ice shows up at 1500 metres deep at -32C but it was formed at about -40C. It has since warmed up from bedrock heating from below. As you go deeper and older, the ice gets progressively warmer. http://www.iceandclimate.nbi.ku.dk/images/images_research_sep_09/Temp.jpg
At NEEM shown in this pic, they did get back to 130,000 years. There are a few remnant areas which might be up to 400,000 years old but there is no layering left in this ice to be sure. http://neem.dk/billeder/greenland.bmp
Discussion at: http://www.iceandclimate.nbi.ku.dk/research/flowofice/borehole_logging/
Actually not all of the Greenland ice-sheet is melting at the base. Part of it is “cold-based”, i e frozen to the bed. Whether an ice cap is “warm-based” or “cold-based” depends on several factors. The geothermal heat-flow is probably most important but also the thickness of the ice (thick ice is more likely to be warm-based). The air temperature above the ice also has an influence. Here is a NASA map of which parts of the ice are probably warm-based. It is based on several criteria, but the uncertainty is considerable:
Sara
March 22, 2018 6:33 pm
Someone please tell me what the hiccups are all about???
There is more than enough paleontological evidence to show that some time in the past, Greenland was completely bare of ice and had forests (long before the Vikings got there), and that it’s gone through several cycles like that.
When the Vikings got there, Greenalnd was green and fertile and habitable. Then it got cold and the snow never stopped coming. (This is the simplified version.) Now it’s going green again, and someone has to panic because it means C-H-A-N-G-E. And change is unacceptable. (Just wanting to make sure I understand it all.)
So, then…. ???
Sara,
You said, “Greenalnd was green and fertile and habitable.” That was along the southern coasts, NOT the interior! However, even today one can find Arctic fox, hares, and ravens. Not much other than that besides a few itinerant polar bears. But there is some vegetation that the hares eat.
Also musk-ox, caribou, lemming and arctic wolf (in areas where they haven’t been hunted out). Actually many more mammals, particularly rodents and small predators, could certainly live on Greenland if they could get there. Greenland was completly ice-covered during the last glaciation. All land mammals has had to walk there by way of northern Canada, crossing a minimum of four ice-covered straits. Not a lot of mammals can do that.
Also about a hundred bird species.
Sleet is coating the front deck, even as I type this, and has bowed the few daffodils blooming over to the ground.
I’m just not ready yet this March 22nd to talk about kilometer size ice cubes….
Sleet can happen any time of year, some place, and often does.
Perhaps, you are in Tallahassee. Perhaps you are in Fergus Falls.
You don’t say, so I don’t know whether to be impressed with the weak stemmed daffodils, or the brave ones reaching up in the cold air.
Meanwhile, here at 2,200 ft. elevation in Kittitas County WA, our daffodils just managed to show earlier this week. NWS thinks it will drop to 25° F. tonight through Sunday night. We’ll see.
John,
I’m SE of Seattle, 560ft altitude. At my location, sleet is a frequent visitor.
As for the daffodils blossoms, what the weather doesn’t pound flat, the slugs are determined to eat.
I do trail work with WTA. Me — mostly from the Issaquah area eastward. Did several between Newcastle and Issaquah.
Those are the times I see your lovely Slugs.
Martin Cornell
March 22, 2018 7:32 pm
“From this geological perspective, the Greenland Ice Sheet is not behaving badly.” True, but NASA is.
Not all of NASA is “behaving badly.” There are many in, or associated with, the Agency who still measure, verify, and validate. Sadly, there are some that don’t, and they put the reputation of a (once?) great space organization in peril.
An excellent report – a couple of observations.
1. Deep ice core taking over several years is possible only because there is no horizontal movement to sheer the drill assembly off. Therefore the cored sections are not contributing to the ‘modern?’ glacier.
2. The odd aspect about all this work for the last 100 years there seems to be a lack of data on the age of the calves leading to the icebergs themselves. When there is glacial activity it is clear that the ice is coming from an elevated source. The question what are the age relationships between the hinterland ice and the iceberg?
3. Basal ice melting can only be attributed to near surface volcanic activity.. Evidence for this is seen in the most common way through the results of acid rock drainage. Here the breakdown of pyrite yields a golden brown to browny red plume. This feature is also noticeable in select locations in Antarctica so there is no doubt that current volcanic activity is occurring at the break between the land mass and the overlying ice.
4. The deepest and oldest core in NGRIP yield a bacteria based DNA profile from pine cone material that could be dated from 532,000 years BP to 830,000 years that showed an ice free temperate climate.
Ice core drill sites are located where lateral movement is minimal. Ice is generally dated by counting layers. The ice flowing into outlet glaciers is deformed and lacks useful layering.
The basal melting isn’t limited to volcanic activity. Heat from the Earth’s interior flows to the surface. This coupled with the pressure of the ice overburden creates the conditions necessary for basal melting.
No ice in Greenland has been dated to 530-830 ka. The oldest ice dated in Greenland is about 150 ka in the NEEM ice core.
The oldest ice dated in the NGRIP core is about 123 ka. They did find some clues in melt water beneath the ice, which may indicate the last time that Central Greenland was ice-free…
Life at the bottom
When the NGRIP team reached the bottom of the glacier last year, they got a surprise – liquid water, formed by Earth’s heat melting the bottom of the glacier. “We were totally awed,” says Dahl-Jensen. Although the melting had removed a few thousand years of climate record, it has also given the project an exciting new twist.
The team has found a fragment of plant matter – possibly bark – in the water, which may have lain under the ice for millions of years, since it was warm enough for trees to grow.
“It is unlikely to be contamination,” says Mulvaney. “My suspicion is that they’ve got something that’s been there since ice first formed on Greenland.” Precise dating of the object could reveal when Greenland was first covered by ice, he adds, giving a glimpse even further back into our planet’s climate history.
The researchers also found DNA in the water, although they have not been able to rule out contamination from the drilling equipment. They are now studying a fresh sample of this water taken with sterilized equipment for signs of ancient life – or perhaps even a community of microbes that is still living there today.
“The odd aspect about all this work for the last 100 years there seems to be a lack of data on the age of the calves leading to the icebergs themselves. When there is glacial activity it is clear that the ice is coming from an elevated source. The question what are the age relationships between the hinterland ice and the iceberg?”
At least in some areas part of the ice calving/melting at the edge of the ice-sheet is as old as the last interglacial, or even the later part of the previous glaciation: http://sci-hub.tw/10.1016/0921-8181(91)90003-F
But it probably varies a lot, the ice-flow is far from uniform, most of the ice is probably Holocene.
Richard111
March 22, 2018 11:28 pm
Nothing to worry about here. About 400,000 CUBIC KILOMETRES of land ice must melt to raise global sea level by 1 metre.
Given current sea level rise over the last decade you can work out how much ice melted off the land, but did it all come from Greenland?
Thanks for a great informative post. Really enjoyed it. However nothing about the claims that GRACE can accurately measure the changes in mass of any ice sheet anywhere seems “well and good” to me.
GRACE can very accurately measure very subtle changes in Earth’s gravitational field. The certainty to which that can be translated into all of the things interpreted from GRACE data is very subjective.
phil salmon
March 23, 2018 2:26 am
It’s good to draw attention to the fact (educate warmists about the fact) that Greenland’s ice sheet almost melted away totally during the previous interglacial, the Eemian.
Curious that the polar bears survived this Eemian hot-house in good shape, but now are apparently threatened by a much smaller warming episode than the Eemian. That’s catastrophism relativity I guess. Just like how all multicellular life emerged and prospered in the Cambrian with 10,000ppm CO2, but now all life is threatened with extinction by the much higher level of 400 ppm CO2.
Our warmist friends like to make ever more extravagant claims about the current industrial anthropocene being the warmest in a thousand years – no, a million years – no, a hundred billion years! https://youtu.be/jTmXHvGZiSY
The Eemian was much hotter. Its sea levels many meters higher. And the biosphere did just fine. Humans were yet to evolve coercive dystopian story-telling.
The NGRIP team now suggests that the ice age started much more gradually and was not linked to a fast glacial melt, even though the ice shows a hitherto unrecognized warm spell 115,000 years ago. The core also reveals that the North Atlantic climate was stable during the last interglacial period, despite being about 5 °C warmer than today. “This provides an analogue for our possible future climate warmed by atmospheric pollution,” says Kurt Cuffey, a climatologist at the University of California, Berkeley.
Here are data for the temperature during the previous interglacial from the various ice-cores and other Greenland sites:
Pakitsoq, Disko Bay: 4 degrees warmer than at present.
Jameson Land, East Greenland: 5 degrees warmer (this is from plant fossils, not an ice-core)
Renland: 5 degrees warmer
NGRIP: 5 degrees warmer
Thule: 4 degrees warmer (insect fossils, not an ice core)
NEEM: 8 degrees warmer
You’re right that the Eemian was a lot hotter than even peak Holocene warmth, during its Climatic Optimum, which ended about 5000 years ago. But the GIS wasn’t close to total meltdown during that interglacial. At the end of the 16,000 year-long Eemian, its Southern Dome was maybe 25% smaller than now. Other studies find more melting, but IMO this estimate is well supported. The Northern Dome of the GIS wasn’t affected as much.
Interesting article beautifully illustrated. I agree with nearly all, but am uncertain about this: “The GrIS may have actually been smaller than it currently is from 35 ka to 15 ka.”
The evidence for very large continental ice sheets at the time doesn’t agree well with this assertion, and the figures you show from Bo Vinthers et al. data on elevation indicate that GrIS was taller at the time.
It does accumulate more during interglacials, but it also melts more and squeezes out more, leading to a larger ice replacement so old ice disappears faster. That most of the ice is recent doesn’t mean that GrIS was smaller at the Last Glacial Maximum. I personally find that hard to believe.
That’s why wrote “may have actually been smaller”… Because I am also uncertain about that possibility. All of the basal melting scenarios have the GrIS contracting over that time period. Only the 2 or 3 highest basal melting scenarios have it contracting to where it was smaller than today.
The Vinthers elevation reconstruction starts at the beginning of the Holocene. So, the basal melting scenarios don’t really conflict with it.
The odd thing about Camp Century is that the elevation has fallen so much since the end of the Pleistocene, yet the Camp Century ice cores don’t seem to have an major Holocene unconformities. So, most of the elevation loss has to be due to basal melting and/or deformation and flow of basal ice.
Camp Century is fairly close to the coast (much closer than any other ice-core except Renland) and the ice profile is steep, the level has probably fallen as the ice-edge retreated from the shelf edge to its present position.
Dave
March 23, 2018 6:52 am
Yeah, but how many Burj Khalifas ice cubes is it? Or how about using the Jeddah Tower. How many ice cubes is it then? Wonderful thing this science.
Great article. Nice integration of GPR visualization of geologic time and recent ice volume measurements. Did you see where the engineers want to geoengineer ice loss by building artificial islands and berms. https://www.nature.com/articles/d41586-018-03036-4.
Cloning (non-avian) dinosaur would be an extremely interesting and not at all dangerous experiment in my opinion. Unfortunately there is nothing to clone them from. DNA doesn’t survive for 65 million years (unless we can find some area that has been continuously frozen for that long, perhaps the Gamburtsev mountains?).
I agree that cloning Mesozoic dinosaurs (presumably Cretaceous) would be wonderful, but doubt that even in Antarctica there are remains which have been continuously frozen for 66 million years. The Gamburtsev Range probably had glaciers from at least the Late Eocene, but that still leaves a gap of some 30 million years during which climate was temperate there.
The recently described Antarctic iguanodont Morrosaurus lived during the Maastrichtian, last age of the Cretaceous. So did its ornithopod kin Trinisaura. The ankylosaur Antarctopelta probably didn’t make it to the end of the Cretaceous. Presumably some theropod carnivore preyed upon Morrosaurus and Trinisaura, likely an abelisaurid.
Recent opinion is that there were probably transient ice-caps in inland Antarctica even in the Cretaceous to explain sudden sea-level changes, and there were tidewater glaciers in East Greenland by the late Eocene: http://lib.gig.ac.cn/local/nature/446,%20176-179.PDF
Mountain glaciation in inland Antarctica presumably goes back well before that.
Tty,
You’re a lot more up to speed on subglacial Antarctic mountains than I. For sure there were montane glaciers on Antarctica even in the Cretaceous, whether in the Gamburtsev Range or not. The Gamburtsevs have risen and fallen repeatedly during their long history. The Maastrichtian was cooler than the balmy mid-Cretaceous.
They’d have to have been frozen at liquid nitrogen type temperatures for the DNA to have survived for 65 million years.
Even then it’s doubtful.
Over that kind of time, even low level radiation damage adds up.
Mark,
You’re probably right. The oldest DNA of which I know is from a 400,000 year old plant.
Any surviving segments of DNA from the Cretaceous would at best be fragmentary. Hence, to clone a dinosaur, more than one sample from the same or closely related species would be needed.
Thus the odds are decidedly against obtaining a complete genome that old. Maybe bits could be filled in by modern birds, but then you’ve got a hybrid, in the unlikely case that such a dummied up clone would be viable.
The closest we’re ever likely to come to a non-avian dinosaur is Horner’s “dinochicken” project, reverse engineering a dinolike chicken by turning on its suppressed genes for teeth, long bony tail, claws, dino posture, etc. Such a “chickenosaurus” of course wouldn’t belong to any actual non-avian dinosaur species, being still a chicken genetically, but would nontheless be an interesting evolutionary experiment.
Who am I to argue with Michael Crichton? It’s just that Jack Horner has long hair and a beard and Alan Grant has short hair and is clean-shaved.
Dr. Jack Horner…
Dr. Robert Burke (T Rex snack)… http://www.jurassic-pedia.com/wp-content/uploads/2011/04/burke.png
Dr. Alan Grant…
True. Tonsorially and in terms of follicles, Grant isn’t Horner. Neither in his behavior nor accent. But that’s movie magic for you.
Insofar as Horner has hair, it is indeed characteristically long. And he enjoys Shakira, which I’m pretty sure that Grant wouldn’t.
One would think that if Greenland were melting at an unusual rate, it would show up in sea-level change. But I suppose the meltwater can “hide” in the deep ocean, just like the supposed warmth…. /sarc
JimG1
March 23, 2018 7:56 am
David,
Excellent article! I grew up about 15 miles south of Lake Erie in northern Ohio. The remnants of the advance and retreat of the glaciers there were abundantly visible on the surrounding countryside, including my backyard. http://www.ohiohistorycentral.org/w/Ice_Age_Ohio. Now live in northern Wyoming where our Bighorn Mountains were one to two miles higher, depending upon whose study you read and when they’re talkjng about, due to glaciation. I find the subject fascinating.
Regards,
JimG1
Thank you, David Middleton, and commenters for an excellent scientific discussion — one of the gems of WUWT. Beautiful enough to save for colleagues, friends and family who are interested in researching truths, and the interesting variety of geological/climate states of Mother Earth.
jsuther2013
March 23, 2018 3:13 pm
I read the article but not the comments. For perspective, why not put the zero point on some of those graphs? That would show just how trivial the variation really is.
Because Greenland has been continuously glaciated since at least the Mid-Pliocene. The lowest volume of the GrIS over the past 250,000 years, supported by any evidence is about 2 million km^3.
“Earliest Pleistocene” would be more correct if you refer to an ice-cap covering lowland areas as well. The Kap Köbenhavn formation seems to be the last time most of Greenland was ice-free, and that was about 2.4 million years ago.
The highlands of East Greenland have been glaciated much longer, at the very least since the Late Eocene, 40 million years ago. That is when IRD (Ice Rafted Debris) first shows up in Fram Strait, which means that there were tidewater glaciers.
The minimum Pleistocene volume may well have been somewhat smaller than 2 million km3. IRD studies have shown that during the MIS 11 interglacial the icecap probably separated into a northern and a southern dome and (admittedly loose) dating of the sub-ice sediments at Dye-3 also indicates that it may have been ice-free at this time. Dye-3 is close to the “saddle” between the two major domes.
For those who wonders how IRD can tell how large the ice-cap was, Greenland consists of several geological provinces with distinct rock types and –ages. IRD consists of rocks that are being actively eroded by glaciers calving into the ocean. During the Eemian (MIS 5e) interglacial IRD off south Greenland consists of rock from all provinces, indicating a continuous (or at least almost continuous) ice cover from north to south. During MIS 11 rocks from one province (near the “saddle”) are missing, strongly suggesting two separate ice-caps. The absence is not absolute proof though, since there may have been ice inland that did not calve into the ocean.
It’s funny how IRD or dropstones are evidence of colder climates… yet the warmunists claim that the increased calving of icebergs is evidence of Gorebal Warming.
Yogi Bear
March 23, 2018 5:03 pm
The cross section nicely helps in explaining why the global sea level was higher 6000-8000 years ago.
@ David Middleton. You know about 1000 times what I know about glaciers. I have asked this question many times here on WUWT.
Why are the largest and longest tidewater glaciers in the northern and southern hemispheres not retreating but advancing, as are the smaller mountain glaciers (some, not all) ? I have never gotten a clear scientific answer to this question. Sorry to use Wackapedia as a ref., but you can find this/these results in other links.
Brüggen Glacier: “…Now about 66 km (41 mi) in length, it is the longest glacier in the southern hemisphere outside Antarctica…” https://en.wikipedia.org/wiki/Br%C3%BCggen_Glacier
Hubbard Glacier: Hubbard is the largest tidewater glacier in North America… https://en.wikipedia.org/wiki/Hubbard_Glacier
Taku Glacier: “Taku Glacier is a tidewater glacier located in Taku Inlet in the U.S. state of Alaska, just southeast of the city of Juneau. Recognized as the deepest and thickest alpine temperate glacier known in the world, the Taku Glacier is measured at 4,845 feet (1,477 m) thick.[1] It is about 58 kilometres (36 mi) long, and is largely within the Tongass National Forest.”
It is the largest glacier originating in the Juneau Ice field, also a tidewater glacier. https://en.wikipedia.org/wiki/Taku_Glacier
All of these glaciers mentioned are advancing. Most start at very high altitudes.
There are other large tidewater glaciers in Alaska and South America which are advancing.
My basic question would be: Why are these largest glaciers advancing, while many (not all) smaller lower mountain glaciers generally retreating?
At a guess: more precipitation. This is at least as important as temperature. For example there is considerable evidence that the EAIS (East Antarctic Ice Sheet) thickens during interglacials, and very strong evidence that glaciation in the Transantarctic Mountains was much more extensive during the warm Pilocene.
Also note the virtual absence of glaciers in Eastern Siberia, now and during the ice-ages, despite the lowest temperatures outside Antarctica.
My personal analogy is to the icemaker in my freezer. Does it overflow with ice when the temperature in the freezer is too warm? No.
Glaciers are always moving. They may move at a glacially slow pace, but they don’t often sit still.
The “consensus” school of thought says that Greenland’s outlet glaciers are moving more quickly due to increased lubrication from the drainage of glacial lakes formed by increased surface meltwater. The meltwater percolates down through fractures in the ice to form moulins… https://en.m.wikipedia.org/wiki/Moulin_(geomorphology)
This leads to an increase in the rate of iceberg calving and frantic headlines about Manhattan-sized icebergs.
The funny thing is that when I took geomorphology about 10 years before Al Gore and James Hanson invented Gorebal Warning, increased rates of iceberg calving were indicative of colder climates. “Dropstones,” out-of-place rocks in marine sediments, carried out to sea by icebergs and dropped to the seafloor as the iceberg melted, are generally associated with colder climates. See my discussion of Jakobshavn Isbrae, Greenland’s largest outlet glacier, towards the end of this post… https://wattsupwiththat.com/2012/08/17/2012-the-year-greenland-melted-aka-alarmists-gone-wild/
Off the top of my head, I don’t know the specific answers to your questions. I’ll see what I can dig up.
Most, but not all, glaciers have been retreating since the end of neoglaciation (~1850). For about 5,000 years before, most were advancing, reaching their maximum Holocene extent during the Little Ice Age.
I’ve always heard the Brüggen called the Pio XI glacier.
whiten
March 24, 2018 12:08 pm
I will offer another line of thought here.
The actual assessment of the Greenland ice sheet as it stands, heavily relies in the history of ice, which when used produces an artifact that actually makes that ice history very dubious and not quite acceptable unless crazy acrobatics in thought and rationale considered…..makes really difficult to accept.
That assessment there, in consideration of the actual ratio of the mas of “blue” ice versus “green” ice happens to be that way due to a history of ice that consist with a glacial period of a ~100k years span versus a warm trend of ~10k years.
This is a “product” that mainly spring out as shown due to the ice history when trying to mend it with the rest of the data, and from the outset it confuses the ice history, as per that history of ice to be correct a lot of silly acrobatics are required to maintain it, while actually the prospect of that never being possibly achievable.
That ratio is not possible, but is considered as such because while there is not much you can do about the overall mas of ice and the age of ice, otherwise you have to depart from the ice history as it stands….
That ratio is a calculated estimate very much weighted by the history of ice, aka the ~100k years glacial period, and, leading to a very “stiff” ratio condition between “glacial” ice and “non “glacial” ice, where not much room or tolerance there in the variation of the conditions, meaning that any little variation subjecting out side this term or projection outside this term will clearly have to be considered as a result of a non natural force.
All this, from what I can see, it happens to be this way simply as a result of refusing to reconsider the history of ice.
The only point that can be making a difference if reconsidered.
When you look at that “green” ice mass and the ratio of it to the “blue” ice mass, you are looking at possibly one of the proofs of the ice history refutation, as that history stands thus far, a proof that refutes 100k years glacial periods.
And that ratio can not be explained or maintained unless crazy acrobatics considered, like being able to explain and be supported by data and rationale, how Greenland not gaining any extra ice during a glacial period…..and also when Greenland in a warm period during interglacial must have an average temp of +10 to +15C for at least a 5k years duration…..
and still this may not be good enough to support the estimation of that ice ratio between “blue” and “green” ice .
cheers
Sorry tty, but is the only “key” that you can play to get out of the conundrum there, the rest of the “keys” change no much, provided that you consider the problem with the conundrum there….otherwise please do stick with it….but consider my point, the produced artifact of the ratio of glacial versus interglacial ice as per that ice history stands as a refutation of the process where all these “keys” become non valid.
But still considering to adjust for the only “key” that will make the difference, the ice history, can allow for a better produced artifact, a very much different ratio which may validate the process and the “keys”
Hopefully you get my point.
Not considering the change of the ice history, means a stack condition with the conundrum….
That happens to be the only one way out…as far as I can tell.
thanks
cheers


I love a cool set of graphics. Excellent. Oh, pun intended.
What is the quality of data starting period and end period; what is human activity impact on starting period and end period.
Dr. S. Jeevananda Reddy
we’re not really sure , when with all our marvelous knowledge of the world we’re not sure whether there’s magma affecting the ice yet
Excellent and informative. One of the best articles here in a long time.
Many thanks.
It is interesting how (indicated by the graphics) 10,000 years ago there was almost 1/3 less ice there than today and a clear demarcation between Ice that is 7-10,000 years old and Ice that it >90,000 years old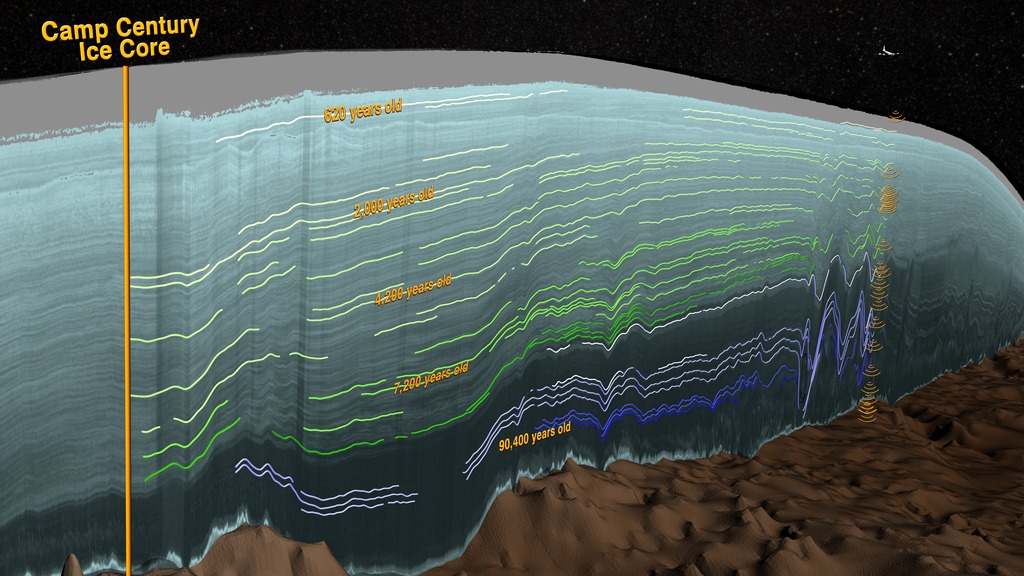
It is as if 10,000 years ago a massive amount of ice melted away…
and the world didn’t flip over
and the Polar Bears didn’t starve
and the climate didn’t tip
and the Arctic MUST have been SIGNIFICANTLY WARMER than today
The reaso the ice volume was smaller in the Early Holocene is not only that the Arctic was warmer (which is true), but also that the icecap was larger in area and calved into the sea. Such an icecap always has a flatter profile. As the ice margin retreated onto land where the ice must melt “in place” rather than calving the profile grew steeper.
There is actually good evidence that during the Eemian when the icecap was perhaps a third smaller in volume, the central part was actually slightly thicker than now.
Cool!
Let me see if I get this. During the Pleistocene, it didn’t snow much (too dry), so not a lot of ice built up even though it was cold. Then as the Holocene kicked in, it was still fairly cold, but there was more snow, so the GrIS grew rapidly. Now, well into the Holocene, it is finally too warm and the GrIS is shrinking. Sounds like it is doing what it always should.
Just think when the GrIS is gone and the land is usable and occupied. People will think like we do “good thing that ice is gone. Can you believe the ice was km thick right here where our house is?! I still have a hard time imagining the Laurentide ice sheet covered my home.
The Laurentide ice sheet wouldn’t cover your home… It would grind it into very fine grained particles… LOL!
Thank the Laurentide and Cordilleran ice sheets for the wonderful loess farmlands of North America. And the wind.
The mills of the gods grind exceeding fine.
David Middleton – March 22, 2018 at 3:45 pm
Me thinks the above comment just might incite the asking of ….. “Which came first, the chicken or the egg” …… type of question.
For instance, did the one (1) mile thick Laurentide ice sheet that covered New York City, Long Island, etc., some 20,000 years ago actually form there in place as a result of thousands of years of snowfall ……… or did it actually form farther to the north in Canada and then slide MELTINGLY & GOUGINGLY “downhill” past NYC and LI into the north Atlantic Ocean …..due to the force of gravity?
Or was it the “post-glacial melting” remnants of the one (1) mile thick Laurentide ice sheet that once covered New York City, Long Island, etc., some 20,000 years ago …… that was doing the “SLIDING & GOUGING” of the topography in question?
It was both, but mostly the latter. Long Island is a terminal moraine.
https://3dparks.wr.usgs.gov/nyc/moraines/quaternary.htm
Here is one of those Pleistocene Glacial Deposits in Pennsylvania…Funny that the article doesn’t even mention it as a glacial deposit. But you can hear the sounds of the rocks ringing. I took my family with a bunch of hammers there and you could hear these same sounds:
https://www.atlasobscura.com/places/sonorous-stones-ringing-rocks-park
From Wackapedia (sorry, I have always called it that, probably from around the time I knew that the global warming thing was a sham):
“…Although the Newark series diabase sills crop out in a belt throughout the length of the Appalachian Mountains, only a narrow band of outcrops in southeastern Pennsylvania and New Jersey develop ringing rock boulder fields. The probable reason is that these areas were at the southern edge of the Pleistocene glaciers, and would have been subject to extreme periglacial conditions. Periglacial boulder fields are a common feature in Pennsylvania and New Jersey…”
My alma mater in New Haven CT (not Yale) sits in the shadow of a Triassic diabase sill (West Rock). This particular outcrop was covered by the Laurentide ice sheet and exhibits many glacial features:
Forgot to add link… https://www.geocaching.com/geocache/GC128TJ_west-rock-ridge-in-new-haven
Thanks, David M, I hadn’t seen that graphic before now.
The Hudson Canyon has always intrigued me because it explicitly shows the extent of the meltwater “outflow” erosion of the Hudson River during glacial periods when sea levels were 450+ feet lower than they currently are.
A great view of glacial scouring can be seen from the top of Cadillac Mountain in the Acadian National Park. Cadillac Mountain and several other mountains that are in view are a clear demonstration that the Laurentide Ice Sheet formed to the North and ground its way to Manhattan where it displaced the prehistoric progressives of the day.
They say that Antarctica is losing ice when overall it is actually gaining ice.
That’s what I have been seeing lately. The same for the Greenland Ice Sheet…both are gaining ice volume recently…(Do I have to provide links to scientific papers?)
Greenland does appear to have gained ice in 2017.
Catch ya on the rebound.
Between WW2 and 1988, part of Greenland gained 260 feet of ice.
It gained ice at the top and lost it from the bottom. The geothermal heat flow melts the ice from the bottom.
Some of it melted, some of it flowed out as new glacier material.
That would have mangled Glacier Girl.
It hadn’t reached the part where glacier flow started.
For thems as ain’t hip to the max:
https://en.wikipedia.org/wiki/Glacier_Girl
Glacier Girl is as hip as it gets.
True, that!
When I get back off the road I’ll post a little essay I wrote based on source material from WW II that explains why P 38s were flying the northern route in the first place and why the effort was ended.
Most of it flowed away and calved into the sea. DMI has a good diagam that shows how it works:
David Middleton
March 22, 2018 at 4:17 pm
It gained ice at the top and lost it from the bottom. The geothermal heat flow melts the ice from the bottom.
———————
It seems like the numbers used and the explanation given in the back bone of it all, it puts the actual natural factor in percentiles at about, 60-70% from below versus 30-40% from above, on the amount of ice mass subject to melt, the amount that consist as green in the graphic above.
A clever attempt to show that a possible anthropogenic signal impacting Greenland Ice sheet, a “straw that may brake the back of the camel”, so to speak, can be claimed.
But still this consist as nothing burger as per AGW support, as it requires data that clearly support that the thermal force below the Ice in the land is strong and very strong as expected to be, in a 60% melting path.
Which will put Greenland in a special position compared to the rest of the globe.
And also there should be a better explanation why there should be not more ice gain to Greenland during a glacial period when in the same time North America gows full Laurentide.
Another such explanation will put Greenland to a further special grounds about the climate signal, where the extraction of the anthropogenic “straw” will be just silly.
That position is a silly stitch up burger, which requires significant explanation that makes the case of anthropogenic forcing in this particular aspect meaningless, as Greenland under such intricate explanations becomes very special in its own with not much help towards AGW, where G stands for global.
Otherwise attempting to change the numbers will move the percentiles move towards and growing in favor of the melting mass, more as for and from the surface, which defaults the melting observed so far within the natural limit.
Mathematically, from my position and understanding, the extraction of an anthropogenic forcing from this angle happens to be impossible, even when seeming so tempting to have a go at it.
What in a essential here, is a stitch up stage where the melting of ice from above is considered as more extensive than expected or more extensive than supposedly it could be as per nature, when this happens to be stitched up at some silly value as per nature at ~60-70% from below versus 30-40% from above.
When a claim like this could produce that “straw”…..but it still fails by default, as far as I can see and say.
Hopefully this will be understood as put.
Thanks
Ok as promised above for anyone interested:
https://www.warhistoryonline.com/military-vehicle-news/15-p-38-glacier-girl-pictures.html?utm_source=dlvr.it&utm_medium=facebook&src=fba&type=wca&page=who
The reason those aircraft were there was because of the Battle of the Atlantic. For the US to become engaged it had to get it’s fighting forces and their equipment to where the action was. With the German U-boats sinking so many allied ships during 1942 and early 1943 shipping, especially across the N Atlantic, was a big problem. The allies would not truly gain the upper hand in the Battle of the Atlantic until May of 1943.
In April 1942 the US Army Air Force (AAF) began it’s initial deployments to England which was the beginning of what would be come the Eighth, Ninth, and Twelfth Air Forces. The heavy bombers, at this point all B-17s, could fly over on their own but what about fighter aircraft? At the time the Lockheed P-38F and G models were the only combat worthy US fighter aircraft ready for deployment that had the range to make it to where fighter aircraft were needed.
They would be staged across starting from Goose Bay, Labrador with stops in Greenland and Iceland before landing in Scotland. Of course this had to be done over vast stretches of deadly cold water across a region of the world with some of the worst and least predictable weather on the globe during a time when the tools for weather forecasting and navigational aids were nothing like what we have today. Add to that the Germans broadcasting false navigation beacon signals.
Because of the navigation involved and the need for long range CW communications a B-17 was assigned to be the mother ship for each flight of six P-38 fighters.
This was a wise decision though the fact that out of the first flight of B-17s attempting the flight across the N. Atlantic three were lost (crews recovered) gave reason for some worry.
The situation was so desperate that the AAF determined that a loss of 10% of the aircraft and pilots in transit would be an acceptable loss.
In the end a total of 179 P-38s made it across the N. Atlantic in 1942 out of 186 that attempted and only one pilot was lost. The N. Atlantic route was considered closed during the winter months but it was a quite impressive performance for the time.
By the summer of 1943 the Battle of the Atlantic was well on the way to being won and the miracle of production from US yards was beginning to show up. It was much cheaper to ship the aircraft and a scheme for carrying them on the decks of oil tankers worked so well that the numbers being shipped were more than adequate so there was no reason to ferry the P-38s over the great white north again.
However if things had not gone well and the allies had not gained control of the shipping lanes the Army already had a contingency plan to ferry 4,000 aircraft across the Atlantic in 1943.
BTW the F & G models were the first combat worthy P-38 models but still had plenty of problems including compressibility. In later models all the problems were ironed out but before then the US almost decided to quit producing them in favor of more production of more recent designs. William Knudsen the man who above all others can be credited with coordinating the effort to make Roosevelt’s “Arsenal of Democracy” a reality took a trip out to the Pacific Theater to meet with the military leaders there to determine what war materials they needed most. Army Air Force General George Kenny convinced Knudsen of how important the P 38 was for operations in the Pacific and thus the P-38 was the only fighter aircraft that remained in front line service from before the war until after VJ day. The fact is that the top two US aces of WW II, Dick Bong and Tommy McGuire got all of their kills flying P-38s.
The first 5th AF air-to-air victory for the P-38…
http://cobraintheclouds.com/majorrobertlfaurot.html
Sadly Robert Faurot was killed in action a short time later during the Battle of the Bismarck Sea.
The 5th AF and “Kenny’s Kids” are one of the most interesting subjects of WWII history.
RAH,
Thanks!
Not to take anything away from Pacific Theater P-38 aces, they were flying a heavily-armed, bomber interceptor against Japanese fighters, which were flammable kites.
Good analysis of German subs’ effect on the B-17/P-38 route.
PS: McGuire probably died because of his desire to surpass Bong.
IMO the even greater heroes were those Marine and Navy pilots who fought the Empire of Japan to a standstill in 1941-43 in inferior aircraft like Wildcat and Dauntless.
The Cactus Air Force… Indian Joe Bauer, Marion Carl, Joe Foss… amazing true stories.
David,
My brother is the world’s leading expert on naval aviation.
Foss and Carl were among his best friends. He was supposed to visit Carl when the slimeball who murdered him invaded his house, but our mother had just died. Oregon still hasn’t killed the subhuman felon. Carl was suffering from Alzheimer’s at the time, or the mutant would have died then and there.
Carl’s murder was infuriating.
PS:
Unlike liar Pappy Boyington, “Injun Joe” Bauer was a genuine hero.
Boyington and the Black Sheep certainly got more publicity than they deserved; but, despite all of his flaws, Boyington was a great fighter pilot and squadron leader… in his own unconventional ways. The fact that Boyington accomplished what he did, despite a total disdain for military discipline is kind of amazing.
“PS: McGuire probably died because of his desire to surpass Bong.
IMO the even greater heroes were those Marine and Navy pilots who fought the Empire of Japan to a standstill in 1941-43 in inferior aircraft like Wildcat and Dauntless.”
In my view WW II history and historians have given short shrift to the whole SW Pacific campaign in all of it’s aspects as compared the South and Central Pacific Campaigns and those in N. Africa and the ETO. In fact the only campaigns that have gotten less print than the SW Pacific are those that took place in the CBI (China Burma India Theater). Both are treated as back waters compared to what have been deemed the main shows. The fact is that the Army carried out far more amphibious operations in the Pacific during WW II than the Navy did, engaged far more Japanese troops than the Naval operations did, and actually had more vessels in numbers but not tonnage than the Navy did in the Pacific but the average person would have no idea of these facts based on the most popular histories that have been written.
The SW and S Pacific campaigns complemented each other right up until they isolated Japanese forces on New Britain. Neither could have done it without the other during those darkest days in 42 and early 43 but Watchtower (Guadalcanal Tulagi) and subsequent operations in the S Pacific have gotten far more press because, in part, it was there during that period the US Navy engaged in more surface and carrier against carrier actions than at any time in their history and because of the desperate nature of the fight for Guadalcanal.
The 5th Air Force in the SW Pacific theater, in particular, is fascinating. Kenny’s Kids (like Bong, McGuire, Lynch, etc.), Pappy Gunn and his Commerce Destroyers (skip-bombing B-25 gunships) and Airfield Busters (para-fragging A-20 and B-25 gunships).
“Between WW2 and 1988, part of Greenland gained 260 feet of ice.”
No, 260 feet of (compacted) snow. It is only at about 300 feet that the pressure gets high enough for the the compacted snow to turn into solid ice.
Chimp March 23, 2018 at 6:57 pm
…..”Not to take anything away from Pacific Theater P-38 aces, they were flying a heavily-armed, bomber interceptor against Japanese fighters, which were flammable kites.”…………..
True the Japanese aircraft at that time lacked armor and self sealing fuel tanks. Their flammability however was something that resulted from the pilots eventually learning the type of ammunition to use. And those American pilots often flew 100s of miles before they got into combat and were fighting the some of the best pilots in the world at the time. P-38s took on the IJN pilots frequently during the fight to neutralize Rabul and they were prewar trained. The best Nippon had. Tommy McGuire died trying to save one of his pilots from an Oscar flown by Akira Sugimoto, one of their top aces.
https://www.pacificwrecks.com/aircraft/p-38/44-24845/mason/index.html
Sugimoto was experienced, but not an ace, let alone a top one.
The whole fighter sweep was initiated by McGuire with the express purpose of upping his tally.
That’s exactly what fighters do. Bong and McGuire in a friendly but tough competition. They flew together until Bong was grounded and sent home. Then Tommy was grounded to prevent the chance of his surpassing Bongs record before Bong had received the MOH. And Sugimoto was most certainly a top ace:
http://456fis.org/THE_DARK_SIDE_OF_FAME_THOMAD_B._McGUIRE.htm
“Unfortunately for McGuire, the pilot he attacked was NAP 1/c Soichi Sugita, at that time the top-scoring surviving IJN ace with 80-odd kills scored over Rabaul, a master at the controls of a “Zero”. In the ensuing fight, Sugita managed to shoot down one of McGuire’s wingmen, and severely damage the other two. He then went after McGuire. Low over the jungle, heavy with fuel, McGuire stalled out trying to get away from Sugita and crashed to his death, a pointed example of the dark side of the lust for fame and glory.”
Should have said that Bong and McGuire OFTEN flew together.
In the ‘Forked-Tailed Devil: The P-38’
Air Force Historian Martin Caidin also says that Akira Sugimoto was an ace with 80 kills before his death.
One other note: Hap Arnold declared that without the P-38, Torch, the invasion of N. Africa could not be carried out. The Allied pilots flying in the early stages of that campaign in N. Africa suffered deprivations ,odds, and losses every bit as severe as those suffered by the Marine pilots on Guadalcanal did. In some cases they didn’t even have tents and slept on the open ground between sorties during the first few weeks of that campaign.
It should be understood that no country in the world during the whole war other than the US could have carried out two major amphibious campaigns across the vast expanses of the worlds two largest oceans as Torch and Watchtower did in late 1942. Both initiated less than a year after the attack on Pearl Harbor.
The P-38 performed best in hot climates.
Yes it did until they ironed out the bugs in the late models. Before that they had big problems with the turbos and engines and pilot comfort at high altitude. And then there was the problem of compressibility which prohibited the pilots from following the German 109s and 109s in steep dives. For these reasons Doolittle decided to reject the P-38 as the primary long range escort fighter for the 8th Air Force and go with first the P-47s and then the Merlin powered P-51s as soon as they became available. Many a historian and WW II aviation buff has wondered what would have happened had the decision been made to produce P-38s with Merlin engines instead of retaining the Alison. They tried a prototype but decided to dedicate the US Packard Merlin production to the single engine P-51.
Concerning firepower. The P-38 with it’s guns in the nose made an excellent gun platform as compared to fighters with all or most of their machine guns or cannon in the wings.
For those interested which haven’t seen it. The late Jeff Ethell takes you on a walk around and flight of a late model P-38.
https://youtu.be/Y3nddCJbcdI
Since in the wierd world of ice and snow we know that both can increase or decrease in response to either cooling or warming.
So if Greenland ice mass is decreasing we don’t really have a clue what this means – either warming (snow melting) or cooling (less snow falling).
And… The myriad assertions of recent ice mass loss are heavily dependent on deglaciation scenarios and glacial isostatic adjustments (GIA)… which have far more uncertainty than the myriad assertions of recent ice mass loss… 🤔
The GPS data is rock solid… but, the GIA is also dependent on deglaciation scenarios and assumptions about rheology of the crust and upper mantle.
The best puns are intentional… 😎
Rob, as the data is so good, can you supply the academic qualifications of the people who took the real-time measurements of the GrIS way back at the LGM?
No, I didn’t think you could. Methinks there were not too many Inuit there to see the ice sheet 12,000 years ago, let alone measure it’s size. Modern day estimates of it are just guesses, not data, & the errors involved in the calculation render it useless for anything other than navel-gazing speculation.
The estimates are based on scientifically valid assumptions drawn from geological evidence… But they are not direct measurements.
12,000 years ago, the ancestors of the Inuit were way back in Siberia.
Actually the GPS data are fairly good for Greenland – there is solid rock available almost all around the periphery. However there is still some uncertainty about GIA under the central part of the icecap, and about volcanic activity/heat flow. However it seems clear that the Greenland icecap is losing mass.
This is vastly more uncertain in Antarctica. The “raw” GRACE data does not differ significantly from zero, so the putative ice-loss is 100% GIA adjustment. Furthermore there are several GIA models that differ by a factor 3, and there are very few GPS station. To finish this tale of woes none of the GIA models come even close to matching the GPS measurements.
The only non-GRACE data (from Icesat) suggest that the ice is actually growing, but have large uncertainties too, though they are much less affected by GIA.
All of this banter is irrelevant. Probably the major reason that the Greenland ice sheet ebbs and flows is the volcanic hot spot that Bradley’s linked study talked about. Until the researchers can pin down exactly how much melting is due to the hot spot they are just whistling in the dark. If there was real global warming we would see the same melting everywhere. We dont see the same melting everywhere because to melt these sheets and Antarctica would take a hell of a lot more temperature increase than the fraudulent temperature increase that even the IPCC says there is. I am not worried even if everyone of the 200000 glaciers all melted to the very last drop of ice. It would only increase sea levels by 40mm. Anyone that thinks that the Antarctica and Greenland ice sheets are going to melt significantly needs to move to another planet. Start packing now and I will pay for your rocket ship ticket; one way of course. What a bunch of idiots we have on this planet !!!!.
If you read one of the posts below it proves that the icesheet is melting from below. That isnt because Greenland is sitting on the ocean. Greenland is sitting on land. That is why the word land is in Greenland. Sheeeeeeeeeeesh. The hot hot hellishly/ sarc hot air from global warming is NOT melting the ice sheets. Volcanic ridges under Greenland and Iceland are what is doing it. Every researcher has to attribute global warming as a cause in any of their reports or else they wont get peer review pass. The result is that this makes every climate researcher look like an idiot. This global warming hoax is really getting to me now. We are in a world controlled by the OZ police.
true enough. However, this melting (end flow, where relevant) is not new, and I assume it has been, is, and will be pretty steady. So what matters for the mass-change is how much new ice is formed. That is, how much is it snowing.
Ice loss comes from three processes:
1. Basal melting due to the combination of geothermal heat flow and pressure of ice overburden.
2. Surface melting, primarily in lower elevations.
3. Calving of icebergs from outflow gaciers.
4. There is a number 4: – sublimation, transition from a solid ice directly to water vapor (a solid to a gas). I don’t have a figure, but over the vast dry area of Antarctica this should be substancial and measurable:
https://www.bas.ac.uk/data/our-data/publication/the-seasonal-cycle-of-sublimation-at-halley-antarctica/
From the above:
“…During the winter months, sublimation losses are negligible, but between November and March sublimation removes around 25% of the snowfall. Surface sublimation and sublimation of blowing snow make roughly equal contributions to this total. Estimates of sublimation using micrometeorological data agree well with estimates made from daily snow-stake measurements…”
That is also what happened at the top of Mt Kilimanjaro, which is normally below freezing.
I lumped sublimation in with surface melting… Although, it is a distinct process and a major factor in ice loss.
I kind of figured it was actually part of number: 2. Surface Melting…but I guess not really a major/measurable factor…
Surface melting, sublimation and ablation all fall into the Surface Mass Balance category.
I guess they will have to measure the temperature at these areas of concern, rather than theorize about the cause.
The growing and shrinking of the ice sheet in the distant past vs. present doesn’t mean much without a rate. I’m afraid that despite all the “cool” graphics, I’m not really sure what the point of this exercise is. I’m sure I’m missing something.
“If these predictions come to pass, the researchers… [blah, blah, blah]”
What does this mean? The predictions won’t come to pass, or we don’t have to worry about hazardous waste being leached into the environment, or it’s not worth worrying about because it’s so far in the future? Is there a particular reason you ridicule this paper, David?
“But meltwater percolating down through the ice sheet could pick up and wash abandoned waste downstream decades sooner.” This doesn’t seem to me to be very funny even if I’m not around to see it.
Why is it that skeptics have no problem using models as evidence to support their ideas but say that mainstream AGW models are useless and wrong?
Did you read anything other than the hilarious Science article about Camp Century?
Most of are able to realize that some models are useful, and some aren’t.
Each model has to be judged on it’s own merit.
Models used to design circuits and buildings (not the same models mind you) are useful. Precisely because their output has been compared against reality and found to match.
Climate models, when compared against reality have failed miserably.
KS,
Well, if you want something to worry about, do an online search for Camp Tuto. Tuto was the staging area for building and supplying Camp Century. A tunnel was driven into the Snout of the glacier a few miles outside of Camp Tuto. A reservoir was created below the tunnel by melting the ice and pumping the water out. It was then filled with (as I recollect) about 50,000 gallons of diesel fuel to supply the generators inside for heating and electricity. When the Army pulled out about 1968, they just left the diesel fuel behind, as well as the sewage from the GIs living there and in Camp Tuto. The logistics and cost were considered prohibitive to remove it all. While there, I was told a story about how one bored GI filled out the paper work for 100 power lawn mowers. After they were delivered, the camp commander decided that it was more expedient to just put them out on the ice of a nearby lake and let them sink to the bottom during the next Spring thaw, rather than ship them back to the States.
Camp Century is of course not much of a problem. Ultimately (several thousand years hence) it will calve into the sea. It will not “melt out”. Examination of the sediments at the bottom of the Camp Century ice core shows that the site has not been ice-free for at least 1.5, and probably 2.4 million years
http://adsabs.harvard.edu/abs/2014EGUGA..1610721F
This is not really surprising since this area actually is the snowiest in all of Northern Greenland. So, about the time forests start growing in Northern Greenland, then Camp Century will be melting out.
What is your problem Kristi, Iceland has more ice than the last ice age. Do a bit of real thinking and research and you will find that old sol when he has a sabbatical has other tricks up his sleeve. They include an increase in volcanoes and the heat in the hot spots all over the world. Iceland as is the Antarctic are getting their bums warmed, this is normal. Strangely our weather and climate over the entire world is normal also.
I did mean Greenland sorry.
“I’m sure I’m missing something”
Yes Ms Silber, we share your confidence in that.
It’s still using GRACE data, which is in reality a disGRACE.
The best guess adjustments for iso-static rebound are several times larger than the ice melt they claim to have identified.
The GRACE data are righteous. The problem is in the GIA.
Could the GIA adjustment be fixed with direct measurements on ice depth?
You can measure the current uplift with a great deal of precision using GPS. However, this doesn’t differentiate crustal rebound from changes in ice mass. You still have two big uncertainties:
http://iopscience.iop.org/article/10.1088/1748-9326/9/1/014004
What was the mass of the GrIS at LGM? How quickly and it what pattern did it shrink during deglaciation?
How elastic is the crust and upper mantle?
“How elastic is the crust and upper mantle?”
The answer to that is “it depends”. In Scandinavia (a very stable precambrian shield) the isostatic rebound is still going strong 12,000 years after the ice melted. In Iceland (where the lower crust and mantle is presumably considerably less viscous) it only took a few thousand years to reach equilibrum.
Greenland is mostly rather similar to Scandinavia geologically (they were part of the same continent until c. 65 million years ago). The big problem is that the Iceland hot-spot passed under Greenland at about that time. How much of “low viscosity track” has it left? Nobody knows and getting at the details of the geology below the ice is rather difficult, to put it mildly.
Have Excel Will Travel. Well done sir!
Palladin copied me… 😉
I would like to add this borehole temperature profile on the Greenland ice-sheet.
Basically, at the bottom of almost all the Greenland ice-sheet, the temperature is now -3.0C or -2.4C or -1.0C due to heating from the bedrock below. Given the pressure from all that ice above, these temperatures are enough to melt the ice.
There is no ice on Greenland that is more than 130,000 years old. The vast majority is in the 50,000 years to 100,000 years old category. The melted water gets squeezed out somewhere and is no longer part of the bottom of the ice-sheet.
This temperature profile is from NGRIP. None of the ice was more than 110,000 years old. The last ice age maximum ice shows up at 1500 metres deep at -32C but it was formed at about -40C. It has since warmed up from bedrock heating from below. As you go deeper and older, the ice gets progressively warmer.
http://www.iceandclimate.nbi.ku.dk/images/images_research_sep_09/Temp.jpg
At NEEM shown in this pic, they did get back to 130,000 years. There are a few remnant areas which might be up to 400,000 years old but there is no layering left in this ice to be sure.
http://neem.dk/billeder/greenland.bmp
Discussion at:
http://www.iceandclimate.nbi.ku.dk/research/flowofice/borehole_logging/
Yep. NGRIP’s basal melting has been measured at 7 mm/yr… About 430 m since the Eemian.
Actually not all of the Greenland ice-sheet is melting at the base. Part of it is “cold-based”, i e frozen to the bed. Whether an ice cap is “warm-based” or “cold-based” depends on several factors. The geothermal heat-flow is probably most important but also the thickness of the ice (thick ice is more likely to be warm-based). The air temperature above the ice also has an influence. Here is a NASA map of which parts of the ice are probably warm-based. It is based on several criteria, but the uncertainty is considerable: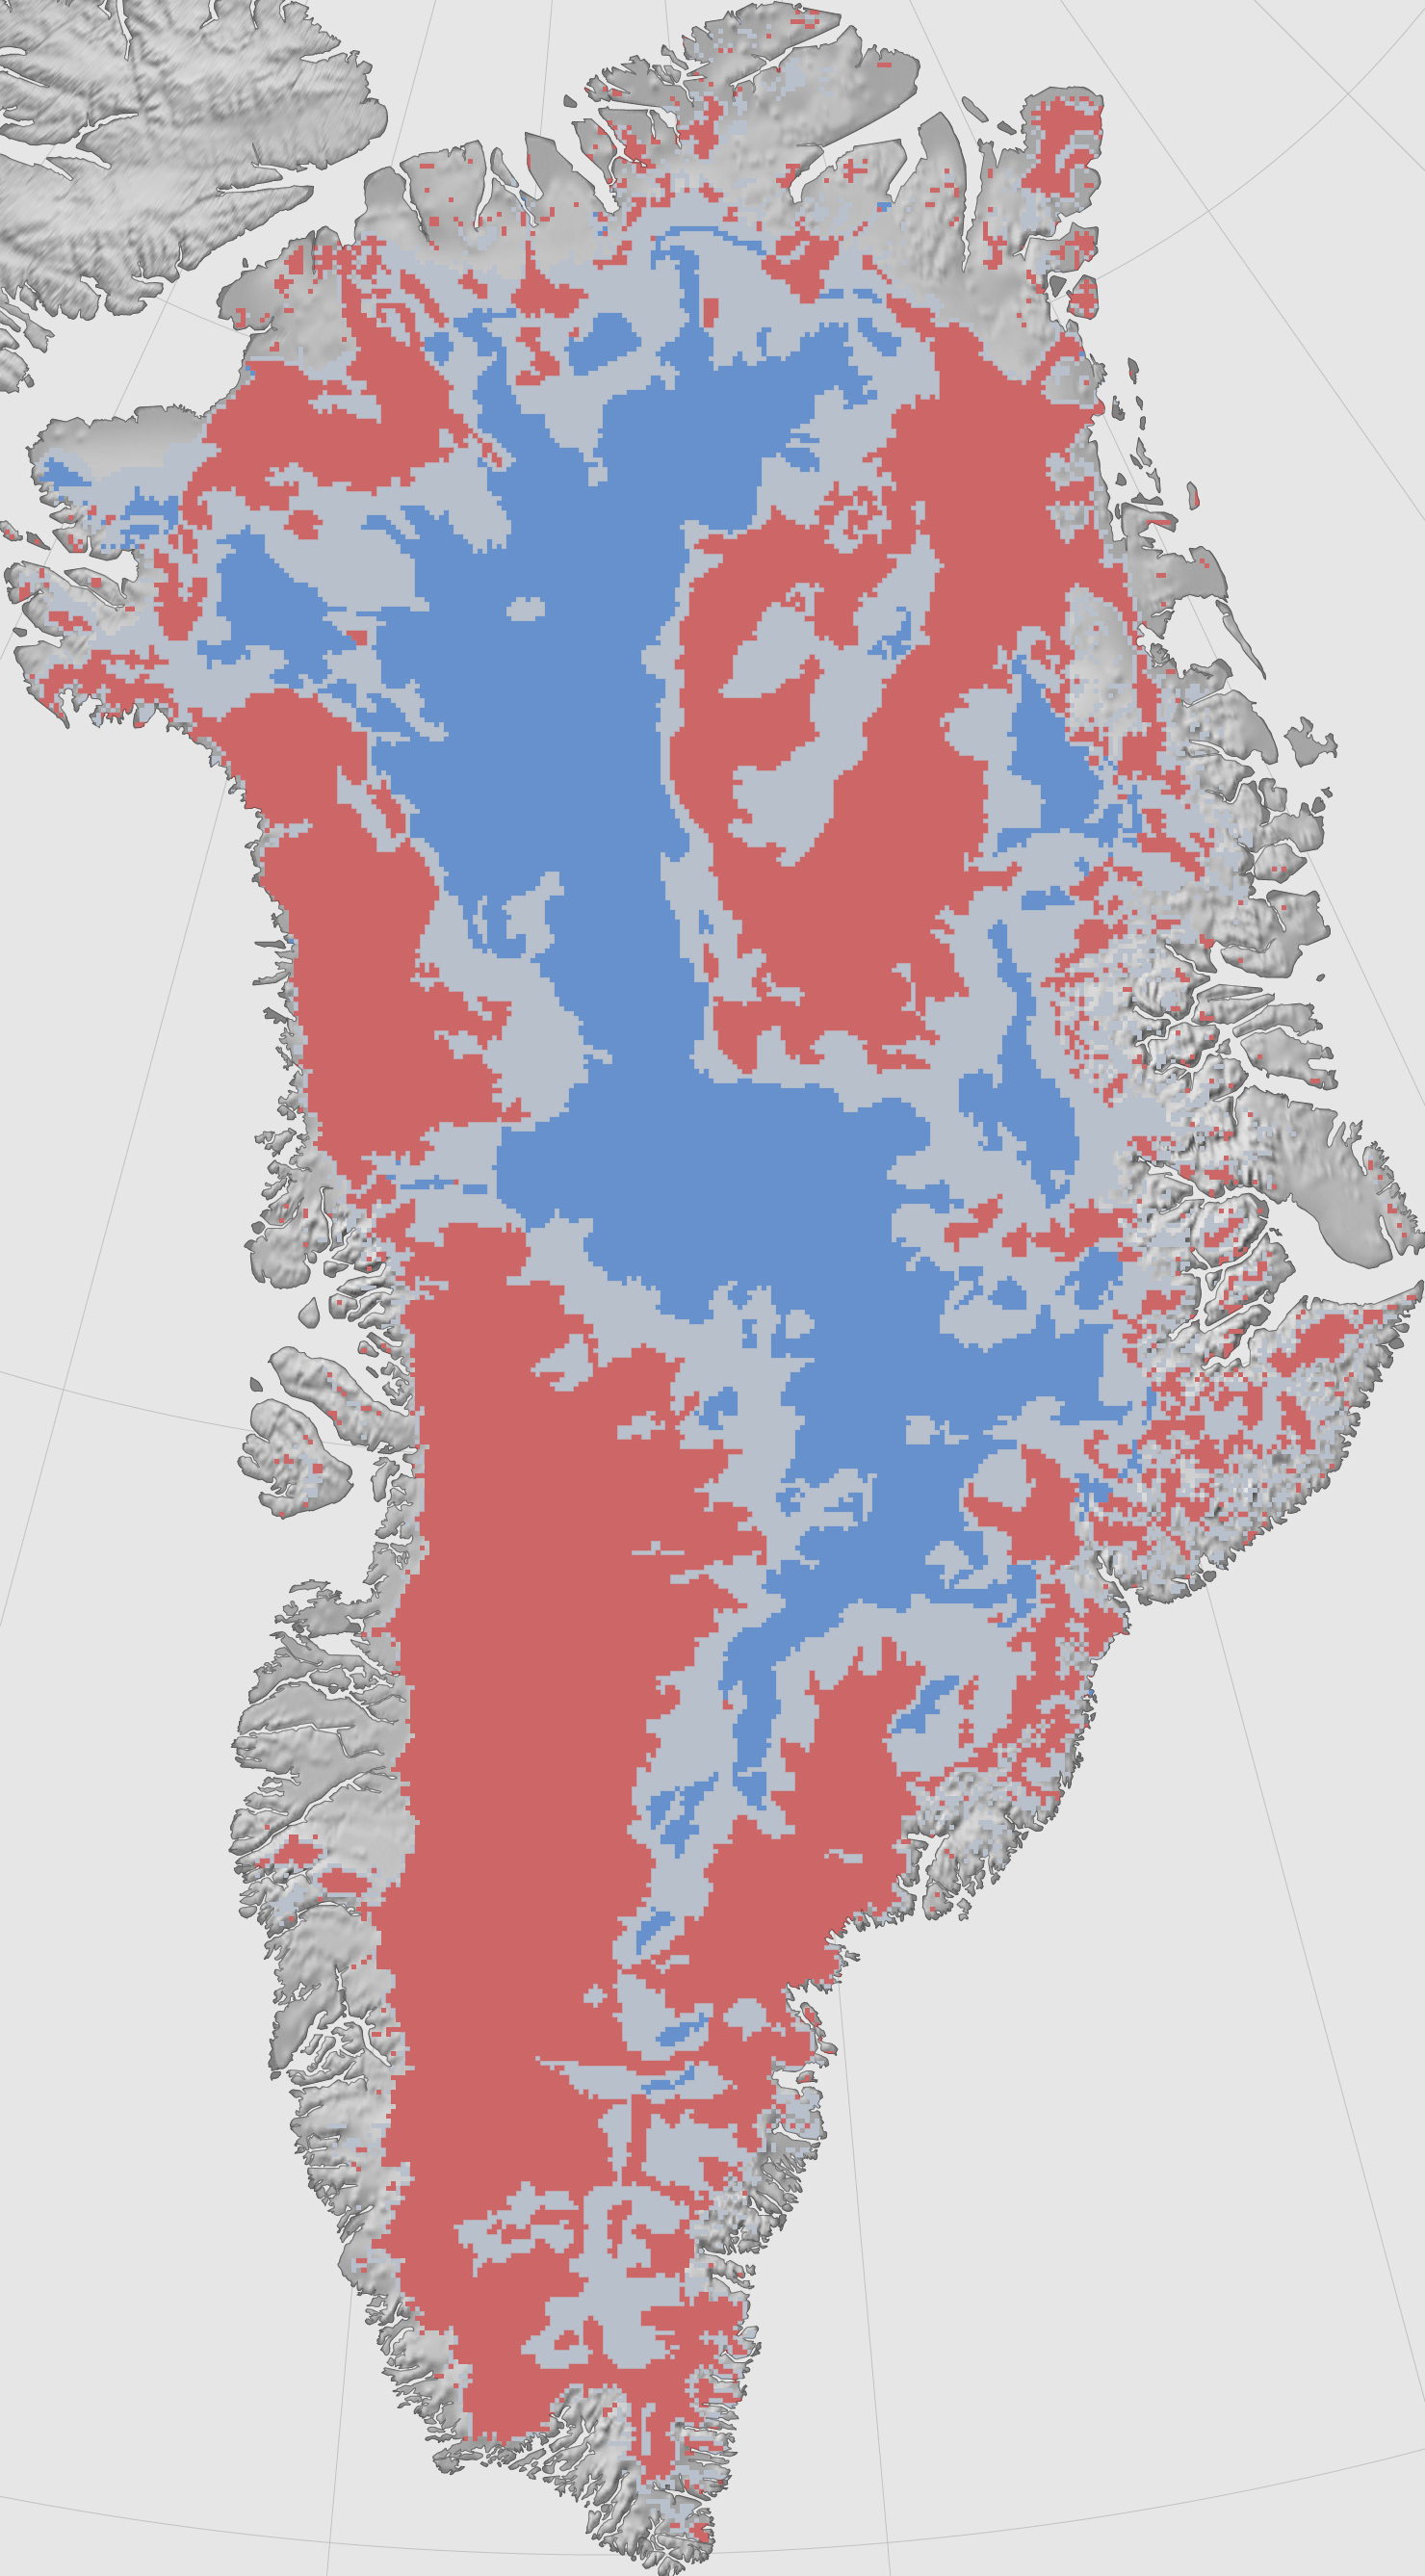
Someone please tell me what the hiccups are all about???
There is more than enough paleontological evidence to show that some time in the past, Greenland was completely bare of ice and had forests (long before the Vikings got there), and that it’s gone through several cycles like that.
When the Vikings got there, Greenalnd was green and fertile and habitable. Then it got cold and the snow never stopped coming. (This is the simplified version.) Now it’s going green again, and someone has to panic because it means C-H-A-N-G-E. And change is unacceptable. (Just wanting to make sure I understand it all.)
So, then…. ???
Sara,
You said, “Greenalnd was green and fertile and habitable.” That was along the southern coasts, NOT the interior! However, even today one can find Arctic fox, hares, and ravens. Not much other than that besides a few itinerant polar bears. But there is some vegetation that the hares eat.
Also musk-ox, caribou, lemming and arctic wolf (in areas where they haven’t been hunted out). Actually many more mammals, particularly rodents and small predators, could certainly live on Greenland if they could get there. Greenland was completly ice-covered during the last glaciation. All land mammals has had to walk there by way of northern Canada, crossing a minimum of four ice-covered straits. Not a lot of mammals can do that.
Also about a hundred bird species.
Also ermine.
Sleet is coating the front deck, even as I type this, and has bowed the few daffodils blooming over to the ground.
I’m just not ready yet this March 22nd to talk about kilometer size ice cubes….
Sleet can happen any time of year, some place, and often does.
Perhaps, you are in Tallahassee. Perhaps you are in Fergus Falls.
You don’t say, so I don’t know whether to be impressed with the weak stemmed daffodils, or the brave ones reaching up in the cold air.
Meanwhile, here at 2,200 ft. elevation in Kittitas County WA, our daffodils just managed to show earlier this week. NWS thinks it will drop to 25° F. tonight through Sunday night. We’ll see.
John,
I’m SE of Seattle, 560ft altitude. At my location, sleet is a frequent visitor.
As for the daffodils blossoms, what the weather doesn’t pound flat, the slugs are determined to eat.
We once got slammed by sleet while hiking in the Kolob Canyon region of Zion National Park… in August. It was freaky.
I do trail work with WTA. Me — mostly from the Issaquah area eastward. Did several between Newcastle and Issaquah.
Those are the times I see your lovely Slugs.
“From this geological perspective, the Greenland Ice Sheet is not behaving badly.” True, but NASA is.
Not all of NASA is “behaving badly.” There are many in, or associated with, the Agency who still measure, verify, and validate. Sadly, there are some that don’t, and they put the reputation of a (once?) great space organization in peril.
An excellent report – a couple of observations.
1. Deep ice core taking over several years is possible only because there is no horizontal movement to sheer the drill assembly off. Therefore the cored sections are not contributing to the ‘modern?’ glacier.
2. The odd aspect about all this work for the last 100 years there seems to be a lack of data on the age of the calves leading to the icebergs themselves. When there is glacial activity it is clear that the ice is coming from an elevated source. The question what are the age relationships between the hinterland ice and the iceberg?
3. Basal ice melting can only be attributed to near surface volcanic activity.. Evidence for this is seen in the most common way through the results of acid rock drainage. Here the breakdown of pyrite yields a golden brown to browny red plume. This feature is also noticeable in select locations in Antarctica so there is no doubt that current volcanic activity is occurring at the break between the land mass and the overlying ice.
4. The deepest and oldest core in NGRIP yield a bacteria based DNA profile from pine cone material that could be dated from 532,000 years BP to 830,000 years that showed an ice free temperate climate.
Ice core drill sites are located where lateral movement is minimal. Ice is generally dated by counting layers. The ice flowing into outlet glaciers is deformed and lacks useful layering.
The basal melting isn’t limited to volcanic activity. Heat from the Earth’s interior flows to the surface. This coupled with the pressure of the ice overburden creates the conditions necessary for basal melting.
No ice in Greenland has been dated to 530-830 ka. The oldest ice dated in Greenland is about 150 ka in the NEEM ice core.
The oldest ice dated in the NGRIP core is about 123 ka. They did find some clues in melt water beneath the ice, which may indicate the last time that Central Greenland was ice-free…
https://blogs.agu.org/wildwildscience/2010/07/31/oldest-greenland-ice-core-recovered/
“The odd aspect about all this work for the last 100 years there seems to be a lack of data on the age of the calves leading to the icebergs themselves. When there is glacial activity it is clear that the ice is coming from an elevated source. The question what are the age relationships between the hinterland ice and the iceberg?”
At least in some areas part of the ice calving/melting at the edge of the ice-sheet is as old as the last interglacial, or even the later part of the previous glaciation:
http://sci-hub.tw/10.1016/0921-8181(91)90003-F
But it probably varies a lot, the ice-flow is far from uniform, most of the ice is probably Holocene.
Nothing to worry about here. About 400,000 CUBIC KILOMETRES of land ice must melt to raise global sea level by 1 metre.
Given current sea level rise over the last decade you can work out how much ice melted off the land, but did it all come from Greenland?
Most of the SLR is not due to Greenland.
Thanks David, clearly and concisely explained including your appropriate use of “worth a 1000 words” graphics. A great article!
Thanks for a great informative post. Really enjoyed it. However nothing about the claims that GRACE can accurately measure the changes in mass of any ice sheet anywhere seems “well and good” to me.
GRACE can very accurately measure very subtle changes in Earth’s gravitational field. The certainty to which that can be translated into all of the things interpreted from GRACE data is very subjective.
It’s good to draw attention to the fact (educate warmists about the fact) that Greenland’s ice sheet almost melted away totally during the previous interglacial, the Eemian.
Curious that the polar bears survived this Eemian hot-house in good shape, but now are apparently threatened by a much smaller warming episode than the Eemian. That’s catastrophism relativity I guess. Just like how all multicellular life emerged and prospered in the Cambrian with 10,000ppm CO2, but now all life is threatened with extinction by the much higher level of 400 ppm CO2.
Our warmist friends like to make ever more extravagant claims about the current industrial anthropocene being the warmest in a thousand years – no, a million years – no, a hundred billion years!
https://youtu.be/jTmXHvGZiSY
The Eemian was much hotter. Its sea levels many meters higher. And the biosphere did just fine. Humans were yet to evolve coercive dystopian story-telling.
Here’s a kicker…
https://www.nature.com/news/2004/040908/full/news040906-10.html
There are some indications that it might have been 8 °C warmer than today… yet the North Atlantic climate was stable.
Here are data for the temperature during the previous interglacial from the various ice-cores and other Greenland sites:
Pakitsoq, Disko Bay: 4 degrees warmer than at present.
Jameson Land, East Greenland: 5 degrees warmer (this is from plant fossils, not an ice-core)
Renland: 5 degrees warmer
NGRIP: 5 degrees warmer
Thule: 4 degrees warmer (insect fossils, not an ice core)
NEEM: 8 degrees warmer
You’re right that the Eemian was a lot hotter than even peak Holocene warmth, during its Climatic Optimum, which ended about 5000 years ago. But the GIS wasn’t close to total meltdown during that interglacial. At the end of the 16,000 year-long Eemian, its Southern Dome was maybe 25% smaller than now. Other studies find more melting, but IMO this estimate is well supported. The Northern Dome of the GIS wasn’t affected as much.
Greenland is melting! We’re doomed!!
99.58% of any YUGE number is also a YUGE number… 😎
Interesting article beautifully illustrated. I agree with nearly all, but am uncertain about this: “The GrIS may have actually been smaller than it currently is from 35 ka to 15 ka.”
The evidence for very large continental ice sheets at the time doesn’t agree well with this assertion, and the figures you show from Bo Vinthers et al. data on elevation indicate that GrIS was taller at the time.
It does accumulate more during interglacials, but it also melts more and squeezes out more, leading to a larger ice replacement so old ice disappears faster. That most of the ice is recent doesn’t mean that GrIS was smaller at the Last Glacial Maximum. I personally find that hard to believe.
That’s why wrote “may have actually been smaller”… Because I am also uncertain about that possibility. All of the basal melting scenarios have the GrIS contracting over that time period. Only the 2 or 3 highest basal melting scenarios have it contracting to where it was smaller than today.
The Vinthers elevation reconstruction starts at the beginning of the Holocene. So, the basal melting scenarios don’t really conflict with it.
The odd thing about Camp Century is that the elevation has fallen so much since the end of the Pleistocene, yet the Camp Century ice cores don’t seem to have an major Holocene unconformities. So, most of the elevation loss has to be due to basal melting and/or deformation and flow of basal ice.
Camp Century is fairly close to the coast (much closer than any other ice-core except Renland) and the ice profile is steep, the level has probably fallen as the ice-edge retreated from the shelf edge to its present position.
Yeah, but how many Burj Khalifas ice cubes is it? Or how about using the Jeddah Tower. How many ice cubes is it then? Wonderful thing this science.
Great article. Nice integration of GPR visualization of geologic time and recent ice volume measurements. Did you see where the engineers want to geoengineer ice loss by building artificial islands and berms. https://www.nature.com/articles/d41586-018-03036-4.
Geoengineering ranks right up there with cloning dinosaurs being “the worst idea in the long, sad history of bad ideas.”
http://www.imdb.com/title/tt0119567/quotes/qt0339338?mavIsAdult=false&mavCanonicalUrl=http%3A%2F%2Fwww.imdb.com%2Ftitle%2Ftt0119567%2Fquotes
Cloning (non-avian) dinosaur would be an extremely interesting and not at all dangerous experiment in my opinion. Unfortunately there is nothing to clone them from. DNA doesn’t survive for 65 million years (unless we can find some area that has been continuously frozen for that long, perhaps the Gamburtsev mountains?).
I agree that cloning Mesozoic dinosaurs (presumably Cretaceous) would be wonderful, but doubt that even in Antarctica there are remains which have been continuously frozen for 66 million years. The Gamburtsev Range probably had glaciers from at least the Late Eocene, but that still leaves a gap of some 30 million years during which climate was temperate there.
The recently described Antarctic iguanodont Morrosaurus lived during the Maastrichtian, last age of the Cretaceous. So did its ornithopod kin Trinisaura. The ankylosaur Antarctopelta probably didn’t make it to the end of the Cretaceous. Presumably some theropod carnivore preyed upon Morrosaurus and Trinisaura, likely an abelisaurid.
Recent opinion is that there were probably transient ice-caps in inland Antarctica even in the Cretaceous to explain sudden sea-level changes, and there were tidewater glaciers in East Greenland by the late Eocene:
http://lib.gig.ac.cn/local/nature/446,%20176-179.PDF
Mountain glaciation in inland Antarctica presumably goes back well before that.
Tty,
You’re a lot more up to speed on subglacial Antarctic mountains than I. For sure there were montane glaciers on Antarctica even in the Cretaceous, whether in the Gamburtsev Range or not. The Gamburtsevs have risen and fallen repeatedly during their long history. The Maastrichtian was cooler than the balmy mid-Cretaceous.
They’d have to have been frozen at liquid nitrogen type temperatures for the DNA to have survived for 65 million years.
Even then it’s doubtful.
Over that kind of time, even low level radiation damage adds up.
Mark,
You’re probably right. The oldest DNA of which I know is from a 400,000 year old plant.
Any surviving segments of DNA from the Cretaceous would at best be fragmentary. Hence, to clone a dinosaur, more than one sample from the same or closely related species would be needed.
Thus the odds are decidedly against obtaining a complete genome that old. Maybe bits could be filled in by modern birds, but then you’ve got a hybrid, in the unlikely case that such a dummied up clone would be viable.
The closest we’re ever likely to come to a non-avian dinosaur is Horner’s “dinochicken” project, reverse engineering a dinolike chicken by turning on its suppressed genes for teeth, long bony tail, claws, dino posture, etc. Such a “chickenosaurus” of course wouldn’t belong to any actual non-avian dinosaur species, being still a chicken genetically, but would nontheless be an interesting evolutionary experiment.
IIRC the Horner-derived character in The Lost World got eaten by a T Rex.
David,
https://en.wikipedia.org/wiki/List_of_Jurassic_Park_characters#Dr._Alan_Grant
IIRC, he has survived, at least so far.
Happily, mainly insects would be at risk from a dinochicken, although roosters can be ferocious.
The Horner character was the bearded paleontologist working for the “bad guys” (Hammond’s nephew) in the Lost World.
At least that’s who I associate with Horner. I don’t associate Alan Grant with Horner.
Artist’s rendering of the skeleton of a dinochicken, whose embryonic development was manipulated to allow suppressed dinogenes to be expressed:
http://media2.s-nbcnews.com/j/MSNBC/Components/Photo/_new/090305_dino-chicken.grid-6×2.jpg
Crichton said he based his character Grant on Horner, but in the movie, who knows? Anything goes.
Who am I to argue with Michael Crichton? It’s just that Jack Horner has long hair and a beard and Alan Grant has short hair and is clean-shaved./usa---jurassic-world-premiere-in-los-angeles--529907508-59f9f12a0d327a001a8d4421.jpg)

Dr. Jack Horner…
Dr. Robert Burke (T Rex snack)…
http://www.jurassic-pedia.com/wp-content/uploads/2011/04/burke.png
Dr. Alan Grant…
True. Tonsorially and in terms of follicles, Grant isn’t Horner. Neither in his behavior nor accent. But that’s movie magic for you.
Insofar as Horner has hair, it is indeed characteristically long. And he enjoys Shakira, which I’m pretty sure that Grant wouldn’t.
Nor would I… 😎
To me, Burke is more akin to Bakker.
That’s the paleontologist I was thinking of.
Bakker… Yep.
[snip – wildly off-topic -mod]
One would think that if Greenland were melting at an unusual rate, it would show up in sea-level change. But I suppose the meltwater can “hide” in the deep ocean, just like the supposed warmth…. /sarc
David,
Excellent article! I grew up about 15 miles south of Lake Erie in northern Ohio. The remnants of the advance and retreat of the glaciers there were abundantly visible on the surrounding countryside, including my backyard. http://www.ohiohistorycentral.org/w/Ice_Age_Ohio. Now live in northern Wyoming where our Bighorn Mountains were one to two miles higher, depending upon whose study you read and when they’re talkjng about, due to glaciation. I find the subject fascinating.
Regards,
JimG1
Excellent post. Permabookmarked for reference. TY.
GRACE was a good scientific experiment that lasted longer than expected. As an experiment it allowed researchers to identify issues with remote sensing platforms that are hopefully resolved with GRACE FO. As an accurate measurement of global ice mass and water it is not – large errors remain in the data.
Time‐variable gravity observations of ice sheet mass balance: Precision and limitations of the GRACE satellite data. https://agupubs.onlinelibrary.wiley.com/doi/full/10.1002/grl.50527
Aliasing errors discussed here
ftp://ftp.csr.utexas.edu/pub/ggfc/papers/Seo_et_al_2008.pdf
Post-processing removal of correlated errors in GRACE data
https://www.researchgate.net/publication/228770590_Post-processing_removal_of_correlated_errors_in_GRACE_data
An analytical method for error analysis of GRACE-like missions based
on spectral analysis
https://arxiv.org/pdf/1609.08860.pdf
The role of accelerometer data calibration within GRACE gravity field recovery: Results from ITSG-Grace2016 Instrument degradation from battery power loss.
https://www.sciencedirect.com/science/article/pii/S0273117716304409
Thank you, David Middleton, and commenters for an excellent scientific discussion — one of the gems of WUWT. Beautiful enough to save for colleagues, friends and family who are interested in researching truths, and the interesting variety of geological/climate states of Mother Earth.
I read the article but not the comments. For perspective, why not put the zero point on some of those graphs? That would show just how trivial the variation really is.
Because Greenland has been continuously glaciated since at least the Mid-Pliocene. The lowest volume of the GrIS over the past 250,000 years, supported by any evidence is about 2 million km^3.
“Earliest Pleistocene” would be more correct if you refer to an ice-cap covering lowland areas as well. The Kap Köbenhavn formation seems to be the last time most of Greenland was ice-free, and that was about 2.4 million years ago.
The highlands of East Greenland have been glaciated much longer, at the very least since the Late Eocene, 40 million years ago. That is when IRD (Ice Rafted Debris) first shows up in Fram Strait, which means that there were tidewater glaciers.
The minimum Pleistocene volume may well have been somewhat smaller than 2 million km3. IRD studies have shown that during the MIS 11 interglacial the icecap probably separated into a northern and a southern dome and (admittedly loose) dating of the sub-ice sediments at Dye-3 also indicates that it may have been ice-free at this time. Dye-3 is close to the “saddle” between the two major domes.
For those who wonders how IRD can tell how large the ice-cap was, Greenland consists of several geological provinces with distinct rock types and –ages. IRD consists of rocks that are being actively eroded by glaciers calving into the ocean. During the Eemian (MIS 5e) interglacial IRD off south Greenland consists of rock from all provinces, indicating a continuous (or at least almost continuous) ice cover from north to south. During MIS 11 rocks from one province (near the “saddle”) are missing, strongly suggesting two separate ice-caps. The absence is not absolute proof though, since there may have been ice inland that did not calve into the ocean.
It’s funny how IRD or dropstones are evidence of colder climates… yet the warmunists claim that the increased calving of icebergs is evidence of Gorebal Warming.
The cross section nicely helps in explaining why the global sea level was higher 6000-8000 years ago.
Yogi,
The whole planet was a lot warmer than now during the Holocene Climatic Optimum, but not as hot as the Eemian, the previous interglacial.
@ David Middleton. You know about 1000 times what I know about glaciers. I have asked this question many times here on WUWT.
Why are the largest and longest tidewater glaciers in the northern and southern hemispheres not retreating but advancing, as are the smaller mountain glaciers (some, not all) ? I have never gotten a clear scientific answer to this question. Sorry to use Wackapedia as a ref., but you can find this/these results in other links.
Brüggen Glacier: “…Now about 66 km (41 mi) in length, it is the longest glacier in the southern hemisphere outside Antarctica…”
https://en.wikipedia.org/wiki/Br%C3%BCggen_Glacier
Hubbard Glacier: Hubbard is the largest tidewater glacier in North America…
https://en.wikipedia.org/wiki/Hubbard_Glacier
Taku Glacier: “Taku Glacier is a tidewater glacier located in Taku Inlet in the U.S. state of Alaska, just southeast of the city of Juneau. Recognized as the deepest and thickest alpine temperate glacier known in the world, the Taku Glacier is measured at 4,845 feet (1,477 m) thick.[1] It is about 58 kilometres (36 mi) long, and is largely within the Tongass National Forest.”
It is the largest glacier originating in the Juneau Ice field, also a tidewater glacier.
https://en.wikipedia.org/wiki/Taku_Glacier
All of these glaciers mentioned are advancing. Most start at very high altitudes.
There are other large tidewater glaciers in Alaska and South America which are advancing.
My basic question would be: Why are these largest glaciers advancing, while many (not all) smaller lower mountain glaciers generally retreating?
At a guess: more precipitation. This is at least as important as temperature. For example there is considerable evidence that the EAIS (East Antarctic Ice Sheet) thickens during interglacials, and very strong evidence that glaciation in the Transantarctic Mountains was much more extensive during the warm Pilocene.
Also note the virtual absence of glaciers in Eastern Siberia, now and during the ice-ages, despite the lowest temperatures outside Antarctica.
Precipitation is often more important than temperature.
My personal analogy is to the icemaker in my freezer. Does it overflow with ice when the temperature in the freezer is too warm? No.
Glaciers are always moving. They may move at a glacially slow pace, but they don’t often sit still.
The “consensus” school of thought says that Greenland’s outlet glaciers are moving more quickly due to increased lubrication from the drainage of glacial lakes formed by increased surface meltwater. The meltwater percolates down through fractures in the ice to form moulins…
https://en.m.wikipedia.org/wiki/Moulin_(geomorphology)
This leads to an increase in the rate of iceberg calving and frantic headlines about Manhattan-sized icebergs.
The funny thing is that when I took geomorphology about 10 years before Al Gore and James Hanson invented Gorebal Warning, increased rates of iceberg calving were indicative of colder climates. “Dropstones,” out-of-place rocks in marine sediments, carried out to sea by icebergs and dropped to the seafloor as the iceberg melted, are generally associated with colder climates. See my discussion of Jakobshavn Isbrae, Greenland’s largest outlet glacier, towards the end of this post…
https://wattsupwiththat.com/2012/08/17/2012-the-year-greenland-melted-aka-alarmists-gone-wild/
Off the top of my head, I don’t know the specific answers to your questions. I’ll see what I can dig up.
Most, but not all, glaciers have been retreating since the end of neoglaciation (~1850). For about 5,000 years before, most were advancing, reaching their maximum Holocene extent during the Little Ice Age.
I’ve always heard the Brüggen called the Pio XI glacier.
I will offer another line of thought here.
The actual assessment of the Greenland ice sheet as it stands, heavily relies in the history of ice, which when used produces an artifact that actually makes that ice history very dubious and not quite acceptable unless crazy acrobatics in thought and rationale considered…..makes really difficult to accept.
That assessment there, in consideration of the actual ratio of the mas of “blue” ice versus “green” ice happens to be that way due to a history of ice that consist with a glacial period of a ~100k years span versus a warm trend of ~10k years.
This is a “product” that mainly spring out as shown due to the ice history when trying to mend it with the rest of the data, and from the outset it confuses the ice history, as per that history of ice to be correct a lot of silly acrobatics are required to maintain it, while actually the prospect of that never being possibly achievable.
That ratio is not possible, but is considered as such because while there is not much you can do about the overall mas of ice and the age of ice, otherwise you have to depart from the ice history as it stands….
That ratio is a calculated estimate very much weighted by the history of ice, aka the ~100k years glacial period, and, leading to a very “stiff” ratio condition between “glacial” ice and “non “glacial” ice, where not much room or tolerance there in the variation of the conditions, meaning that any little variation subjecting out side this term or projection outside this term will clearly have to be considered as a result of a non natural force.
All this, from what I can see, it happens to be this way simply as a result of refusing to reconsider the history of ice.
The only point that can be making a difference if reconsidered.
When you look at that “green” ice mass and the ratio of it to the “blue” ice mass, you are looking at possibly one of the proofs of the ice history refutation, as that history stands thus far, a proof that refutes 100k years glacial periods.
And that ratio can not be explained or maintained unless crazy acrobatics considered, like being able to explain and be supported by data and rationale, how Greenland not gaining any extra ice during a glacial period…..and also when Greenland in a warm period during interglacial must have an average temp of +10 to +15C for at least a 5k years duration…..
and still this may not be good enough to support the estimation of that ice ratio between “blue” and “green” ice .
cheers
The “ice history” is pretty solid since it is based on counting annual layers.
In Greenland, the layers are relatively thick, particularly during the Holocene.
Sorry tty, but is the only “key” that you can play to get out of the conundrum there, the rest of the “keys” change no much, provided that you consider the problem with the conundrum there….otherwise please do stick with it….but consider my point, the produced artifact of the ratio of glacial versus interglacial ice as per that ice history stands as a refutation of the process where all these “keys” become non valid.
But still considering to adjust for the only “key” that will make the difference, the ice history, can allow for a better produced artifact, a very much different ratio which may validate the process and the “keys”
Hopefully you get my point.
Not considering the change of the ice history, means a stack condition with the conundrum….
That happens to be the only one way out…as far as I can tell.
thanks
cheers