Guest essay by Larry Hamlin
On June 23, 1988 the Senate Committee on Energy and Natural Resources held a hearing addressing the Greenhouse Effect and Global Climate Change.
Among the presenters at this hearing was Dr. James Hansen, Director, NASA Goddard Institute for Space Studies who introduced his infamous and now debunked global surface temperature model results with future temperature projections under three different scenarios of CO2 emissions growth that grossly over exaggerated resulting projected global temperature increases.

Also testifying at the hearing was Dr. Michael Oppenheimer, senior scientist with the Environmental Defense Fund who presented claims that included projections of future sea level rise acceleration that would occur in the coming decades.
Specifically Dr. Oppenheimer claimed that:
“This increase in global temperature causes a concomitant rise in global sea level as ocean water expands and land ice melts.”
“Global mean temperature will likely rise at about 0.6 degrees Fahrenheit per decade and sea level at about 2.5 inches per decade over the next century. These rates are 3 to 6 times recent historical rates.”
“Because the oceans are slow to heat, there is a lag between emissions and full manifestation of corresponding warming — a lag of perhaps 40 years. The world is now 1 degree F warmer than a century ago and may become another one or more degree warmer EVEN IF EMISSIONS ARE ENDED TODAY.”
EIA data shows that global emissions have climbed by more than 60% since 1988 increasing by about 13 billion metric tons per year of CO2. Dr. Oppenheimer continued:
“These changes are effectively irreversible because greenhouse gases are longed lived.”
“This committed warming means some adaption measures, such as sea defenses and coastal abandonment, are inevitable.”
It has now been 30 years since these dire climate change sea level rise acceleration warnings were presented at the 1988 Senate hearing on Global Climate Change with global CO2 emissions having increased by more than 60% during this period.
Surely the signs of the 1988 projected sea level rise acceleration with measures of “sea defenses and coastal abandonment” must now be clearly apparent given the huge increase in global CO2 emissions that has occurred since then along with increasing global temperatures with the accompanying increasing “ocean water” expansion and global “land ice melting.”
NOAA has just updated its extensive network of tide gauges (142 locations) to include measurements through 2017.
This measured data continue to demonstrate that there has been no coastal sea level rise acceleration observed at these locations during the last three decades of claimed sea level rise acceleration as hypothesized by presenters at 1988 Congressional hearing.
NOAA has tide gauge data measurement records at 16 locations of 99 or more years in duration that cover the Pacific, Atlantic and Gulf Coast oceans. Examples are provided for the Battery in New York, San Francisco in California, Honolulu in Hawaii and Key West in Florida.

NOAA tide gauge location measured rates of coastal sea level rise remain consistent with trends going back 10 or more decades at these and other locations showing that claims of man made global sea level rise acceleration remain unreflected at coastal locations.
These observational results suggest that natural climate drivers are controlling coastal sea level rise behavior not man made CO2 emissions.
Additionally these results pose a significant challenge questioning the validity of the science behind global mean sea level rise acceleration assessments and claims.
The alarmist view rests in its entirety upon models. There is no observation that I am aware of anywhere in any field that supports their model-based assertions. Yet their campaign remains successful.
And their campaign will continue to succeed as long as MSM and politicians act as gatekeepers, filtering what information gets to the public. Skeptics are marginalized and the easy refutation of CAGW assuptions is relegated to blogs such as WUWT. But there are cracks in the facade and patience is our ally.
Patience is an important ally but when push comes to shove, truth and reality are our strongest weapons.
But why does it take Mr. Truth so long to get its pants on?
The long run tide gauges continue to be a major stumbling block for every wild-eyed alarmist.
This means those data will soon be adjusted to conform to the hypothesis,
They seem reluctant to look directly at this issue.
Somehow or other most alarmist seem to be capable of concluding that the summed average of lots of linear trend lines can be an accelerating quadratic curve.
So they are happy to look at all the quite perfectly straight long term trends from reliable established coastal gauges and then satisfy themselves that it’s O.K. to report that the sea level rose at 1.7mm/year until 1993 and since then jumped to 3.2mm/year.
They don’t seem to be too interested in the evidence of their eyes, or even basic maths.
Apparently, when you sum lots of linear time series data sets, then you end up with a quadratic fit !!
Who knew?
Australian government has spent (and continues to spend) tens of millions around Australia and the Pacific Islands on sea level monitoring. The CSIRO, Bureau (BOM) and AAD criminally squander taxpayer’s money largely to prove AWG is an issue for our nation. All the departments’ original claims are fanatical adherence to UN ‘directives’ and have been eagerly promoted by successive left wing governments and sadly now by the current conservative government. There’s never been any admission from any department that they were (and continue to be) well short of their early claims and expectations.
Do those Australian-supported tide gauges show any sea-level rise acceleration?
Here is a useful link: https://www.theaustralian.com.au/opinion/tide-turns-on-sealevel-alarmists/news-story/4271c4edb3fe144d6a30a2d31c399b3d. Fort Denison is an island in the middle of Port Jackson, which is Sydney Harbour. Here is the link to the data: http://www.psmsl.org/data/obtaining/stations/65.php
NRW — The data you linked stops well short of the year 2000. I’d guess it ends at 1988.
Retired_Engineer_JIm The Fremantle Tide Gauge has operated for 119 years. For the first 60 years it showed an average sea level rise of 2mm per year. In the more recent 59 years it has shown an average sea level rise of less than 1mm per year. If you send an email to mrmichaeldarby@hotmail.com I will reply with the details. The other long serving tide gauge in Australia is Fort Denison. There may also be one in Hobart. Regards Michael Darby
It was then, it is today, and always will be about alarmism in order to acquire more political power for politicians, and more grant money for the rent-seeker climateers.
Climateers regard the Scientific method as NOT required.
But today, Dr Hansen understands history will not be kind to his failed climate alarmist advocacy of the past. 1988 was a time of Liberal awakening. The late 60’s anti-Vietnam flower children needed a new crusade. Hansen gave them one as the Cold Waranti-nuclear mivement collapsed.
Sea-level worldwide is rising or falling in a straight line manner!!!
NO ACCELERATION while CO2 is accelerating worldwide!
The implications are stunning! CO2 has NO effect on sea level rise while local tectonics does. In tectonically inert places sealevel rises about 1/2 inch per decade- mostly due to thermal expansion and a little ice melt. Antarctica is actually contributing somewhat to lowering the rate of rise!!!
Ah – these were only ‘projections’, and they were based on early information which has since been superceded.
We now know that the heat hides in the bottom of the ocean, and causes ‘weird weather’ instead of rising sea levels. And whatever it does it’s WORSE THAN WE THOUGHT!!!!
Since 1800 (well before CO2 emissions could have caused ANY warming), Sea Level Rise (SLR) has been stuck at around 6 INCHES/century, and 20th century had the same rate, and this century will like have the same rate, too….
Ironically, if the coming 50~75 year Grand Solar Minimum does cool global temps, as many scientists predict, we could actually start to see FALLING SLR rates from the early 2020’s, or so..
The PDO/AMO/NAO will also all be in their respective 30-year cool cycles from the early 2020’s, which will also slowdown SLR…
The CAGW useful idiots will have a tough time explaining a slowing down/falling of SLR, although I suppose they’ll just continue to “adjust” raw SLR tide-gauge data as much as they can get away with…
Oh, the joys of CAGW “SCIENCE!! (TM)”…
Time now to remember that Hansen & Senator Tim Wirth messed with Congress’ air conditioning so that Senators were sitting sweltering in front of many cameras as Hansen kick-started the global warming…sorry….climate change scare.
It was always theater, a farce, a fraud on the public, a vastly expensive one.
It was never science.
Why are there 3 “projections” rather than predictions, if as Al Gore roars, “The Science is Settled”?
Always fraud, never science.
John Doran.
I have had a good use of NOAA tide gauge data and liked their site with Variation of 50 Year sea level trends. It showed how odd it was to claim acceleration.
Now they have changed that presentation showing less information. Why?
https://tidesandcurrents.noaa.gov/sltrends/global_50yr.shtml?stnid=120-022
If you liked it, they wanted to make it so you don’t like it.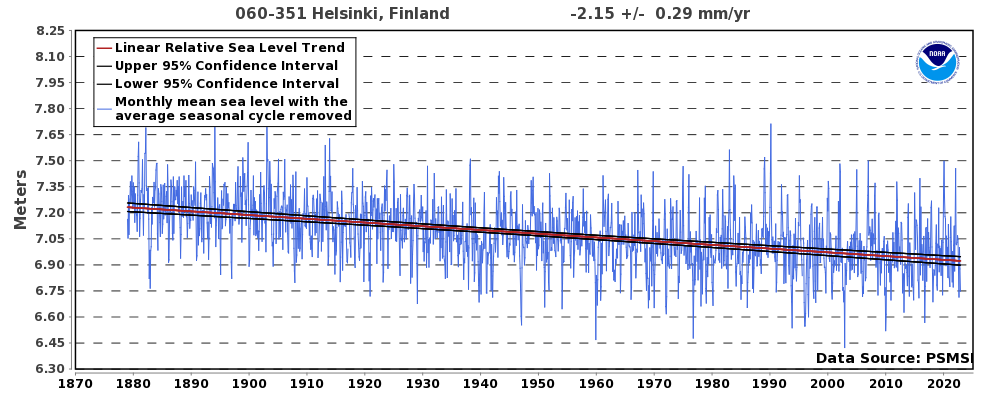
See also this (Helsinki, Finland)
https://tidesandcurrents.noaa.gov/sltrends/sltrends_station.shtml?stnid=060-351
and compare to this projection
http://ilmatieteenlaitos.fi/merenpinnan-nousu-suomen-rannikolla
http://ilmatieteenlaitos.fi/documents/30106/42372/Noususkenaariot_Helsinki_Vaasa_726.png
Well, we’ll see soon how well the Finnish met succeeds… I can foresee a server crash, a rare and exiting event which purges cloud-based data do the link won’t work in future 🙂 Ajatustentonava will see to it.
FWIW: Finland is one location that is still undergoing glacial isostatic rebound in response to the loss of ice cap. The land is rising faster than the ocean is rising.
Yes. And the projection says the (relative, sock-wetting) sea level has stopped falling in Helsinki.
No problems , a quick ‘adjustment ‘ will soon see those rises occurring no matter what the reality .
The world is 1 degree F warmer than it was a century ago ! Is anyone with any intelligence claiming this is anything other than a good thing?
Perhaps we can find better things to do with the vast sums being wasted on dubious and clearly failed and failing claims of a climate crisis. Like finally nailing Malaria or abolishing absolute poverty for the sake of the decreasing number of people unfortunate enough to still lead desperate lives. Oh, sorry that doesn’t get you secure academic tenure and lucrative grants studying climate science. What am I thinking…
Indeed, God forbid if they found an actual answer to something, what would they get paid to do next? They continue to demand rigidly defined areas of doubt and uncertainty.
Have some faith, man! Carbon heat, aka “ninja heat” is tricky. It can hide deep in the oceans, popping out from time to time in places you wouldn’t expect, such as the Arctic. It also manifests itself in weird, and “extreme” weather, droughts, floods, fires, and even cold and snow. You just have to know the ways of Carbon Heat™, and be able to read the signs. Sheesh!
Bruce Cobb March 15, 2018 at 5:38 am
An excellent and extremely astutely observed parody. Sadly, what you posted is exactly what many gullible people are prepared to believe.
Does anyone have a copy of that transcript & associated documents from the 1988 Senate hearing, so that I don’t have to pay the Scribd extortionists?
Dave–I have also wondered about originals since reading the books by Spencer, Bastardi and Morano (Is his 2990 referenced IPCC report Freudian or prescient?) and just scanned through the linked report.
From the J. Geophys. Res. to be published article (Attachment A) Hansen presented as testimony.
“ We concluded above that the magnitude of global mean greenhouse warming should be sufficiently large for scientific identification by the 1990s. ”
“However, we stress that our ocean model yields relatively smooth surprise-free temperature trends. It excludes the possibility of shifts in ocean circulation or in the rate of deep water formation. ”
“ Our model results suggest that global greenhouse warming will soon rise above the level of natural climate variability.”
These three examples are part of the evidence that there were enough caveats to be clear that there was no consensus even within the paper. How did the director of NASA have time to be this involved with weather even though weather is important to their mission? Did directors automatically become first authors? Tangents are fine, but this subject looks like a full time job. How did all not seem to understand the nature of hypotheticals? Mann’s paper seemed more rational than the rest.
And from his testimony–“We note that the correlations between climate models and observed temperatures are often very poor at subcontinental scales, particularly during Northern Hemisphere’s summer…”
Such methodology is independent of the subject, and occurs elsewhere as I learned about the same time with marine fish population models that ignored natural variability. They are not coming out very well either. One, at least, had error bars from extinction to the need for a bounty.
Minor correction: Hansen never was the head of NASA. That’s the “Administrator” (NASA: National Aviation and Space ADMINISTRATION). It is an opinion (I think it’s true [i.e. a ‘fact’], but I can cite no survey or study, just comments from fellow workers at multiple NASA centers) frequently expressed that Goddard “benefits”/sarc from its proximity to Washington, DC. One of the aspects of that closeness (both politically as well as physically) is that senior appointments typically get attention from Maryland’s senators – all of whom are bluer-than-blue liberal Democrats. Barbara Mikulski was the senator in office (for 30 years, by the bye, with all the influence on both state and national politics that comes with decades of tenure in our Congress) during most of Hansen’s tenure as at NASA Goddard Institute for Space Studies – where he worked (or, at least, was employed – this is not the place for my opinion of Civil Servant work habits) for 47 years, 32 of them as Director. Bottom line: even though Hansen is gone (retired, not dead, before I get lambasted for something I didn’t say), his tenure was long enough to ensure that his philosophy is embraced by at least a majority of his staff and successor. Finally, for those who are not at home with acronyms, his long-term home is the owner/operator of GISTEMP, typically referred to as GISS, the high-quality, extremely accurate and overly precise/sarc encyclopedic repository of global temperature files (which, as most of you are aware, is NOT the same as accurate data).
Does nobody here have copies of that transcript & associated documents from the 1988 Senate hearing? Please??
Larry Hamlin ==> When dealing with Tide Gauge data, even NOAA’s latest calculations, it is absolutely imperative to read the fine print.
At the top of the pages giving regional trends NOAA includes the cave of GPS@Tide Gauge at:
[See this page for an example.]
NOAA acknowledges that these graphs generally show, not sea level rise, but Vertical Land Movement.
It is nearly senseless to look at Tide Gauge data in the absence of GPS@TG correction for Vertical Movement of the Tide Gauge itself ( Continuously Operating GPS Reference Station attached to the same structure as the tide gauge) except in reference to the locally important Local Relative Sea Level and its changes.
As NOAA says, without GPS@TG, one gets a graph of “the differing rates of vertical land motion”.
Figure 1 can’t be the original Hansen [1988] graph – it shows observations up to 2011. Why not 2017?
Curious ==> I’m curious too about the graph Fig. 1 — it is was used in this post:
https://wattsupwiththat.com/2016/12/03/shock-the-father-of-global-warming-james-hansen-dials-back-alarm/
and, frankly, the caption doesn’t even make sense to me — the projections seem to start in 1968, claim to be made by Hansen in 1988, and are labelled “Models vs. Observations 1958-2011”
As a contributor here, I know it is common practice to grab a piece of art (photo, drawing, graph) from some earlier essay here and re-use it to illustrate a point. The point being illustrated, I believe, is Hansen’s projections were far greater than subsequent observations — and nothing more than that. [I admit to having made the error of not being careful enough to make sure I have ‘borrowed’ something that not only illustrates my point but is accurate, dependable, and generally defensible.]
Kip,
Yes, Fig. 1 above also compares ‘annual’ global mean surface air temperatures (per Hansen et al. 1988, fig. 3) with the ‘5-year running average’ of “observed temperatures” – ending 2011. Never mind that no data set is cited, clearly it’s pointless to compare annual temperatures against 5-year running means.
I looked up Hansen et al. 1988 at NASA’s website, where it is free to download. Their fig. 3 seems roughly correspond to the above fig. 1. Hansen et al.’s chart is set to the 1951-1990 anomaly base, so we can use current GISS annual anomalies to make a direct comparison, since these use the same base. These were as follows for the past 3 years:-
2015: 0.87
2016: 0.99
2017: 0.90
I’ve roughly plotted these values against Hansen et al. 1988 fig. 3 below. They are a good match for Hansen et al. scenario 2. They certainly don’t look anything like the ‘observations’ shown in the above fig. 1.
DWR 54
According to your chart temperatures are now about as warm as the maximum during the Eemian interglacial. This implies that about half the World was actually cooler during the Eemian maximum than now.
Would you please give a hint about where this half is to be found? I’ve studied the Eemian a great deal and it is very hard to find any place that was cooler then, much less half the World. As a matter of fact it was appreciably warmer than now just about everywhere where we have information.
” ending 2011. Never mind that no data set is cited, clearly it’s pointless to compare annual temperatures against 5-year running means”
Yes, not citing the dataset is a giveaway. I suspect it is an old version of RSS TLT, which of course is not at all what Hansen was predicting. And yes, stopping in 2011 to test a 30 year prediction!
Here (from here) is a plot to end 2016 of Hansen vs annual GISS land/ocean in brown. Of course, Hansen wasn’t predicting that either; there wasn’t a land/ocean index then. What he did have was his met stations only index, air only and still maintained by GISS. It’s what he plotted for comparison in the original graph. I’ve shown that in blue.
As you can see, warming wasn’t “grossly exaggerated”. Since forcings worked out to somewhere between his B and C, the forecast worked very well.
tty
I’m afraid I must bow to your superior knowledge of the Eemian, of which I klnow little. I was simply pointing out that observations are much closer to Hansen et al’s. 1988 forecast than figure 1 of the main article suggests.
Didn’t Doctor Hansen predict/forecast/project that New York’s West Side Highway would be under water by now? I was there last June and it was high and dry.
If you wish to find out about sea level rise, talk to the mayor of Tangier Island, Maryland, and, unlike former Vice President Gore, listen to him.
Tangier Island’s issues are subsidence and not SLR
We don’t know, because the journalist in question pulled his words back later on. Hansen, AFAIK, did not complain his words were wrongly intercepted. Move the goalpost. Move it couple of decades, so you can be pretty certain it is forgotten by then…
Here in New Zealand we have land uplift (via earthquakes) here & there, so the rising sea in some places is offset by the rising land in others. Latest is Kaikoura which rose 5 meters with the coastline pushed outwards accordingly. In other places (like the Kapiti foreshore) there is coastal erosion but higher up there are older recent shorelines showing that Kapiti does rise periodically (most recently in the 1855 Wellington earthquake) which more-than-offsets the erosion.
The point is that uplift isn’t taken into account when mapping the so-called sea level rise when in fact it’s a cycle of slumping and uplift, the slumping being gradual and the uplift sudden. Until uplift is incorporated into the measurement paradigm, they won’t be getting it right.
Larry wrote: “NOAA tide gauge location measured rates of coastal sea level rise remain consistent with trends going back 10 or more decades at these and other locations showing that claims of man made global sea level rise acceleration remain unreflected at coastal locations.”
Larry, how does one detect an acceleration in sea level rise? Compare the slope for the first half-century to the slope for the second half century? The IPCC says that significant anthropogenic warming only occurred in the second half of the century. So maybe we should look for acceleration only in the second half of the century? The most recent 25 years vs the preceding 25 years? How long is the lag between warming and acceleration of SLR? The problem is that variability in sea level at any one site is so large that the 95% confidence interval for that slope might include 0, meaning that there is no statistically significant SLR. Due to the natural variability in sea level, and local variations in the rate of SLR and vertical land motion, detecting a change in the rate of rise with tide gauges is extremely difficult.
The proper way to detect acceleration is to due a multiple linear regression with t^2 and t (using the midpoint for t = 0). If the 95% confidence interval for the quadratic coefficient doesn’t include zero, then acceleration is statistically significant. Acceleration has allegedly finally be detected in the satellite altimetry record, which is much less noisy than tide gauge data because it samples sea level globally every day. Unfortunately, satellite altimetry is prone to systematic error, and acceleration wasn’t demonstrated until the first 7 years of the quarter century had experienced their third major correction due to systematic error.
The difference in the rate of warming between 1850 and 1950 is not significantly different from the rate of warming from 1950 till today.
Please explain how the climate managed to perform this smooth handoff between natural warming and CO2 warming, such that the total amount of warming remained unchanged?
A study was done about 10 years ago looking at global sea coast in the world. Over the previous 30 years coast increased by 30,000 km.
The reason for the increased coast is because the narrative of global warmists is completely lacking in most of the facts:
1) The sea level models are based on a bogus concept that removes the fact land is buoying due to the end of the ice age 20,000 years ago. In other words, the reduced pressure of the ice is causing land to rise. This is probably why tide guages show half the predicted sea level of “global warming” sea level models.
2) Detritus and natural washing ashore of plants, animals and soil plus volcanoes and venting of volcanoes increases the size of islands over time. It is actually significant.
3) Increased rainfall predicted and confirmed by data are refilling aquifers on land. This increases land height resulting in about 0.27mm of rise each year offsetting ice loss
4) Humans build coastal area
5) glaciers melting on land not only drain water but also deliver silt and carve down mountains reducing the altitude of mountains and leveling and overall raising the amount of land.
6) As glaciers melt more it creates a kind of archimedes effect which lifts land. The 1st point above is a similar effect but relates to more recent glacier melting.
For these reasons and probably others the entire idea that there will be significant reduction in coastal area by 2100 or even any island reductions is specious and unsupported. Recent evidence shows that the claimed demise of some islands was wrong. They are bigger now than 20 years ago when they predicted they would be shrinking.