UPDATE: 3/13/18 After review of comments, data sources, and the article itself, I have concluded that because some old and faulty data was used in the article, the premise and conclusions are not accurate, and therefore this article should be ignored due to the use of the faulty data. If at such time the article is revised by the author (Archibald) to include updated data, this article will be deleted, and a new one put in its place.
– Anthony Watts, publisher, WUWT
Guest essay by David Archibald
This recent post discussed the end of the Modern Warm Period and the year that global cooling began. That post was inspired by a comment to a post on WUWT six to eight years ago to the effect that climate is controlled by the Sun’s magnetic flux – no need to worry about much else. The comment seemed to come from a warmer scientist – they are well funded, have plenty of time on their hands, some are smart and idle curiosity would get a few looking into what controls climate. The results would not be published of course. To paraphrase Mussolini, everything within the narrative, nothing outside the narrative, nothing against the narrative. If the Sun’s magnetic flux controls climate, you don’t have to worry about what goes on under the hood – the effect of EUV on the NAO, the GCR flux, the F10.7 flux, any other flux apart from the magnetic flux.
A comment by Bellman on that recent post inspired me to process the aa Index data a bit further. This is what the aa Index looks like from the beginning of recording in 1868:

Figure 1: aa Index 1868 – 2018
The end of the Modern Warm Period remains December 2008 which is the month of the Solar Cycle 24/25 minimum. The beginning of the Modern Warm Period is now September 1933 which is the month of the Solar Cycle 16/17 minimum. That is the true beginning of the Modern Warm Period because of what is evident from this graph:

Figure 2: Cumulative aa Index against long term average 1868 – 2017
It is evident from Figure 2 that 1933 marked the reversal in the trend of the cumulative aa Index plotted against its average. The Sun was running a lot hotter from 1933.
That interpretation is supported by the longer term Open Solar Flux data set by Lockwood:

Figure 3: Open Solar Flux 1676 – 2011
The Maunder Minimum, the Dalton Minimum and the 1970s cooling period are evident from Figure 3. The lows in Lockwood’s flux during the Modern Warm Period remained higher than the average of the period from the Dalton Minimum that preceded it. Once again, plotting up the cumulative data of this series makes the break in trend evident:

Figure 4: Cumulative Open Solar Flux 1676 – 2011
Confirmation that 1933 is the beginning of the Modern Warm Period comes from the climatic response, starting with glaciers:

Figure 5: Curves showing the variations of glacier termini
Figure 5 is from page 15 of Ahlmann’s 1953 report to the American Geographical Society entitled Glacier Variations and Climatic Fluctuations. Glaciers in Sweden, Norway and Iceland started retreating a lot faster from about 1933. So did glaciers on the opposite side of the planet:

Figure 6: Glacier length South Island of New Zealand
Figure 6 shows that three of the four glaciers on New Zealand’s South Island started retreating about 1933. If a lot of glaciers started retreating around 1933 that should be evident in the rate of sea level change. And so it is:

Figure 7: Global Sea Level 1700 – 2002
Figure 7 shows that sea level was effectively flat from around 1900 to 1933 then took off from 1933. Now that the Modern Warm Period is over, glaciers should have stopped retreating and should now be bulking up. There is evidence for that starting with the Greenland Ice Sheet:

Figure 8: Accumulated Surface Mass Balance for the Greenland Ice Sheet
The blue line is the 2016 – 2017 season which was at the upper bound of accumulation from 1981 to 2010. The Greenland Ice Sheet is back to putting on weight and that is coming out of the oceans. Figure 9 shows where the weight went on, all 544 billion tonnes of it:

Figure 9: Map of accumulated anomaly since September 1, 2016.
The readouts are in the blue – Greenland, on balance, is now a story of ice accumulation. Other climatic evidence for the end of the Modern Warm Period is the plethora of cold temperature records set in the United State and Europe in early 2018, including sharks freezing to death.
David Archibald’s latest book is American Gripen: The Solution to the F-35 Nightmare
The glaciers of New Zealand are currently growing. A recent paper by warmists at Victoria University comes up with an excuse as to why this is. Using an iPad I can’t link but google finds it.
Chris, the two main advancing glaciers in NZ, Franz Josef & Fox, reached their recent maximum advance in 2008. In recent years they have both retreated back to where they were in the 1970’s and early 80’s when I first saw them. The Vic. Uni. study claimed that the advances were as a result of local cooling over the past 30 years. I can agree with that if it is taken in tandem with earlier conclusions that the two West Coast glaciers in particular were advancing because the persistent El Nino events throughout the 1980-early 2000 period brought more precipitation in off the Tasman Sea contributing to the mass gain on the neve’s that feed the glaciers.
On the whole El Nino events bring slightly cooler conditions to NZ, and wetter for the West Coast of the South Island, while La Nina events bring us our hottest summers, as is the case right now.
It would be nice in these discussions to use the same locations when showing changes in trends. Saying look at NZ for retreat, and the look at Greenland for advance smacks of cherry picking even if that isnt so, and there are reasons for using another example.
It would also be nice if all of the acronyms were defined before they were used.
As far as I can tell, all attempts to tie the climate to solar activity have been a bust. Herschel thought he found something. It wasn’t useful for predicting anything though. Similarly for everyone since then.
If you’ve found something that nobody else has, and it’s valid, you deserve the Nobel Prize.
See Nir Shaviv’s work.
You sound like a man with an agenda. Lots of luck!
Not me. There are some folks here who know way more than I do and who have very strong contrary opinions. My comment was sincere.
For example, check out lsvalgaard’s comments.
I think a lot will be ‘exposed’ in the next 3-5 years. The fact that sea level rise, temperature rise, ‘extreme weather’ has not followed predictions is pretty telling. But, what do I know, I’m not a brown robed ‘scientist’…
“As far as I can tell, all attempts to tie the climate to solar activity have been a bust.”
As far as I can tell, you’re full of cow excrement.
Enough with the Orwellian lexical drift!
The term is Modern Optimum.
Butbut, the walrus babies are crushed in haulouts and becoming more and more end-angered! I just saw a heart-breaking nature film on them dying at the paws of white killers (and I’m not talking about the pictured polar bears).
When charged by an end-angry walrus, the best defense is to off-end it using zoophobic code-words. (Walruses and their Eurasian relatives, Kievan Walruses, can hear sounds in the dog-whistling range, even if such language is inaudible to humans.)
But as always, the best Arctic survival tip is simply to use your common sense (or Inuition).
[Ouch. Is that school of hard knocks paid for with higher Inuition rates? .mod]
Who cares about baby walruses? It’s the baby marmots that we need to save. They’re fleeing to Canada because global warming and then being eaten by carnivorous baby polar bears! Oh, the humanity, er, I mean oh, the marmotony. If we don’t act soon, it will be too late. If we don’t succeed, we risk almost certain failure.
My pet hamster died of heat exhaustion yesterday
Don’t care about your polar bears and marmotry, I just want revenge on people who made it too hot for him.
And someone to remind me to feed and replace water for my next one
From the Kievan Walrus to humble rattus norvegicus, all “subhuman” species except the stoats have an inherent dignity and a reasonable entitlement to safety (up to and including active efforts to conserve them) from human depredation, no matter what one’s climate politics. Surely. I’m as “speciesist” as the next apex hominid, and I will always favor human rights over animal rights if the choice is forced on me, but I think we can all agree that all things being equal it’s regrettable for any non-stoat-based animal to be endangered by our activities, if we can help it. Most religions and value systems have the concept that we are custodians of almost all of God’s, Gods’ or Goddesses’ creations, and that if at all possible, it’s our duty to ensure our children inherit a planet 99.999% as biodiverse as the one our parents bequeathed to us. Unless an animal goes out of its way to be a virulent pathogen, stoat, or man-eater (of the kind that rarely exists outside Hollywood) we have no right to go out of OUR way to extirpate it, let alone to turn its extinction into a joke.
L O L !!!!!
Brad Keyes wrote:
Weasels are well situated in the climate science game. Perhaps we should even say they are authoritative, as they’re the namesake of a category of words that hold the whole thing together. But stoat words, no. They cross a line not even a filthy sewer-dwelling rat would cross.
There is already a Holocene Optimum, which really was nice with no Arctic ice cap and sea level a couple of metres higher. It would be too confusing.
Based on your graph, shouldn’t the modern warm period have started in 1898 rather than 1933?
Clarification: In the above, the reference is to Fig. 1.
If you start out on the wrong foot, the rest is not credible.
1: The aa-index was wrongly calibrated before 1957 by 2-3 units.
2: Lockwood’s ‘open flux’ series is just plain wrong [bad science lives forever]. Even he has admitted that.
Here is what the open flux evolution looks like [as per Lockwood in 2015]
http://www.leif.org/research/Open-Flux-since-1600.png
Not all bad science lives forever. Cagw is on its last legs.
wishful thinking…
Not wishful thinking. I wish for a warmer world but I doubt it will happen. But either way what I wish for is irrelevant- the world is going to do what it has always done- change.
I always look in the comments for your reply to pieces attempting to relate solar activity and climate. Thankfully, you always set the record straight.
That said, what is the basis for your view that AGW theory is correct? After all, the behavior of leading climate specialists would seem to indicate that the they don’t have much of a case.
Thanks.
basis for your view that AGW theory is correct?
where do you get that [wrong] idea from?
Here is my view on climate change:
http://www.leif.org/research/Climate-Change-My-View.pdf
Apology for the OT…
Leif, a fascinating, well researched read, far more interesting and persuasive, let alone credible.
An except for example:
Berger and Loutre argue (Science, 297, 1287, 2002)
…that with or without human perturbations, the current warm climate may last another 50,000
years. The reason is a minimum in the eccentricity of Earth’s orbit around the Sun, but
eventually, the current interglacial will come to an end, and we resume the slow decline
towards the next glaciation many tens of thousands of years in the future, and thus of
relatively little concern today.
Couple of points.
“The discrepancy between the ocean-record and the instrumental
record is a serious puzzle and needs to be resolved.”
Any update on this?
In your conclusion you say:
“However, science is ultimately a self-correcting
process where the scientific community plays a crucial and collective role, so we will
eventually get it right…”
Almost three years old, how are we going? Still [wrong]?
Almost three years old, how are we going? Still ?takaes much longer than that.
Probably not in my lifetime.
I guess you are saying the A in AGW will not become uncontroversial. But you are an ‘old fart’.
This is a most suspect and dubious claim….”So, the (misnamed) greenhouse effect arises
because the surface now receives energy from two sources, the Sun and the heated
atmosphere”….. Since when does air have any significant capacity to heat solid ( earth).????.
You’ve never blown warm breath into your hands to warm them up on a cold day?
zazove
Followed quickly thereafter with colder skin as the condensed water evaporates and chills the skin. It is the friction of rubbing that warms, and the muscle energy of movement and shivering. The warmer blood from the central core warms the extremities (cools the core) as it circulates near the skin.
thanks for the link leif, that is the first time i have read that despite more than a few visits to your website. very interesting read and well presented.
Thanks Leif. It is always good to have the “least inaccurate” data. 🙂
The Maunder and Dalton periods are clearly evident in all 3.
The Maunder and Dalton periods are clearly evident
So are the two other centennial minima [Gleissberg 1878-1933, and Eddy 2009-2050?]
In physical terms, the Sun’s total energy received by Earth varies by just a very small amount.
It is not enough to change Earth’s temperature from year to year or even over a whole solar cycle. That is why it doesn’t show up.
BUT, we know energy accumulates on Earth. For example, the oceans are accumulating energy at 0.5 W/m2/year. That is still a very small amount and is raising the ocean temperature by just 0.001 C/year.
So, then let’s say we have a slow rise in the Sun’s energy over 50 or 100 years. If it is higher than it was before, it will slowly accumulate energy on Earth. Something like the oceans are accumulating a little more energy each year. 1 or 2 W/m2 change in total solar irradiance would be just enough to do this.
50 or 100 years of enhanced solar energy (even if it just a very small amount higher), it will slowly raise the Earth’s temperature. If you have a Maunder Minimum, energy will slowly leave the Earth system and it will cool off.
I think Leif should be able to crunch the numbers and put a new paper out and change everything based on this. I already did it and it works.
So, then let’s say we have a slow rise in the Sun’s energy over 50 or 100 years
There has [as is obvious from my Figure] not been any ‘rise’ [slow or otherwise] over the past 300+ years.
If it is higher than it was before, it will slowly accumulate energy on Earth. If you have a Maunder Minimum, energy will slowly leave the Earth system and it will cool off
This notion is nonsense. The Sun always heats the Earth [never cools it] above the -50C due to the internal geothermal heats. And in any event the evolution of solar output the last 300 years does not match that of the climate.
I already did it and it works.
So reserve your ticket to Stockholm to claim your Nobel prize…
What is your TSI reconstruction for 1600 to 1700. 1361.0 like all other time periods?
What is your TSI reconstruction for 1600 to 1700. 1361.0 like all other time periods?
You are not up-to-date [or just playing dumb].
Here is the TSI reconstruction:
http://www.leif.org/research/TSI-since-1600.png
So. Is that 100 years of missing the +1.0 W/m2 part of the upswing in the solar cycle.
Would that not result in a cooler Earth since it is getting lower TSI in those 100 years than the previous 100 years and the 100 years after.
Would that not result in a cooler Earth since it is getting lower TSI in those 100 years than the previous 100 years and the 100 years after.
yes it would to the tune of 0.05 degrees. but you have now moved the goalpost. You were talking about the Maunder Minimum, so what is that with the ‘previous 100 years’? for which we have no data. Such tactics is typical of agenda-driven views.
Leif
You think the Nobel committee would recognise any work questioning AGW? Dumb gets no dumber than that.
Bill Illis is correct – the oceans do slowly accumulate heat from increasing TSI. That is why every interglacial since the MPR coincides with a peak in obliquity (providing it also coincides with a peak amplitude in modulation of precession and 65N summer insolation which both coincide with eccentricity maxima) lagged by 6500 years.
If ocean heat is not accumulating from an insolation excess (e.g. from obliquity), then what is your alternative?
Actually Bill (significantly less dumb than you) gave a figure of 0.001 degrees per year of solar ocean warming which makes good sense in terms of the obliquity data. x6500 years it gives you 6.5 degrees – an amount of ocean warming that plausibly would lift the planet from glacial to interglacial.
But changes from solar are slow – as the obliquity data show.
the oceans do slowly accumulate heat from increasing TSI.
except that TSI has not increased the last 300 years.
If ocean heat is not accumulating from an insolation excess (e.g. from obliquity), then what is your alternative?
You are conflating TSI with insolation. TSI is a property of the Sun, the insolation is a property of the Earth.
They have nothing to do with each other. The effect of TSI is minute, theeefect of the insolation is much larger.
I am saying the Earth accumulates energy or loses energy over time periods because it DOES.
Let’s think of the seasons alone. Let’s think of the ice age / interglacial cycles.
It is a slow process. Even the seasonal change is very slow compared to the solar irradiance changes.
AND, the seasons lag behind the solar iradiance peaks / lows by 30 days on land, 45 days in lakes and 70 days for the oceans. This is proof on its face. Energy and the resulting temperature of the Earth or any object in the universe will slowly change based on the incoming and outgoing energy rates.
I am saying the Earth accumulates energy or loses energy over time periods because it DOES
Sure it does at any one place, because all those external changes are cyclic. Warm during the day, colder at night, but washes out because when it is day at one place, it is night somewhere else, so overall o effect. And warm during the summer and colder during winter, but washes out because when it is summer at one place it is winter somewhere else. TSI varies up and down, over decades and centuries, so overall no long-term effect. Glaciations come and go, but overall no long-term effects.
Leif – I appreciate your ‘viewpoint’ pdf very much and will recommend it to friends. However, there is something going on I don’t understand. You say there is no change in TSI over the past 300 years. That would. You mention the temperature on the Tibetan Plateau correlating to the AMO…it also correlates to global temperature (as the AMO influences global temperatures), and recent spectral analysis of tree ring data (Liu et al. 2011), picks up this 100 year cycle, as well as a 200 year and an 1100 year. TSI changes may be small, but are sustained over a 100 year period and could be stored in the oceans. TSI changes can also influence cloud cover and ocean currents via jetstream effects, and it would appear this dynamic is sensitive to changes in far-UV, which are much greater in percentage change than the visible spectrum – as much as 8%. The most recent models are incorporating top-down UV effects (Meehl et al, 2013) as part of the longer term drivers of Maunder Minimum type cycles.
If we look at the last 100 years, the UV peaks would have come in the 11-yr cycles peaking in or around 1990 and 2003, on top of the cumulative rise since 1900. This source of heat then has to have a phase relation to the AMO. There is plenty of room for a time lag where the global T peaks around 1998/2016 aided by ENSO cycles….so I don’t read much into your ‘mismatch’ between TSI and global temperatures. The oceans have stored 100 years of global temperature rise and as they go into a release phase, surface temperatures will rise as the heat moves out….this is especially the case for the Arctic region.
You mention the Antarctic Oscillation. Jackson Davis and I have just published an analysis where we argue that these oscillations are the long-term equivalents of an average 350 year oscillation whose period correlates to orbital parameters that affect 65N (and hence also 65S), and review evidence that this oscillation may be a primary driver of cycles in the Northern Hemisphere. I will send you a link (we intend also to post the link on WUWT very soon and will appreciate all comments and criticisms).
I don’t know how old you are – I am three score and ten, and expect to know whether this analysis is sound within the next twenty years…gods and goddesses willing!
there is no change in TSI over the past 300 years
There is no long-term change, but a clear ~100-yr ‘cycle’.
http://www.leif.org/research/TSI-since-1600.png
TSI [and solar activity in general] now is what it was in the 1900s, 1800s, and 1700s.
Three scores and fifteen
changes in far-UV, which are much greater in percentage change than the visible spectrum
The UV has no long-term variation either:
http://www.leif.org/research/EUV-F107-and-TSI-CDR-HAO.pdf
http://www.leif.org/research/EUV-since-1740.png
Good agreement is not necessarily a good thing. If the same method was used, or the raw data was identical, good agreement usually means that the same errors were made. I don’t say that this is the case here, just that it’s not an argument for correct results.
As should be clear, the three panels are based on different data: Geomagnetic (back to the 1740s], Cosmic Rays, Sunspots.
I would not say ‘good agreement’ is that were not so.
I can’t believe that archibald did not know the data had been updated. The use of knowingly outdated data should speak volumes about whether or not this man should be allowed to post. Just my opinion.
especially since WUWT knows full well that lies travel faster.
The defense of posting garbage used to be:
‘ Let the readers peer review and point out the mistakes”
but what we NOW know, is that some people will just swallow the lie and pass it on. They wont read the comments. they dont know who leif is, they just copy and paste the garbage.
Its clear david uses juke data. its also clear that WUWT should do retractions and show science journals how it should be done
Food for thought. Sharks freezing and Minnesota colder than Mars … great stuff!
But don’t forget, the 9th Circuit will shortly be ruling on whether our “children” have a Right to a stable climate. The product of their deliberations are likely to be seen as more important than the coming of the next ice age.
I think the 9th already ruled that the “children’s” lawsuit may proceed.
The problem with all these things is that we have no real idea as to the temperature of the planet over time.
Is it any warmer today than it was in the late 1930s/early 1940s? We simply do not know because our data is not fit for purpose.
At no time are we making like for like measurements, which can be directly compared with one another without adjustment/homogenisation/manipulation. so we have no idea whether there has been any real change in temperature, or merely an apparent change due to the way the data is worked and presented.
We badly need to retrofit the best sited stations (where there has been no change in environment) with the same LIG thermometers as used in the past at each station, and then take measurements using the same historic practice and procedure for each station so that current collected RAW data can be directly compared to historic collected RAW data (at each station individually) without any adjustments being made whatsoever to the RAW data.
The problem with all these things
The real problem is that some people use wrong/outdated solat/geomagnetic ‘data’ to explain wrong/outdated temperature ‘data’ as long as they support their wrong/outdated claims.
All is confirmation bias.
Pot? Meet kettle.
at least to pot and the kettle agree.
The real problem is time. We need to collect real and accurate data for several decades to come before we can hope to gain a larger understanding of what is really going on. Attempting to reconstruct past conditions based upon proxy data is all well and good, but it is in no way comparable to real data measured directly with modern instruments. In the mean time most people will continue paying the steadily increasing CO2 taxes, wait for the next CO2 induced extreme weather and hope for the best..
I agree.
not even wrong.
Mosherism ?
Where I used to live (and farm) at the very north western corner of England ~half a mile north of Hadrian’s Wall – ‘just up the road’ from where/are some (by UK standards) some very large stands of trees.
Kershope and Kielder forests.
I like to explore and visiting the forest was almost always an (for lack of better word) emotional experience.
Even from 3 or 4 miles away, long before seeing any trees, you ‘just knew’ something was over there.
Was it a smell, a chill in the air, a change of the light/sky colour – something set the hairs tingling.
(From accidental experience of water divining, I also think it’s something like that also. We are creatures effectively made of water and water has a truly epic affinity for itself)
And when the trees do hove into view, the first thing that you notice is low clouds hanging over them, apart from during big anti-cyclonic weather events. Rare in NW England.
Is that ‘climate’ Those trees are affecting the (local) weather and hence the climate.
What would happen if they (suddenly) disappeared?
What if someone chopped them all down and burned them?
As humans, we’ve been doing that for millennia, not least because forests are very poor and difficult places for us to find food.
The clouds, the dampness and the food ‘problem’ = the forest(s) are extensions of the oceans.
Is not the weather different at sea than it is on dry land?
Answer that question and think about why.
Now to the actual on-topic point about cosmic rays, sun spots, cycles and cycles.
To my mind, it i all completely bogus and a manifestation of humongous sense of self deprecation we seem to have.
“Oh, us puny little humans couldn’t *possibly* change the weather (hence climate if you like). We are all so small and insignificant, something *much* larger must control the weather. Not us. Oh no. Something else makes weather & climate”
Hence my intro – Are you REALLY saying that chopping/burning a forest would have entirely zilch effect on the local weather – and if it happened on enough ‘local levels’ around the globe, maybe even the entire Global Climate?
Really? Are you sticking with and hiding behind the false modesty and self deprecation?
Why? Are you actually ashamed or guilty about something?
Of course hiding behind computers is absolutely fantastic because then the questioner cannot see the unease, blushing face, sweaty brow, lowered gaze that and abrupt mood change that the passing off of untruths brings on.
Another example in the climate thing is the thinking about clouds.
So many times I get the impression (apart from Willis’ Witterings) that everyone thinks there are a a set number of clouds on this planet and they move around (under some greater control mechanism) dispensing ‘good climate’ or ‘bad climate’ as is their whim, or the whim of the ‘greater thing’ – be that sunspots, cosmic rays, dusts, aerosols, volcanoes whatever whatever etc etc
Why do we behave like children? Why do we shirk responsibility so much?
It’s all about power and money. Always has been, but now it’s become a global game of mind control. Use a simple, unified explanation of every inclement weather event to inflict guilt and fear upon the serf population. Change the voters’ perspective until they vote themselves into repression and despotism.
I’m with you on the cloud thing Peta, here in my corner of the Mississippi River bluffs north of St. Louis Mo I’ve seen only a couple of cloudless days since winter began. That’s more cloudiness than I remember seeing since I was in third grade in 1965-66.
we seem to be getting regular fog back here on the east coast of scotland pop piasa. it was a rare occurrence for a number of years.
I think these humor posts are very good, but Josh should illustrate them.
I had a good laugh with extending the LIA to 1933, picking 1933 as a special point in a sea level graph that shows sea level rising since 1850. Going to the particularly fickle New Zealand glaciers to make a global point. Saying that the warming ended in 2008, just before the 4 warmest years on record, and so on.
Hilarious. Simply hilarious.
Please define record.
Definition of record
1 : the state or fact of being recorded
2 : something that records: such as
a : something that recalls or relates past events
b : an official document that records the acts of a public body or officer
c : an authentic official copy of a document deposited with a legally designated officer
d : the official copy of the papers used in a law case
3 a (1) : a body of known or recorded facts about something or someone especially with reference to a particular sphere of activity that often forms a discernible pattern – a good academic record – a liberal voting record (2) : a collection of related items of information (as in a database) treated as a unit
b (1) : an attested top performance (2) : an unsurpassed statistic
4 : something on which sound or visual images have been recorded; specifically : a disc with a spiral groove carrying recorded sound for phonograph reproduction
https://www.merriam-webster.com/dictionary/record
I don’t know where you get ‘the four warmest years on reacord’, Javier, but the past SEVEN years have included springs that started very late, snow in April, cooler than usual summers, and excessive winter snows and spring/summer rains that led to flooding, which until 2011 was rare in my area. It’s nice to not have to run the air conditioner, but not quite so wonderful when I’m photographing birds in April getting bird food that I put out for them in the snow. Yes, I have pictures of all of this. I also have photos of late snows (late April) in my yard and on my front steps.
You can be as disdainful of these things as you like, but the fact IS that things are changing, not toward a continuing warmup but toward the opposite direction.
You can ignore it all you like, but this trend is toward a cooler planet, especially with the Sun in a dormant state with no indication of when or if it will return to a higher level of solar activity. If you think the Sun is not important, then why does each hemisphere experience a distinct shift toward winter precipitation patterns and cold temperatures with the seasonal changes?
Yes, it sure feels like it has been cooling since 2008.
http://assets.climatecentral.org/images/made/2018GlobalTempReview_Bars_F_en_title_sm_660_371_s_c1_c_c.jpg
That’s what I call a well supported statement.
Using GISS’ hottest years as an argument.
ROFL.
Honestly Javier since i compared GISS with our own RMI and the output of GISS compared to the RMI output, i really doubt the exactness of GISS their graph.
At some points the GISS grid did color belgium in a +1.5 degree anomaly gridcell…
when i compared our RMI observations and month value it was -0.6 degree anomaly.
Since then i do not believe in GISS as a correct global temperature map anf/or curve.
why? How much of all other weather stations are ignored or filled in with rubbish data compared to the real observations?
“with extending the LIA to 1933″….why?..any date anyone chooses is an arbitrary date anyway
1940…1950?….pick one
Arbitrary? Not so. What about 1840?
I meant with regard to climate. Anyway, it would seem that by your obfuscation, you understand the issue.
I went to a special effort to state the months that the thing started and finished.
“Saying that the warming ended in 2008, just before the 4 warmest years on record, and so on.”
To be fair, David Archibald spotted this shift at the time (2008), and, in a submission, alerted the Australian Senate:
That is nearly 2° by now.
“Modern Warm Period” is a poor choice of words for two reasons. First because the abbreviation will confuse with the Medieval Warm Period. Second because it will not be “modern” during the next warm period.
The phrase does however give the idea that current warming is only temporary.
How about ‘Evil Warm Period’?
Perhaps the Millennial Evil Warm Period.
“Millennial post-modern optimum”, just to please Mr Keyes.
I would call it the AWP Adjustocene Warm Period. reason how much of it is caused by adjustments?
This is arguing that the warm period begins and ends where your model says it should, ignoring any actual data. If a climate scientist did this with CO2, assuming warming must have gone as CO2 did, with no supporting temperature data there would, quite rightly, be a lot of skepticism.
Also, why are you now using cumulative aa levels? What are you using as the zero point for aa levels to make the cumulative graph work? Finally, do you still require the 6 year lag you needed last time? If so wouldn’t that put the true end of the modern warm period at 2012.
Bellman, I am glad you have turned up. Thanks again for inspiring me to torture the data a bit further. I am quite happy with that cumulative aa Index graph. The change in trend is stunning. We use the God-given solar minima as our start and endpoints because to eyeball it would mean human interpretation.
Thanks, I think, for crediting me with the inspiration of your new hypothesis. But you haven’t really answered the question as to why you think a cumulative aa Index is an improved model, other than the fact that it gives the stunning results you wanted. The fact that the change in trend is stunning is more of a problem when it doesn’t agree with any temperature data.
Nor have you explained how a cumulative, random walk, is physically possible for temperatures, or how you determined the specific cut off for positive or negative effects of the index.
Out of interest I experimented with different zero points for the cumulative aa index and found the best fit with temperature occurred if you assume a “normal” value of 15. This produces a cumulative index that agrees well with temperature, almost as good as the correlation with CO2, but is obviously not the value you used.
This only includes data up to 2010, I expect there would be a lot more divergence after that.
Well, from an interested observer and a ‘not by any means expert’ viewpoint. The idea of solar flux being able to control climate was long dismissed as this alone cannot account for warming or cooling of climate. Seeding of clouds seems to have been debunked by many very serious people and ionization alone has it’s detractors as well. My thought is as long as the correlation of solar activity with climate can be shown the actual explanation of how it works is something that should be studied, however it is irrelevant to the fact that it can be shown to be connected. It is the starting point for understanding.
as long as the correlation of solar activity with climate can be shown
Except that there is no such correlation.
Excuse my ‘inexpertise’ but exactly when did you provide any dispute to the information shown in the article? I must have missed that.
I must have missed that
Indeed you did. But would you read it, if I provided it. My guess is ‘probably not’.
Anyhow, you might try: http://www.leif.org/research/The-July-Seminars-2015.pdf
If you are reading challenged, you can see the talk on youtube:
Doc, wherever you were lecturing needed a new tech system.
That is a very informative lecture. I wish it had a larger view count. It is important information for any solar geek (like myself).
David, I agree that the sun’s magnetic field evolution is responsible for the warming of the 20th century. I think you told a story, but you didn’t do enough science. Part of the science is understanding the limitations of the type of data you’re using.
I agree there is an inflection point in solar activity in the mid-1930’s, per your figure 2. I have a similar graph.
But what I don’t agree with is using the AA index to determine it, when sunspot numbers are available, and for the additional reason that it is possible now to relate TSI to sunspot numbers, as they both follow the change in the sun’s magnetic field over time. Sunspot numbers delineate the inflection point in 1935, not 1933. Further, you’d want to recognize that it’s TSI doing the warming or cooling, not the earth’s geomagnetic field response to solar particles, the AA index.
Ending the Warm period in 2008 seems dubious as well. The sunspot modern maximum was 1935-2004, mathematically. Also, you left out important other details that would explain why it warmed to record levels in 2016 or why only a few years later cold/snow records are broken every day this winter?
It’s because you say nothing of the real climate change agent, TSI.
I do agree with you it’s the sun.
“Ending the Warm period in 2008 seems dubious as well. The sunspot modern maximum was 1935-2004, mathematically. Also, you left out important other details that would explain why it warmed to record levels in 2016 or why only a few years later cold/snow records are broken every day this winter?” I would imagine that there would be a lag as cooling off the oceans and land mass would take time. As for the cold/snow records they could be attributable to La Nina or Decadal Oscillation or….
??
Bob, My first pass through came up with 1935 as the start year based on the inflection point in the graph. Then I thought I had better anchor it on the solar cycle minimum. And thus December 2008 as the end date. The warmth of 2016 was due to an El Nino. And that is telling in itself. The noise in the system is far greater than the underlying trend. If you look at UAH global temperature, February 2018 is only up 0.2 degrees C – over 40 years. I will repeat that – over 40 years! Some warm period. Fortunately we can tease it out of the record because we have instruments. The aa Index data go back to 1868 and can’t be fiddled with by any notorious data-fiddler. They keep changing the satellites that measure TSI and that provides the opportunity for the data-fiddlers to do their thing. In the fullness of time TSI might prove to be the ants’ pants but get back to me when we have 150 years of data.
The aa Index data go back to 1868 and can’t be fiddled with by any notorious data-fiddler
It was fiddled with by the notorious data fiddler Mike Lockwood, whom you seem to like by showing hos fiddled graph.
get back to me when we have 150 years of data.
We have more than that for the sun’s magnetic field per Lockwood and me.
Didn’t read this. Started to, but that intent came crashing down when I found it was based on the “aa Index”, whatever that is. No point in continuing.
‘… whatever that is.’
‘The aa index is three hourly index of geomagnetic activity determined from the k indices scaled at two antipodal subauroral stations: Canberra Australia, and Hartland England.’
Geoscience Australia
Thank you. That explanation was conspicuously absent from the post.
But you’ll have missed the irrelevant crank book promo at the end.
Why that’s there is not encouraging, please put it in a bio, or give it a miss. Not appropriate.
What I want to see is confirmation that the snow line in the Arctic is no longer retreating in the spring. It should, in fact, begin to move further south in the northern hemisphere and further north in the southern hemisphere.
There was snowfall in Johannesburg in 2005, which was quite unusual. Then there was a snowfall almost three feet of snow in the Atacama in Chile, in 2011, which had not happened in anyone’s memory, and happened again in 2013 and continues to happen. Snow in Kuwait in January 2016, first time ever recorded. Flooding rains on a now-annual basis in Oman, Qatar and Dubai, which used to happen occasionally, about every seven years or so.
These are on record. I don’t have to make up anything. The end of the ‘warming period’ may have been with the beginning of the new solar cycle in 2008, after an 18-month solar minimum, but there is no sudden start or stop to this kind of thing.
The long-term effects take prolonged periods of time. When there are no instant results, then the shift from a warm state to a chilly state may or may not be noticeable to most people.
But the people the most likely to notice the differences are people who plant the crops we consume. If it’s too wet for hard red winter wheat to ripen and dry properly, it won’t be harvested until weather conditions have allowed it to dry properly. If that goes into August, it delays planting the next crop.
That will affect the price of the bread on your plate and the cereals in your breakfast bowl. It will affect the cost of everything you take for granted, including the clothes you wear and the cost of gas at the pump. It will also affect the cost of gas you use for heating and cooking, and/or electricity you use when you flip a switch or turn on your electric range or run your microwave.
Those are things that you take for granted. It’s all connected. Over an extended time period, difficulty in generating power and transporting natural gas to businesses and homes will become a problem if we aren’t foresighted enough to plan ahead for it.
Yes Sara this year’s NH spring snow extent will be the thing to watch for signs of climate cooling. Spring snow extent is one of nature’s best guides to climate change. Because landmasses cover a large area of the NH. So any changes in the extent over the years will be due to climate rather then local weather. Last year’s extent was well above the trend line. Now should this year’s spring snow extent also be well above the trend line then that would be something for to take notice. Because it would be the first times its happened since the early 80’s. A growing spring snow extent will make the claim that the climate is warming far harder.
Hang on taxed if “any changes in the extent over the years will be due to climate rather then local weather”
wouldn’t that rule out “this year’s NH spring snow extent” because, well, that is not “over the years”.
Even two year is a bit brief to be called “climate” isn’t it?
The one thing the alarmists don’t understand, or perhaps intentionally ignore, is that albedo factor – snow reflects both light and heat. If the snowfields do not melt back and/or begin to slowly creep south (and north), then this alone increases the albedo factor and chills the air above those snow fields. The Great Lakes also contribute to that, as do any glaciers that start to increase in area, and a large inland water body like Lake Baikal or any of the inland seas (Black Sea, Caspian).
I’d like to be able to move ahead 300 years from now, just to see what happens by then.
Anyone got the Tardis available? 🙂
You’re talking albedo and mentioned everywhere except the Arctic ocean.
zazove, my reference goes back to 2008, when the solar minimum that started in 2006 ended in. Between 2008 and now, the weather has become more and more erratic in many places, not just where I live. Currently, the 1.5 inches of snow from the first week of March haven’t completely melted yet. If we get more snow in April, I will do what I always do: photograph it for my records.
You might want to look up the year (2015) Boston was buried in snow. While it was dumped into the harbor, it still hadn’t melted by the end of July that year.
There were icebergs on Lake Superior up to the beginning of July 2014.
https://www.washingtonpost.com/news/capital-weather-gang/wp/2014/06/05/unprecedented-parts-of-lake-superior-covered-in-ice-almost-a-week-into-june/?utm_term=.b5a571cd23a2
These events have always come and gone, and we’ve shaken them off, but now they are happening more and more often and sometimes not leaving at all.
It’s not just one or two years of something. It is repeated years of something, close together but not necessarily happening one right after the other, that indicate there is a long-term trend underway.
zazove: regarding the Arctic Ocean, the entire area has a high albedo already. At this particular point in time, areas to the south of it, or to the north of the Antarctic continent, don’t have the same albedo factor. I thought I was being clear on that. Please do not cherry pick things and tell me I didn’t mention this or that.
if you want a large land mass in the northern hemisphere, how about we start with Siberia? I’m particularly familiar with Yakutia and its environs and which way the wind blows across the North Pole toward us, because we are getting more and more of that nasty bitter cold down here where I live.
zazove
lf this happens over two years in a row l feel it will be important, because this will be the first time its happened since the early 80’s. Every other time since then when a high spring extent year has happened this has been followed with the next spring extent back down to around the average again. But it would need more then 2 years for to be certain it is a change in the trend. So that’s the reason l said over the years.
Because the landmasses covers a large area of the NH where snow falls then this makes it a good guide to changes in the climate. Because changes to the NH spring snow cover extent would be due to the climate across the NH and not just to a single weather event.
This doesn’t tally with what either of you are saying.
zazove
That chart covers the January snow extent of the NH and not the spring snow extent l was clearly talking about. The spring snow extent would show a steady decline over the years. But with last years spring snow extent jumping well above the trend line. Should this springs snow extent also be well above the trend line, then this would be the first time its happened since the early 80’s.
Nope.
zazove, as you have been told multiple times, albedo has next to no impact on the arctic ocean
1) There is no sun for almost half the year.
2) At the solar angles prevelant in the arctic, even in the height of summer, the difference in reflectivity between ice and open water is almost unmeasurable.
That chart just covers the month of April rather then the whole of the spring.
Look at the Rutgers global spring snow lab chart which covers the whole of the spring. You will see am correct.
‘Even two year is a bit brief to be called “climate” isn’t it?’
Yep, climate is nothing less than a ten year trend, the 30 year mark is too far out.
There is no denying that the Spring snow extent in the NH has felt the effect of global warming over the past 30 years, nevertheless these cold air outbreaks in midlatitude and beyond is a clear global cooling signal.
MarkW March 10, 2018 at 5:31 pm
And each time it was regarded as ignorant tosh.
For most of June and half of July the north pole [is] the sunniest place on earth.
http://www.physicalgeography.net/fundamentals/images/insolation_latitude.gif
http://www.physicalgeography.net/fundamentals/6i.html
A typical ocean albedo is approximately 0.06, while bare sea ice varies from approximately 0.5 to 0.7. This means that the ocean reflects only 6 percent of the incoming solar radiation and absorbs the rest, while sea ice reflects 50 to 70 percent of the incoming energy.
https://nsidc.org/cryosphere/seaice/processes/albedo.html
Go and wave your arms at someone else.
That graphic is (deliberately) misleading, but it has successfully mislead you as intended. The graphic plots the theoretical beam direct horizontal irradiation at the earth’s surface. BUT, it not only assumes a clear atmosphere, but a prefectly clear atmosphere as if the earth’s surface were in the vacuum of space. (More honest plots label that value as AM0 (air mass 0). You will also see that value as ) Even a “perfectly clear real atmosphere” at the equator with the sun directly above attenuates the air: That value when the sun is directly overhead in the real atmosphere – but no pollution and no clouds is defined as air_mass_1.
Real world, at a Solar Elevation Angle (SEA) of 23.45 degrees on June 22 (day-of-year DOY = 173), the sun is struggling to get through an actual air mass of 2.5, with an atmosphere attenuation factor of 0.80 to 0.75.
Not your World’s Highest Sunlight at all, but actually only 305 watts/m^2 beam direct horizontal irradiation. And that with NO clouds, NO high-altitude ice crystals, and NO Chinese air pollution!
Clouds cover the Arctic sky some 70-80% of the time. Reduce that theoretically clear sunlight amount by another 40% – 50%.
And, by the way, your graphic is absolutely incorrect in its trivial sense too. It is the South Pole that gets more sunlight than other spot: There, the real world, clear sky direct beam horizontal irradiation is 325 watts/m^2 at sea level.
But, in the dry thin atmosphere at 2800 meters (9200 feet) at the South Pole itself, air attenuation is even less, irradiation even more!
Not entirely true. For diffuse radiation, yes – The average open-ocean albedo in moderate sea state and low winds is 0.066 (Not the 0.06 that you used, but close.) But diffuse radiation is only 10% to 15 of the global horizontal irradiation at sea level in clear skies. It is the measured clear sky open ocean albedo that increases dramatically at SEA angles less than 30 degrees: 0.066 at 35 degrees or higher, increasing to 0.30 to 0.35 at 5 – 10 degrees above the horizon.
With the albedo of sea ice at 0.43 in mid-July, and the albedo of sea water at 0.35, is there really any difference in albedo under clear skies in June and July above the Arctic Ocean?
Yes, you can factor in winds if you wish. Let me know what average wind speed you want to claim to analyze. You’ll find it makes little difference in net heat loss and heat gain.
Now, in truth, in cloudy skies, the albedo of open ocean remains at 0.066. But, under cloudy skies the available solar radiation at the open ocean surface is significantly reduced as well. Net? Little heat is absorbed when Arctic sea ice melts.
However, when arctic sea ice melts out, the heat LOST from the newly exposed open ocean increased substantially. More than enough to remove all of the solar energy gained in May-June-July.
Zazove,
“the sunniest place on earth”, in summer, has had colder than normal summers in the years with record low sea ice extent. All of the arctic warming has been in the winter when there’s no, or very low insolation. That seems to prove MarkW’s point.
Justanelectrician
“in summer, has had colder than normal summers in the years with record low sea ice extent.”
.What are you basing that on?
Zazove,
Sorry, I meant to include this link:
http://ocean.dmi.dk/arctic/meant80n.uk.php
Summer temps are surprisingly consistent, but recent years have June/July temps below the mean, while late 70s summers were slightly above. Not what I expected.
zazove, angle makes a huge difference when it comes to how much light is reflected from the oceans surface.
That the sun is up for 24 hours a day makes no difference if most of it is reflected.
There’s also the fact that since the sun is coming in at a low angle, a lot more light is absorbed or reflected by the atmosphere long before it reaches the surface.
Justanelectrician, I thought so. That data is limited to 80 deg north – where there has been no change in albedo. The southern fringes are where the melting has reduced the albedo and that is where the temperatures has risen more significantly. I am not saying that has been the main cause but has probably contributed.
Despite that you are still wrong as there has been no “colder than normal summers” north of 80 degrees.
I guess the W stands for Waving – as in arm-waving. I repeat go and wave them at someone else.
zazove
Not true. It is the average sea ice albedo for the entire Arctic sea ice area that is being measured. Dr Curry (in the SHEBA expedition of 1997-1998) established the regional albedo: 0.39 is the lowest, with a weighted sea ice average albedo of only 0.43 in late July.
As mentioned above, the prevailing winds always push the arctic sea ice back together almost as soon as each melt pond drains. It is the north coast of Canadian islands that remain nearly solid with sea ice all the way through the year, with the wider polyannas found off of Russia’s Siberian coast.
The DMI predict the daily average air temperature for 80 north = the middle of the Arctic ice cap in mid-summer, slightly north of the edge of the arctic sea ice edge in mid-September. Not for regions “north of 80 latitude” to the pole. But there is only 1.0 Mkm^2 of seq ice between 85 north and the pole.
Not actually true. For every year since 1950 that the DMI has recorded their “daily weather predication” for 80 north, the mid-summer temperatures have not changed. Not increased by even 1/2 of one degree, nor decreased by 1/2 of one degree. It is ONLY the winter daily temperatures that have risen 4-5 degrees.
zazove, the arctic ocean is inconsequential when it comes to albedo. there are is only around 2.5 months of the year when the amount of solar energy entering the arctic is net positive, even then the low angle of the sun sees a lot of that sunlight reflected back into the atmosphere.
Bitchilly
A little bit longer than that: March and early April have about 50% clear days, and the sun is above the horizon for increasingly longer periods each day, but very, very low on the horizon => High sea surface albedo as you point out. Atmospheric attentuation is high as well => So, there is direct radiation and diffuse radiation hitting the surfaces, but not very much. No surface melting at all, and so the snow-covered sea ice also has a high albedo.
But, from mid-April to mid-August, there is surface warming by direct and diffuse radiation up north. But the difference between what is absorbed in the open ocean and what is absorbed in the increasingly “dirty” sea ice (as its albedo lowers from a pristine (Feb-March-April 0.83 down to July’s 0.43) is not as much as we have been “trained” to believe.
It’s as if we have been “taught” that there are “24 hours of daylight at the North Pole” = “24 hours of clear sunlight as if it were noon in middle of June shining onto the reflecting pool of the National Mall.” The energy coming in is more like 7:00 am or 8:00 am on a summer’s morning. The sun’s up, but not very high in the sky: 25 degrees at the pole at maximum. As low as 5-10 degrees above the horizon at midnight over the sea ice further south.
Dr Curry reported that the heat LOSSES from the melt ponds were enough to refreeze the ponds each night as early as 12 August during her SHEBA expedition at 78 north latitude: The losses each night due to convection, evaporation, LW radiation were greater than the energy absorbed during 24 hours of sunlight.
By September, each day’s sunlight becomes less and less. The sun remains above the horizon only a few degrees at the pole, and is below the horizon 12 hours per day everywhere else. At the time of minimum sea ice in mid-September, there is actually less than 50 watts per day difference between what is absorbed in the ocean and in the sea ice.
Net effect? 4 months of actual ocean heating: mid-April to mid-August.
thanks for the correction racookpe1978. the beauty of wuwt is that incorrect statements or over generalisations are quickly corrected .
Zazove,
You said,
“For most of June and half of July the north pole [is] the sunniest place on earth,”
and you posted a chart that showed 90 degrees north having the highest summer insolation.
Then you complain that my charts (DMI) only go to 80N, and that’s not far enough south. It’s farther south than either of your qualifiers (“north pole” and “90n”). If you’re only talking about the “southern fringe”, why on earth did you back your claim up with a chart that only applies to 90N – that’s not the southern fringe of anything.
You also need to look at the DMI graphs again. Recent summer temps have definitely been below average. Skeptical Science has even done articles trying to explain it away.
justanelectrician
In all of the recent years, the DMI “weather forecast” for 80 north has been below its long-term average for most of the mid-summer days. Four or five days a year “above average”? Sometimes that many. Many years no days have been above average in the summer in recent years. More interestingly, the mid-summer standard deviation of temperature is near-zero. (Invisible on the DMUI plots, less 1/2 of one degree using the Russian drifting ice station temperatures.)
Winter and fall? Absolutely higher. +4 to +5 degrees above their plotted long-term average. Most likely due to the increased heat losses from the exposed arctic ocean waters losing heat to the air, and from there into the infinite blackness of space.
‘There was snowfall in Johannesburg in 2005, which was quite unusual.’
Even more telling is the summer snow in the Southern Hemisphere becoming more common and the reason for that is the meandering jet stream. In lockstep is the phenomenon of ‘blocking highs’, which has a tendency to produce cold air outbreaks (CAO).
‘The end of the ‘warming period’ may have been with the beginning of the new solar cycle in 2008 …’
The key maybe a lag of one decade, highlighted by David Evans over at Jonova.
I left out the news stories about snow on the beaches in Brazil, even though i could have included them. I think that was two years running. I’d have to look that up, but it was real, and there were news photos of it.
in the southern hemisphere, in South America, the snow line would slowly creep north from Patagonia into Argentina and then into Uruguay and Paraguay. Chile is a mecca for skiers right now. It would probably increase their business tremendously.
I know that there is a ski resort in Morocco in the mountains. Their business might increase a lot, as well. This is the second winter that they’ve had snow stick to the dunes in the Sahara in Morocco. This may mean that the monsoonal flow out of the Arabian Sea and Indian Ocean is changing, and going northwest instead of into Pakistan and northwestern India.
Those are the things that I look at.
Sara, you are correct the so called Climate Scientists are ignoring the earlier start to winter, the dozens of new Cold Records that have broken the old records by whole degrees, not the odd 0.01 of a degree.
They ignore the Great lakes freezing earlier and more.
They ignore the fact that the cold records are in both Hemispheres, they ignore Crops destroyed by Snow, Ice ,Frost and Heavy cold Rains all over the world.
They ignore the thousands of domestic animals killed by those same conditions, instead they point to massively massaged data and the odd “Hottest day” ever, which would not have been as hot with Mercury Thermometers.
When questioned on the Temperature shenaningans they talk about the the Satellite Tropospheric records without realising that they are PROVING the point, that heat has gone to space, the recent incursion of warm water and air in to the Arctic, gone to space.
With a slightly cooler sun it is going to take longer to recharge the Oceans that have been giving up their heat to space, which means the Land is going to cool even quicker.
They just don’t (or don’t want to see) the signs.
zazove
That chart is just for the month of April which is not the whole of spring.
Why don’t you show the Rutgers spring global snow lab chart, which covers the whole of the spring. Which shows am correct in what am saying.
zazove
That chart just covers the Month of April rather then the whole of spring. lf you look at the Rutgers spring global snow lab chart which covers the whole of the spring. You will see am correct.
It shows no such thing.
Oh, for Pete’s sake! zazove, look at the confounded label on that chart.
It says ‘April’ (1967-2017).
Are you really that much in denial that you refuse to acknowledge what is right in front of you?
Well why don’t you show it to prove it, l would do it myself if l knew how.
Because am looking at the Rutgers spring snow extent on a other screen, and it shows last year’s spring extent as been the highest since 2003 and well above the trend line. Also it shows that if this years spring snow extent is also well above the trend line. lt would be the first time its happened for at least 2 years in a row since the early 80’s.
It’s your dodgy claim taxed, you show me some evidence. I’ve been posting data and all I’m getting in return is arm-waving.
Yes it says ‘April’ (1967-2017), what is your point Sara?
zazove
You want evidence, well take a look at the WUWT post “Record 2018 snowfall continues increasing snowfall trends” posted on Feb 13th 2018.
Because in the comments below of that post is the very Rutgers chart am talking about which was posted by Bellman on Feb13th 2018 at 5:28 pm.
This?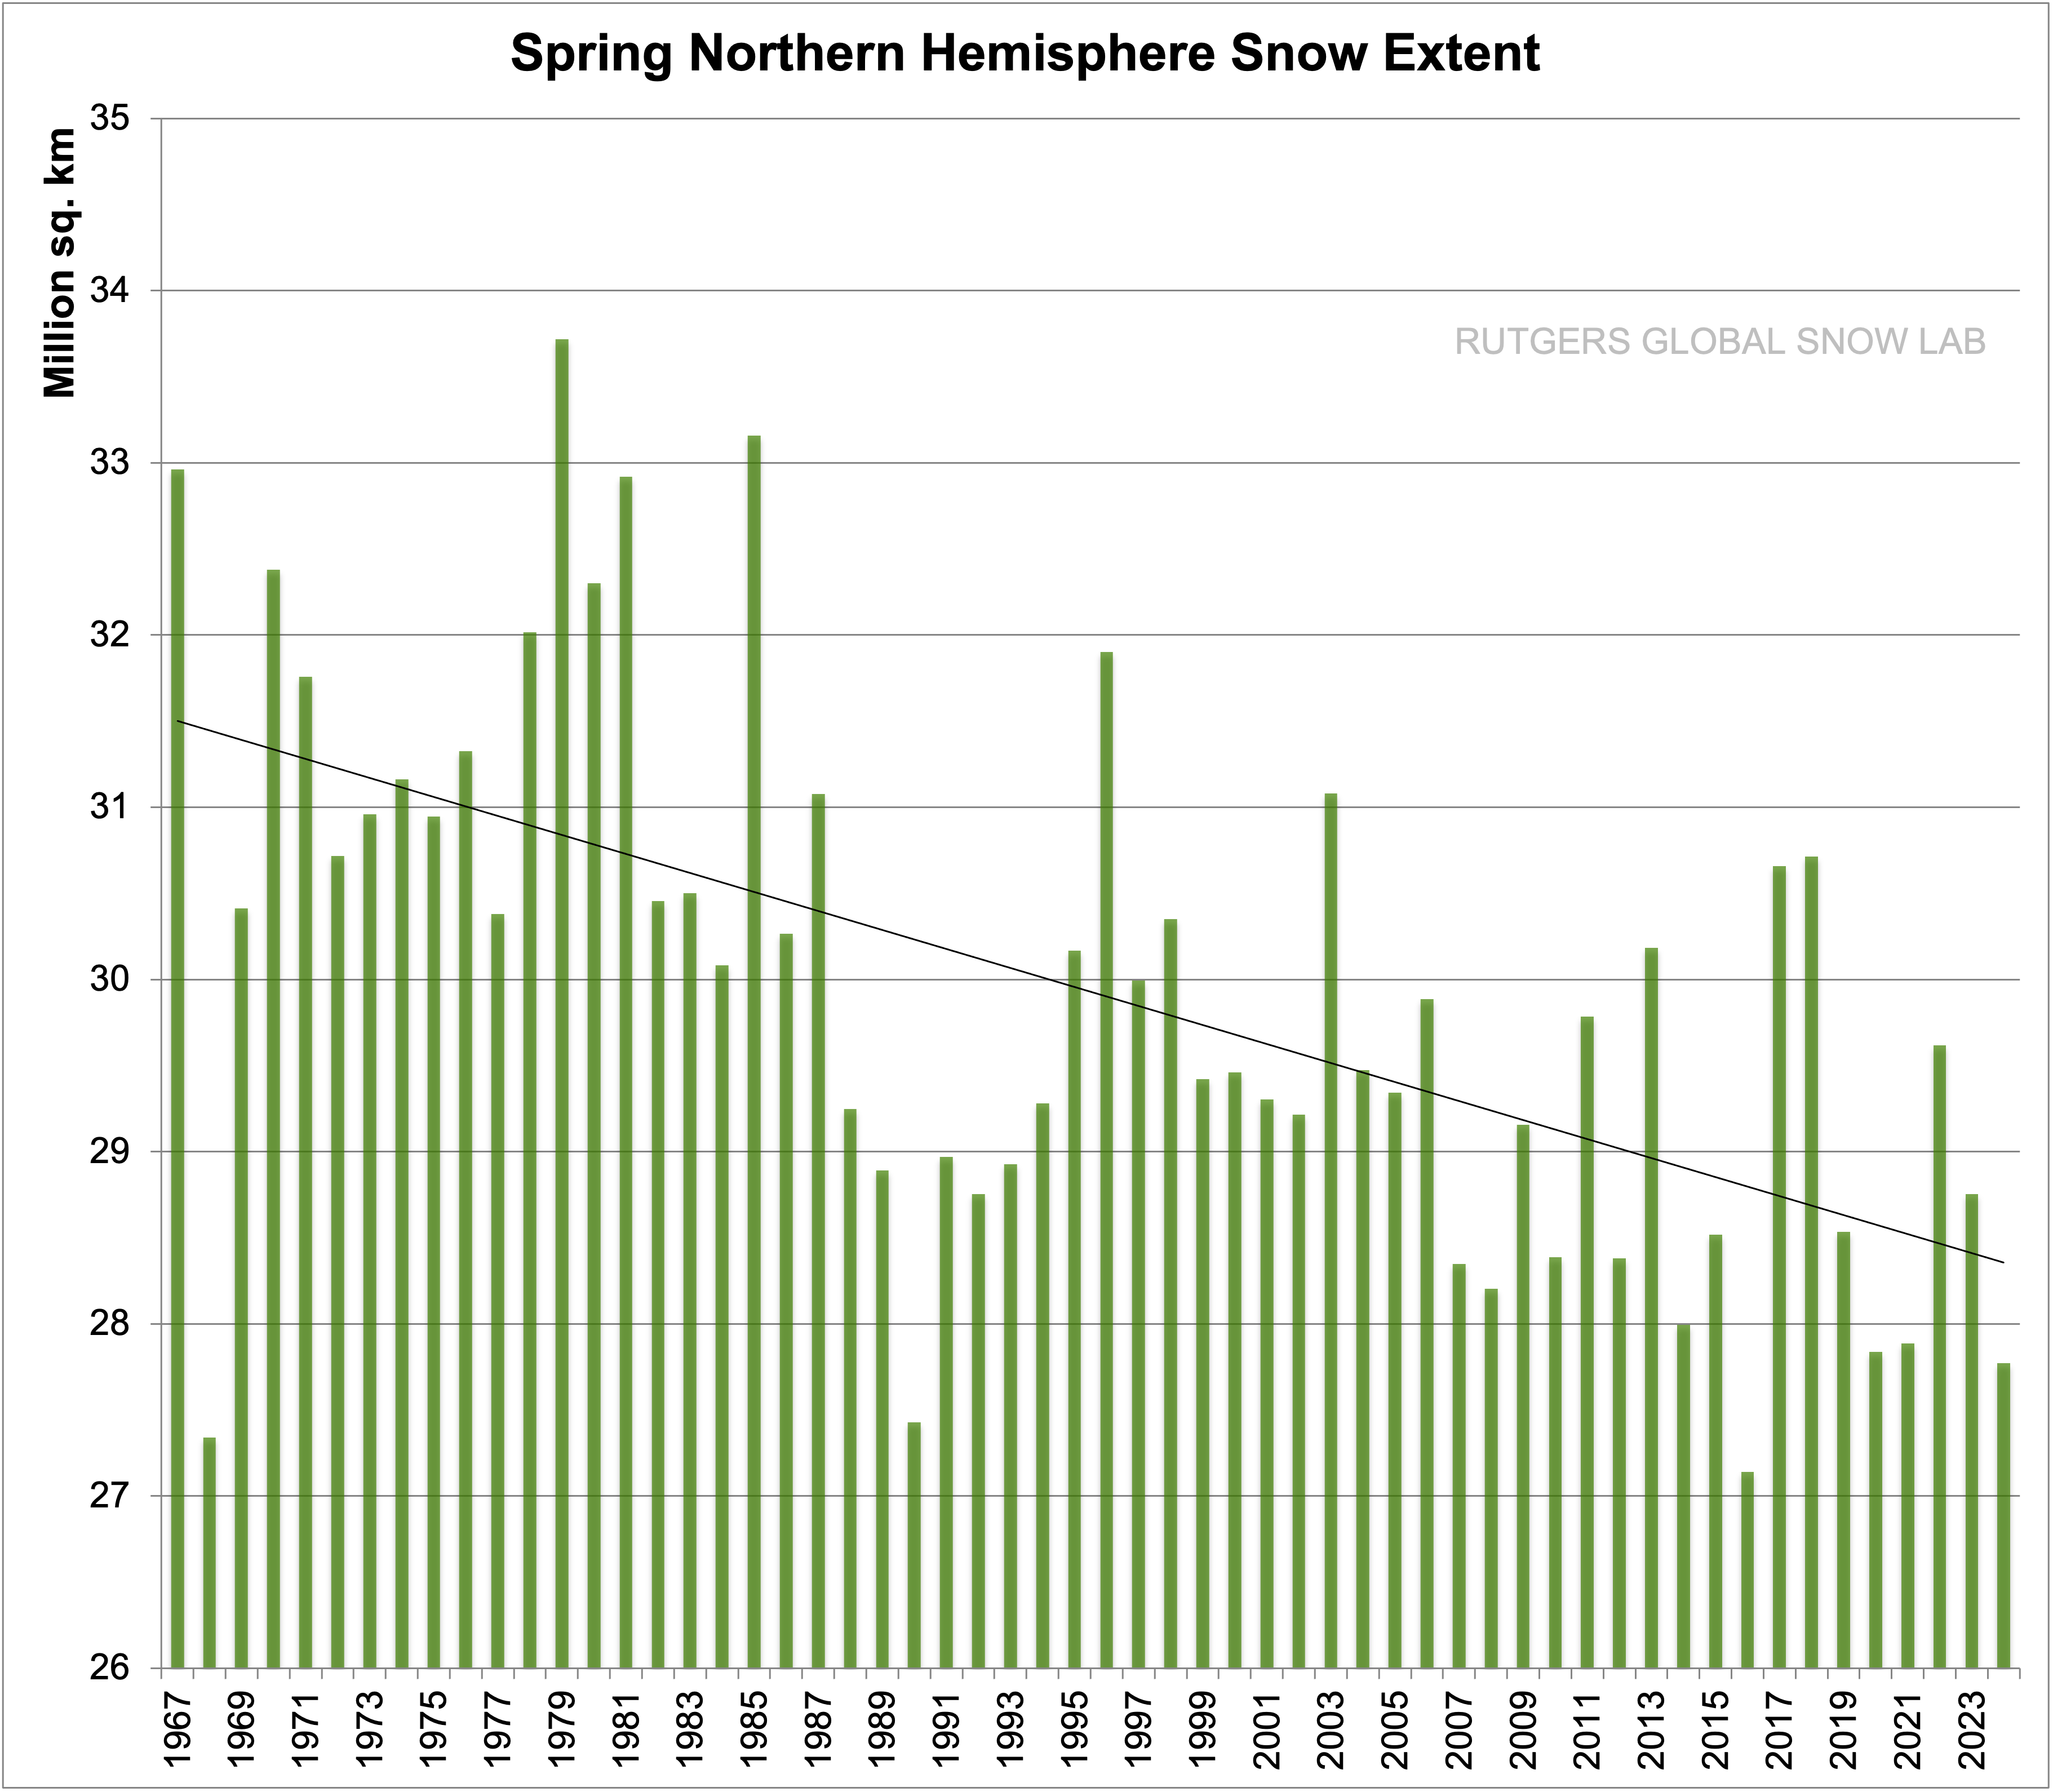
“You will see I am correct….this year’s NH spring snow extent will be the thing to watch for signs of climate cooling”
And I’m sure you will see them, despite the Jan 2018 graph above.
Yes as l stated, if this year’s spring snow extent is well above the trend line. Then it will be the first time its happened for two or more year’s in a row since the early 80’s. A change that could be important.
Hope springs eternal.
The point is that you are focusing on only 1/12th of the total data.
A tactic that is normally referred to as cherry picking.
Zazove,
your SPRING Northern Hemisphere Snow Extent is misleading since the data starts in the late 1960’s when there was Global COOLING ongoing with even colder 1970’s.
Meanwhile the Fall and Winter show an INCREASE in Snowfall extent, where the most snow accumulates.
Could we please see some units on those figures?
Like a centipede, CAGW has a lot of legs, but information like this takes a couple of them out of action each time it is revealed.
Those frozen sharks are iconic. If we climate realists have a spirit animal, it will be a dead frozen shark.
Nature may also be as cruel to the Armadillo population that has migrated north into Missouri, in upcoming winters.
Armadillos have burrows they spend time in when it’s cold. They don’t hibernate, however, so yes, extreme cold would not be friendly for them.
From observation, it would appear that their inability to cross the interstates is their biggest problem.
David Archibald:
I don’t understand the parameters you used in figures 2 and 4. “Cumulative aa index/open solar flux against long term average”
Perhaps I’m having a slow day but I can’t parse those definitions into a single parameter to plot on the vertical axis.
Cumulative numbers of a series that’s always above zero will always increase over time, not go up or down.
“Against” usually means against what you are plotting on the x-axis, except that you are plotting the year on the x-axis.
What am I missing?
I model a lot of coal mines and gold mines and oil fields. I find that keeping a track of cumulative production stops you from overestimating what will be produced. In this case, determine the average over a period. Then calculate the difference from that for each year. Then start adding, year after year. Plot up output.
Using the mean of values over a period ensures that the cumulative sum over that period will be zero. So whatever the aa index did, you would always be claiming temperatures should now be the same as they were in 1868. How does this make any sense?
Also David
“Correlation is not causation” – where have we heard that before?
It should be an integral part of your hypothesis that you postulate a mechanism whereby the sun’s magnetic flux can influence the earth’s climate. Or something else that they are both influenced by. Or that magnetic flux is a proxy for something else that can influence climate.
Sorry, not trying to be negative for the sake of it; your analysis is interesting, and is a good example of the things that climate scientists should be doing but aren’t because they already have the answer so why bother?
Yes, the mechanism of influence is also one of my problems with this singular causation approach. We need to focus more on interaction between all the variables, a seemingly infinite task.
No, not necessarily. As I say at the beginning of the article, some unknown warmer scientist made the comment dismissively. The Earth is such a lovely planet to live on because there is no single thing that controls climate and weather. The neutrons from the GCR flux play a role, so does the EUV high up in the atmosphere, albedo is big. But you don’t have worry about the detail and build a weighted, multi-component model to get it right. Just use solar magnetic flux and then get on with your lives. Very liberating.
GCR’s striking atoms create neutrons.
Kepler noticed regularities in the movement of the planets based on Tycho Brahe’s data. Neither Brahe nor Kepler suggested a mechanism. The explanation required Isaac Newton.
Neither Brahe nor Kepler suggested a mechanism
The generally accepted mechanism at the time was that angels were pushing the planets around in their orbits. So a mechanism was in place. That it was wrong is something it shares with many other mechanisms, then and now.
misplaced reply:
Actually Newton did not suggest a mechanism [https://en.wikipedia.org/wiki/Hypotheses_non_fingo]. That had to wait for Einstein.
Isvaalgard said
“Conclusion
Global Warming, or Climate Change, or Climate Disruption, just to mention some of the
(increasingly scary) monikers that are being deployed these days have become a divisive
political issue, seemingly divorced from scientific discourse. If it were not for the highjacking
of the subject by politicians, environmental pressure groups, and plain wishful
eco-thinking, one would conclude from the present overview that Climate Science is a
vigorous field with healthy debate and exciting interdisciplinary facets rather than a
moribund body of ‘Settled Science’ without prospects for further progress, perhaps like
Physics at the end of the 19th century. However, science is ultimately a self-correcting
process where the scientific community plays a crucial and collective role, so we will
eventually get it right, with or without political and societal interference, if the last two
millennia are any guide. In the meantime we “may hope to enjoy future ages with more
equable and better climates”, Svante Arrhenius [the originator of the GHG theory, 1896]”
Isvaalgard , you do us no favours by your wishy washy conclusion. Either the AGW crowd is correct or the skeptics are correct. Even the luke warmers have to conclude that we do nothing. The world is spending billions of $(actually the amount is over a Trillion $ by now)
based on a policy that is either based on good or bad science. So which is it?
Either the AGW crowd is correct or the skeptics are correc
No, they could both be wrong…
Yep. Enter the rascally confounding factor.
Isvaalgard , you do us no favours by your wishy washy conclusion. Either the AGW crowd is correct or the skeptics are correct. Even the luke warmers have to conclude that we do nothing. The world is spending billions of $(actually the amount is over a Trillion $ by now)
based on a policy that is either based on good or bad science. So which is it?
So which is it?
I guess the honest answer is that we don’t know. There is no doubt that CO2 has some effect, but we don’t know how large it is. Assuming that it is 100% is just as silly as assuming that it is 0%.
We can be reasonably sure that solar ativity is not the main (100%) driver simply because the long-term variation of solar activity does not correlate with the climate. People might agree that ‘correlation is not causation’, but is seems that some [many?] people here are pushing a different mantra: “no correlation is causation”.
Perhaps you mean “a loose correlation implies causation” with both CO2 and Sol?
No, “no correlation”. as there isn’t any.
‘There is no doubt that CO2 has some effect, but we don’t know how large it is.’
The sensitivity issue, a lukewarm paradise.
I have this sneaking suspicion that global cooling began in July 2017 and nobody noticed, except me of course.
Haven’t you considered the possibility, Lief, that CO2 might be delaying the return of a glacial maximum somewhat, if it is a factor?
Yes we have. However the next glaciation would be in 50,000 years time. Even If that is delayed or cancelled it would not be too important for the next several thousand years so would be of little concern.
‘Even If that is delayed or cancelled it would not be too important ….’
The anomalous length of the Holocene makes it hard to judge the timing for an end date, its purely an academic exercise, but a Bond Event could be a tipping point.
Leif – I appreciate your ‘viewpoint’ pdf very much and will recommend it to friends. However, there is something going on I don’t understand. You say there is no change in TSI over the past 300 years. That would. You mention the temperature on the Tibetan Plateau correlating to the AMO…it also correlates to global temperature (as the AMO influences global temperatures), and recent spectral analysis of tree ring data (Liu et al. 2011), picks up this 100 year cycle, as well as a 200 year and an 1100 year. TSI changes may be small, but are sustained over a 100 year period and could be stored in the oceans. TSI changes can also influence cloud cover and ocean currents via jetstream effects, and it would appear this dynamic is sensitive to changes in far-UV, which are much greater in percentage change than the visible spectrum – as much as 8%. The most recent models are incorporating top-down UV effects (Meehl et al, 2013) as part of the longer term drivers of Maunder Minimum type cycles.
If we look at the last 100 years, the UV peaks would have come in the 11-yr cycles peaking in or around 1990 and 2003, on top of the cumulative rise since 1900. This source of heat then has to have a phase relation to the AMO. There is plenty of room for a time lag where the global T peaks around 1998/2016 aided by ENSO cycles….so I don’t read much into your ‘mismatch’ between TSI and global temperatures. The oceans have stored 100 years of global temperature rise and as they go into a release phase, surface temperatures will rise as the heat moves out….this is especially the case for the Arctic region.
You mention the Antarctic Oscillation. Jackson Davis and I have just published an analysis where we argue that these oscillations are the long-term equivalents of an average 350 year oscillation whose period correlates to orbital parameters that affect 65N (and hence also 65S), and review evidence that this oscillation may be a primary driver of cycles in the Northern Hemisphere. I will send you a link (we intend also to post the link on WUWT very soon and will appreciate all comments and criticisms).
I don’t know how old you are – I am three score and ten, and expect to know whether this analysis is sound within the next twenty years…gods and goddesses willing!
Leif…’solar activity does not correlate with climate’….yet you state in your excellent PDF on the whole global warming science debate that there are thousands of science papers that purport to find such a correlation but without reviewing them. I would be interested in your take on the correlations claimed by tree-ring, speleotherm, lake and ocean sediment, peat pollen, among other studies, that show cycles of a period that matches Schwabe, Gleissberg, deVries….and the longer Bond cycles…..and of course, there may be internal oscillation dynamics at work….but there is a large body of scientific evidence pointing to solar factors….is it all wishful thinking?
.but there is a large body of scientific evidence pointing to solar factors
Claiming such, but none is compelling. And many [most?] are based on faulty solar records.
The most glaring is that solar activity has declined the last 50 years while temperatures have soared.
I and coworkers were credited with reviving the case [some 40 years ago], but all the correlations didn’t hold up over time.
Check out the optimism back then:
http://www.leif.org/EOS/Sun-Weather-Climate.pdf
@lsvalgaard,
You say “honest answer” like there might be another.
lots of those. Look around!
Have you read his link from above?
I don’t expect the good professor to take an activist position on either side. I think he does an adequate job of maintaining scientific detachment, myself. His frank style of discussion is often to his detriment as an ambassador of science.
I consider him a valuable mentor.
pop, i like the frank style of discussion used by leif and willis. it is hard enough trying to figure stuff out without having to decipher waffle. direct and to the point works for me :).
I think that if you are going to discuss the solar magnetic flux effect during extreme minima, it might be appropriate to include the tectonic effects (as in the New Madrid quake of 1811-1812) and the volcanic activity historically linked to the Dalton minimum.
The New Madrid Fault is connected to many of the gsm’s from what I can see. Excerpt from Wiki “…previous large earthquakes like those of 1811–1812 appear to have happened around AD 1450 and around AD 900,[4] as well as approximately AD 300. …”. The years 1450 and 900 are both gsm’s, and the year 300 is also a gsm as can be seen by viewing the JG/u 2K study. Then the last larhe NMFZ quake occurred in 1895 during the cooling caused by the Gleissberg cycle, imo.
The Maunder Minimum and the first recorded NMFZ quake, “…The first known written record of an earthquake felt in the NMSZ was from a French missionary traveling up the Mississippi with a party of explorers. At 1 p.m., on Christmas Day 1699, …”. So it is clear to see that gsm/Gleissberg cycles can lead to large quakes on the NMFZ.
Conclusion, if we are truly on the edge of a gsm/Gleissberg cycle, then a large quake should be expected to strike in the middle of the US in the next 30 years, imo.
What I love about this site is that yesterday the world was warming according to Wills and no one knew why. And today apparently the world has been cooling since 2008 and it is all the fault of the sun. But none of this seems to worry anyone as long as CO2 is not to blame and they can all carry on driving their gas guzzlers and not worry about the impact.
Sums it up. And then: “well alright, but so what?
How can scientist compete with the merchants of doubt?
Still too small of a perspective to see that CO2 doesn’t empirically drive weather (and in the long term, climate)? No soup for you!
I find it fascinating how trolls find it so fascinating that people here are allowed to have different opinions.
I guess it’s different where they are from.
Mark,
different opinions are fine but it is the uncritical acceptance of two contradictory theories that is so
interesting. Either David is right and the world has been cooling since 2008 or Wills is right and the world
has been heating up since 2000. At least one of them has to be wrong – but nobody seems to care (with a few exceptions).
That’s not nearly as interesting as a trillion dollar industry based on the notion that a few thousand thermometers can determine that 197,000,000 square miles has warmed by a few hundredths of a degree, making each year the “warmest ever”, and if anyone questions that, or suggests that it may be beneficial, their career is destroyed.
Who said anything about uncritically accepting both theories?
They were both posted here, they were both argued over. Some people in favor, some in disagreement.
That’s the way real science works.
As long as the gas guzzlers dont pollute then what is the problem? My car has 2 catalytic converters and puts out very little pollution.I will buy an electric car as soon as the range improves enuf for cold weather driving. Electric cars really deteriorate in range in the cold weather which is something the salespeople dont tell you
Geronimo, there isn’t anything unusual in the ice core records that says we are dangerously warm and that CO2 is to blame via humans. Some people try to splice directly measured CO2 to the ice cores and run screaming into the night. A statistically unsupported method (IE two entirely different methods of measurement and data smoothing). Bottom line, we are in a naturally warm period and will likely experience continued warmth with little ups and downs for the next few 10s of thousands of years. Sit back and enjoy it!
Me thinks many of the attacks here are from the usual “Uncle Ernie’s” where they’ve been fiddling about with the data…..
It seems it’s what they do best.
I think that the current Warm Period has another several centuries to run its course. I do think that we are in a cool trend now, but that is a 30+ year trend, which ends in the mid to late 2030s, from my perspective. Then there is this very interesting correlation between the Southern Magnetic Anomaly, and major quakes on the Cascadia Fault Zone.
A new study places sudden magnetic field directional shifts at 400/450, 750/800, and 1250/1500 AD. Cascadia major quakes for the same timeline are 400, 810, and 1310 AD. Is this what causes the Cascadia quakes, sudden directional shifts in the magnetic field? Lastly, the spacing between events is the same spacing as exists between Warm Periods, and Cool Periods/Dark Ages. That is one big stack of coincidences.
The last Cascadia quake was in 1700. That is the date which I would regard as the end of the 400 yr cool period. That means that there should be approximately 500+ years of a warm period. That is why I place the end of this current warm period at 2200 AD +/- 50. The fact that we are still in a warm period would mitigate the cooling power of a solar cycle induced cooling, imo.
An interesting note to this is that in reading further regarding magnetic field sudden directional shifts the data states that there was also a shift which started around 1650. So here is another correlating fact in this picture. The magnetic fields starts to shift. Shortly after, in terms of multiple decades, the Cascadia Fault unleashes a 9 +/- magnitude quake. Thirdly the climate is now shifted either to a warm or cool trend.
The warm trends look to be 500+ years in length vs around 400 for cool trends, but is this due to the time it takes for the warm trend to give way fully to the cool trend? What effects does the 9+ quake in the eastern Pacific have, which comes after the change in the magnetic field?
“The end of the Modern Warm Period remains December 2008 which is the month of the Solar Cycle 24/25 minimum. ”
David,
You need a correction:
December 2008 was SC23/24 minimum. Not 24/25, which is in about 2 years from now.
Hard to get past the rest of what you wrote after that.
Joel, I don’t know if you have read Schopenhauer on Buddhist philosophy, but what you found was the deliberate mistake in the piece. Because sometimes things that are too perfect are an affront to God. We show our humility by including them.
Please leave the religious gobble-d-gook out of a science post. That is, if it is a science post.
Furthermore, I take it peer review is not one your strong points. Try that line on a peer review critical comment on a manuscript and see how far that goes with the editors.
You don’t need to do it every paragraph.
I find the use of one year’s data to show net ice accumulation in Greenland annoying. How does it compare with other years? As it is presented it’s natural variability.
SARA:
“If it’s too wet for hard red winter wheat to ripen and dry properly, it won’t be harvested until weather conditions have allowed it to dry properly. If that goes into August, it delays planting the next crop.”
Would like to correct you here. If it is too wet, the crop rot in the field or be too poor in quality or yield and will not be harvested. Harvest in Kansas typically starts in late May or early June and is done by mid July. Planting winter wheat is done in October or early November. The range of winter wheat is from Texas to the Dakotas. Further north into Canada, they plant “spring wheat” ie. plant in spring and harvest in fall. Winter wheat will also winter kill if the it is too cold without snow cover to protect it. The region (in the USA) where it is typically planted is large enough that weather variations would not destroy the whole crop, though Kansas has had the bulk of the crop.
Not sure where you are located, so your local experience may vary.
If tsi changes are not relevant to climate then diurnal cloud changes might explain heat storage over time, particulary in the oceans. More clouds in daytime, less clouds at night should=heat dissipation and vice versa. One small sample study, over Hawian Islands shows just that. Anyone aware of a compendium of data on diurnal cloud cover on a larger area longer term basis? Long term diurnal variation could give a partial answer though the ocean’s storage and later dispersal mechanism would additionally explain more.
“Nighttime cloud cover frequency was lower than afternoon cloud cover throughout the year and lower than morning cloud cover frequency for most of the year.”
AMS
An Assessment of Diurnal and Seasonal Cloud Cover Changes over the Hawaiian Islands Using Terra and Aqua MODIS
Mallory L. Barnes+ and Tomoaki Miura
Department of Natural Resource and Environmental Management, University of Hawai‘i at Mānoa, Honolulu, Hawaii
Thomas W. Giambelluca
Department of Geography, University of Hawai‘i at Mānoa, Honolulu, Hawaii
* Supplemental information related to this paper is available at the Journals Online website: http://dx.doi.org/10.1175/JCLI-D-15-0088.s1.
+ Current affiliation: School of Natural Resources and the Environment, The University of Arizona, Tucson, Arizona.
Corresponding author address: Mallory L. Barnes, School of Natural Resources and the Environment, The University of Arizona, 1064 East Lowell Street, Tucson, AZ 85721. E-mail: mallorybarnes@email.arizona.edu
Journal of Climate
Vol. 29: , Issue. 1, : Pages. 77-90
(Issue publication date: January 2016)
Received Date: February 2, 2015
Final Form: October 1, 2015
https://doi.org/10.1175/JCLI-D-15-0088.1
Since the beginning of your post uses the term Aa Index without defining what that might be I looked it up on Google and got Amino Acid Index. Huh? Excuse m for being ignorant.
The aa-index is a simple global geomagnetic activity index. It is derived from the K indices from two approximately antipodal observatories and has units of 1 nT. Current observatories used are Hartland in the UK, operated by BGS and Canberra in Australia, operated by Geoscience Australia.
Since it is based on data from only two observatories, it is the simplest of all the 3 hourly planetary indices. However, provided averages over 12 hours or longer are used, the index strongly correlates with the ap and am indices, which are derived using data from more extensive observatory networks.
The main advantages of using aa indices are that the time series spans further back (to 1868) than any of the other planetary index time series; and also up-to-date values are produced and made available on a weekly basis.
http://www.geomag.bgs.ac.uk/data_service/data/magnetic_indices/aaindex.html
These plots present time series (updated daily) of the current amount of water stored by the seasonal snowpack (cubic km) over (a) Northern Hemisphere land areas (excluding Greenland), (b) North America, and (c) Eurasia. Snow depth from the CMC analysis is converted to snow water equivalent using a density climatology obtained from snow survey data. The time series average and range between ±1 standard deviation (calculated for 1998/99 to 2011/12) shows how current conditions compare to historical variability.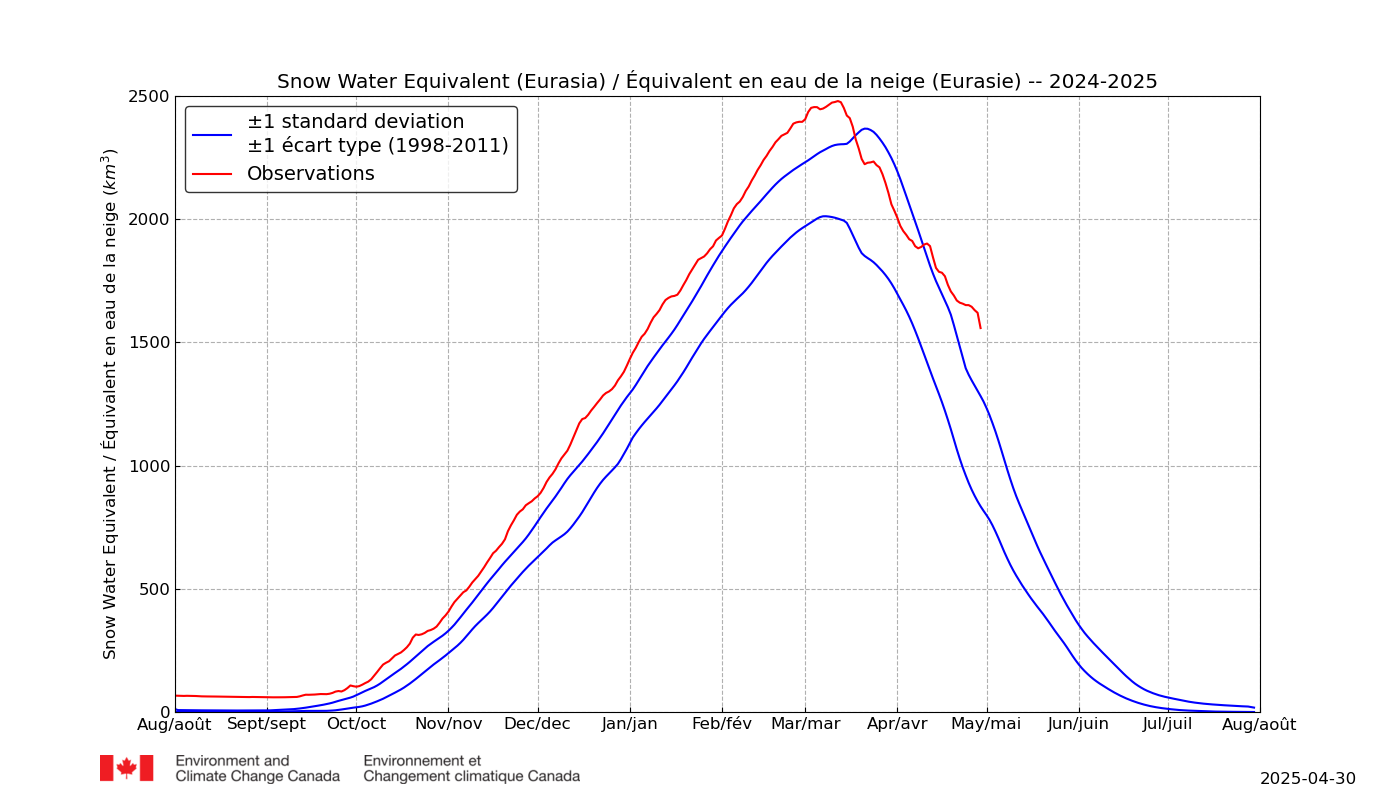
Sorry.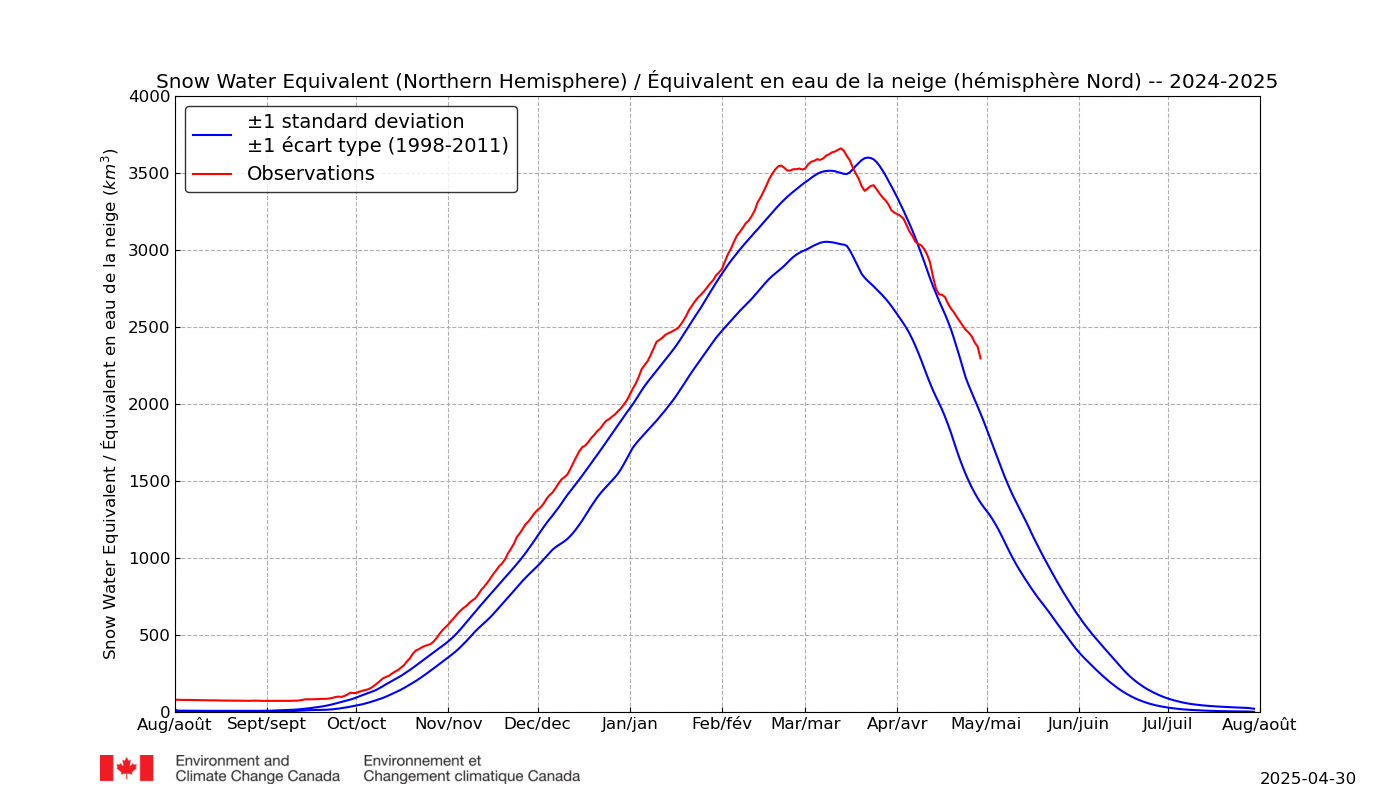
These plot present time series (updated daily) of the current amount of water stored by the seasonal snowpack (cubic km) over North America.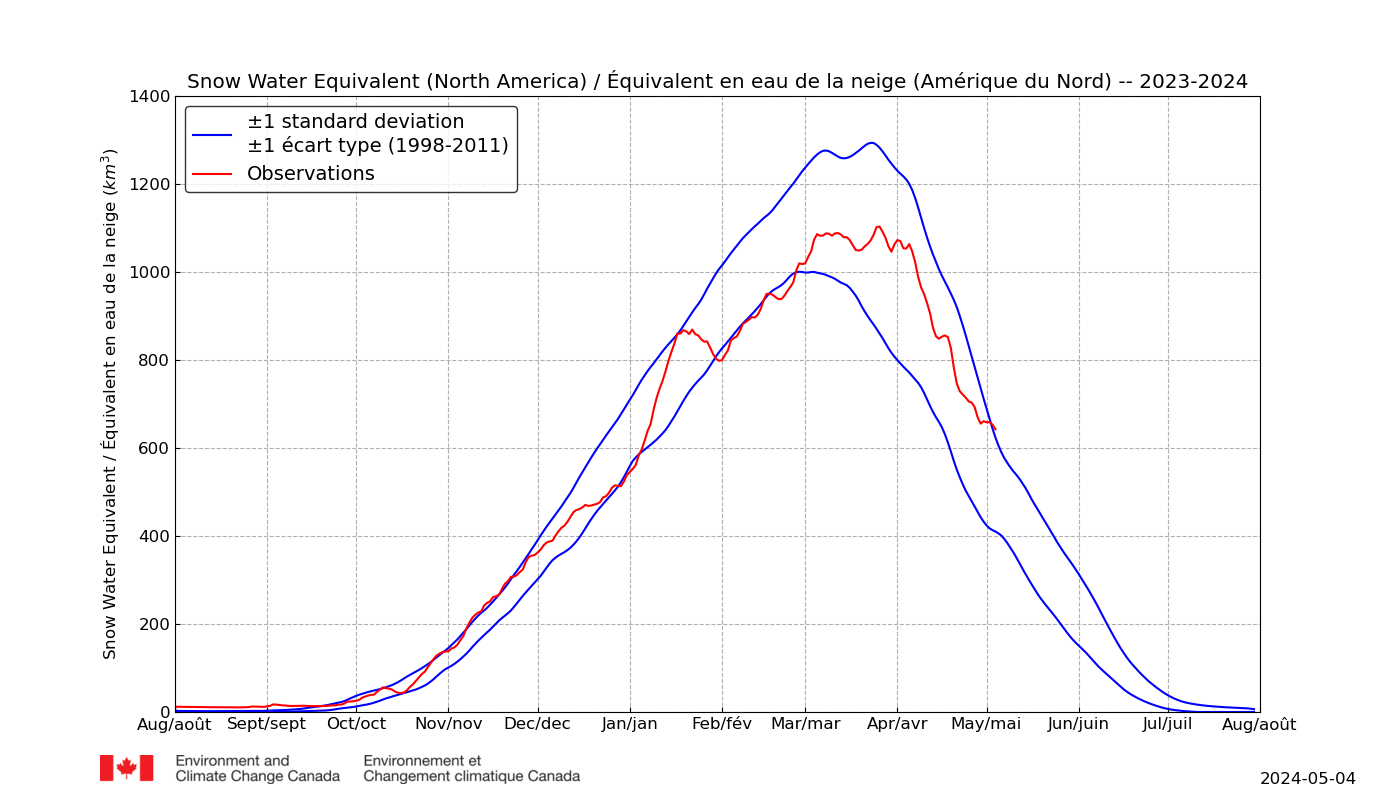
looks like they may have to make the snow water equivalent charts bigger to accommodate all the warming ren 😉
Ren, What is the web address for these charts please? I sought but did not find.
This is the address of the page: https://www.ccin.ca/ccw/snow/current
Snowstorm in Kentucky and West Virginia.
http://files.tinypic.pl/i/00960/kkjti4rkvwfl.png
The extent of sea ice in the Arctic has increased.
Still frost and snow over the Great Lakes. This is shown by the height of the tropopause (lowest temperature between the troposphere and the stratosphere).
http://pics.tinypic.pl/i/00960/4hi4pr6as3ri.png
Actually Newton did not suggest a mechanism [https://en.wikipedia.org/wiki/Hypotheses_non_fingo]. That had to wait for Einstein.
NOTE: After review of comments, data sources, and the article itself, I have concluded that because some old and faulty data was used in the article, the premise and conclusions are not accurate, and therefore this article should be ignored due to the use of the faulty data. If at such time the article is revised by the author (Archibald) to include updated data, this article will be deleted, and a new one put in its place.
– Anthony Watts, publisher, WUWT
The right choice.