Via James Delingpole at Breitbart:
The National Oceanic and Atmospheric Administration (NOAA) has yet again been caught exaggerating ‘global warming’ by fiddling with the raw temperature data.
This time, that data concerns the recent record-breaking cold across the northeastern U.S. which NOAA is trying to erase from history.
If you believe NOAA’s charts, there was nothing particularly unusual about this winter’s cold weather which caused sharks to freeze in the ocean and iguanas to drop out of trees.
Here is NOAA’s January 2018 chart for Northeast U.S. – an area which includes New England along with NY, PA, NJ, DE and MD.
You’d never guess from it that those regions had just experienced record-breaking cold, would you?

That’s because, as Paul Homewood has discovered, NOAA has been cooking the books. Yet again – presumably for reasons more to do with ideology than meteorology – NOAA has adjusted past temperatures to look colder than they were and recent temperatures to look warmer than they were.
We’re not talking fractions of a degree, here. The adjustments amount to a whopping 3.1 degrees F. This takes us well beyond the regions of error margins or innocent mistakes and deep into the realm of fiction and political propaganda.
Homewood first smelt a rat when he examined the New York data sets.
He was particularly puzzled at NOAA’s treatment of the especially cold winter that ravaged New York in 2013/14, which he describes here
Full story here.
It will be interesting to see what ridiculous defense Nick Stokes comes up with for this one.
Just a note here, Anthony: in the opening shot of that BBC video, that’s Chicago’s skyine. The Hancock Center is on the left and the JPMorgan Chase Bank building is the tall building on the right with two pointy things on top. Lake Michigan WAS steaming like that because the water temperature was warmer than the air temps. I spent 30 years working in downtown Chicago.
And yeah, it was beastly cold that winter. It was so cold, the inside of your nose froze quickly if you weren’t wearing a scarf over it.
After I and a few others exposed his nonsense last September, I have decided not to read his stuff anymore since he is here to argue over negligible things.
I think the standard has been to claim that the adjustments make the trend smaller, not bigger, and have no real effect in any case?
I believe homogenisation gives a reason not to care as the algorithm creates stuff that you can’t check by hand. So yeah, sounds incredible but it must be right as it came from the computer. OTOH, I haven’t run the algorithm, Mosher has. So what I’m to say to them?
This is why the raw data and details of its source (location, elevation, instrument details) must NEVER be thrown out. Homogenizing is an irreversible process, there is no such thing as dehomogenizing.
homogenization should NEVER replace actual data … maybe for missing data in a grid … should never change actual measurements … ever …
“This is why the raw data and details of its source (location, elevation, instrument details) must NEVER be thrown out.”
They are never thrown out. NOAA publishes the raw data, along with homogenised.
“…They are never thrown out…”
Nobody said they were, Mr. Semantics. Someone was emphasizing why they should never be thrown-out.
Always in a rush to post something and try to start an argument, no matter how pointless and contrived.
Nick says:
**They are never thrown out. NOAA publishes the raw data, along with homogenised.**
Except Jones and Mann who delete it. OK, they did not THROW it out according to Nick.
“Except Jones and Mann who delete it”
Jones and Mann have never been custodians of raw data.
“custodians” indeed. Raw data is detained in high security prison, while some fake impersonate instead
What do you expect from “Scientists” today? Most reading this would be surprised on what the Liberal universities consider ethical and are teaching today. Courses taught in most colleges today on “Ethics” endorse the Liberal doctrine “The end justifies the means” mantra. Back in 2012 I got into a rather nasty discussion on a university supported blog with the PHD dean of the ethics program and professor, at a prestigious university I graduated from, concerning the theft of data from the Heartland Institute. He fully supported that this theft was ethical as it helped achieve the needed awareness of Global Climate Change, and the measures taken by Big Oil to line the pockets of the deniers. Search the course catalogue for your alma mater or nearby university. Look at the syllabus for the ethics courses. Even the course name is sort of disturbing. Some even have texts, notes or professors dissertations.
I can’t believe you actually beat him to the first comment on your own website Anthony, that’s unusual for Nick Stokes!
Nick Stokes- really? The historical record is all a bunch of garbage. How many versions of each data set do we have? And it can be demonstrated in each one the temps before 1950 have been adjusted down and after up. Lies, more lies and damn lies.
Someone needs to go after NOAA for altering Federal Data, which is a crime. And not just NOAA, but those individuals behind it.
“…There is a general tendency for the adjustments to have a warming trend…”
You spelled “overwhelming” incorrectly.
Well, for a start, NOAA wasn’t “caught” “erasing” anything. There is no evidence given that the recent snap wasn’t reported accurately. The fact that the NOAA publishes adjusted (as well as unadjusted) past temperatures for US sites has been discussed here endlessly, and this post has nothing new there. All he’s saying is that if you ignore the need for adjustment, the past records could be seen as warmer, and so the present colder relative to them.
When temperatures are adjusted, it means they change. So you can always go through finding places where they have “cooled the past” (or warmed it). And Paul Homewood has made a speciality of this, rather laboriously. So much so that in 2014 I did a study of each US state individually. There is a general tendency for the adjustments to have a warming trend; this is substantially due to TOBS, as explained here. But there are other factors that can lead to an artificial cooling trend that gets adjusted. Here is my 2014 plot of the effect of adjustments on NY state:
BS … you really want to claim that 2014 raw data needs to be adjusted ? pure unadulterated BS …
Generally current data is not adjusted. However, this is not worked out on a month-by-month basis, so there can be minor discrepancy, as here (about 0.1°F).
Nick says:
**Generally current data is not adjusted. However, this is not worked out on a month-by-month basis, so there can be minor discrepancy, as here (about 0.1°F).**
Biggest bunch of Bull ejection Nick has ever stated.
Just check the FACTS here:
https://realclimatescience.com/100-of-us-warming-is-due-to-noaa-data-tampering/
It is adjusted to match the CO2 increase among other changes.
I do not know why Nick even posts his nonsense.
So, NOAA is not hiding data. Then please point me to a webpage that provides the Monthly Heating Degree Days back to 1920, or 1930, or 1940, or 1950, or 1960, ….. through 2017. The daly was posted in many news papers in the conventily located weather column, and them monthly was posted for the past month on the first of the month. I used it for a science project back in 1955. I know it was done. I spent hours looking at old microfilm in the public library.
in 1997 or 98 I found the data for most of the cities that were large enough to have had airports back 20 the 40’s on line in easily searchable pages in a text format. A few years ago I had a brainstorm that using the yearly total of HDD would be a simple way to see if those cities were getting warmer or colder. A High School kid could transfer the data to a spread sheet and generate a plot in less than an hour for each city with data. After weeks of looking I gave up as I could not find any. I have asked on here several times over the years, no response. Where are they?
I have found some state weather services run sources but most only go back about 50 years and rarely 75. Strange though most of these sites also show a jagged line that has a flat average with their data when plotted. WHY?
“Then please point me to a webpage that provides the Monthly Heating Degree Days”
There probably isn’t much demand for that. But NOAA posts an extensive set of daily records, max and min, unadjusted. GHCN Daily. You can work it out.
Isn’t anyone else absolutely SHOCKED by Mr Stokes’ open admission that the New York Temperatures have been adjusted a total 1.0 Degrees C.
The official amount was declared as about 0.5C.
He has confirmed that when he did this study in 2014 he already new that NOAA was changing the temperatures much more than they said and yet he has been defending them all these years.
We also know that the adjustments have been ramped up even more since 2014.
“Isn’t anyone else absolutely SHOCKED by Mr Stokes’ open admission that the New York Temperatures have been adjusted a total 1.0 Degrees C.”
No, 1°F.
“The official amount was declared as about 0.5C.”
Yet again comparing things that don’t correspond. That is the national figure, which is about 0.9°F. And here is my national plot:
“yet he has been defending them all these years.”
The adjustments were as described. I have looked into them, and there are good reasons.
“We also know that the adjustments have been ramped up even more since 2014.”
You don’t.
“There is no evidence given that the recent snap wasn’t reported accurately. ”
Quite the opposite. There is a ton of evidence that the cold snap (and others before it) were not reported recently, I mentioned the ice proxies, but there’s a ton of other evidence, such as the reported data from other sources.
What is missing is any evidence that the recent snap was reported accurately. The response from you and NOAA has been “we trust our adjustment algorithms, they have good reasons” despite the empirical evidence that they are wrong.
After reading both articles on TOBS I don’t see how that justifies any adjustments. The author didn’t convince me. In some circumstances it might become warmer or colder after the time of observation. Okay, so what? So long as the time of observation is consistent a six’s thermometer will faithfully and accurately record the highest and lowest temperatures for the previous 24 hours. What ever happens during the next 24 hours, it will again faithfully record the high and low temperatures.
The author asks what happens when you reset a six’s thermometer when the temperature is falling? Because what you just set it to will be the max you see the next day if it doesn’t warm back up before the next observation. Again, why is that wrong? If it is 45° F at 10:00 AM and the temperature falls below freezing from there and stays that way until 10:00 AM the next day, guess what the high temperature was for that 24 hour period? You guessed it, 45° F. That is the correct answer.
Sounds like someone desperately trying to justify something to me. That was just too easy to poke a big fat hole in.
Well done Mr Stokes.
You have shown how poor the “adjustment process” actually is, because your t charts do noy match at all.
notice that the Low point for NY is 1921 and the Low point for the whole of the USA is around 1947.
Also that the amount of “adjustment” does not match ie 1.4F for NY and only 0.9F for the US.
Stokes,
Your statement “… and there are good reasons (for the adjustments)” is meant to convince?
Good is subjective, and the perspective of the observer matters.
There are good reasons NOT to adjust measured data that is used for a model.
Perspective
“The author didn’t convince me.”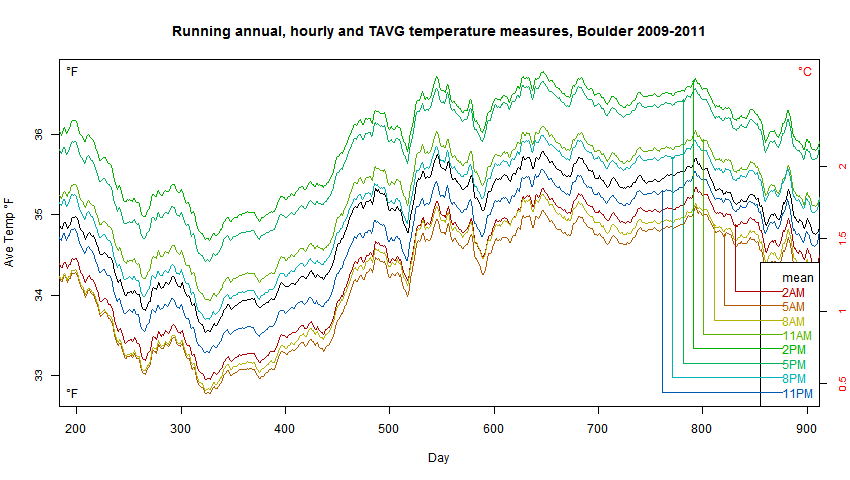
There is more detail here. It uses three years of hourly temperature data from Boulder. Colorado. It shows the running annual mean of daily measures (to get rid of seasonal variation). The black curve shows what you would get if you just averaged the 24 hours of each day. The colors show what you would get if you emulated a max/min thermometer – ie the measure of each day was the average of the max and min over a 24 hour period. The legend bottom right shows the time that period ends.
You can see that the max/min follows the black curve quite well but with an offset. For climate, consistent offset doesn’t matter much; it is as if you have chosen a site in a different place – say at different altitude or some such. The problem comes when you change time of obs. That makes a one time shift which can be a sustained jump of up to 2°F. If real, that would be of climate significance. But it isn’t, so you have to adjust to remove it. Why TOBS is so important in the US is that those jumps were mainly in one direction. The original advice to volunteers was to read the temperature in the evening, but many had to read rain gauges in the morning. So they shifted to reading the thermometer in the morning too.
“You have shown how poor the “adjustment process” actually is, because your t charts do noy match at all.”
Different places. There is no reason why they should match, as they are correcting for events. The interest is more in why they have so much in common. The answer is TOBS.
“What is missing is any evidence that the recent snap was reported accurately. The response from you and NOAA has been “we trust our adjustment algorithms, they have good reasons””
The reporting of temperatures day-to-day is done with no algorithm at all. Computing adjustments takes time, and in any case is done to shift past values to compensate for non-climate events. Even for monthly averages, it should have very little effect on recent data.
“The reporting of temperatures day-to-day is done with no algorithm at all. Computing adjustments takes time, and in any case is done to shift past values to compensate for non-climate events. Even for monthly averages, it should have very little effect on recent data.”
Completely missing the point, Nick — when the adjustments are done and to what does not explain how we get records and near-records in the ice proxies and other data with temperatures that NOAA claims are close to normal. Face it, the adjustments are empirically false, and it should have been obvious to you guys years ago.
If you want to address NOAA’s growing credibility gap, start by acknowledging the huge inherent political conflict and the duty to treat every warming adjustment with extreme skepticism.
“Different Places”.
ROFL.
To be fair, I think a lot of the problem is that NOAA honestly doesn’t see its own bias (like most scientists don’t) and honestly doesn’t see the huge gaping hole between “each adjustment is plausible and we can show why” and “the adjustments taken as a whole cause the overall regional temperatures to contradict the history of other measures.” One of these statements carries a lot more empirical weight than the other, even if there’s a bigger pile of supporting documents for the other.
It’s not a coincidence that the AGW scare got traction around the same time the philosophy of science started taking a backseat to “make science fun!” They had global climate models in the 1970s too, but when the press called them people at MIT just laughed off the idea they could actually predict long-term climate trends.
You didn’t address the issue at all. Perhaps you don’t understand. There is no difference between times of observation other than what constitutes your observational day. This can result in a minor difference in the daily average, but in a monthly average, or in an annual average there is zero difference. You surely know this.
I can give you a mathematical proof if you really need one.
@Mark Fife February 22, 2018 at 5:00 am
“You didn’t address the issue at all.”
?????
“The problem comes when you change time of obs. That makes a one time shift which can be a sustained jump of up to 2°F. If real, that would be of climate significance. But it isn’t, so you have to adjust to remove it. Why TOBS is so important in the US is that those jumps were mainly in one direction. The original advice to volunteers was to read the temperature in the evening, but many had to read rain gauges in the morning. So they shifted to reading the thermometer in the morning too.”
~ Stokes ~
Again, there is no evidence showing TOBS can or should be adjusted for. Consider the following example. The coldest part of the day is about one hour after dawn, the warmest part of the day is about when the sun hits its apex. Lets say those times are 6:30 am and 3:00 pm. If I check the temps at 9:00 am I get that morning’s low and the previous afternoon’s high. If I check at 9:00 pm I get that mornings low and that afternoon’s high.
When cold or warm fronts come through there will be slight differences in the daily average because what constitutes an observation day is different. The actual highs and lows themselves don’t change, only the order in which you average them. However, both evening and morning times of observation are valid methods which yield exactly the same trends when averaged into weeks, months, or annual averages.
When I calculate the weekly average I can take an average of the daily average by adding all the averages and dividing by 7.. However, I can also add up all the highs and lows and divide by 14. Those two methods yield exactly the same results.
Same thing for annual averages. I can add up 365 sets of high and low daily readings in no particular order and divide the result by 730. The answer is going to be exactly the same as averaging 365 daily averages or 12 monthly average.
So I am calling BS.
Frankly, if you are unable to comprehend this I would suggest taking up a different hobby.
“If I check the temps at 9:00 am I get that morning’s low and the previous afternoon’s high.”
But suppose it’s a cold Monday morning, and Sunday was warmer. Then the min for Sunday will actually be, say, 7am Monday. And the min Monday will be 9.01 Monday. That cold morning goes into the average twice.
But anyway, I’ve given the actual calc for Boulder Colo above. Code and data is at the link. You can try it.
@Mark Fife February 23, 2018 at 7:45 am
“…
So I am calling BS.
Frankly, if you are unable to comprehend this I would suggest taking up a different hobby.”
An army of scientists disagree with you. Stokes provided everything you need to verify for yourself …
Yes, one of us needs a new hobby …. lol
Even with before and after screenshots of the raw data, Nick still sticks with the claim that nothing was changed.
“Nick still sticks with the claim that nothing was changed”
Absolute nonsense. I said
“When temperatures are adjusted, it means they change.”
and gave a plot of the amount of change.
Nick burped: **When temperatures are adjusted, it means they change.”**
No, it does not mean they change. It means they are corrupted – sort of like fraud, but Nick would not know what that means.
Any adjustment is ridiculous when you claim it is only 0.1 degrees, and then MOAA/NASA tells us it was the warmest year evah by 0.04 degrees, and a 38% chance of being right. It’s just a game.
Here (from here) is a map of the effect of GHCN adjustment on sites in the NY region. Those where adjustment increased the trend are shown in pink; decreased is yellow. In the US shown, there is a predominance of pink; adjustment usually increased the trend. But if you look across the border to Canada, where they did not use volunteer observers and observing times rarely changed (no TOBS), you see that pink and yellow are much more evenly balanced.
They aren’t changed, they are adjusted.
How convenient.
isn’t that cute!…..but it doesn’t tell us how much…just how many
Not for one minute would I assume all the pink or yellow dots are equally adjusted
Nick, if you were trying to support your argument you failed.
Most importantly, what period do your dots cover? How much ‘adjustment’ is specifically involved with each one?
The key question here is about the specific ‘adjustments’ discussed in this post, not the general fakery which you are unsuccessfully trying to obscure with this big picture. This is just a distraction.
“Most importantly, what period do your dots cover?”
The duration of record at each site.
“How much ‘adjustment’ is specifically involved with each one?”
You can go to the link to find out.
Nick:
**Here (from here) is a map of the effect of GHCN adjustment on sites in the NY region.**
that is another load of bull from Nick. All those stations are not used in computing the USA temperature. So just blowing more AGW hot air.
“All those stations are not used in computing the USA temperature.”
Not true. Typically, you give no substantiation. The GHCN stations in ConUS were USHCN stations. The ClimDiv set is much more extensive, and I am sure they are all included.
***“All those stations are not used in computing the USA temperature.”
Not true. Typically, you give no substantiation. The GHCN stations in ConUS were USHCN stations. The ClimDiv set is much more extensive, and I am sure they are all included.***
Bull, Nick. There is a limited number used in calculating the so-call temperatures they use in the “warmest year evuh!” plus the fact that 40 percent are fudged or made up. I guess the fake ones do not have to be adjusted, or “they change” as Nick burped above.
There should never be any adjustments. If the raw data is not good enough then develop a new way or technique for measuring and NEVER EVER COMBINE DATA SETS THAT ARE COLLECTED by different measuring equipment .
Alan Tomalty
How would you account for local station moves in that case? For instance, at my local airport the temperature screen was in the same place from 1970 to 2002. It was then moved twice; once briefly while the new Met Office building was constructed after the old one was abandoned, and again once the new building was in place.
These different locations had slightly different exposures and thus temperatures. Impressively, the Berkeley Earth ‘Difference from Regional Expectation’ algorithm has picked these moves up, identifying them as “empirical breaks”.
So, what to do? Do you just end a multi-decade long temperature record and start an entirely new one for the sake of a move of less than 1 mile and a temperature difference between the sites of ~0.2C; or do you make the simple adjustment of adding/subtracting the ~0.2C difference you’ve identified to the old set, thus preserving it for use in climate study, for trend analysis, etc?
No one is suggesting that the previous temperatures were somehow ‘wrong’. They were as real as those taken at the current location and yes, adjusting them up or down is changing ‘real’ data. But the raw data are retained, and the new data set exists specifically for the useful purpose of long term trend analysis in that general location.
To start a fresh temperature record every time a screen gets moved at any general location when it can be preserved by such a simple adjustment would be bizarre.
Pink = Trend Increased and Yellow = Trend Decreased.
By how much?
A Pink Trend increased by 0.8C and a Yellow Trend decreased by 0.2C equates to a net Trend Increase of 0.6C. All from adjustments to Raw Data. Looks like the Pink Increased Trend data points outnumber the Yellow Decreased Trend points. Michigan alone has 50 Pink Points VS 14 Yellow Points indicating the area has a vast ammount of Upward Trend increases and a scant few downward trend decreases. All indicating that the Raw data has been adjusted for a net Increased trend
that’s odd…not too long ago we were all talking about their algorithm that automatically adjusts all data…every time a new data set is put in
Ok, Ive taken up the challenge and have carefully examined the certified documents*
I am a skeptic with no love for NOAA but I have to say that at the outset I thought that Paul Homewood’s claim would prove erroneous.
Well, he is correct and NOAA should be alerted that their online graphing tool – “Climate at a Glance” – is incorrect.
I looked at the State, the Division and the subset of existing stations still in use.
Paul’s statement and his chart above it, are accurate:
I carefully checked all his figures against the historical record and they are correct.
And further, looking at the data for the central lakes Division**:
The Jan 2014 average was 18.2 and the Jan 1943 average was 21.8 as listed (And by re-calculation).
The difference is -3.6F which – oddly or coincidentally – is also the listed departure from normal in 1943***. Surprisingly perhaps, the 2014 historical data listing shows a -4.6F departure!**** which is close to the 0.9 figure – as an anomaly (Not the difference in the recorded average temperatures).
The -3.6F in the official documents is even worse than Paul’s 2.7F but oddly it is exactly 0.9F worse!!*****
There seems to be some programming error because there is some odd symmetry in various numbers as shown above.
Also for example the 21.8 (Temp in 1943) minus the listed 3.6 anomaly = 18.2! As a very average programmer for much of my working career, I can intuit what has happened. They are using the anomaly to calculate the temp difference from the baseline and in this case the numbers happen to be the same. I can see a broken greater-than-or-equals test/loop bug here! 😉
That is all I can suggest and I may be wrong in my conjectures but Paul is correct and NOAA are publishing incorrect data online!
*PDF files of original hard as copies supplied by NOAA
**All stations in the division as listed, including Paul’s subset.
***The anomaly in 1943 (Using a different baseline).
****Different baselines i.e. 1981-2010 v 1901-2000
*****0.9 you will remember is NOAA’s “current” official difference!
“The Jan 2014 average was 18.2 and the Jan 1943 average was 21.8 as listed”
These numbers are different from the numbers Paul quoted. Are you using the same station set in both 1943 and 2014, as Paul correctly did? I think that is the likely explanation for the discrepancy. The 2014 set includes colder places like Warsaw and Freeville.
You mention different anomaly bases, but I can’t see what you have done to resolve that.
“as Paul correctly did?”
I spoke too soon there. Paul correctly matched stations in comparing unadjusted 1943 with 2014. But then he used the climdiv adjusted estimate for 1943 for the adjusted figure. That is a different set of stations. Some of the difference between the average of the 7 1943 stations that he listed and the stations in the ClimDiv set would have been due to adjustment. But some is also due to the nature of the places. As you can see from the figures that he quoted, there was quite a range even in this one division. When he subtracts the climdiv stations for 1943 (18.7) from the 7 that he has chosen from the report (22), it can’t be said that the difference is entirely adjustment.
==>Nick Stokes February 21, 2018 at 2:53 am
You are falling into the same error as the NOAA algorithm. The numerical symmetries are purely coincidental.
The numbers “22” and “18.7” are not derived from a comparison with the “climdiv stations”, they are simply the station average less Scyracuse AP!
In essence, Paul is understating his case and I overstated it but the point is clear, the real station averages (As recorded in physical documents) are incorrectly represented by NOAA’s Climate at A Glance, online tool.
“The numbers “22” and “18.7” are not derived from a comparison with the “climdiv stations”,”
Yes they are. 18.7°F is the current NOAA average for 1943. That is a modern calculation based on climdiv. And it is where the talk about adjustment comes from. There aren’t any other adjusted figures.
“the real station averages”
This gets tiresome. NOAA has stated what it believes to be the real monthly averages, calculated consistently with current practice. It isn’t an error.
==>Nick, I was replying to your comment:
18.7 is the 2014 average in Paul’s table (Of seven stations) less Syracuse AP.
22.0 is the 1943 average in Paul’s table (Of seven stations) less Syracuse AP.
I know you can handle addition, so please check these sums before you make another defensive rush!
Nothing in my post mentions adjustments and nothing in my defence or Paul Homewood’s post concerns adjustments. You are putting words into my mouth and fighting your own shadow, not me. It’s not about adjustments, it is about documenting the recorded data accurately. You can check yourself, the figures listed in tables beneath the online graphs, show the monthly averages and they do not match the historic record no matter how hard you might wish it to be otherwise!
Well, that’s a bit rich, when you publish on your site, an article where the sole argument for why a bunch of assertions are true is “The adjustments amount to a whopping 3.1 degrees F.”
Well, that’s settled I guess.
And then you have a go at Nick Stokes, who actually bothers to look at the specifics and explain why he thinks what he thinks.
Well, It’s just my opinion, and you can censor it if you want, but I think you’re way out of line.
In a recent post Nick showed a graph which suggested the adjustments were negligible.
One thing did occur to me: could the graph be ignoring the adjustments by the NOAA?
I don’t have the original source, but I have a copy of what appears to be a NOAA graph that shows *massive* adjustments, so that nearly half of the warming comes from the adjustments alone. Almost certainly the adjustments push down the early measurements and push up the later measurements.
Ironically it seems that one adjustment that is missing – the one that really matters – is UHI.
I can’t be certain, but I have a dark suspicion that the adjustments may be the biggest scientific fraud in history. And the NOAA may be at the heart of it.
Chris
Nick asked for a degree day site—don’t know if it is doctored.
http://www.weatherdatadepot.com/faq#noaa
Excuse: James Hansen did it in 2000 and no one complained so we thought “why not, no one is paying attention”! Hansen should have been fired immediately and forfeited all retirement benefits.
Mental exercise: if the established narrative was global cooling instead of global warming, would the tamperature adjustments be different?
“tamperature” — I love it! Thanks for the chuckle.
Jobs and pensions should be lost .
Their reputations already are .
The same thing happened a few years ago in the Great Lakes region. The ice proxies were completely at odds with the claimed temperatures.
Desperation…..in the UK we have not had a really warm Summer for years….yet with the Hadley Centre, The Met Office, BBC and The Guardian newspaper nothing is said.
What amuses me is that 75% of Sea Ice…North and South disappears during their respective warming seasons and we never notice it.
Yet by now NY should be under 30ft of water. Laughable.
One of my favourite bits of rubbish is that CO2 will keep us warmer than the Sun. Really?…Every sunset when the Sun disappears is temp still the same?.er No!
It gets colder and only warms up once the Sun is up again.
This whole AGW has been nonsense for years.
I well remember our former Prime Minister Tony Blair telling us all “we have 100 days to save the world”.
Like satellite data…more and more nonsense.
James Griffin February 20, 2018 at 12:33 pm
What amuses me is that 75% of Sea Ice…North and South disappears during their respective warming seasons and we never notice it.
We’re currently at the annual minimum extent for global sea ice, it’s about 16 million sq km, the lowest in the satellite record, the highest over that period being ~19 million sq km.
The annual maximum is usually around november and has ranged from 28 million sq km in the past to ~24 million sq km in 2016.
Where do you get 75% from?
There is the word “respective” in there. So posting about global extents is not responsive to what James Griffin said.
Phil
A few years ago winter sea ice maximum eas anomalously high. The chorus then from the climate and Arctic experts was that the spring maximum is irrelevant, Artcic is land bounded etc etc.
But now that winter maximum is low – suddenly it’s relevant?
No its not. Your lot were right first time. Wait till The much more relevant and informative September minimum. I’ll go on record (if anyone even gave a sh**) predicting that it will be high.
“We’re currently at the annual minimum extent for global sea ice, it’s about 16 million sq km, the lowest in the satellite record”
The sooner everyone realizes that sea ice extent is a meaningless number, the better. It has no connection to how much ice actually exists at any given point in time. The only thing it really signifies is that there is ice of some unspecified quality and quantity in a certain location. Furthermore an entire area could be frozen over with new thin ice, and it would not be picked up and included in sea ice extent. It’s real highly massaged garbage data.
MikeP February 20, 2018 at 1:01 pm
There is the word “respective” in there. So posting about global extents is not responsive to what James Griffin said.
Actually it does since the respective poles are out of phase with each other and therefore tend to cancel each other, consequently what could be noticed would be the nett global change.
ptolemy2 February 20, 2018 at 1:10 pm
Phil
A few years ago winter sea ice maximum eas anomalously high. The chorus then from the climate and Arctic experts was that the spring maximum is irrelevant, Artcic is land bounded etc etc.
Really? When was that, certainly not in the last ten years?
But now that winter maximum is low – suddenly it’s relevant?
No its not. Your lot were right first time. Wait till The much more relevant and informative September minimum. I’ll go on record (if anyone even gave a sh**) predicting that it will be high.
We’ll see, doesn’t seem likely but indeed winter maximum is not a good predictor of the fall minimum. The Bering st being exceptionally low for the time of year and some of the thickest ice in the Arctic still being broken and flowing through the Nares st isn’t a good start.
You’re right about UK summers. As a farmer I’m very aware of the summer weather, a good dry summer makes harvest a lot easier. In the last 10 years I can think of one summer, 2013, that contained a prolonged settled hot period of weather. The others may have had brief hot spells (which are always hyped by the usual suspects as ‘proof’ of global warming and climate change), some had hardly any warm spells at all (2012 was a terribly wet and cool summer). There hasn’t been a real scorcher of a summer when it hardly rained at all since 2006. God knows what they would say if we had a summer like 1995,1990 or 1976 today (all were incredibly hot dry summers) – presumably the climate apocalypse would be upon us……
There’s a problem with government transparency here:
NOAA, and any government department for that matter, owes it to the citizens to be completely transparent as to how they process data. It’s the spirit and letter of the law. Apparently they’ve found ways around that.
That is probably the biggest issue here: transparency. Are the adjustment justified? Who knows!
“There’s a problem with government transparency here:”
Have you actually read what they say? Windows can lack transparency if you keep the blinkers on. People here seem to be struggling with the simple fact that they publish both unadjusted and adjusted data. They explain in huge detail the rationale for adjustment, and the tests for its correctness. Their page on homogeneity adjustments is here. For detail they refer to the extensive paper by Menne and Williams, along with others.
You’re guilty of massacring a metaphor. Blinkers don’t prevent visibility through windows. I am reminded of this Dilbert Cartoon … OK maybe not that bad.
Have you actually read Paul’s post?….no you haven’t
“This means that NOAA has adjusted temperatures by an astonishing 2.4F, or about 1.3C.”
“Under the new nClimDiv system, introduced in 2014, NOAA’s methodology is extremely opaque. They don’t, to the best of my knowledge, publish the data and adjustments used.
In essence, we are asked to accept NOAA’s version without being able to check or verify it.”
https://notalotofpeopleknowthat.wordpress.com/2018/01/25/new-yorks-temperature-record-massively-altered-by-noaa/
And we are supposed to trust the NOAA weather records? What is even more weird is that it is difficult to find even fairly recent weather records on the net. I am sure they are there somewhere, but I tried to find the record for a snowfall in the Santa Cruz Mountains in the early 1970’s. I couldn’t remember exactly which year, but the NOAA records were rather obscure, and I gave up after about a half hour.
You sometimes have better luck looking for data like that from a local water resources agency.
Let us not forget that Hansen of the Goddard institute a division of NASA closed down the H2O measurements in the atmosphere in 2009 after 20 years of measurement showed no increases. To this day many have been searching for up to date H2O data but noone seems to be collecting it. A key component of the AGW theory is that it would force more H20 in the atmosphere.
“Let us not forget that Hansen of the Goddard institute a division of NASA closed down the H2O measurements in the atmosphere in 2009 after 20 years of measurement showed no increases.”
One of the many things unforgotten here that just ain’t so. Hansen was never in charge of any “H2O measurements”.
I don’t know who is behind this baloney. If it’s Hansen, he should be fired. I cannot imagine why he would do something like that unless he has a hidden agenda.
But to any of us in the USA, our tax dollars go into his paycheck. It’s about time he was shown the door. This is disgraceful.
Sara February 20, 2018 at 12:48 pm
I don’t know who is behind this baloney. If it’s Hansen, he should be fired. I cannot imagine why he would do something like that unless he has a hidden agenda.
Hansen retired from NASA a few years ago and the original poster was referring to NOAA not NASA so nothing to do with Hansen.
it has plenty to do with hansen phil. just not directly this time.
Has anyone taken a real close look at this to see if Homewood’s findings are correct and valid? We sometimes rush to judgement….
Kip, I’m sure you could do the right thing.
The Delinpole article appears to be based on Steve Goddard’s blog so not a very reliable source.
That graph is the monthly average for January, the record cold was for about one day (night) whereas otherwise the weather wasn’t exceptional, very little snow, so not surprising that the monthly average isn’t low. It’s a typical Goddard ploy to refer to a fact and then show a graph which doesn’t quite apply.
E.g. the freezing iguanas were in Florida, not the Northeast! As for the ‘sharks freezing in the ocean’ they were actually late migrating sharks getting cut off in the shallow waters of Cape Cod bay.
I think “Steve Goddard’s” site is far MORE reliable and honest than NOAA – though that really is not much of a compliment. NOAA very deliberately fakes data.
That makes sense…the cold air in Florida detoured around Chile and came back up from the south….and it’s common for sharks to freeze in the bay, happens all the time
And Phil. while you busy trying to look like a moron…why didn’t you check Steve’s blog…before you tried to smear him?
…you would have found out he’s make no such post…and been on vacation
“The Delinpole article appears to be based on Steve Goddard’s blog so not a very reliable source.”
“”That’s because, as Paul Homewood has discovered,””
…you are really out to do yourself in, aren’t you?
Latitude February 20, 2018 at 2:12 pm
That makes sense…the cold air in Florida detoured around Chile and came back up from the south….and it’s common for sharks to freeze in the bay, happens all the time
Cold snaps in December can catch them out, three of them miscalculated this time.
And Phil. while you busy trying to look like a moron…why didn’t you check Steve’s blog…before you tried to smear him?
…you would have found out he’s make no such post…and been on vacation
Yes I know he’s been on vacation, however it was Delingpole who made the claim about Goddard, not I. The first line of his piece says:
“Here is the chart that demonstrates the scale of the fraud (as nailed by Steven Goddard).”
Latitude February 20, 2018 at 2:38 pm
“The Delinpole article appears to be based on Steve Goddard’s blog so not a very reliable source.”
“”That’s because, as Paul Homewood has discovered,””
…you are really out to do yourself in, aren’t you?
No I actually read the article this refers to:
“Via James Delingpole at Breitbart:
The National Oceanic and Atmospheric Administration (NOAA) has yet again been caught exaggerating ‘global warming’ by fiddling with the raw temperature data.”
The first line of which says: “Here is the chart that demonstrates the scale of the fraud (as nailed by Steven Goddard).”
Steve “nailed” that ages ago….nothing current at all…and nothing about this past January in New York
…Steve has nailed the “fraud” at NOAA a long time ago…..the Delinpole article is based on Paul’s blog
…you just had to get a dig in…..and Steve’s favorite word is moron
There is a town in (Outer) Mongolia called Moron. Maybe that’s where Morons come from. Anything of or from that place would correctly be called ‘Moronic’.
I think there is a big data base of global temperatures there. They also have a ‘hire local’ policy, apparently.
What is NOAA’s end game? Adjusting temps upward by 10 degrees? The next ice age is going to start during ‘the hottest year evah’.
Kip – I don’t see that they are even comparable, from what is presented on Breitbart. He seems to be comparing temp avg for all of NYS with temps of sites within the state. Maybe I’m not reading it right, though.
Besides, even if they were different – even if there are data being adjusted – that is sometimes appropriate. Without knowing NOAA’s story, it’s wrong to assume fraud. Instead, the assumption always seems to be that (consensus) climate scientists are corrupt.
“Without knowing NOAA’s story”
Great. Let’s hear their “story.” Not another one of their usual vague generalized stories but the exact details in this case.
In the meantime, based on NOAA’s track record – and that of the whole corrupted ‘consensus’ – it is only logical to assume more deliberate and convenient fake numbers until proven otherwise.
Or are you still trying to invest with Madoff?
Kristi ==> The issue is what are called “ad hoc post hoc” adjustments — changes made to the original research record based on subjective opinions of what the data “should have” or “would have” been — the past data itself is questionable enough as it is — wide but unacknowledged uncertainty bars, known but ignored original measurement errors, the use of uncalibrated thermometers (this list goes on…). There are many varying opinions about how the original data has been changed and why — many changes are never actually scientifically documented and justified. Different agencies adjust differently — there are entire volumes, well, at least chapters, written about the ad hoc post hoc adjustments made to both the thermometer and satellite records.
All of the climate records have been subjected to these types of adjustments, see mine re Sea Level here at WUWT and Judith Curry’s ongoing discussion of sea levels issues and adjustments here./A>
“The issue is what are called “ad hoc post hoc” adjustments — changes made to the original research record “
They aren’t “changes made to the original research record”. There is no “research record” involved; they are routine weather records. And they aren’t “changed”; the original records are still there and published. Adjusted records are also published, and are used when a homogeneous historic regional average is needed.
Nick says< **Adjusted records are also published, and are used when a homogeneous historic regional average is needed.**
Translation: Adjusted records are used when they have to tell the world this is the hottest year evuh.
That is how the 1930's faded from being the warmest.
Kip, good point. Not being technically oriented it’s very difficult to sort these things out. Surely someone can verify or debunk Nick’s claim that NOAA is being transparent in their adjustments. This has to be done by crawling through the specifics – not just saying Nick is a liar or is simply wrong.
Ain’t nobody got time for that! And that’s a large part of the problem. The few people who could actually be bothered to get into things so deeply get drowned out by the big dumb mob.
Took a few minutes.
https://search.usa.gov/search?affiliate=NCDC&query=data+adjustment&x=0&y=0
And a ton of data.
https://www.ncdc.noaa.gov/data-access
After “climategate” I bet people are pretty careful to be transparent.
Try reading up thread.
Hard to tell actually, but given current events it would not be surprising at all if true. I’m surprised they’ve left the record warm 1932ish as is. How nice must that winter have been?!
I have notice that NOAA has removed their nice plot of raw vs adjusted temperatures. I guess too many people were seeing it. I have it in hardcopy, I think I had seen it here as well.
It’s still funny to me that the entire Global Warming Narrative, and the story of all the weather the earth has ever known, is sustained solely by the appearance of one line on a graph that squiggles a certain way, and it’s still amusing after all these years to watch all the chicanery employed (which includes the manipulation of various other squiggly line bit players) to maintain the main squiggly line’s particular appearance, like it needs to be appeased like a god.
Andrew
Meanwhile the agreeable 10C (18F) warmer on this side of the pond
http://www.vukcevic.talktalk.net/NE&CET.gif
So what? That is beside the point. A distraction. The point is this faked case, period. We need to focus on it.
There is no trend to that graph
With the Trump administration in power it is time for this corruption to stop. Like right now.
There is no point just moaning about this obvious politicized garbage because they will just keep doing it.
This is a perfect case to expose because it is so blatant and because it happened in a place where so many people – everybody there – knows what really happened.
Take this case and focus on it, and publicize it. Make it THE test case – the straw that WILL break this lying camel’s back. DEMAND an full explanation. Not ask, demand! If some business faked numbers like this they would be in jail.
“With the Trump administration in power it is time for this corruption to stop. Like right now.
There is no point just moaning about this obvious politicized garbage because they will just keep doing it.”
I agree. We should ask the Trump administration what they are going to do about this possible criminal tampering of the climate data. The Red Team needs to be up and running as soon as possible.
“The Red Team needs to be up and running as soon as possible.”
I guess the Red Team will run around and around in circles until they do eventually discover that NOAA does in fact publish the unadjusted data. Even the handwritten originals.
“NOAA does in fact publish the unadjusted data. Even the handwritten originals.”
That’s good news Nick, assuming that they have not already ‘fixed’ that data. With their track record, that is a distinct possibility.
Now, back on point: how was this particular case ‘adjusted’ so drastically? By WHO exactly?
Nick….””NOAA does in fact publish the unadjusted data””
Paul……”This means that NOAA has adjusted temperatures by an astonishing 2.4F, or about 1.3C.”
You’re right. I’m an insurance adjuster and the frozen water pipes claims in the NE were unprecedented. And the damage? A handful have gone over $50,000, with 1/4 over $20,000. This is on probably 80-90 claims over 2 months. While I was in VT and upstate NY, the same happened in ME and NH. It was overwhelming.
There’s a related factor here. None of the damage occurred in homes with natural gas piped in. All oil, propane, electric or wood boilers(10 fires in wood stove chimneys). With cheap, reliable natgas, all these problems were avoided. Something related is cost. Due to cost of propane, oil, electric, people shut off rooms, or have a kerosene heater, or stoke the wood stove, with predictable consequences. I’ve seen some terrible fires, all wood stove related, as they burn 3x the heat as fireplaces, and these old chimneys can’t take it.
Falsus in uno, falsus in omnibus. That’s how this should be approached. If caught lying once, on any issue of magnitude, all papers, graphs, studies, should be discarded. They’re not reliable. Why trust their work?
I live near Philadelphia, and that cold snap was not exceptional. The low for the month of January at PHL airport was +3 degrees, lower than usual for the low for the month of January, but not exceptional. Record lows in my part of the country were spotty, not widespread. The cold snap of January 1994 was much more severe. And don’t forget the winters from the one of 1976-1977 to the one of 1984-1985, when my part of the country got much colder.
I meant most of the winters from 1976-1977 to 1984-1985. Philadelphia was warm in the El Nino winter of 1982-1983.
the low at the uhi airport was not exceptional ? there’s a surprise. what were the lows in the nearest rural area donald ?
Philadelphia’s UHI did not change much since 1994. It is a slow-growth city whose population is about 19% below its peak in 1960, in a state that loses Congressional districts every year.
I have a friend in a very cold spot in Upper Gwynedd Township, which on average on clear nights gets a degree colder than Quakertown Municipal Airport (a couple miles west of Quakertown, a large farm town), and the coldest temperature he got was -4 F. PHL airport got to -5 in January 1994, and cold areas outside Philadelphia got well below -10 F in January 1994.
Meanwhile, I checked stats for the whole month of January for Philadelphia. The average temperature was 32.8 F, the normal value (1981-2010 average) for this is 33.0 F. The high for this month in 2018 was 64 F, 4 degrees above the “normal” high for the whole month of January (1981-2010 average) of 60 F. Notably, consideration of daily high temperatures instead of daily average temperatures has been proposed in WUWT because UHI has little effect on most daily high temperatures, and has much more effect on daily low temperatures.
Though much has been said about the extreme cold being limited to parts of America, in January, here in Tokyo, we experienced the coldest weather in nearly 50 years. This was very unexpected as few cities in the world are more subject to the UHI effect than Tokyo. The pond in the park arcross from my home froze over, for the first time since the end of the war. My business associates in Germany were also complaining about the extreme winter this year.
No not just parts of America, Russia, Canada, Brazil & Peru, Europe, Australia Saudi Arabia.
ie different places all over the world.
Pierre Gosselin is drawing attention to a number of recent publications in making some remarkable claims, over at NoTricksZone:
http://notrickszone.com/#sthash.THAp8Ocl.dpbs
– In USA, blizzard frequency has increased in the last 55 years, 4-fold
– The eastern half of the USA cooled between the late 50’s and 2015 (and presumably, up to the present)
– 1/3 of the northern hemisphere cooled during 1990 – 2015
– Antarctica and much of the SH has been cooling since 1979
– Greenland, Antarctica and many other locations have seen no warming for 60 years
– Antarctica has not warmed for 200 years
– The Himalayas have not warmed over 300 years
– German railways are blaming intensifying storms from global warming for deteriorating train punctuality and reliability. But storms are getting less not more. This is a false excuse, according to Axel Bojanowski, for slipping standards of once proud German rail engineering.
It is remarkable how much ‘smoke and mirrors ‘ are required to support ‘settled science’
NOAA to Americans: Don’t believe your thermometers or your frozen pipes or your shivering bodies–it’s warmer than it used to be, and it’s YOUR fault! Trust us!
Yeah 70ºF today in Boston, a record for the day apparently, tomorrow more of the same.
Nice meaningless distraction Phil. Look, a squirrel!!!
But distraction is all you have.
Extreme Hiatus February 20, 2018 at 4:09 pm
Nice meaningless distraction Phil. Look, a squirrel!!!
But distraction is all you have.
So Delingpole posting that NOAA is falsifying data when the monthly average is not particularly cold when a few days early in the month were record cold isn’t a distraction. But my pointing out that today is a record high and tomorrow at 71ºF will likely smash the record set for the day in 1906 (63ºF) is! That’s what monthly averages do, they smooth out daily fluctuations. Unlike Delingpole I won’t charge anyone with falsification if the February average doesn’t show a record heat.
@ Phil. …and here is the reason why Boston is warmer. Does CO2 drive the surface winds of this planet? …https://earth.nullschool.net/#current/wind/surface/level/overlay=temp/orthographic=-73.14,36.14,1107/loc=-76.126,33.720
No Phil. Your warm squirrel is a distraction from discussing the ‘adjustments’ made in the case discussed in this post.
Your other convenient squirrel is your selective focus on the messenger(s) of this particular incident.
Surely you are more interested in finding out the details of this adjustment too, aren’t you? Or would you rather ignore it and chase more squirrels?
Delingpole claimed: “NOAA caught “cooking the books” again, this time by erasing a record cold snap” “This time, that data concerns the recent record-breaking cold across the northeastern U.S. which NOAA is trying to erase from history.”
He was claiming that the monthly average for this January was false because in his (or Goddard’s) view it should have been colder because there was a record cold night on Jan 6/7. There was no adjustment just a monthly average, no ‘erasing of a cold snap’, just fake news.
Well Phil, I guess you will really want to see exactly how NOAA’s monthly average – which you appear to assume is gospel – was calculated, won’t you? And to do that you first must know, in detail, how the individual data points were ‘adjusted,’ won’t you?
This is a test case. Because it happened where so many people live – versus in some remote spot – and so many people apparently mistook cold for warm weather, it is a prime candidate for validation of NOAA’s methods don’t you think?
If not why not?
Phil we are freezing in WI, send us your warmth
“Well Phil, I guess you will really want to see exactly how NOAA’s monthly average…”
Have you tried to find out? There are plenty of papers written. If you want to follow up your curiosity about the adjustments, you can download and run the code here.
Nick – Would you also recommend I consult the ‘papers’ and ‘code’ that Madoff offered to explain his Ponzi scheme (before he was caught)?
This is a specific test case. Someone – like Paul Homewood did for 2014 – needs to look at the actual raw and NOAA’s adjusted records which were used to manufacture their monthly ‘average,’ and to investigate their exact reasons for what they did – and then recheck everything to see if they even did what they claim they did. NOAA has no credibility anymore so what they claim can no longer be trusted, period.
Now a person like you, who seems to have endless time on their hands to play with numbers, could do that and I would guess that Anthony would gladly post your analysis. Then it could be properly reviewed here, for starters. That way you could do a great service for your cause – unless it didn’t show what you wish it would.
In my opinion, after following this whole increasingly dishonest pseudoscientific project for too long now, NOAA has no credibility anymore and what they claim can no longer be trusted at all. On other words, your emperor has no clothes and it is a pretty pathetic sight – especially in this cold weather.
Extreme Hiatus February 20, 2018 at 5:49 pm
Well Phil, I guess you will really want to see exactly how NOAA’s monthly average – which you appear to assume is gospel – was calculated, won’t you? And to do that you first must know, in detail, how the individual data points were ‘adjusted,’ won’t you?
Well I just took the Accuweather max/min T for Boston, found the daily average, then calculated the average for the month. It came to -2˙ºC which is their published average for the month, so evidently that first cold week was countered by the later warmer spells.
Thanks for doing that Phil. That data point is a good start for your argument. I’m not sure how many more there are for the question at hand: “January 2018 chart for Northeast U.S. – an area which includes New England along with NY, PA, NJ, DE and MD”
The monthly summaries available in “past weather”, noted as (CLM), in weather.gov pages for many cities is available. These are unadjusted raw data. They mention statistics for the month as well as (usually) “normal” values for them, which is currently the 1981-2010 average of them.
The one for Boston’s Logan airport for January 2018 says:
High for the month: 61 (no normal for that mentioned)
Low for the month: -2 (no normal for that mentioned)
Mean for the month: 28.6 (normal for this is 29.0)
That is a really neat projection of the winds I am sure that it is at least part computer modeled. until we can have a worldwide accurate non computer modelling of the winds and especially the clouds I will never trust computer climate models. It will never happen because to get precision on such a low scale for clouds you would need a computer with the number of ICs approaching the number of sand grains on all the worlds beaches. Mankind’s hubris into thinking that we could model our planet accurately. But I guess the PhD atmospheric science guys will never give up trying. Our job is to undo all the bad policy decisions from their inaccurate models.
Extreme Hiatus: ” NOAA has no credibility anymore so what they claim can no longer be trusted, period.”
If you believe that then you shouldn’t believe any of their data – is that the case? And NASA? Whose data do you accept? Why even do the experiment?
Does it not make sense to find out why they did what they did from them rather than trying to construct what you think they might have thought and done? It could be pretty tricky to follow their footsteps without knowing what they were. Just an idea.
Phill, keeps caliming “Goddard” when the main piece is about Paul Homewood.
Phil has no clue.
A C Osborn February 21, 2018 at 9:53 am
Phill, keeps caliming “Goddard” when the main piece is about Paul Homewood.
No it isn’t.
The title of this topic is:
“NOAA caught “cooking the books” again, this time by erasing a record cold snap”
Anthony Watts / 23 hours ago February 20, 2018
Via James Delingpole at Breitbart:
The National Oceanic and Atmospheric Administration (NOAA) has ‘yet again’ been caught exaggerating ‘global warming’ by fiddling with the raw temperature data.
This time, that data concerns the recent record-breaking cold across the northeastern U.S. which NOAA is trying to erase from history.
The Breitbart link at ‘yet again’ directly acknowledges Steve Goddard as the source on it’s first line.
The NYC & NYS stories are by Paul Homewood.
I read it when he wrote the stories days ago.
Perhaps you should try reading them yourself.
https://notalotofpeopleknowthat.wordpress.com/2018/02/16/us-big-freeze-is-adjusted-out-of-existence-by-noaa/
https://notalotofpeopleknowthat.wordpress.com/2018/02/17/ghcn-are-even-inflating-current-temperatures-in-new-york/
Then either discuss them with Mr Homewood or come back here and apologise.
As a former NOAA employee, I remain disgusted with these smarmy self-aggrandizing cesspool-infesting snake-oil salesmen of NOAA. (Alliterative, I like it.) Now let me tell you how I really feel. I witnessed, firsthand, the management of an agency by boobs. There are many fine people who work for NOAA (and also many losers), but when management directs employees to jump, they ask “How high?” The yes-man and yes-woman syndrome, and PC-ness, has been and is out of control. Where is this swamp-draining I keep hearing of? NOAA and the NWS need serious management replacement by people who know science and want to work for the public good. Final comment: the infestation of the atmospheric sciences, especially in the research arena, by extreme leftist liberals which started in earnest in the 1970s continues to this day. It is completely obvious what the agenda of these researchers has been for many years. I resigned from the AMS in the early 1990s because of this, as well as the fact that one of the worst managers in the NWS was running for high office in the AMS. Thank the stars this person did not win, but this person went on to degrade the agency for years before being bounced out for fraud, but went on to another NOAA agency and no doubt ran that one into the ground as well. NOAA has been acting in a shameful fashion for many years.
And Donald Trump has yet to nominate a NOAA Administrator who the Senate would confirm (with only 51 votes needed nowadays). The current NOAA Administrator is an “acting” one, promoted from within NOAA.
Trump did nominate a NOAA Administrator (AKA “dual-hatted” as Under Secretary of Commerce for Oceans and Atmosphere), but his nominee was not a scientist but a lawyer, who also is CEO of a private weather forecasting company that has lobbied for legislation removing the National Weather Service from many forecasting duties that private weather companies also do.
A new record high for my little spot on the globe was set today. I don’t know the official number but my front porch says it got up to 76.6.
Looking at the NWS, it says (or rather implies) the old record was 68 set in 2016.
The problem.
They don’t show ties anymore. 2016 did tie the old record. But it was actually “set” in 1891.
Why show the most recent year of a tied record rather than the year it was actually set?
PS This morning TWC was going spastic over the possibility of record highs in the eastern US.
Yet on their “Local on the 8’s” they STILL don’t include the record high or low for the day. They used to. Why did they stop?
Yet again, here is one of the great many explanations of how temperature measurements are adjusted: https://www.carbonbrief.org/explainer-how-data-adjustments-affect-global-temperature-records
Yet another discussion explaining how it all works using the very data that is in question.
A C Osborn – I’m afraid I don’t understand what data you propose they use, if not the data in quesiton.
How can they be “caught” doing what they always do? You can’t “catch” water running down hill, it is simply what it does. Come on. Water is wet, the sky is blue, climate “scientists” lie. That is just how it is.
Interesting graph in this post.
About 8-10 years ago the Audubon society had a press release playing up the increase in January temperatures and the subsequent impact on birds. They picked the mid 60s as the starting point.
I guess we can see why.
Do you think they’ll issue an update now that more data has come in?
Pretty soon they will adjust the past so much that will hit absolute zero.
Well, they need to keep the Heller co-efficient (adjustment / CO2 in K/ppm) constant, so it depends directly on future emissions.
Weather forecast data for my local station is routinely warmer than than the actual recorded temperatures. The forecast data gets into the record books. Not the “actual” recorded temperatures.
Why is that?
Argument over minutiae. So I repeat, we are in an interstadial warm period. We should be warm with little ticks up and some down during the peak we are in. Some of these ticks up may be decades long. The downward ticks likewise. We are lucky to live during this period. It is a blessing. Boggles the mind that any human would complain or panic, or believe colder is better or more natural. Those who think this way?
Idiots.
Wasn’t there a similar story out of Australia in the recent couple of years?
Someone figured out that there was a floor in the cold temps for a cold season.
Seasonally adjusted temperatures! YEE HAW, going to be 20C year round, no more cold winter or stifling summer.
I have been disappointed with the Trump’s administration about the inability to audit the NOAA organization and its procedures. You should remember that in composing the global temperatures, they need data outside the USA. It would be very easy to find out, if NOAA has altered the temperature data originating from other national organizations. There have been blogs, which show huge differences between the NOAA and the original data graphs.
oh, it is enough if they first close the GISS, those were adjusting the adjustments… One has to start somewhere…
now i know why we freeze our butts off in tha “hottest year evah”
Well, what do you expect? We live in Adjustocene, this is how ‘science’ works in this era?
Temperature readings need to be adjusted to fit the theory. This is a must. For some small temperature deviations we should not think we are safe and pollute the planet with plant food?
Sea level data need to be adjusted to fit the adjusted temperature data. This is very clear and straightforward. Those pesky satellites would otherwise malfunction.
ARGO – sea temperature data needs to be aligned with temperature and sea level data and thus needs to be adjusted.
Everything must be calibrated, adjusted and aligned, this is ‘science’ where data is adjusted to fit the theory: Adjustocene.
Yup global warming is man-made
It may be time to stop wringing our hands about fixing or “refining” the record. It is a federal crime for a custodian of US government records to willfully and unlawfully mutilate, obliterate, or falsify ” such a record.
Here is the statute. It is a felony.
18 U.S. Code § 2071 – Concealment, removal, or mutilation generally
(a) Whoever willfully and unlawfully conceals, removes, mutilates, obliterates, or destroys, or attempts to do so, or, with intent to do so takes and carries away any record, proceeding, map, book, paper, document, or other thing, filed or deposited with any clerk or officer of any court of the United States, or in any public office, or with any judicial or public officer of the United States, shall be fined under this title or imprisoned not more than three years, or both.
(b) Whoever, having the custody of any such record, proceeding, map, book, document, paper, or other thing, willfully and unlawfully conceals, removes, mutilates, obliterates, falsifies, or destroys the same, shall be fined under this title or imprisoned not more than three years, or both; and shall forfeit his office and be disqualified from holding any office under the United States. As used in this subsection, the term “office” does not include the office held by any person as a retired officer of the Armed Forces of the United States.
We have a U.S. Attorney General’s office qualified to prosecute this. How about sending a letter.
Absolutely! Go for it. I think that’s an excellent idea – get it all out on the table before a court. Will people go with the decision, though? Would a finding for the plaintiff settle the issue, or just be a sign of the extent of the conspiracy? If there’s a problem, it needs to be addressed.
I have downloaded full sets of GISS temperature anomalies from WFT, some years apart and of course none of the anomalies line up when you sit them side by side in a spreadsheet. Anomalies around the 1800’s are now lower and the more recent anomalies higher. I would assume that WFT would pull data in on a monthly basis in lieu of a total refresh. So I am not sure whether the adjustments are carried out by WFT or GISS?
Oops I meant NOAA not GISS
That’s a BALD FACED LIE by a BALD faced LIAR.
“Nick Stokes February 20, 2018 at 9:43 pm
“Except Jones and Mann who delete it”
Jones and Mann have never been custodians of raw data.”
OK, tell us more. What raw data were they custodians of?
Is it relevant that the NOAA January average temperatures for the Northeast United States, the ones that made the chart in this post, show 1989-2003 at 23.53F and 2004-2018 at 22.97F? So Januarys in the second half of the 30 year climate period 1989-2018 were 0.56F (0.31C) cooler than in the first half.
January max was 32.39F in 1989-2003 and 31.67F in 2004-2018. January min was 14.69F in 1989-2003 and 14.26F in 2004-2018.
For the past 10 years, 2009-2018, the average temp in the US Northeast was 22.46F. In 1906-1915 it was 22.60F. In 1932-1941 it was 22.83F.
Not surprising since winters in much of the northern hemisphere have been getting colder for the last few decades.