Guest essay by Larry Hamlin
The record snowfalls of 2018 that are sweeping across the Northern Hemisphere and continuing the growth trend in winter snowfall levels provide yet more compelling evidence that the UN IPCC AR5 WG1 climate report and models are flawed because this report concludes that future snowfall level trends will only decline.

NOAA Northern Hemisphere snowfall recorded levels in the last 10 or more years show increasing trends in winter snowfall over the prior such period in both North America and Eurasia with 2018 snowfall records likely further adding to these trends.

These real world snowfall level trends suggests that climate models are both unreliable and inadequate for representing global climate and thus inappropriate for use by governments in establishing costly and unjustified global climate policy.
The AR5 WG1 report concludes in the Executive Summary of Chapter 12 Long-term Climate Change the following major finding regarding the relationship between global warming and snowfall level trends in the Northern Hemisphere:
“It is very likely that NH snow cover will reduce as global temperatures rise over the coming century”
Additionally the AR5 report further notes in the same Chapter at section 12.4.6.2 Changes in Snow Cover and Frozen Ground:
“Future widespread reductions of SCE (Snow Cover Extent), particularly in spring, are simulated by the CMIP3 models (Roesch, 2006; Brown and Mote, 2009) and confirmed by the CMIP5 ensemble (Brutel-Vuilmet et al., 2013).”
Note that the phrase “Future widespread reductions, particularly in spring” clearly suggests snowfall trend declines in other seasonal periods with those being fall and winter.
This finding and conclusion exclusively addresses only declining Northern Hemisphere snowfall level trends in our future and further fails to address any discussion of future increasing snowfall level trends at all.
These conclusions and findings of declining future Northern Hemisphere snowfall level trends are provided and elaborated upon in numerous other sections of the AR5 WG1 report including the Summary for Policymakers in Section B.3 Cryosphere and in Section E. Future Global and Regional Climate Change, in Chapter 4 Observations: Cryosphere in Section 4.5.2 Hemisphere View and in the Technical Summary in Section 2.5.5 Snow Cover, Freshwater Ice and Frozen Ground, Section 5.4.6 Projected Near-term Changes in the Cryosphere in Section 5.5.5 Pojected Long-term Changes in the Cryosphere.
These many sections of the AR5 WG1 report only address the issue of declining snowfall level trends in the Northern Hemisphere that have occurred since the mid 20th century and that are projected by climate models to experience “widespread reductions” in the future.
There is no discussion in the many thousands of pages of the UN IPCC AR5 WG1 report of global warming increasing snowfall level trends but instead only exclusive discussion of declining recent and future Northern Hemisphere snowfall level trends.
Actual snowfall recorded levels in winter (and fall as well) do not support a future of declining snowfall level trends as claimed by the AR5 report.

The world of climate alarmism supported by the main stream media have claimed that global warming is responsible for increasing recent record cold and snowfall levels.

These claims are both unsupported and contradicted by the UN IPCC AR5 WG1 report findings and conclusions which are completely silent on any connection between global warming and increasing snowfall level trends in the Northern Hemisphere.
The climate science discrepancy between the AR5 reports exclusively declining snowfall level trend findings and conclusions versus the real record 2018 and prior years increased snowfall level trends demonstrates that the science behind the UN IPCC AR5 WG1 climate models is flawed and failed.
This climate science discrepancy in fact represents two failures for the world of climate alarmism.
First – the UN IPCC AR5 WG1 report finding of exclusively declining future snowfall level trends invalidates claims by climate alarmists that global warming increases snowfall levels because there is no UN IPCC AR5 WG1 report scientific support for these flawed claims.
Second – the real world results of 2018 increased snowfall which will likely add further to increasing winter trends of Northern Hemisphere snowfall levels demonstrates that the UN IPCC AR5 WG1 findings and conclusions are flawed and failed and that climate models used to arrive at these conclusions are inadequate for determining global climate outcomes.
IF you draw the line from 1979 to 2001 it is going down. They simply extrapolated…
In that graph no serious statistician would dare draw a trend line because there is no trend.
And if you draw a line from 1981 to 2017 it is dramatically increasing.
During the “hottest years on record”…
Oh and Russia is getting pounded too.
https://www.reuters.com/article/us-russia-weather-moscow-snow/russia-calls-in-army-after-snowfall-of-the-century-in-moscow-idUSKBN1FP1ZU
Probably colluding with Trump on this.
You don’t have to be a statistician to look at the graph and see that there is no real trend. You can cherry-pick the start date and come up with any trend you want.
Parsing every word of AR5 doesn’t help either.
Is this post worth our time?
And you would want to target that part of the noise because…?
“Future widespread reductions of SCE (Snow Cover Extent), particularly in spring, are simulated by the CMIP3 models (Roesch, 2006; Brown and Mote, 2009) and confirmed by the CMIP5 ensemble (Brutel-Vuilmet et al., 2013).”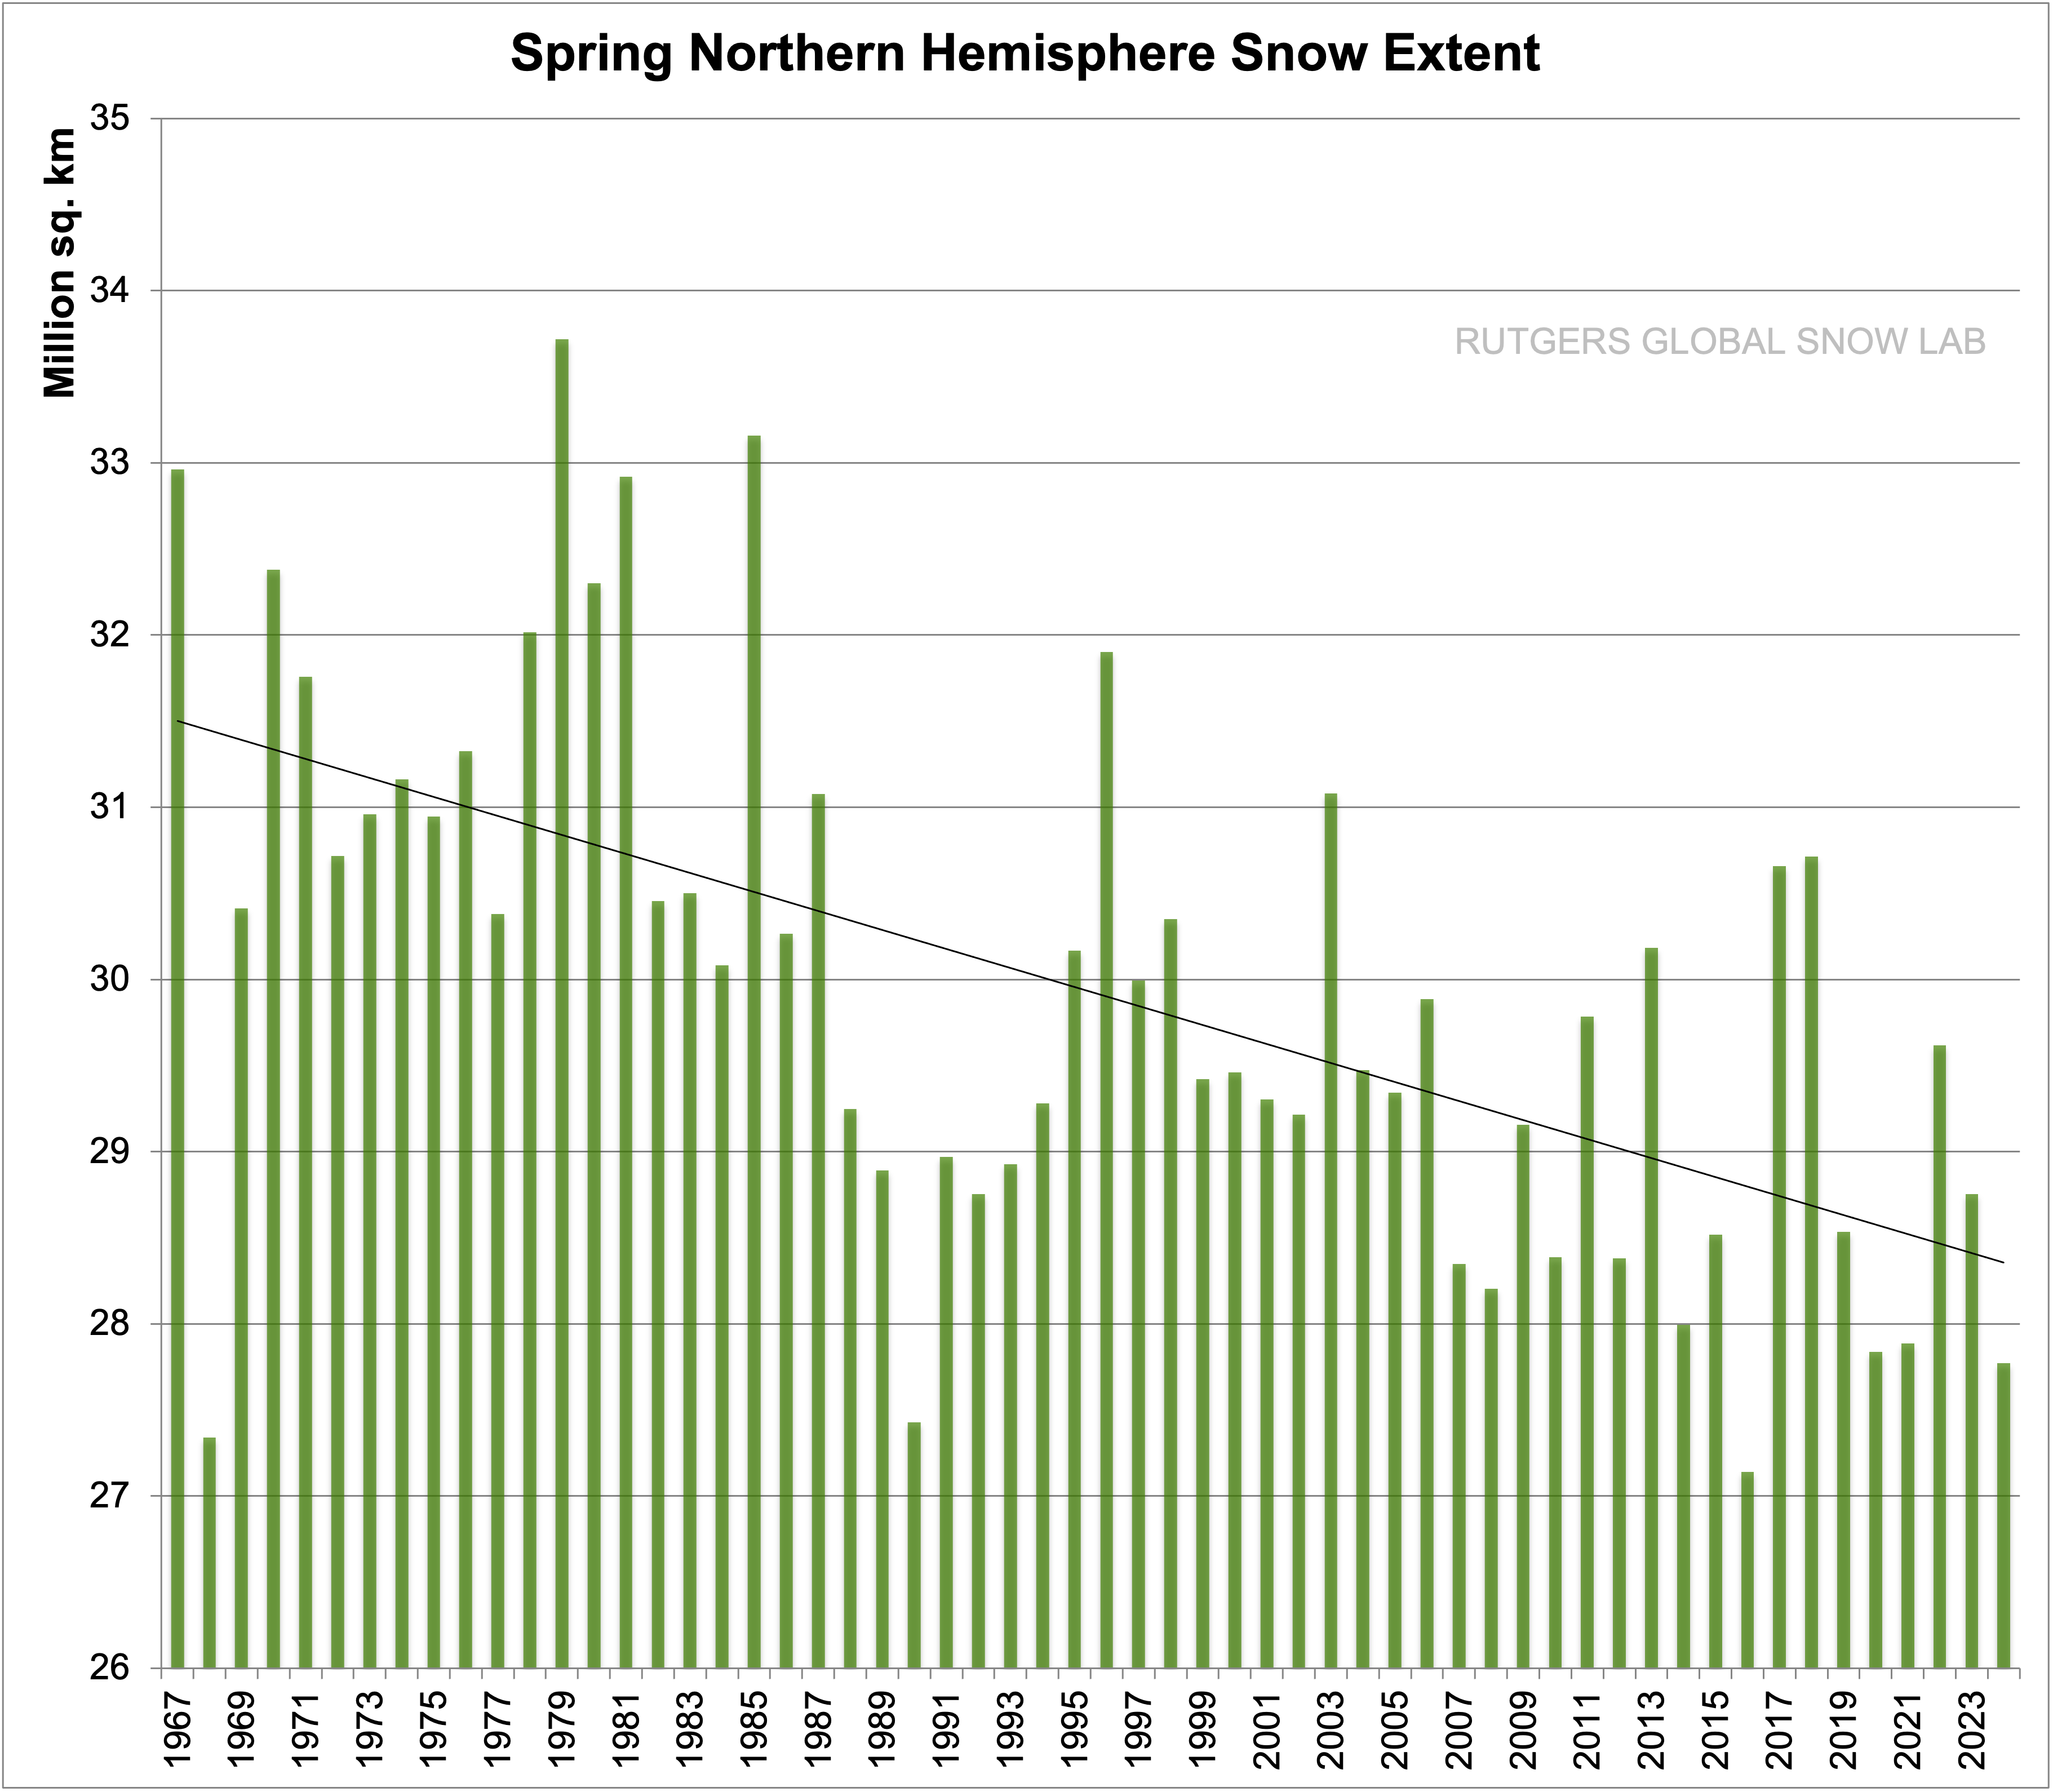
So why not show the spring coverage?
There is no trend in that graph either
The chart in the post covers the ENTIRE winter that shows an increase over all.
Colder winters, warmer springs. Perhaps they should call it Climate Displacement….!
R
“The chart in the post covers the ENTIRE winter that shows an increase over all.”
and the spring chart shows the entire spring. The winter chart shows an increase of around 1 million square km, over 50 years, the spring one shows a drop of around 3 million square km over the same period.
As the quote from the IPCC said snow cover would decline “particularly in spring”, I thought it would be more useful to see what was happening to snow cover in the spring.
The IPCC also stated there would be LESS snow and more rain/freezing rain in the wintertime:
Defying IPCC Models, U.S. Blizzard Frequency Has Nearly Quadrupled Since 1960, As U.S. Continues Cooling
“What Models Say:
♦ IPCC TAR (2001): “Milder winter temperatures will decrease heavy snowstorms“
♦ Kunkel et al., 2002: “Surface conditions favorable for heavy lake-effect snow decreased in frequency by 50% and 90% for the HadCM2 and CGCM1 [models], respectively, by the late 21st Century. This reduction was due almost entirely to … an increase in average winter air temperatures.”
♦ IPCC AR4 (2007): “Snow season length and snow depth are very likely to decrease in most of North America“
♦ Kapnick and Delworth, 2013: “In response to idealized radiative forcing changes, both models produce similar global-scale responses in which global-mean temperature and total precipitation increase while snowfall decreases. … By using a simple multivariate model, temperature is shown to drive these trends by decreasing snowfall almost everywhere” (press release) “In North America, the greatest reductions in snowfall will occur along the northeast coast, in the mountainous west, and in the Pacific Northwest. Coastal regions from Virginia to Maine … will get less than half the amount of snow currently received.”
What Observations Say:
Coleman and Schwartz, 2017
“Data revealed 713 blizzards over the 55 years, with a mean of 13 events per season. Seasonal blizzard frequency ranged from one blizzard in 1980/81 to 32 blizzards in 2007/08. Federal disaster declarations resulting from blizzards totaled 57, with more than one-half of them occurring in the twenty-first century.”
http://notrickszone.com/2017/01/19/defying-ipcc-models-u-s-blizzard-frequency-has-nearly-quadrupled-since-1960-as-u-s-continues-cooling/#sthash.cu8sJpaU.YNKwVnLd.dpbs
Spring snowfall is only around 5-10% of the total snow of the entire snow season. Winter snowfall is where most of the accumulation occurs. What you present is misleading and largely irrelevant.
The IPCC was mostly wrong and their models unreliable, which is what really matters here.
From the 2001 IPCC report:
“15.2.4.1.2.4. Ice Storms
Milder winter temperatures will decrease heavy snowstorms but could cause an increase in freezing rain if average daily temperatures fluctuate about the freezing point. It is difficult to predict where ice storms will occur and identify vulnerable populations. The ice storm of January 1998 (see Section 15.3.2.6) left 45 people dead and nearly 5 million people without heat or electricity in Ontario, Quebec, and New York (CDC, 1998; Francis and Hengeveld, 1998; Kerry et al., 1999). The storm had a huge impact on medical services and human health. Doctors’ offices were forced to close, and a large number of surgeries were cancelled (Blair, 1998; Hamilton, 1998). One urban emergency department reported 327 injuries resulting from falls in a group of 257 patients (Smith et al., 1998b).”
https://wayback.archive.org/web/20130218204735/http://www.grida.no/publications/other/ipcc_tar/?src=/climate/ipcc_tar/wg2/569.htm
IPCC clearly wrong.
If you check all data you will see that snow extent in fall and winter is increasing and in spring it is decreasing. At the end of the day the total snow extent over the fall, winter & spring period should be constant or even increase slightly. That means the total snow extent changed if anything only in the time of its appearance.
The implicit claim of a potential positive feedback by a decreasing snow cover is disapproved by reality so far.
Seems to me that the old adage is rather obvious – garbage in, garbage out! Something that IPCC has failed to observe.
“There is no discussion in the many thousands of pages of the UN IPCC AR5 WG1 report of global warming increasing snowfall level trends”
That isn’t true. This article gives a very one-sided selection of fragments from the AR5, mostly about the long term (century). In Sec 12.4.6.2 just one sentence is quoted here, but they do lay out the influences for increase (my bold, SWE is snow water equivalent, basically amount):
“Projections for the change in annual maximum SWE are more mixed. Warming decreases SWE both by reducing the fraction of precipitation that falls as snow and by increasing snowmelt, but projected increases in precipitation over much of the northern high latitudes during winter months act to increase snow amounts. Whether snow covering the ground will become thicker or thinner depends on the balance between these competing factors. Both in the CMIP3 (Räisänen, 2008) and in the CMIP5 models (Brutel-Vuilmet et al., 2013), annual maximum SWE tends to increase or only marginally decrease in the coldest regions, while annual maximum SWE decreases are strong closer to the southern limit of the seasonally snow-covered area.”
In the TS 5.5.5 they say
“Snow cover changes result from precipitation and ablation changes, which are sometimes opposite.”
But overall, the problem here is that their projections are for end century, not winter 2018.
I though we just went thru an end-of century. My bad.
Nick. Come on. You seem to be dancing with the fairies that fit on the head of a pin. In this debate perspective is king. In an interstadial peak, due to net heat evaporation that defines the peak, snow levels SHOULD go up and down as it bounces along at the peak. Zoom out. Are you saying that cars drive stadial and interstadial oceanic periods?
“snow levels SHOULD go up and down as it bounces along at the peak”
And their projection?
“Projections for the change in annual maximum SWE are more mixed.”
What do you think they have wrong?
Well it depends on if you call that junk statement a prediction, Nick.
Prediction has a number of uses but in science it is defined
https://en.wikipedia.org/wiki/Prediction
You may care to read the section regarding science prediction.
Now as climate science is not a rel science I guess you can use the statistical or layman version but in science a prediction of up and down is not a prediction at all it’s layman garbage.
wtb an “a” above mods
“in science a prediction of up and down”
It says what they know. Two competing influences. You need cold and precipitation for snow. They predict less cold but, in many places, more precipitation, and how that works out is variable. That is just how it is.
Fine but that isn’t a scientific statement, you can’t argue this.
In discussion I know your science is limited but that is the way science works there are no bets each way and mixed results are given to the null hypothesis.
I should add in science if your theory was right and you got a mixed result you should be able to constrain on of the control variables to produce a predictive result.
Essentially that is what the LHC and LIGO had to do which was create a setup to eliminate all the noise so you could get a clear positive signal.
“That isn’t true.” Nick Stokes
Of course it isn’t. There are enough weasel words in these reports that no matter what happens it is due to global warming, climate change or extreme weather or whatever it is now being called. And I might not even argue about the warming and some of its potential effects. What I will argue is that the models totally fail on predictability and the reason is that there is no proof what so ever that whatever happens is due to CO2 and more specifically man made CO2. Paleodata, in fact, indicates we might actually have been dangerously low on atmospheric CO2 relative to photosynthesis requirements and recent increases are a very positive development for life on our planet.
“Paleodata, in fact, indicates we might actually have been dangerously low on atmospheric CO2 relative to photosynthesis requirements”
Really? How do they know? Lots of plant fossils with frowns, gasping for air?
“….and recent increases are a very positive development for life on our planet” except for more many corals and shelled marine organisms, and those land areas where there is a net water loss, and …oh, nevermind. Wasted words.
Even the fossil fuel industry knew decades ago that CO2 was an enormous hazard, and that it came primarily from fossil fuels. So why can’t you believe it?
Kristi Silber, you doubt that proper scientists can look at real fossils but you just “know” for a fact what people at Exxon thought.
So you dismiss open and clear science because you don’t like it and embrace conspiracy theories and speculation. Pretty typical climate activist then.
“Really? How do they know? Lots of plant fossils with frowns, gasping for air? ”
Actually, yes (except they did gasp for air, quite the opposite, they closed their mouths). For instance http://www.geocraft.com/WVFossils/stomata.html
“Even the fossil fuel industry knew decades ago that CO2 was an enormous hazard, and that it came primarily from fossil fuels. So why can’t you believe it?”
Well, why do YOU believe this lie? Fossil fuel industry isn’t even 5% of Earth production of CO2, this is very far from “primary”. Fossil fuel industry knew since the establishment of IPCC in 1988 that CO2 was accused of being an “enormous hazard”, that’s decades indeed, but last time I checked, knowing your are accused and knowing the accusation is true was very different. Looks to me they just didn’t care, as they had to cope with REAL issue of the time: pollution (sulfur and other fumes from burning, oil spills from tankers, etc.), which they didn’t denied and agreed to cut.
Kristi, you really an Ecologist?
You didn’t know that the Rain Forest and Forests nearly died out around 20,000 years ago?
Kristi the debate is quite a bit above your head your comment shows. Fossil leaves showing the numbers of stomata can be viewed as easily as in present day plants (you can begin your education by looking up what stomata are and what they indicate).
RE Kristi:
**Even the fossil fuel industry knew decades ago that CO2 was an enormous hazard, and that it came primarily from fossil fuels. So why can’t you believe it?**
Why do you want us to believe a LIE?
CO2 is NOT a hazard, it promotes plant growth.
I know what the fossil fuel industry knew from their own original memos and reports. There are plenty on the internet – those below are from a single site. Very interesting to see how messages changed over time and according to audience and writer.
Highly relevant are the programs, methods and messages the industry used to spread propaganda to fight the influence of science on public opinion, obviously very successfully. Some memos talk about the scientists have been actively, directly involved, such as Patrick Michaels and Sherwood Idso. (Who’s not mentioned?)
1978 http://www.climatefiles.com/exxonmobil/1978-exxon-memo-on-greenhouse-effect-for-exxon-corporation-management-committee/ There are several internal memos/reports around this time and earlier, on this site and elsewhere, showing that scientists working for the oil industry knew the greenhouse effect was happening, CO2 was rising as a result of fossil fuel burning and (less so) to forest clearing, they predicted the main climate changes and said they could be dangerous, even “catastrophic,” according to one memo. They all talk about the uncertainties in the predictions and the weakness of the modeling, which was in its infancy at that point.
1983 Exxon explains it all, but tentatively, apparently not wanting to get caught confirming anything publicly. At the end reveals that Exxon supported American Petroleum Institute in their efforts to improve climate modeling.
http://www.climatefiles.com/exxonmobil/1983-mobil-memo-on-the-atmospheric-greenhouse-effect/
1991 Survey of effectiveness of test run of an ICE propaganda campaign to push the ideas that the science is too uncertain to be of use, and “directly attack proponents of global warming.” Finds a TARGET AUDIENCE.
http://www.climatefiles.com/denial-groups/ice-campaign-plan/
1991 ICE denial ad campaign
http://www.climatefiles.com/denial-groups/ice-ad-campaign/
1998 Global Science Communications Action Plan by API and others to spread the idea that climate science is uncertain. Discusses finding scientists to act as spokespeople.
http://www.climatefiles.com/denial-groups/1998-global-climate-science-communications-team-action-plan/
paqyfelyc – Based on your link, I don’t see the evidence supporting the idea that stomatal density is a good proxy for the paleoclimate CO2 record. It’s a “relatively new tool,” says the report. There are other reasons for change in stomatal density, such as water stress. I don’t dismiss the approach, I just need to look at it more.
At any rate, nothing here supports the idea that past low CO2 was “dangerously low.” What does that mean? Dangerous for what or to whom? What is the danger? It is the message of the statement I object to. If you don’t like alarmism about the future, don’t use the same emotional tactics about the past.
Pheonix44: “Kristi Silber, you doubt that proper scientists can look at real fossils ” Why do you say this? Ridiculous. Looking at a fossil, being able to read its parts, is different from assuming it tells something specific when there could be other explanations. The history of our knowledge of Earth as seen through geology is a testament to that.
Correlation is not causation.
“So you dismiss open and clear science because you don’t like it and embrace conspiracy theories and speculation. Pretty typical climate activist then.”
All you say here is wrong.
Many of you make ridiculous assumptions about me and what I think in an effort to mold your image of me to what you want to believe. Your willingness to do so is a measure of how willing you are to make comfortable assumptions in general.
Many also adopt and use the science you want to believe to confirm you ideas, regardless of its quality, and even if your decision is based not on the original publications but on some media representation of them. The science that says what you don’t want to believe is corrupt/highly uncertain/irrelevant …and dismissed even if it is of high quality. Anything in the IPCC AR5 is suspect, regardless of the level of uncertainty. The opinion of the vast majority of scientists is automatically less valuable than the opinion of the rebels. There is no problem with believing alternative ideas if based on solid evidence, but it’s the automatic, reactive nature of this decision that is a problem. Skepticism is not uniformly applied.
Gary Pearse “Kristi the debate is quite a bit above your head your comment shows. Fossil leaves showing the numbers of stomata can be viewed as easily as in present day plants (you can begin your education by looking up what stomata are and what they indicate).”
HAHAHA ! That’s a good one! I’ve taught undergrads about stomata! I’ve done research on stomata, photosynthetic and respiration rates. I collect fossils rocks and am fascinated by geology. A couple weeks ago I visited NOAA in Boulder, where my uncle is a principle scientist, and took a photo of an ice core. I spent half an hour talking to a division leader about data collection and adjustment. But this discussion is above my head? That’s funny.
You know nothing about me or my background. It helps you to think I’m ignorant. About some things I am, but you show how much your desire interferes with your reason when you claim I don’t know about stomata.
“CO2 is NOT a hazard, it promotes plant growth.”
This is like saying, traffic is not a hazard because cars get us where we want to be.
This dramatically oversimplifies the whole picture to the point where you can see nothing.
I’ve never read about this, and my freshwater ecology is not good, but imagine the CO2 “fertilization” acts like N fert in ponds. There is a huge flush of growth of algae in the spring and early summer, clogging the whole surface. Population collapses for lack of dissolved CO2, the O2 dives as they decompose, and that makes the fish die. This is just one little example of potential unforeseen effects, imagined but plausible (I don’t have time to look through the literature to find out if there’s evidence). One effect that has been demonstrated is that plant tissue, though greater when grown in high CO2, tends to have less N, and that means less protein, which will have its own web of effects. Then there are interactions with water use, and climate effects…
Our living world is highly complex, with countless interactions. It’s fascinating and challenging, and I love to learn about it, and see not just the big picture but the tiny components that contribute to it.
Third assessment report said that milder winters will decrease heavy snowstorms
https://wayback.archive.org/web/20130218204735/http://www.grida.no/publications/other/ipcc_tar/?src=/climate/ipcc_tar/wg2/569.htm
Got to hand it to you Nick. You are dedicated to your cause.
“But overall, the problem here is that their projections are for end century, not winter 2018.”
This reminds me of the sea level rise story. Sure, it doesn’t seem to be happening as the Gang predicted but just you wait, any minute now, we’ll hit The Tipping Point and Manhattan will be flooded in no time.
Crying Climate Wolf has consequences and when these wolves consistently turn out to be toothless poodles it just doesn’t work anymore. And when your side loses the fear factor you have nothing left except a mob of low-info useful idiots wearing pink climate hats and screaming at the sky.
But maybe I have missed something. Have ANY of the dire predictions actually come close to coming true?
What exactly have we got from this gigantic ‘investment’ in the IPCC’s Lysenkoistic search for the CO2 bullet? Or will this be answered any minute now, just you wait, bla bla bla…
Nick says, **But overall, the problem here is that their projections are for end century, not winter 2018.**
Where does it say “end century”? or did you make it up?
Maybe you can also explain Gore’s comment, **Bitter cold is exactly what we should expect from climate crisis**, in view of Dr. Viner’s prediction that children will not know what snow is.
“Where does it say “end century”?”
In bold, in the article
“It is very likely that NH snow cover will reduce as global temperatures rise over the coming century”
But in make places, eg 12.4.6
“It is thus very likely (high confidence) that by the end of the 21st century,
NH spring snow cover extent will be substantially lower than today”
“It is very likely that NH snow cover will reduce as global temperatures rise over the coming century”
But in make places, eg 12.4.6
“It is thus very likely (high confidence) that by the end of the 21st century,
NH spring snow cover extent will be substantially lower than today”
Those are two different predictions!! The first said that snow cover will trend downward over the century.
The second says BY the end of the 21st century, the difference will be significant.
For the first half to be correct, snow cover should be trending downward NOW. The second half can be correct if snow covers remain relatively constant, with a sudden drastic drop at the end of the century.
Thanks for the heads-up Nick.
If I was a policy maker, I might have been mislead by the technical summary for policymakers!
The forward lead me astray from the start:
Now I see only errors rather than any deliberate deception on the part of the authors!
Thanks to your advise, I can now just ignore the section on detection and attribution of climate change:
Thank goodness, you are here to help me read between the lines.
It is surprising to see just how misinformed the uninformed* might be after reading this document!!
*The non-technical i.e. Policymakers!
**Somehow, high latitudes, NH, Spring, last and next centuries all got lost in translation 😉
“you are here to help me read between the lines”
No, I just quoted what the lines say.
SWB: It’s true that the summary for policymakers many issues of AR5 are shortened pictured and tend to be more alarmistic than i.e. the documents of WG1. In your citiation they don’t mention any time span therefore I would look at the annual averages of NH snowcover. And there one sees no significant trend for 1967…2017. That’s the truth for the snowcover ( it’s extent) but for Ice there is a very significant trend.
==>frankclimate
The second quote should have had my bold added:
I don’t believe sarcasm and satire are necessarily the same thing, perhaps I should have employed a “/wit ” tag also! 😉
SWB: It’s IMO quite right: Over the whole timspan (1967…2017) there is no significant reduction of snow ( annual means), only of ice.
IPCC reports are truly like the Bible. You can find support for any position if you only look hard enough.
Ap;pears to having a bet both ways and any other ways that may eventuate.
“Whether snow covering the ground will become thicker or thinner depends on the balance between these competing factors.”
NICK In other words the report should have said WE DONT KNOW WHAT WILL HAPPEN. WE DONT KNOW WHAT WILL HAPPEN NEXT WEEK WE DONT KNOW WHAT WILL HAPPEN NEXT MONTH WE DONT KNOW WHAT WILL HAPPEN NEXT DECADE and we certainly dont know what will happen a century from now. To put it in a phrase that a child will understand. We dont have a clue as to how CO2 affects snowfall.
Amen.
Bet being hedged.
N.B.
Nick, again, misrepresents actual statements into supporting Nick’s claims.
• “Warming decreases SWE both by reducing the fraction of precipitation that falls as snow and by increasing snowmelt”
Even with vague assertions that is a clear statement precipitation and snow will decline.
Except…
• “but projected increases in precipitation over much of the northern high latitudes during winter months act to increase snow amounts”
Well, that is quite explicit, almost.
Northern, not Southern high latitudes.
“High Latitudes”; also known as Alaska, Boreal Canada, Northern Russia, Norway, Finland and Polar areas.
But does not include Southern Polar or “high Latitudes”
That snow in British Columbia? Northern USA states, Europe, Russia, Sahara, etc. It’s not officially there, according to Nick’s logic. Those are not “high latitude” locations and therefore will have decreased SWE (snow water equivalent).
“Both in the CMIP3 (Räisänen, 2008) and in the CMIP5 models (Brutel-Vuilmet et al., 2013), annual maximum SWE tends to increase or only marginally decrease in the coldest regions, while annual maximum SWE decreases are strong closer to the southern limit of the seasonally snow-covered area.””
They are saying that models predict reduced SWE overall. Your ‘bolding’ is misleading.
If you believe any model predicts reliably out to 2100, you are a fool.
How does a brief discussion of a ambiguous possibility at the end of the century invalidate the piece above?
To say the pice is “one-sided” because of what you quote is frankly bizarre.
“How does a brief discussion of a ambiguous possibility at the end of the century invalidate the piece above?”
Because the piece is based on a claim that the snowfall in winter 2018 (NH) shows that the IPCC made a false prediction. It starts:
“The record snowfalls of 2018 that are sweeping across the Northern Hemisphere and continuing the growth trend in winter snowfall levels provide yet more compelling evidence that the UN IPCC AR5 WG1 climate report and models are flawed because this report concludes that future snowfall level trends will only decline.”
But what it quotes the IPCC saying are long term forecasts, on an end of century scale. There is no prediction inconsistent with snow in 2018. And the discussion of complexity of higher precipitation vs higher ablation (from warming) is omitted.
Nick says:
**But what it quotes the IPCC saying are long term forecasts, on an end of century scale. There is no prediction inconsistent with snow in 2018. **
So anything can happen in 2018. the prediction is not wrong because the snow will suddenly end at the end of the century. Similar to Gore telling us that warming causes the cold (to which Nick has not responded)
we know the drill nick. co2 causes warming and cooling, more snow and less snow, more rain and less rain,more hurricanes and less hurricanes, etc,etc ad infinitum.
Nick
THERE IT IS AGAIN!
I am confused again, one article you are saying warm means less snow the next you are saying it means more.
Now I will wait for the inevitable BS stream defending both arguments and how you are actually not stating either.
Wow! With all those incorrect & internally inconsistent statements in the UN IPCC AR5 WG1(or whatever whizzy name it’s called), it looks like the consolidated expense reports for bureaucrats from an unaccountable global organization involuntarily funded by taxpayers: fabulously overstated, probably not spent on what was claimed, could never be reproduced, and funding was derived by less than honest methods…AND NOBODY REALLY BELIEVES IT.
re snow/no-snow: probably better to just look outside in winter if you live in the northern USA.
Your last graph, showing the total extent of northern hemisphere winter snow says much about the deviousness of the alarmists at the IPCC. They claim to be incredibly worried about everything, yet the normal range of snow cover in the last 50 years varies from 43,000,000 sq kms to 46,000,000 sq kms. That is an extent which varies by an average of 6.6% from year to year. And the extremes in 5 decades are a low of 41,000,000 sq kms & a high of 48,500,000 sq kms. To me that appears to be a pretty stable situation, and nothing to be concerned about.
Of course, if you own a ski resort near the fringes of the snow belt, you have a lot riding on the snowfall each winter. Here in Australia, every autumn there is much media pontificating about the chances of a good snow season, which is understandable when our highest snowfields are at less than 2200 metres altitude, & 37 degrees of latitude.
Ray, seems that your bureau would do snow extent…this is all I could find
http://www.warwickhughes.com/agri/snowdepth.jpg
Uh huh, an ok year after 15 crap years. Well spotted.
” if you own a ski resort near the fringes of the snow belt”
..its time to consider your options.
http://gergs.net/wp-content/uploads/2014/06/Spencers_peak_trend_extrapolated_band_2.png
(mcleod, what’s with the zazove?)…
That isn’t a statistically valid depiction of the error band. The errors get larger (much larger, think the end of a trumpet) the further into the future you go. After ~20 years, the error band would exceed the boundaries of the graph.
Rudi Zazove? I was being hounded by a certain commentator.
Thats a good point Hivemind. I don’t know if polynomial trends are of much use either. Maybe Snowy Hydro have an axe to grind.
Interpolation within a data set is usually safe. Extrapolation, on the other hand, should almost always be avoided. There are all kinds of examples of the hazards of extrapolation. another example
For sure the error bars increase. Imagining that they decrease is just plain stupid.
You know, i haven’t seen andy around in quite a while…
(you know, i haven’t seen andy ’round in quite a while)…
oops…
Snowy Hydro’s 2017 Peak for Spencer’s Creek was 240.9 cm which is already north of the 1 sigma band only 5 years in.
Data is here:
http://www.snowyhydro.com.au/our-energy/water/inflows/snow-depths-calculator/
When will warmists stop assuming EVERYTHING goes to zero in 2100? Its so creepy, its cultish.
What the graph really shows is “science” goes to zero in 2100, because by then there is zero science left in the curve.
Ha, ha, ha, ha, ad infinitude. There will be no snow in the mountains by 2100!
Why would you care about peak snow depth? I would want a skiable depth for as long as possible. A moving average of peaks is very misleading. A F1 car can have rising average peak speeds each lap and be easily beaten by one that has declining peak speeds.
@zazove
” if you own a ski resort near the fringes of the snow belt”..its time to consider your options.
Your option are: continue depending on the weather. Weather, not climate. Or start snow-making, so you can open as soon as possible and close as late as possible, and even offer skiing under the sun, which so much more fun than skiing in a blizzard.
Choice similar to XIX century millers, who could continue to depend on wind, or invest in steam machine grinder and work when and where most convenient. Easy choice.
That said, I like your graph. This is proper prediction, and pretty fast to test, so we can know if the theory is solid. Actually, as pointed out above, the theory already failed the test. theory —–> Trash bin.
Thank you for playing.
Obviously, all trends will continue indefinitely into the future.
Unless they don’t.
So quick to dismiss, but you and UNGN should probably have had a closer look at the graph given that last season – well, lets call it an ok season – was the first after 15 crap years. Whats more the moving average doesn’t look like its going north anytime soon.
“So creepy, its cultish.” wtf.
“So creepy, its cultish.” wtf.
Science didn’t make the curve go to Zero in 2100. Only a warmist cult could interpret the curve trend is a “second order polynomial”
wtf indeed.
15 years, one half of an AMO cycle, one quarter a PDO cycle.
Call me when we have a full cycle of data.
Mark W
“Obviously, all trends will continue indefinitely into the future.
Unless they don’t”
one quibble “Until they don’t” is more to the point.
Guest authors — please list citations (meaning URLs) for your sources.
Even with Google search it’s not easy to track down the sources of graphs.
For snow cover I found this page but it shows snow cover extent and only by month.
https://www.ncdc.noaa.gov/snow-and-ice/extent/snow-cover/nhland/11
Kids won’t know what snow is soon because of climate change….except when it snows an awful lot…then it’s because of climate change.
The AR5 WG1 report concludes in the Executive Summary of Chapter 12 Long-term Climate Change the following major finding regarding the relationship between global warming and snowfall level trends in the Northern Hemisphere: “It is very likely that NH snow cover will reduce as global temperatures rise over the coming century”
…and now, since snowfall is increasing…
“The world of climate alarmism supported by the main stream media have claimed that global warming is responsible for increasing recent record cold and snowfall levels.”
THIS IS PERHAPS THE HUNDREDTH FAILED PREDICTION BY GLOBAL WARMING ALARMISTS TO BE “SWEPT UNDER THE RUG” BY THE MAINSTREAM MEDIA.
It has been obvious since 1985 and much earlier, based on the Earth Sciences and the history of Earth’s climate, that catastrophic manmade global warming is a false alarm. Since then, the global warming alarmists have consistently failed in their predictive track record. They haven’t got anything right – not one of their many scary predictions has materialized.
The warmists have countered by shifting the goalposts – changing their stories, falsifying data, and feeding their ever-more-fantastic excuses to a media eager for scary stories to sell their worthless content.
At this time, global warming alarmists have no excuses left, and you have to be a complete imbecile to believe anything published by the IPCC and its minions about global warming, wilder weather, etc.
Some people just need to be scared of something, no matter how improbable, and these poor scared souls are grist for the fraudsters of global warming alarmism. It would be so much better for these frightened neurotic souls to focus their night-terrors on the emotional struggles of their favorite Hollywood personalities – maybe the Kardashians can start a new drama series just for them.
If they need to be scared of something then they need to watch ghost chasers or something. Plenty of harmless fiction to scare themselves that does no damage to others.
http://www1.pictures.zimbio.com/mp/Srg_50Sj94EI.jpg
Yah but the problem is that the world has spent over a Trillion $ trying to combat a bogeyman (with guns to every taxpayers (individuals and corporations) heads) to pay for it all and the spending is accelerating. Before this hoax is finished we will all be bankrupt.
The nails are being driven into the coffin of the global warming scam slowly but surely will be buried .
There is absolutely no proof that CO2 controls the earths temperature .
A questionable 97% % of whom agree that it has been proven .
No proof has been put forward to unequivocally prove that the warming that has occurred has not been caused by natural cycles and no proof has been put forward to explain that the Medieval Warm Period that was warmer than present .
The history of the world cannot be ignored or explained away that it never happened .The records exist over much of the world .Greenland China and the Pacific area that the MWP was warmer than now .If these people deny these facts they deny history .
The warmists make no realistic attempt to explain Ice ages the last one retreating 10 to 12000 years ago .What triggered the warming to melt the ice sheet that covered a large area of Europe and North America it certainly was not CO2 .
Just because the temperature has risen a little in the last 40 years at the same time that CO2 has risen proves nothing .
We will await for more nails to be forged and driven home and forever bury this nonsense.
The free world population will not accept a world without abundant cheap energy and governments pursuing policies to force the price of energy to sky rocket will have trouble on their hands .
Wonder what the southern hemisphere looks like….not much land there…but South Africa had record snow
Lat, temps in the southern hemisphere are dropping like a stone. The only question is whether or not northern temps will join them as has happened so often in the past. It’s crunch time for agw theory. (i think, or rather hope, that we learn a thing or two this year)…
Sadly, man-killing cold is the only thing that will reverse the man-killing, anti-human socialistic (SJW) “sustainability” policies.
there is a southerly wind blowing at the moment on the east coast of scotland. normally in winter you can feel the temp rise here when the wind is southerly. just now it is snowing .
Latitude
Technically, the three ice regions down south (Antarctic land ice, Antarctic fixed ice shelves, and Antarctic sea ice around the first two) total more area at sea ice maximum in Sept than all other land area south of the equator. Put together.
But the stunning comparision is, if the last Ice Age were inverted somehow – where Northern Hemisphere glaciers covered Chicago at latitude 44 north with 3000 feet of permanent ice and then continued even further than that into the Great Plains – a glacier moving north from Antarctica (if it could somehow get over the Southern Ocean) would still be very far south of Cape Town at latitude 33 south at the furthest tip of Africa! Chile and small parts of Argentina would get covered, but’s that about all. Sydney is also at 33 south – Australia would stay clear of glaciers as well.
Right now, Antarctic sea ice is nearing its annual minimum, lower for a change from the long-term average sea ice extents. Antarctic sea ice set all-time satellite era records in 2013, 2014, and again for certain days in 2015. (Depending on which day of year you want to look at.) Second half 2015 was much lower, and all of 2016 was much lower overall – the cause of the warmer El Nino waters further north up by Peru?
Quickly eyeballing any data like that, for something that annually decreases by ~90% from winter to summer, I don’t see anything to write home about if one year it decreases by an extra ~5% either way. And, just like it’s Northern relation, it comes back again in the winter.
Only global-warmers et al seem to think that it somehow merits extensive comment and hand-wringing.
One might just as well worry about which day of the year the last dead leaves fall off a tree.
I can well agree with you: Then wonder at the effectiveness AND PURPOSE of the people who prepare, write up, and publicize the propaganda of “an iceberg the size of Manhattan/Delaware/Rhode Island/Guernsey/Ireland (just kidding) has broken off of the “stuvwxyz glacier” and threatens global sea level rise and catastrophic global warming!” …
See, Antarctica alone has “lost” an ice area the size of Greenland.
And then the “lost ice” came back. The sea ice anomaly returned to its previous values.
Several times.
In spans of less than 2 years. Most recently 2014-2015-2016-2017.
And nothing has happened.
The Arctic sea ice recovered – and lost! – sea ice anomalies equal in area to half of Greenland in less than six months. Now, we did witness the 2016 El Nino event off of Peru months after the most recent loss of Antarctic sea ice in July-August 2015. Related? Maybe, maybe not. Today’s arctic sea ice very low, certainly well below its assumed “average” normal value of 1981-2010. But it is not substantially below the more recent (more appropriate ?) 2001-2010 average. Are we at the bottom of the 66-70 year AMO cycle that max’ed out in 1979-83 when the satellite era began?
Is that supposed to mean something scary? Which makes the claim quite absurd!?
Someone pretends a word “average” has any meaning at all for an extremely short time period.
Why not just use a period of a couple of years, then your “average” can really look impressive. not!
Few words are as useless as “average”, when used improperly.
Just because humans have a few years of measurements, does not mean humans know what “average” means regarding those measurements.
Good points. But you do have to start somewhere when “new information sources” – the satellites – were launched and we actually could “measure” the Arctic Ocean. We’re better now, but even so, they do fail = The Cryosphere daily reports at Univ of Illinois went off-line completely. Then the next lab (NSIDC) released their calculations from their data, and we were suddenly missing 1.5 million sq kilometers of Antarctic sea ice. This is the size of the Antarctic ice shelves, which could be the source of the “correction”.
Regardless, if you only have 1/2 of what “might be” decades-long cyclical variations of sea ice, you DO HAVE “an average”, and you DO HAVE enough information to KNOW you have annual variations of sea ice extent.
Fine. But you DON’T HAVE any more information that that. You DON’T HAVE anything more than 2018 – 1979 years of sea ice extent. We do know absolutely that each decade’s daily sea ice average values ARE going down: highest “ever” is the first 1981-1990, then 1991-2000, then 2001-2010. The three different “average daily sea ice extents” don’t even cross each other!
But, when you look at all 38 years of Arctic sea ice anomalies (the difference between any given day’s measured sea ice extents and the average sea ice extents for that day), the anomalies started “high” at +1.3 Mkm^2, declined significantly to today’s -1.3 to -1.5 Mkm^2, and then steadied at that point. Exactly what you would expect if a longer 66 to 76 year cycle were present.
Bradley, what don’t you get about the word had?
(then what’s your beef?)
@ Latitude….like this, …https://earth.nullschool.net/#current/ocean/primary/waves/overlay=sea_surface_temp/orthographic=114.45,-86.72,672/loc=0.874,-49.682
This is my new daily spot to save. I want to watch how the sea surface temps change over the next several years.
Really neat view of Antartica waters. What temperature ranges do the colors represent?
Which still does not mean Earth.nullschool.net is accurate.
Some data is accurate and near real-time.
Some data is accurate to some time-frame; hourly, daily, weekly…
Some data is still modeled.
A great resource and even entertaining. It is not a direct factual representation of Earth and Earth’s atmosphere.
Earth.nullschool.net is improving constantly.
Wind & temp is a better view:
https://earth.nullschool.net/#current/wind/surface/level/overlay=temp/orthographic=130.20,-47.59,1159/loc=0.874,-49.682
I’m in Tasmania, it is cold windy and snowing in the highlands (Again) this summer! 😉
I have a similar wind/temp spot which I have used for around 3 years. I wish that I had started the sst spot a bit earlier to monitor the changes.
@ Alan T…note the spot marked which sits at a temperature boundary zone. Click anywhere to get a temp. I see the spread of cold waters moving northward as a consequence of the rapid record sea ice extent increase which was followed by the rapid decrease in the sea ice extent. That has led to a cooling in the southern oceans which is starting to make itself felt further north than normal with the aid of surface wind changes, imo.
Rob, you said, “FYI, It is “summer” in South Africa right now”.
That would have made sense if Lat had said, “South Africa has record snow” instead of “had record snow”, but he didn’t, so you look like a clown.
We are LOL, but not at Latitude.
When – and where.
I don’t recall any unusual reports of snow in South Africa last winter
This is a powerful piece, notwithstanding stokes’ objections to it. Politically it’s a sucker punch to al gores gut. Perception is everything, folks. (the children just won’t know what snow is)…
The IPCC reports do seem to faithfully represent the climate science literature in one respect: If you look, you can indeed find views predictions/projections that contradict each other. But essentially only one side of the argument will be selected for presentation to policy-makers and the wider world. That’s the only bit that gets read by the wider media, if they read any of it at all. Most of them just copy each other or publish the opinions that Greenpeace sends to them.
Thus the general concept of the possibility of snow increasing, not decreasing, will always be buried in the small print. For obvious reasons, it does not sit comfortably with “global warming” in the minds of most people, and is therefore not wanted in the summary for policy-makers, which is the predetermined end result.
Some of the authors are certainly experienced enough in the dark arts of bureaucracy to leave room for them to claim
+ heaps Michael 🙂
The graph of NH Winter Snow Extent shows what is wrong with using statistically determined “trends” to prove some point or other.
What the graph indicates is that snow extent is reliably between 44 and 48 % — a rather narrow range, and that there are occasional exceptions, higher and lower. In other words, there is a range of normal snow extent — and there are outlier years, above and below.
The “trend line” attempting to show a “rising trend” — which is in fact less than 1% point over a 50 year period, is of no significance.
What we can say for sure is that there has been no “disappearance” of snow and no sign of “winter going away”. Your grandkids, and mine, will still have the joy of snow.
This reinforces my opinion that global warming/climate change/whatever is not a scientific theory, it is a belief system strong enough to be called a religion (Oh Holy Al Gore and Blessed Saint Suzuki, be with us now and in our hour of need). Whatever happens, the true believers must find a way of relating it to their theory, on which they have staked so much intellectual and spiritual capital. No matter whether there are heat waves or cold spells, droughts or floods, white or green Christmases, the true believers know, they just know in their innermost beings, that it’s all due to man’s wickedness. Repent ye O my brethren (and sistren, of course).
We appear to have regressed to an earlier age when thunderstorms were considered as evidence that the gods were angry and virgins were sacrificed to ensure a good harvest. Rational thought is lost to the true climate change believers. But then they never had much of that to begin with.
I finally realized that it is a religion (for the record I am an atheist ) when I had a talk with a local PhD in physics. I have had many talks with him including both our beliefs that Dark Matter and Dark energy are a hoax. But one day when I brought up the subject of AGW, was the 1st time that I saw him really get agitated when I expressed doubt about AGW. He kept repeating “The data is there. It is real. ” I saw it was useless to have an honest conversation with him about it. I really think now that religion makes you dumber
His reaction to a differing belief reminds me of many atheists that I know.
MarkW
I agree most atheist are every bit as irrational about their belief system as any religion, i count myself as an agnostic, I am not arrogant enough to believe i know the truth of something that is unknowable, faith is just that it is not knowledge it is belief and so is non-faith. Hence the reason it is so important for all to be tolerant of each other beliefs and not expect others to live by yours.
No problem, the US media simply will concentrate on the current (La Nina driven) minimal Rocky Mtn and California Sierra Nevada Mtns. The California neo-Marxists were put out last year when reality forced Moonbeam to cancel all the drought declarations. They are chomping at the bit to put them back on to enable punitive measures and higher rates.
After a series of articles in the past year that talked about the “problems” on the Great Lakes due to the lack of winter ice and dropping lake levels we, (the collective citizens of Northern Michigan), had:
1) An end to the summer with all the upper lakes at least a foot above their long term levels
2) Had massive early problems due to ice in the St Marys River, and getting the last freighters out of Superior and into the lower lakes, causing the Coast Guard many headaches and one broken cutter
2) Had 100 inches of snow in the Northern L.P. by January 10
3) Had the coldest contiguous 7-day period in history out on the Leelanau in early January
4) My favorite, had an early shut-down to lake effect events since Northern Lake Michigan is rather solid these days, see the link on the reference pages
And we snowbirds enjoy it all even more from our perch overlooking the Gulf at this time of year. Although, nothing better than Petoskey or Harbor Springs in August. 🙂
mark, this just goes to show how remarkable anthropogenic co2 induced warming really is 😉
The UN General Secretary Telephones The President of The United States Of America: Vie have been watching [snicker snicker] Your … NOAA … Vor Quite Zum Time … [Snicker Snicker].
Zit Ist Now Apparent! Zou mush … Annihilate Zor … NOAA humans … zor Else ZU WILL BE ANNIHILATED LIKE ZOR SUN … AHHH … Zo … Beautiful zu agree ya!
Ha ha
Hello from Winnipeg, Manitoba, north of 49.
Our snow arrived early this season, mid October, but has had difficulty adding to itself. I haven’t even used my snowblower. If this is record snowfall, it is record low.
The IPCC claims of less snow was based on a warmer but wetter scenario. Simply put, more rain in winter means less snow, thus less springtime and a snow pack to keep rivers flowing into the summer.
What we have this year in Western US is simply cold and dry. The cold is fairly average, but the dry is likely the La Nina driven pressure pattern steering systems to the NW Pacific, that is Washington state and B.C.
We could use some of that extra snow here in Utah….
They took most of it up in the north. From the very first rains in the fall almost all of the storm tracks took aim towards Washington State/Vancouver Island. November was an exception where half of the storm tracks moved further south and struck the San Francisco/Bay Area region, mainly. After that the storms tracked north once again.
You can buy it by the pallet from a shop in Norway:
https://www.nrk.no/ho/_-det-er-som-a-selge-sand-i-sahara-1.13914251
Or self collect from most other places here: https://www.yr.no/observasjonar/sn%c3%b8lista.html?spr=eng
😉
I’m also in Utah, the Salt Lake City area, 41 N latitude. We had one snowstorm on Christmas, another in mid-January, but most of the winter so far has been dry and mild, and the mountains are bare up to about 7,000 feet. It’s nice to drive to and from work on dry roads, but we could use some snow in the mountains to have water during the hot, dry summer.
It seems like the jet stream has been running down the Bitterroots (between Idaho and Montana) and eastern Rockies, then across Kansas to Virginia, most of the winter. South and west of the jet stream has been mild and dry, north and east has been cold and snowy.
Winter weather depends mostly on the path of the jet stream, which can change drastically from one winter to the next, or even one week to the next. A few extra ppm of CO2 in the air doesn’t affect much of anything.
The UN IPCC (TM) theme song; Oh Susanna.
Sun so hot I froze to death …
Mark
NOAA Great Lakes Ice cover for today is 63.2%. The same date in 2017 it was 13.5%. In 2016 it was 12.2%.
The site only reports these years.
Bob
2015 was like near 100% except for Lake Ontario IIRC.
Lake Ontario has a deep part in its eastern end. Only rarely fully becomes ice covered.
And winter 2019 (next year) the pattern is for the GL Ice maximum extent to hit at least 80%.
Regarding Nick Stokes’ comment:
“But overall, the problem here is that their projections are for end century, not winter 2018.”
I would have used slightly different words, but in general, Nick is correct.
The problem is that various people (Gore, Viner, Hansen, Schmidt, Wadhams, many more including the recent POTUS) did not grasp this idea either. Note, there is also the organization with 350 in its name. Is that an important number? Should the guy in charge change it, or was it a so called tipping point?
Perhaps the confusion is because the authors of AR5 were somewhat vague (I’m not sure if a particular date is stated). I did not expect the things mentioned by the above people to be happening NOW. Perhaps, after 2075.
And there’s the rub: It is difficult to get people worked up regarding something not expected to be noticeable now, soon, or maybe never.
350 was not a very well thought-out marketing gimmick.
666 would have been more apropos for that organization.
The date for the apocalypse, and the urgency for action, appears to vary depending on the date of the next big climate summit. Doom was on the doorstep leading up to Copenhagen – saved by Climategate! – and again for the Paris round, with smaller surges of promised horror leading up to the smaller parties. Things could look very, very bad again now that a cash drought appears to be starting.
I think Gore et al understand this cycle very well.
And your reasons for supposing what anyone projects for end century climatic conditions are likely to be correct are?
No problem , remember this is ‘heads you lose tails I win ‘ land , which all things are proof and nothing disproof . So more snow, less snow the same snow all proof of climate ‘doom ‘
Its is BS of course , but then this is climate ‘science’ with no need for honest or hard work , let alone good scientific practice seen as essential in other areas.
Rule one of climate ‘science’ , when the models and reality differ in value , it is always realty which is wrong .
Wouldn’t the increases in water vapor required to drive global warming result in increasing snow; at least until the snow precipitation changed to water at some later warming level. Shouldn’t the warmists be trumpeting this as positive news for their paradigm?
Is this about global climate or just North American weather? NA is a small part of global climate, not even significant on its own. We have next to no snow in UK as usual. France is full of water. Moscow got a serious dump after some non-extreme winters. However. Russians like to suffer so that was OK, the gas and oil are still flowing and Europe needs a lot more to keep warm, so Putin’s rolling in Roubles. It’s all about the money. The more Europe relies on renewables, the more Russian gas they will need. Stupid is as stupid does AKA Merkel’s physics denying energiewende.
So, in all this discussion about predictions, has anyone started a betting pool at the off track betting spots, or whatever it is they do in the UK?
I’m willing to bet that, based on winters past, next winter will be even more snowier than this one, and several that follow after that, and then we’ll have another warm, mild winter just like 2016-2017, so I’d probably win lotsa cash on that bet. These prognaosticators? Not so much.
I’m using recorded info and they’re using computer models. Who do you think would win those bets?
I like to use a betting strategy of antiphase with the Goracle and all Professors and academics bold enough to make press statements on such things. Heap powerful juju 😉
Do these models ever get anything right?
The charts really don’t matter when either outcome (more or less) is said to be caused by climate change.
Could the slightly reduced level of sea ice in the arctic have anything to do with this?
From the 2010 Winter Olympics, another Suzuki failed prediction.
—————————–
Climate change blamed for Olympic snow shortage
Winter snow season has been slowly shrinkng in past 50 years, says researcher
https://web.archive.org/web/20100131034727/http://www.cbc.ca/canada/british-columbia/story/2010/01/28/bc-olympics-climate-change.html