People send me stuff. Today in my inbox, WUWT regular Michael Palmer sends this note:
My wife Shenhui Lang found and translated an interesting article from 1973 that attempts the reconstruction of a climate record for China through several millennia (see attached). The author is long dead (he died in 1974), and “China Daily” is now the name of an English language newspaper established only in 1981. I think it would be very difficult to even locate anyone holding the rights to the original, and very unlikely for anyone to take [copyright] issue with the publication of the English translation.
The paper is interesting in that it shows a correlation between height of the Norwegian snow line and temperature in China for the last 5000 years.
A Preliminary Study on the Climatic Fluctuation during the last 5000 years in China
Zhu Kezhen
Published in China Daily, June 19th, 1973 / translated by Shenhui Lang, PhD
Chairman Mao taught us that “In the fields of the struggle for production and scientific experiment, mankind makes constant progress and nature undergoes constant change, they never remain at the same level. Therefore, man has constantly to sum up experience and go on discovering, inventing, creating and advancing. Ideas of stagnation, pessimism, inertia and complacency are all wrong. They are wrong because they agree neither with the historical facts of social development over the past million years, nor with the historical facts of nature so far known to us (i.e., nature as revealed in the history of celestial bodies, the earth, life, and other natural phenomena).” Some believe that there was no climate change in the human history. This idealistic type of argument has been proven wrong based on the Chinese historical records.
There are abundant records of meteorology and phenology in the Chinese historical documents, which unfortunately are scattered. This article is a preliminary analysis of the climate change based on the available historical records, hoping to draw an outline of the major trend of climate change in the past 5000 years in china.
In the monsoon area of East Asia, the annual rainfall often varies greatly. However, the temperature during winter and spring can have a direct effect on the growth of the crops. The winter temperature in China is mainly controlled by the Siberia cold front, therefore, the rise and fall in winter temperature are usually consistent across China. In this article, the winter temperature is used as an indicator to analyze the climatic change. The 5000-year span has been divided into four periods according to the nature of the available sources.
1. Archaeological Period (3000 to 1100 B.C) without written records except scripts on oracle bones.
The remains of subtropical and tropical animals such as Asian water buffalo (Bubalus bubalis) and Chinese bamboo rats (Rhizomys sinensis) were found at Banpo Village of Yangshao Culture (carbon-14 dating 6080 to 5600 BC) near Xi’an, Shaanxi and Yinxu (Ruins of Yin, 1400 to 1100 BC), Anyang, Henan. There are no such animals living in these areas anymore now. According to the oracle bone records from the Yin Dynasty (1600 to 1046 BC), the sowing time of rice was about one month earlier than the current sowing time. A piece of charred bamboo stem was found at an archaeological site of the late Neolithic Longshan Culture (3000 to 1900 BC), Licheng, Shandong. The outer appearances of some pieces of pottery seem to have a pattern of bamboo stem. These two findings indicate that bamboo was distributed from the Yellow River valley area to the east coast of China in the late Neolithic Age. Based on this evidence, we can speculate that the northern limit of bamboo distribution has moved by 1° to 3° latitude towards the south during the last 5000 years. By comparing the temperatures of the lower reaches of Yellow River and Yangtze River, it is safe to believe that the period from the Yangshao Culture to the Yin Dynasty (3000 to 1100 BC) was a warm period. The annual average temperature was about 2°C above the current temperature. The average temperature in January was about 3 – 5°C higher than now.
2. Phenological Period (1100 BC -1400 AD) without detailed regional records
As summer goes and winter comes, people can study the seasonal and inter-annual variations of the climate by observing the timing of appearance of frost and snow, freezing and thawing of rivers, and emergence of leaves, flowers and fruits, and the dates of migratory birds’ first and last appearance. This is phenology. Phenology can also be called climatology and meteorology without instrumental records. Chinese people have started observing phenological events since 11th century BC, accumulating a wealth of data spanning 3000 years.
Pictograms and simple ideograms are the basic components of Chinese characters. Characters in pictograms directly evolve from the pictures of objects they represent. Characters in ideograms have direct iconic illustrations. By combining two or more pictographic or ideographic characters, a new character with a third meaning can be created. Chinese characters in the documents from early Zhou Dynasty (1066 BC, with its capital Haojing near Modern Xi’an) that depict clothing, household utensils, books, furniture, and musical instruments all contained the character of bamboo (竹), suggesting that they were originally made of or from bamboo. These characters in the documents from early the Zhou Dynasty indicate that bamboo was grown extensively in the Yellow River Valley.
It is impossible to grow bamboo in these areas now. During the Shang and Zhou dynasties (1766-256 BC), most people worked in agriculture and animal husbandry. Seasonality was very important to them. Various methods were used to determine the spring equinox, which was usually the start of spring plowing. At that time, farmers in the Tan kingdom (today’s Tancheng Shandong) observed that barn swallows (Hirundo rustica gutturalis) in spring would first show up around the Spring Equinox time. At present barn swallows return to Shanghai, the lower reaches of Yangtze River around March 22nd, approximately the Spring Equinox time. The barn swallows will reach Tancheng a few days later. The annual average temperature difference between Tancheng and Shanghai during the 5-year period between 1932-1937 was 1.5 °C (see Table 1), while the temperature difference in January was 4.6°C. This result is consistent with the conclusion based on bamboo distribution during the archaeological period.
The warm climate in the early Zhou dynasty deteriorated very soon. The Han river became frozen in 903 BC and 897 BC. However, the weather got warmer during the Spring and Autumn Period (770-481 BC). It was mentioned in the book “Zuo Zhuan” (Commentary of Zuo) that ice could not be produced and stored in the cold sheds in winter in the Lu kingdom, Shandong. In the middle of the Zhou dynasty, plum trees were grown extensively in the lower reaches of the Yellow river. Plums were mentioned five times in “Shi Jing” (The Book of Songs). There are such verses as “What grows on Zhongnan mountain? White firs and plum trees” in the poem “Zhongnan”, “Qin Feng”, “Shi Jing”(Ballads of Qin, The Book of Songs). Zhongnan mountain is located to the south of Xi’an, where no plum tree grows at present, whether wild or cultivated. Plum was also a popuplar seasoning in cooking during the Shang and Zhou dynasties (1766-256 BC), since vinegar was not known yet, indicating the wide distribution of plum trees.
During the Warring States period (475-221 BC) and the Qin (221-207 BC) and Han (207 BC-AD 220) dynasties, the climate remained warm. Zhang Biao in the early Qing dynasty (AD 1644-1912) studied the phenological events recorded in “Lu Shi Chun Qiu” (The Annals of Lu Buwei), which was completed in 241 BC. He concluded that the phenological events in the early spring during the Warring States period was three weeks earlier than the early Qing dynasty. Sima Qian (135 or 145 -86 BC) during the Han dynasty described the distribution of subtropical crops in “Shi Ji” (Records of the Grand Historian). Examples were orange trees grown in Jiangling, Sichuan, mulberry in Qilu, Shandong, bamboo in Weichuan, Shaanxi, and laquer tree in Chenxia in the south of Henan. The northern limits of these subtropical plants have moved towards the south since then. The Yellow River breached at Huzi in 110 BC. Baskets carrying stones made of bamboos grown in Qi Garden of Henan were used to stop the flood, suggesting the abundance of bamboo then in Henan.
During the East Han dynasty (AD 5-220), there was a distinct trend of climate cooling. There were several severe winters. Frost and snow were recorded in the late spring. But this cooling period didn’t last long. At that time, oranges and mandarins were still common in the south of Henan. During Three Kingdoms period (AD 220-280), Cao Cao (AD 155-220) managed to grow orange trees in the garden of his Bronze Bird Palace (today’s Southwest Linzhang, Henan). However, these orange trees were unable to bear fruit. The weather was much colder than the period in which Sima Qian (135 or 145-86 BC) had lived.
Cao Pi, son of Cao Cao, inspected a military exercise of 100,000 soldiers at Guangling, Huai’an (today’s Huaiyin) in AD 225. Because of the sudden severe cold, the Huai river became frozen and the drill had to be aborted. This is the first written record of Huai river freezing over. At that time, the weather was much colder than now. The cold period went on until the second half of the 3rd century, reaching the peak between AD 280 and 289. At that time, frost would still appear in the 4th month of Chinese lunar calendar (approximately May in the western calendar). One can estimate that the annual average temperature in the 3rd century was 1-2 °C lower than today.
During Southern and Northern Dynasties (AD 420-579), cold sheds were built to preserve food on the hill of Fuzhou, Nanjing. The winter temperature in Nanjing in those days must have been 2°C lower than now to provide the ice for food preservation. The book “Qi Min Yao Shu” (Essential Techniques for the Welfare of Common People) published in AD 533-544 was a comprehensive agricultural manual, summarizing the Chinese agricultural techniques used in this period. In the areas to the north of Yellow River, apricot trees blossomed in April, and leaves of mulberry trees emerged in early May according to this book, which is about 2 to 4 weeks later compared to today. In addition, it was also mentioned in this book that people in the Yellow River walley winterized pomegranate trees by covering and wrapping the trees with cattails, indicating that the weather in the first half of the 6th century was colder than now.
China became a united country during the Sui and Tang dynasties (AD 581-907). The climate had become warmer starting from the middle of the 7th century. There was no ice forming and snow falling in capital of the Tang dynasty, Xi’an in AD 650, 669, and 678. From the early 8th century to the middle 9th century, plum and orange trees were grown in the garden of the Royal Palace in Xi’an and Lake Qu in its southern suburb. The orange trees in the Royal Palace produced fruits in AD 751. There were also records of orange fruit harvesting between AD 841 and 847. The orange tree can withstand a minimal temperature as low as -8 °C. Today, the lowest winter temperature in Xi’an every year is invariably below -8 °C.
In the early 11th century, there would have been no plum trees in northern China. The poem “Apricot” by Su Shi (AD 1036 – 1101), a famous poet in Song Dynasty, contains the following line: “Fortunately, there is no plum tree in the central Shaanxi plain”. Wang Anshi (AD 1021-1086) from the same period laughed at people from northern China for mistaking plum trees for apricot trees. There are such lines as “Northerners don’t know the plum trees, mistaking them for apricot trees” in his poem “Ode to the Red Plum Blossom”. From these general phenological events, we can tell the temperature difference between Tang and Song Dynasty.
At the beginning of the 12th century, climate cooling in China accelerated. The whole water body of Lake Tai was frozen in AD 1111. Vehicles could travel over the frozen Lake Tai. All orange trees in the areas of Lake Tai and Dongting Hill died of frost. Snow was very common in Hangzhou then, and the snowy season lasted till late Spring. According to the historical records of the southern Song dynasty, the average date of last snow fall during a 10-year period from AD 1131-1260 was April 9th, approximately one month later than the average date of last snow fall during a 10-year period before the 12th century. Southern Canal near Suzhou froze in winter from AD 1153-1155. In October of 1170, West Hill in Beijing was covered with snow, which is rare today.
Fuzhou on the east coast of China is the northern limit of lychee growing range. In the last 1000 years, incidents of all lychee trees perishing during winter in Fuzhou were reported twice. Both incidents occurred in the 12th century, once in AD 1110 and another time in AD 1178.
Japanese feudal lords held cherry (Prunus serrulata) blossom viewing parties in Kyoto every year from the 9th to 19th century. These parties were all recorded with exact dates, providing a complete phenological record of Japanese cherry blooming dates (see Table 2). The earliest date of full bloom of cherry was observed in the 9th century, while the latest occurred in the 12th century.
Right after the 12th century, the winter in Hangzhou started getting warmer. There was no record of ice and snow in AD 1200, 1213, 1216, 1220 in Hangzhou. During the same period, the apricot trees bloomed around the Festival of Qingming (the 5th solar term) in Beijing, similar to the blooming dates of apricot today. It seems that the warm weather lasted into the late 13th century, from the fact that the departments supervising and managing bamboo production in Henei (today’s Boai Henan), Xi’an, and Fengxiang (Shaanxi), which had been established since the Sui and Tang dynasties (AD 581-907), continued to run intermittently during the Song (AD 960-1279) and Yuan dynasties (AD 1271-1368) but had stopped functioning completely at the end of the Ming dynasty (Ad 1368-1644). Since then bamboo has not been grown as as a crop plant to the north of Yellow River.
The warm period during the early and middle 13th century was short. The winter became cold shortly after. According to the available records, the canal along Wuxi, Jiangshu, became frozen in AD 1309. The ice of Lake Tai was several feet thick. Orange trees again perished in the winter. Ice floes were observed floating in the Yellow River in Shandong in November 1351, whereas nowadays they only appear in December in Henan and Shandong. During that period, barn swallows appeared at the end of April in Beijing and left at the beginning of August. The date of barn swallow appearance was approximately one week later, while the date of barn swallow leaving was one week earlier compared to current observations. Therefore, it was colder in the 14th century than in the 13th century and today. The phenological records of Japanese cherry blooming also show a similar trend (see Table 2).
Qiu Chuji travelled from Beijing to West Asia to visit Genghis Khan in 1221, passing through Sayram Lake (Xinjiang) which he called “Lake of Heaven”. According to his travel notes, the lake was surrounded by snow-covered mountains (the Tianshan Mountains). However, there is no snow in these mountains today. The peaks that surround the lake are about 3500 meters high, indicating that the snow line was below 3500 meters at that time. Today the snow line in the Tianshan Mountains is about 3700 to 4000 meters high. Therefore the snow line of Tianshan Mountains in the 13th century was about 250 meters below the current level. The cold period started around 1350 in the European part of the Russian Plain. The period between 1429 and 1465 marked the beginning of climatic deterioration in German and Austrian areas. Bad harvests in England in 1430, 1550, and 1590 were also associated with the cold weather. Thus it is obvious that the climate cooling started from East Asia and gradually moved towards the West.
3. Period with Local Records
Based on 665 local records, years in Lake Tai, Lake Boyang, Lake Donting, Han River and and Huai River froze in the winter (13th to 20th century) and years with snow and frost in the tropical area near sea level were summarized (see Table 4). These records indicate that warm winters occurred during the periods of 1550-1600 and 1720-1830 and cold winters occurred during the periods of 1470-1520, 1620-1720 and 1840-1890. The coldest century is the 17th century, and the 19th century comes second. These results are consistent with the number of years of frozen Lake Suwa in Japan (latitude 36ºN, longitude 138ºE) and the number of days for which Lake Suwa remained frozen in the winter (see Table 5), except that the start and the end of severe winters in Japan are a quarter of century earlier than in China.
As mentioned above, the winters from the 15th century to the 19th century were relatively cold, the coldest winters occurred in the 17th century, especially during the period from 1650-1700. For example, the orange and tangerine orchards were completely destroyed in the winters of 1654 and 1676. During this 50-year period, Lake Tai, Han River and Hui River were frozen 4 times and Lake Dongting was frozen twice (see Table 3). In the tropical parts of China, the occurrence of snow and frost was also very frequent. There are records of blooming dates of peach, apricot, lilac and Chinese crabapple trees in the current area of Sha City of Hubei province from 1608 to 1617. Comparison of these data to the current data obtained from Wuchang of Hubei Province shows that the blooming dates were about 7 to 10 days later than now.
The phenological records from Beijing from 1653 to 1655 are also around 1 to 2 weeks later than now. According to the travel journal by Tan Qian, who traveled from Hangzhou to Beijing at that time, the canal in Tianjin was already frozen on 18th of November, 1653, making boat travel to Beijing impossible. Tan Qian thus had to go to Beijing by carriage. On his way back to Hangzhou in 1656, he noted that the canal in Beijing was thawed on the 5th of March. Therefore, the freezing period at that time lasted 107 days, whereas the current freezing period lasts only 56 days. Overall, based on the phenological records, one can estimate that the temperature in Beijing at that time was 2ºC below current temperatures.
4. Period of Instrumental Records
During the Qing Dynasty (1644 -1910), there were records of rainfall of Beijing, Nanjing, Hangzhou and Shuzhou. Based on the average dates of first snow in fall and last snow in spring, we can conclude that the weather from 1801-1850 was warmer than the previous period of 1751-1800 and the following period of 1851-1900. This conclusion is consistent with the local records cited in the previous section.
From the temperature records of Shanghai, the temperature in the last quarter of the 19th century was the coldest. The winter temperature moved up to the average around 1897. Afterwards the winter temperatures had remained above the average for 14 years. From 1910-1928, the winter temperatures dropped below the average. Then the temperature moved up and the winter temperatures from 1945-1950 were 0.6ºC higher than the average. Afterwards, the temperature gradually decreased. In 1960, the temperature dropped back to the average. During the same period, the winter temperatures in Tianjin also showed a trend similar trend to that of Shanghai; however, both the peak point and lowest point arrived a few years earlier than that of Shanghai. The range of temperature fluctuation of Tianjin is wider than that of Shanghai. The peak point and lowest point of temperature of Hongkong arrive later here than in Shanghai, and the range of temperature fluctuation is again narrower. In the last eighty years, the temperature in Shanghai fluctuated in a range of 0.5-1 ºC. This type of temperature fluctuation can have a direct effect on the growth of plants and animals, which in turn will affect the occurrence of plant diseases and pests, and therefore will also have an impact on agricultural operation and production.
The changes in temperature in the last 80 years have already made an impact on the snow line of the Tianshan Mountains and the retreat of glaciers. According to the studies done by the glacier research team of Chinese Academy of Sciences, the snow line of the Tianshan Mountains has gone up 40 to 50 meters and western glaciers have retreated 500 to 1000 meters during the 50-year period from 1910-1960. The glaciers east of the Tianshan Mountains have retreated 200 to 400 meters. The upper limit of tree line has also moved up a little. The current glacial cover of the Tianshan Mountains was formed during the cold period of 1100-1900; it does not consist of remnants from the 4th [intended meaning probably: the most recent] Glacial Period. Freshly formed glacial accumulations could easily be distinguished from the remnants from of the ancient glaciers based on the extent of weathering, the surrounding soil and vegetation.
Preliminary Conclusions:
1. During the first 2000 years of our 5000-year civilization, most of the time, the annual average temperature was 2ºC higher than now. The temperature in January was 3-5ºC higher than now.
2. From then on, there was a series of temperature fluctuations. The lowest temperatures occurred in AD 1000, 400, 1200, and 1700. The range of fluctuation was 1-2ºC.
3. In every 400-800 period, a smaller cycle lasting 50 to 100 years can be detected with a temperature range of 0.5 -1ºC.
4. During the above cycles, it seems that any coldest period started from the Pacific coast of East Asia. The cold waves then moved westward to Europe and the Atlantic coasts. And at the same time, there were also trends from the North to the South.
We compared the temperature changes in Europe with those in China since the 3rd century. We found that the temperature fluctuation curves of the two areas were related. In the same cycle, the wave motion of temperature change of Europe usually started later than that of China. Because the rise and fall of the snow line in the same area is closely related with the temperature change. We compared our results with the Norwegian snow line (see Figure 1). similar pattern is observed, with only a difference in timing. There was a cold period in Norway in 400 BC while no such cold period was observed in China at that time.

Recently, scientists from the University of Copenhagen profiled the climate record of the Greenland ice sheet using the 18O/16O isotope method. The rise and fall of the temperature in Greenland in the last 1700 years showed similar profile to what we concluded in this article (see Figure 2). Besides, there was a cold period in China 3000 years ago. Similar climate record was also reflected in 18O/16O isotope data.

Figure 2: Comparison of temperature variation in China (A) and the Greenland ice sheet 18O/16O isotope ratio, since approximately 300 AD.
In this article, we profiled the ancient climate changes using the phenological method. Phenology is an ancient climatic indicator while using the ratio of 18O/16O isotope to determine the temperature of historical ice and water is a modern method. Similar conclusions could be reached using these two different methods. Finding out the pattern of climate change in the past could be beneficial to the long-term weather forecast. Under the guidance of Marxism-Leninism and Mao Zhedong’s Thought, it may be possible to predict the long-term climate cycle could be predicted by making full use of our abundant historical phenological and archaeological records.
About the author
Zhu Kezhen (1890-1974) was a Chinese meteorologist and geologist. He graduated from the School of Agriculture, University of Illinois, and obtained his PhD in Meteorology from Harvard University. From 1920, he had successively served as chair of Department of Meteorology, Nanjing University, director of Chinese Institute of Meteorology, Academia Sinica, president of National Chekiang University (now Zhejiang University), and vice president of the Chinese Academy of Sciences.
A PDF of this complete paper is available here: zhukezhen english3(PDF)
Tables
Table 1: The difference of average temperature between Tancheng and Shanghai during the period of 1932-1937.
| City | Latitude (N) | Longitude (E) | Altitude (m) | January
(°C) |
February
(°C) |
March
(°C) |
Annual
Average |
| Tancheng | 34°38′ | 118°26′ | 20.0 | -1.4 | 1.0 | 6.6 | 14.1 |
| Shanghai | 31°32′ | 121°26′ | 7.0 | 3.2 | 4.2 | 8.1 | 15.6 |
| Difference | 3°6′ | 4.6 | 3.2 | 1.5 | 1.5 |
Table 2: Frequency of recorded dates of Japanese cherry blossom and the average dates from the 9th -20th century
| Century | Frequency of Recorded Dates of Cherry Blossom (%) | No. of
Observations |
Average date | ||||
| Before
March 31st |
April
1st – 10th |
April
11th– 20th |
April
21st – 30th |
After
May 1st |
|||
| 9th | / | 43 | 57 | / | / | 7 | April 11th |
| 10th | 7 | 36 | 50 | 7 | / | 14 | April 12th |
| 11th | / | 20 | 40 | 40 | / | 5 | April 18th |
| 12th | / | 25 | 25 | 25 | 25 | 4 | April 24th -25th |
| 13th | 13 | 13 | 38 | 38 | / | 8 | April 15th |
| 14th | / | 8 | 58 | 25 | 8 | 12 | April 18th |
| 15th | / | 43 | 47 | 17 | 3 | 30 | April 13th |
| 16th | / | 3 | 77 | 13 | 6 | 31 | April 18th |
| 17th | 10 | 20 | 70 | / | / | 40 | April 12th |
| 18th | / | / | / | / | / | / | / |
| 19th | / | 20 | 89 | / | / | 5 | April 12th |
| 20th
blossom start |
8 | 61 | 31 | / | / | 36 | April 7th |
| 20th
full bloom |
/ | 31 | 61 | 9 | / | 36 | April 14th |
Table 3: Years of frozen lakes and rivers in the Yangtze River valley
| Year | Lake Tai | Lake Boyang | Lake Dongting | Han River | Hui River |
| 1901-1970 | 1955 | 1955 | 1955 | ||
| 1900 | |||||
| 4th quarter | 1877, 1893 | 1877 | 1877, 1886, 1899 | ||
| 3rd quarter | 1861 | 1861, 1865 | 1865, 1871 | ||
| 2nd quarter | 1840 | 1830 | 1845 | ||
| 1st quarter | |||||
| 1800 | |||||
| 4th quarter | 1790 | ||||
| 3rd quarter | 1761 | ||||
| 2nd quarter | |||||
| 1st quarter | 1715, 1720 | ||||
| 1700 | |||||
| 4th quarter | 1683, 1700 | 1690 | 1690, 1691 | 1690 | |
| 3rd quarter | 1654, 1665 | 1670 | 1653, 1660 | 1653, 1660, 1670 | 1653, 1670, 1671 |
| 2nd quarter | 1640 | ||||
| 1st quarter | 1621 | 1620, 1621 | 1619 | ||
| 1600 | |||||
| 4th quarter | 1578 | ||||
| 3rd quarter | 1568 | 1570 | 1564 | ||
| 2nd quarter | 1529 | 1550 | |||
| 1st quarter | 1503, 1513 | 1513 | 1510, 1513 | 1519 | |
| 1500 | |||||
| 4th quarter | 1476 | 1493 | |||
| 3rd quarter | 1454 | 1454 | |||
| 2nd quarter | 1449 | ||||
| 1st quarter | 1416 | ||||
| 1400 | |||||
| 4th quarter | |||||
| 3rd quarter | 1353 | ||||
| 2nd quarter | 1329 | ||||
| 1st quarter | |||||
| 1300 | 1219 | ||||
| Before 1200 | 1111 | -879, -901 | 225, 515, 1186 |
Table 4 Years with snow and frost in the tropical area close to the sea level in China
| A Quarter of a Century | Year |
| 1900 | |
| 4th quarter | 1878, 1882, 1893 |
| 3rd quarter | 1854, 1856, 1862, 1871, 1872 |
| 2nd quarter | 1831, 1832, 1835, 1840, 1846 |
| 1st quarter | 1824 |
| 1800 | |
| 4th quarter | 1781 |
| 3rd quarter | 1757, 1758, 1763, 1768 |
| 2nd quarter | 1729, 1737, 1742 |
| 1st quarter | 1711, 1713, 1721 |
| 1700 | |
| 4th quarter | 1681, 1682, 1683, 1684 |
| 3rd quarter | 1654, 1655, 1656 |
| 2nd quarter | 1635, 1636 |
| 1st quarter | 1602, 1606, 1621 |
| 1600 | |
| 4th quarter | 1578 |
| 3rd quarter | |
| 2nd quarter | 1532, 1536, 1537, 1547, 1549 |
| 1st quarter | 1506, 1512, 1522 |
| Before 1500 | 1245, 1415, 1449 |
Table 5 Number of Days during which Lake Suwa remained frozen
| A quater of a century | Number of non-frozen years | Days later (+)/ or earlier (-) than the average first day of frozen lake |
| 1900 | ||
| 4th quarter | 2 | -4.9 |
| 3rd quarter | 5 | +21.3 |
| 2nd quarter | 2 | +7 |
| 1st quarter | 3 | +1.4 |
| 1800 | ||
| 4th quarter | 2 | +3.5 |
| 3rd quarter | 2 | +2 |
| 2nd quarter | 3 | +8.2 |
| 1st quarter | 3 | +10.1 |
| 1700 | ||
| 4th quarter | 0 | -4.7 |
| 3rd quarter | 1 | -4.7 |
| 2nd quarter | 0 | -6.3 |
| 1st quarter | 0 | +10.2 |
| 1600 | ||
| 4th quarter | 0 | -4.9 |
| 3rd quarter | 1 | -3.2 |
| 2nd quarter | 1 | -3.3 |
| 1st quarter | 9 | +12 |
| 1500 | ||
| 4th quarter | 0 | -6.8 |
| 3rd quarter | 1 | -11.7 |
Table 6 Annual and monthly average temperatures in Beijing during the periods of 1757-1762, 1875-80 and 1954-64.
| January | February | March | April | May | June | July | August | September | October | November | December | Annual | |
| 1757-62 | -5.0 | -4.1 | 3.5 | 13.0 | 20.4 | 25.6 | 26.0 | 25.6 | 19.6 | 12.2 | 3.0 | -3.4 | 11.4 |
| 1875-80 | -5.8 | -1.9 | 5.5 | 14.2 | 20 | 25.6 | 26.9 | 25.5 | 19.5 | 12.0 | 3.2 | -3.4 | 11.8 |
| 1954-64 | -4.2 | -1.8 | 4.6 | 13.9 | 20.1 | 24.1 | 26.0 | 24.7 | 19.6 | 12.1 | 4.3 | -2.4 | 11.8 |
Presumably the graph finishes at 1971 or so and therefore another degree needs to be added to the end of the graph?
Tonyb
A degree, or less, depending on the averaging period of the paleo data. If the averaging period is 50 years, we would add only half a degree C.
Well I think my Chinese wife, who also has a PhD and spent the first 24 years of her life in Beijing China, would have a problem with the references to “Chairman Mao” in the article.
Regardless of any merit in the paper, she would probably put it in the category of Joseph Stalin or Lysenko or perhaps Fidel Castro..
Cheers
Roger
rogerthesurf,
Any published paper at that time in China required an obligatory reference to the ruling political deities, otherwise it wouldn’t get published and the authors might quietly disappear. I remember being at the International Radar Conference in Washington DC in 1980, where, for the first time since the start of the Cold War, an official Chinese delegation was giving a technical paper about radar developments in China. I was much amused to see that the printed version of their paper started off with obligatory condemnations of the Gang of Four, but when the chief delegate read the paper to the audience he omitted that part altogether.
Actually no… you are simply pulling a Michael Mann trick.. splicing thermometer data onto the end of paleo data… a no no.
If you want to bring it up to date so a fair comparison between then and now can be made, you have to reflect that there is likely to have been a further temperature increase. Ideally data relating to china would be used to update it rather than a global averaged figure.
tonyb
This is a quality find! Thank you for sharing it.
A very important historical paper. Now let’s watch as the climate cartel do their utmost to nullify the author and claim that this old guy suffered dementia and measuring instruments were inaccurate and the data needs to be adjusted to be accurate, etcetera, ad nauseum.
When they wanted to kill off the MWP and LIA, they didn’t attack the evidence or the scientists who produced it. Dr. Michael Mann concocted his hockey stick and the alarmists and their henchfolk just ignored the other evidence.
Good point. Easier to ignore it.
Far more knowledge and insight has been lost throughout history than we have been able to retain. I mourn the brilliance of voices in the past that have wafted away in the winds of time.
Once in a while we unearth a few, and when that happens, celebrate!!!
What does Jackie Chan say?
(insert punchline here)
Now wait…shouldn’t we consult Chuck Norris as well?
Coffee is a language in itself. link
OK, now what did Charlie Chan say, C.B.?
Yeah, I know… Whatever was in the script. I should’a guessed.
He said a great deal. link
That sounds a lot like what Richard Feynman said:
The paper shows the huge advantage of a long, written history.
I find the comparison with modern papers illuminating. Where modern papers pay, at least, lip service to AGW, presumably to ensure research funding (a good recent example is the Kench, et al, paper on the increasing land area of Tuvalu), here we we have an example where the paper pays service to Marxism-Leninism and Chairman Mao. Was it ever thus?
He had to pay homage to Mao or his life would be in jeopardy. Another paper confirming the variability of climate in the past and the fact that a little bit of warming was good for us.
It would be reasonable to believe that research papers pay service to whomever commissioned them. That’s why people need to learn what is good research, the methods, etc so they can determine what parts are homage to the funder and what parts are actual research.
Perhaps his leaders commissioned him because of their curiosity instead of their cunning, and required no particular bias to insure compensation.
Zhu Kezhen survived all kinds of upheavals. China was a mess for most of the twentieth century. As one of my friends once observed, “He had ample opportunities to die.” link
I admire people who live in troubled times and nevertheless manage not to die. Zhou Enlai survived the same cataclysmic events as Kezhen while being much more of a target. Andrei Gromyko survived being in close proximity to Stalin. Both those men were highly skilled diplomats. My impression was that both managed to avoid being blinded by ideology. I had great respect for them while, at the same time, thinking the world would be better off without Mao and Stalin. Personally, I identify more with Rincewind. 🙂 Never mind, the goal is to not die for as long as possible. It doesn’t matter if you do it by using great skill or by running fast and being really lucky.
Wise words regarding survival.
Zhu Kezhen praising Mao ? Of course he did. He needed to protect his research funding
In the late 70’s in the UK if you wanted a grant for some sort of geological research, say for example …”A study of the Ediacaran fossil assemblage of Charnwood Forest” you would tack on to the end of the title…”and its economic significance”.
Today you would tack on something like …”and its implications for climate change”.
Plus ca change.
Before getting carried away can we have link to a scan of the original paper and the translation, please?
I’m always sceptical.
I just checked with Shenhui, and the situation is actually as follows: the main text is from this news site. The accompanying graphs and tables, however, were actually taken from a scientific paper (PDF) by the same author. (I think she told me earlier, but I had forgotten this detail — my apologies.)
Thank you for answering.
Sorry, but given its obviously politically motivated source I can’t put much credence into this.
I found a similar document written by a Russian in the Scott polar institute in Cambridge. It concerned the likelihood of there being a route through the north east passage above Russia in the 16th century. I wrote in my notes at the time’ something along he lines of ‘obviously politically motivated to meet a communist viewpoint of glorious discoveries’
It was only when I researched a lot more stuff that I realised the paper was probably essentially correct. we are right to be sceptical but not all communist science was flawed.
Tonyb
Excellent point. Looking for confirmation from other studies and in other areas is a great way to learn what is likely true versus the politics.
@ TDBraun: Are you trying to suggest that modern Western Climate Science is not obviously politically motivated?
You have to be incredibly naive or drunk on the Climate Kool-Aid to believe something like that.
How is a list of observations “politically motivated? ” The homage to Mao was apparently to keep his head firmly attached.
I’ve been observing for some time to my friends that we don’t know enough about the causes of changing climate because our ancestors kept poor records.
I was wrong: our Chinese ancestors did it well for 5,000 years. We are fortunate that Zhu Kezhen took the time to read & documentt these phenological records & that his work was rediscovered.
Perhaps similar records will be unearthed in ancient Babylonian, Sumerian, Minoan, Persian, Indian, Egyptian, African, Andean, Mayan & other civilisations.
Now, how to use them to discover the various factors & cycles that caused those regional climates to change? Also, why was there a delay from cooling in East Asia to Europe?
We have the records for the Byzantine empire covering much of the Mediterranean region from around 400 to 1400 AD
Tonyb
“Qiu Chuji travelled from Beijing to West Asia to visit Genghis Khan in 1221, passing through Sayram Lake (Xinjiang) which he called “Lake of Heaven”. According to his travel notes, the lake was surrounded by snow-covered mountains (the Tianshan Mountains). However, there is no snow in these mountains today. The peaks that surround the lake are about 3500 meters high, indicating that the snow line was below 3500 meters at that time. Today the snow line in the Tianshan Mountains is about 3700 to 4000 meters high. Therefore the snow line of Tianshan Mountains in the 13th century was about 250 meters below the current level. “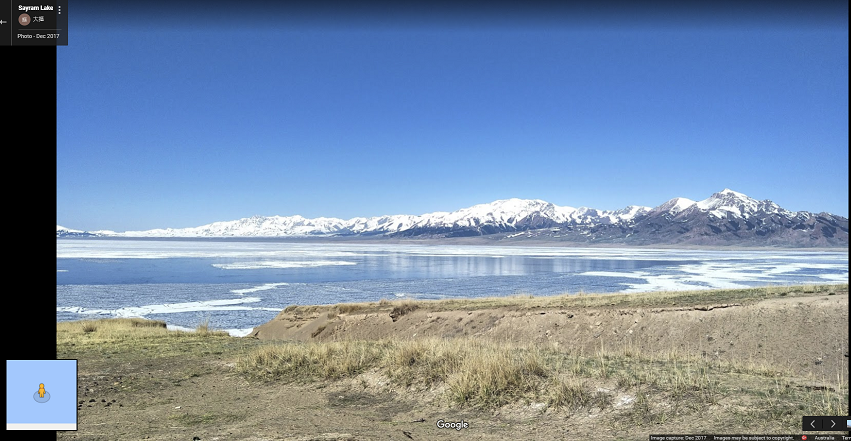
Curious stuff. Here (from Google Maps) is a modern picture of Sayram Lake
Well, we must assume that the snow line is seasonably variable — so without knowing the time of the year this travel occurred — and, of course, when your photograph was taken — we certainly don’t have the whole picture. But there are more specific pieces of evidence in this paper.
Their argument is:
1. Qiu Chuji saw snowy mountains around the lake in 1211 (season unspecified ).
2. ” there is no snow in these mountains today”
3. Therefore, it was colder then than now.
I think the notions are very odd. I can’t believe that there anything can be deduced from seeing snow at 3700m altitude at 44°N latitude, at any time of year, 1973 or now.
I agree with you. However, there are better pieces of evidence in this paper.
” 3700m altitude”
correction, 3500m
Nick
I thought warmer weather meant more moisture and therefore more snow and colder weather meant less moisture and therefore less snow? i am so confused.
Nick his graph clearly shows 1200 to be cooler than today.
So you’re saying it’s cooling again?
The paper was published in 1973. What year was the Google photo in your link taken?
I’m missing your point, Nick. Are you trying to say it is cooler now than it was in 1973?
No. I’m suggesting that on this matter at least, Zhu Kezhen is an unreliable informant.
@ Nick Stokes February 11, 2018 at 2:30 pm
No. I’m suggesting that on this matter at least, Zhu Kezhen is an unreliable informant.
——
Why?
You provide no reason to suggest he is a “unreliable informant”.
What is the evidence to support this? You have none. A google photo taken in circa 2016, proves what?
I find it fascinating what people label “an unreliable source”. Seems it’s anyone that might tip their world over and cause discomfort.
As an “unreliable informant,” he simply died before his time. He would fit-in perfectly with climate scientists today.
His credentials seem pretty solid. https://en.wikipedia.org/wiki/Coching_Chu
There are also links claiming this study was “brilliant” and a “masterpiece.”
https://link.springer.com/article/10.1007/BF02664301
https://hssonline.org/wp-content/uploads/2014/04/October2010Newsletter.pdf
Clearly these sources are “unreliable informants” as well, likely part of some vast right-wing conspiracy.
His work was not without some errors in geography and whatnot. Follow-up studies confirmed many of his findings. You can find discussions in Nature, Environment and Culture in East Asia: The Challenge of Climate Change https://books.google.com/books?id=leQTAAAAQBAJ&pg=PA109&lpg=PA109&dq=zhu+kezhen&source=bl&ots=-h_1bPsNov&sig=JARBt_lGPwrpCKX37UcCEjgL3QE&hl=en&sa=X&ved=0ahUKEwiZ8PiNlp_ZAhUF71MKHYp_C104ChDoAQhPMAk#v=onepage&q=zhu%20kezhen&f=false
One interesting note I saw was that wars were tied to unusually cold periods.
@ Reg…here is what Nick is missing. The previous 3 winters saw increasingly colder winters spinning off of the Siberian cold front. I have the daily screenshots to prove that contention. The last 2 winters in particular saw temps as low as -40+ F below average across broad areas of Siberia which then extended further south into China, and west into Europe.
That is what led me to believe that Europe would get hit in this winter with a very cold winter. Now Europe is getting a mild late winter blast.
“here is what Nick is missing”
So, if it was just a cold winter, why could Qiu Chuji not have had the same misfortune?
But the snow seems to be a regular. Here is a Chinese travel guide:
“In winter, snow falls and the lake water turns to ice. Only a small part of the lake can be seen in the vast whiteness of ice and snow. “
Google has many snowy pics.
@ Nick…as the study suggests, it gets cold in China first, then the cold wave starts to hit other regions within the NH. That fits with my idea of where the cyclic pattern sits. The Trinity Alps to the north of me also lost all or almost all of their glaciers during this warming trend since the late 1970s. Several years ago I was amazed to see almost no snow at this same time of year on the peaks of the Trinity Alps as I drove into town. The last 2 years have seen a return to more average snow conditions, but only a few patches of dirty ice on north facing slopes make it much past the end of spring.
It will be interesting to see what the next decade brings in change to the NH. I do lean towards a cooling trend being most likely for the next several decades; but if warming were to reassert itself after the end of the upcoming solar minimum, then I would have to change my outlook.
maybe yes…maybe no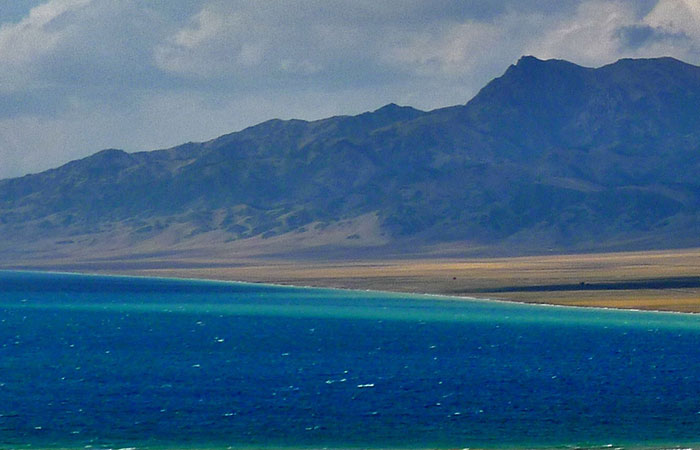
Snow line usually refers to the bottom line where the snow stays all year…
That may be the proper definition, but we can hardly assume that this ancient traveller was abiding by it. All we know is that, on some day of that year, those mountains were snow-covered.
Yes it would be very strange for a mountain anywhere in Xinjiang to be snow free all year round. It’s not far from Mongolia.
Indeed:
snow line
ˈsnəʊ ˌlʌɪn/
noun
the altitude in a particular place above which some snow remains on the ground throughout the year.
Qiu Chuji travelled from Beijing to West Asia to visit Genghis Khan in 1221, passing through Sayram Lake (Xinjiang) which he called “Lake of Heaven”. According to his travel notes, the lake was surrounded by snow-covered mountains (the Tianshan Mountains). However, there is no snow in these mountains today. The peaks that surround the lake are about 3500 meters high, indicating that the snow line was below 3500 meters at that time.
So the snow line is lower today than it was then.
Well, according to Qiu Chuji, that’s how it was in 1221. One year. In what season? The snow line may have been higher “then” than it was a few months later. I’m guessing it is quite low today (Feb 11).
The author’s “no snow in these mountains today” was in 1973. The recent photo above posted by Nick Stokes shows snow there again. So there’s hope for the skiers after all!
I’ve never met anyone who declares that a mountain must be covered from peak to foothill in snow, in order to qualify as “snow covered”.
If those mountains (indicated in that recent Google image) have no snow today then is that whipped cream or dandruff covering them?
Snort! That reminds me of a satellite image a Greenie sent me, supposedly showing how much of the Arctic was no longer snow-covered. I looked it over and noticed immediately that NA was basically a bright summer green. On pressing, this person admitted that the image was from late August….
So you are saying that writings endorsed by Chairman Mao, and by inference Lenin and Marx, are unreliable? You are confessing to be a counterrevolutionary? In print? I would be very careful about such things, comrade…
Looks like a hockey stick with the end bent a little. It’s a snow shovel.
And thus the IPCC was born.. 🙂
Nice!
Now THAT is funnier even than some “Norris Notes”, e.g., “Chuck Norris has been dead 10 years already, but the Grim Reaper is afraid to tell him…”
I own a book which was published in England in 1955, called ‘Climate and the British Scene’ by Gordon Manley. It is important for two reasons the first being that it makes no effort to predict any long term trends and the second being that it does not discuss atmospheric physics or Global Climate.
It is in short a summation of the best current knowledge of the UK’s Climate.
It features many graphs from the best scientific sources of the day. Armagh and the CET being two.
These data are presented ‘unadjusted’ and ‘unhomogenised’. The variability and stability that I observed therein has been one of the cornerstones of my ‘skepticism’.
Thank you. archive.org has a scanned version of that book.
A interesting book with good details of the British seasons from the 1850’s to 1968, is ‘Seasonable Weather’ by Lionel P Smith.
lt gives data about about every season on weather it was cold or warm,or wet or dry. Also with details about any weather cycles that may have taken place. Along with this data there is also a series of photos of spring flowers taken on the same day during the years 1914 to 1940 if l remember right.
A very interesting book for anyone with a interest in weather and climate.
The author was obliged to begin the paper with political homily reciting mandated doctrines.
How identical to climate science today, where papers all have to start with a similar homily like “As the climate warms under the wickedly counter-revolutionary gas carbon and the demonic influence of Donald Trump …”
It would be nice to have a PDF version of both the original and the translation. This is the kind of lost research that can be extremely useful.
The translation is linked to above (below the figures, above the tables) — here it is again. For the original, please see my reply to M Courtney above.
“The current glacial cover of the Tianshan Mountains was formed during the cold period of 1100-1900; it does not consist of remnants from the 4th [intended meaning probably: the most recent] Glacial Period. ”
Same with Glacier National Park in the US, although most of what you read today will be mention that glaciers have existed there for thousands of years as if that is the case for those that exist now.
I’m sorry for the length of the following. In 1998 I started looking into historic winter storms in the Northeast, including using David Ludlum’s books. He was the NJ State Climatologist when I was in school; I actually met him a couple of times. I stratified “significant storms” according to ENSO state, and found that El Nino winters had a much higher number of significant storms (10″ or more, subjective obviously), like 3 times as many as neutral or La Nina winters, on average. I had not heard that before, and other people (real actual researchers at academic institutions) started saying the same thing in published papers about that time. That was the first thing I found. Of course, this only strictly applies to the Northeastern U.S.
Then, I noticed, subjectively, that there seemed to be a cycle to winter storminess in the U.S. Northeast back to the 1600s, when records, sparse as they were, started being kept. (Dr. Ludlum used these records and diaries in his books.) I never applied any rigorous statistics, but it seemed to me that winter storminess, and average winter temperatures, followed roughly a 60 year cycle; 30 years of warming and less significant winter storms, followed by about 30 years of colder winters and more significant storms (on average). This “cycle” I term the Ludlum Cycle. I soon saw, with the help of the Internet, that there were others who saw this kind of cycle, and not only with winters, but with ocean SSTs. So, people started talking more about the PDO, the NAO, and the AMO. I still don’t think there’s a name for this about-60 year cycle in the literature. It may apply only to the North Atlantic area, but it is likely broader, perhaps Northern Hemispheric or more. And, of course there are other cycles: most well-known, but sort of pooh-poohed by the so-called climate scientists nowadays, is the (global) cycle wherein we have the Roman Warm Period, the Dark Ages cool period, then the Medieval Warm Period, then the Little Ice Age, and now the Modern Warm Period. (Other alternating warm and cold periods go back much further.) These periods seem to last for 300 to 500 years, so a cycle would be 600 to 1,000 years long; say 800 on average. I also “discovered” an intermediate cycle: it seemed to me that there were noticeable periods about a century long where there was relative warming, followed by a century of cooling, WITHIN the longer period cycle. So, I saw 3 distinct cycles: the 60-70 (actually 66, I’ll tell you why below, but it’s got slight irregularity) year cycle nests within the 200 year cycle, which nests within the about-800 or 900 year cycle. The warm portion of the (minor to moderate) 60-70 year cycle, circa 1976-2010, was at its peak in the late 20th and very early 21st century, and has now switched into a cooling phase and is now declining. Before 1976, there was a well-known cooling phase globally, probably 1940-1976. Before that, there was warming in the 1920s and 1930s (1910-1940), perhaps it was even warmer globally then than it is now. 1880-1910 was cooler, and stormier. 1845- or 1850-1880 was warmer and calmer. The 1810s to early 1840s was stormy, and cooler. Of course, increased volcanism likely played a role in this period as well. The late 1770s-1810 period was warmer than the preceding 1740-1775 period, which had some fierce storms and cold spells. Of course, now we’re talking close to the depths of the LIA, so it stands to reason that the cycles may blur or wash out. The late 1600s were brutally cold in the winters in Eastern North America and Europe. My genealogy work shows my ancestors in Quebec and southern New England in the 17th century; they must have suffered terribly. Louis Hebert accompanied Champlain to New France in 1606; he returned with Champlain with his family in tow in 1617 and carved out Quebec City. Louis slipped on the ice, hit his head on it and died during a severe winter in the late 1620s. In fact, there were just a few survivors of the harsh weather in Quebec City by 1630; Louis Hebert’s widow, daughter, and son-in-law were among them, and they had all but decided to return to France when help arrived in the nick of time.
The (minor to moderate) 200 year cycle lies, conveniently, on the actual centuries. So, warming commenced in 1500, cooling in 1600, warming started again in 1700, cooling started in 1800, warming in 1900, and now cooling started (or should have started) in 2000, etc. etc. The larger and more pronounced (major) ~800-900 year cycle started becoming cooler about 1300, and bottomed about 1650 or 1700, and will linger in its warm phase until about 2100 to 2200. (Hey, this may be off by 50-100 years, plus there’s irregularity.) The peak of this current Modern Warm Period may not necessarily be midway between cycle onset and cessation; or, there could be double peaks, or even more than two. But, I think we’re at about peak now. There could be another peak between 2045 and 2080, maybe of slightly less amplitude than now.
But, the upshot of this madness is that there are 3 distinct cycles, the largest of which is modulated by the two more minor cycles. So, we see episodic and cyclic warming and cooling depending on where these cycles phase or anti-phase.
If this is so (and that’s a GIGANTICALLY BIG if), what causes these cycles of warming and cooling? (Unless they’re just caused by internally-oscillating noise, which is possible; but, I really think there are “things” governing these cycles.) Well, since the sun gives us our energy, I started thinking about sunspot cycles. The well-known Schwabe cycle is about 11 years (actually it varies, 8-13 years). The polarity of the sunspots flips from positive to negative in the sun’s northern hemisphere (and from negative to positive in the southern hemisphere) with every cycle change, so the Hale cycle is 22 years (2 x 11). So, I wondered if something happens with these polarity shifts. If you take 3 sunspot cycles, that would be 3 x 11, or 33 years. This means that in this 33 year period, there are 3 cycles, but two of them have a certain polarity dominating, 2 to 1. Then, during the next 33 year period, the opposite polarity dominates, 2 to 1, and so on and so on and so on. If this is so, then three 33 year periods would similarly have a polarity dominance; this would be 99 years (100 years), 1/2 of the 200 year cycle. MAYBE three 300 year periods would also have this polarity dominance and give rise to a 900 year cycle (at least that’s in the 600-1,000 year cycle range). Now, the question is, OK, supposing this BS has something to it, WHY does a reversed polarity of sunspots have an effect on our atmosphere? I DON’T KNOW! But, maybe there are some kind of ionization or UV changes (or both) in the upper atmosphere which cascade down to the lower stratosphere and the troposphere and affect weather patterns, as has been mentioned in the literature.
If the above is true, we have been globally warming as the 66 year, 100 year, and 800-900 year cycles have all been peaking in the late 20th century. We are still going to be warm, globally, as the main 800-900 year cycle remains near its peak in the first half of the 21st century. However, we may see some noticeable cooling later this century as the 66 year and 200 year cycles anti-phase and wane, respectively. Specifically, the 60-70 year cycle should cause some warming again by 2045, but cooling by 2080, and the 200 year cycle will be waning by then, going into its cooling phase by 2100. How’s that for a non-testable forecast?!
And how does all nonsense this compare with the mentioned cycles in the poster’s translated article? Good job on that, by the way.
You seem to have gone through a lot of data. I think you should propose a full post on your work, complete with data, graphs and tables — I would certainly love to read it. But steel yourself — you might be accused of “cyclomania” by some readers.
4caster
I agree, as two factors have discriminated against such, the usual push for rewards for quantitative over qualitative research (both in publication and data analysis) and maybe more important what has happened in the history profession. Have been told from good authority that there is a lot out there yet, much in other language sources. Is this the same Ludlum?
Ludlum, D. M. 1963. Early American Hurricanes 1492-1870. Amer. Meteor. Soc. Boston. 198p.
Hi. Might I suggest that you stick to the same definition of a cycle? For instance, you talk about a 60–70 year cycle as its full period. 33 positive years, 33 negative. OK!!! Then the 100 year cycle. But the 100 years is only ½ of a cycle, isn’t it? Actually you should call that a 200 year cycle. FULL PERIOD again. Similarly, you’ve identified a 850–900 year cycle. Is this full or half period? Well, re-reading, it is the full cycle.
Just saying. The last bit, starting with “…if the above is true…” should have been written with
There. Better. I’m happy now.
Since you’re a math guy, consider also periodicity and coinciding overlaps of cycles. What is the least common multiple of 66, 200 and 850? Hard. Long. 112,000 years or so. But if you use the idea of ‘multiples of multiples’ (your epicyclic hypothesis), and 66, 198, 891 years respectively, then it becomes quasi periodic in only a 1,780 year cycle. Of course its foolish to consider that there is ANY precision to these estimates. Its just kind of interesting, is all.
I further went on to do a little spreadsheet with “amplitude” per your write up of 66-is-weak (0.25), 200 is stronger (0.50) and 850 is much stronger (1.00). I had to lag the SINE curves to +0 years, +60 years and +80 years (respectively) to have their warm-to-cold phase correspond to AD 2000. Fudge is a useful mathematical device, when needed.
What I plotted was exactly this: we may well be headed for a strong downturn, with the maximum negative depth resting on 2100 AD or so. Nowhere near the depth of the 1350–1750 periodicity max, but still significant. Again – if you’re still reading – all these epicycles are CONJECTURAL. Number play. Seeing patterns and projecting them without merit of actual data matching.
ANOTHER WAY to go about this of course is pretty straightforward: do a Fourier data transform on actual northern hemisphere data. Lots of it, for decent averaging. Thing is, before maybe 1900 or so, the data grows thin. Before 1600, it grows anecdotal. Before 1300, its a record of calamities, and nothing else. But a Fourier transform (or a wavelet-fit analysis) is quite useful at teasing out whether there really are 66, 200 and 850 year periodicities. And how strongly the correlate.
Kind of like the r² in statistical analysis of line-fitting and data trending. The closer r² gets to .999, the better the fit of the data to the simple linear “slope” and “intercept” that statistical analysis can easily calculate. Same goes for this. If your conjecture(s) are valid, then the 66±10, 200±25, 850±75 year periods will turn up, and r² figures can be found for them. PLUS a lot of other periods. Which point out either the sanguinity or the folly of the whole idea.
Good luck! Read up on wavelet-fit analysis! There’s gold in them thar hills.
GoatGuy
“In every 400-800 period, a smaller cycle lasting 50 to 100 years can be detected with a temperature range of 0.5 -1ºC.”
Sounds familiar.
“Ideas of stagnation, pessimism, inertia and complacency are all wrong. They are wrong because they agree neither with the historical facts of social development over the past million years, nor with the historical facts of nature so far known to us”
Wholeheartedly agree. This is what is wrong with all the “green” movements, they want to freeze the world in a way that has never existed before and can’t be maintained.
Careful now — you just agreed with Mao Zedong 😉
Mao died in September 1976. Unfortunately, the political pressures exerted by the Communist Party make me skeptical of any publication that touches on their ideology. Cf: Lysenko in Russia and genes and environment and inheritance. If the data are correct, someone could re-write this paper, giving proper credit. Even then, we might fear selection bias by the original author.
As stated on page 110 in “Nature, Environment and Culture in East Asia: The Challenge of Climate Change,” published in 2013…
“Following in the footsteps of Zhu Kezhen’s, scholars of the Institute of Geography at the Chinese Academy of Science started in 1977 to collect systematically records related to climate from historical documents. Within 17 years, the searched through 1,531 titles of classics, histories, thoughts, and literature and obtained more than 30,000 entries of climatic records, of which 22,567 entries (75 per cent) had a precise year dating from 30 BCE to CE 1469. Moreover, they gathered records of droughts, floods, and other natural disasters from more than 4,000 titles of local gazetteers…”
They made updates and built upon to Kezhen’s work. For East China’s winter half-year temperatures, they found that there were warmer periods in the past and that “the speed of warming in the 20th century was quite similar to that in previous periods of transition from cold to warm in the past 2,000 years.”
That’s a very interesting find, thank you.
From the South China Morning Post – I read the original while on a trip from Hong Kong to Taipei. (apologies for not being able to get the graph across to the site and for insertion below)
________________________________________
China gives history lesson on warming
Tuesday, 08 December, 2009, 12:00am
Stephen Chen
As the world begins 12 days of intense discussion in Copenhagen, Denmark, about how to combat climate change, the debate in China is about whether global warming is good or bad for China.
If 3,600 years of history is anything to go by, Chinese civilisation has flourished when temperatures have been at their warmest and declined when the climate cooled.
It is a relationship that could hold lessons for today, says Professor Xie Zhenghui , deputy director of the Chinese Academy of Sciences’ International Centre for Climate and Environmental Sciences.
Ask the scientists and some will warn the growing season for farmers will become shorter, the weather more extreme and sea levels higher. Moreover, they say China, as the biggest emitter of the greenhouse gases that cause warming, risks being blamed by other countries for disasters around the world.
Others see potential benefits. More carbon dioxide in the atmosphere would accelerate the growth of crops, higher temperatures would open up for cultivation land in northern areas such as Inner Mongolia that are too cold to grow crops today, warmer air over the oceans would bring more rain to China’s drought-plagued interior and the frequency of extreme weather would eventually decrease once temperatures stabilised, they say.
‘Chinese historical records show that the temperature would stabilise after a sharp climb. Mother Earth has a lot of mechanisms to adjust herself to a new equilibrium,’ Xie said. ‘In my opinion, the sooner the temperature increases the better. The longer it takes, the more extreme weather we will have to face. Extreme weather is the hallmark of transitional periods. Once we enter the warm and stable periods like those in the Han and Tang dynasties, we will be fine.’
As this division of opinion suggests, predicting the future may be beyond contemporary climate science. But the past may indeed hold lessons. For thousands of years, Chinese scholars have kept precise and meticulous meteorological records; such information was crucial for the government to plan and guide agricultural production. (China has the longest continuous recorded history of any civilisation.)
Everything was archived, from the date each year that ice began forming at the mouth of the Yellow River to the flowering and seeding patterns of certain plants. The data allows scientists today to chart a reliable pattern of climate change in China over three and a half millenniums.
From the prosperity of the Shang dynasty 3,600 years ago to the ruin of the Bronze Age, the cultural peak of the Tang dynasty in the seventh to 10th centuries and the subsequent ravages wrought by horsemen from the north, Chinese civilisation has reached its highest points when temperatures have been warmest and its lowest points when they have cooled.
Wang Zijin , an environmental historian at Beijing Normal University, said the relationship between temperature and success was no coincidence. When the weather cooled, agricultural output fell, wealth contracted, discontent rose and China became more vulnerable to invasion from the north.
‘In the long term, warming may not be a curse but a blessing [to China],’ he said. ‘According to what happened in the past, if the temperature continues to rise in the future we may not see the return of elephants, but it will be very possible that rice and bamboo can again grow along the Yellow River. Xinjiang , Gansu and Inner Mongolia will become much more habitable than they are today.’
This relationship between temperature and dynastic potency was first drawn by a meteorologist named Zhu Kezhen in a 1972 paper. Zhu was one of the first Chinese PhD graduates of Harvard University and helped lay the foundations of modern meteorology on the mainland.
In his paper, the last he wrote and considered a classic for its elegant prose and bold conclusions, Zhu drew a graph plotting temperatures in the Yellow River region from 1500BC to 1950. Based on archaeological artefacts and historical documents, the graph charted the rises and falls in temperature.
It showed that there were three extended periods of warm temperatures.
The first coincided with the Shang dynasty (1600BC-1046BC), when the annual average temperature reached as high as 11.3 degrees Celsius. This period saw the emergence of the first comprehensive set of Chinese characters, massive construction of palaces and cities, large-scale farming and the production of systematic astronomical records and sophisticated bronze wares.
The second extended period of warm temperatures lasted more than 700 years, from the Eastern Zhou dynasty (770BC-256BC) to the Western Han dynasty (206BC-9AD), when average temperatures peaked at 10.7 degrees Celsius. In the Eastern Zhou, China’s territory expanded from the Yellow River to Guangdong, Yunnan and Sichuan. There was an enormous bamboo forest along the Yellow River, while the Yangtze River cut through lush rainforest. Slavery was abandoned, iron tools became popular in farming, and Confucius and other scholars established the philosophies that shape Chinese society today. By the time temperatures started to dip, China had built the Great Wall, a national network of roads and conquered Xinjiang, Vietnam, Taiwan and Korea.
A third warm period, when average temperatures peaked at 10.3 degrees, coincided with the Tang dynasty, widely seen as the peak of Chinese civilisation. Some historians estimated China accounted for 60 per cent of global gross domestic product during this era. From textiles, ceramics, mining and shipbuilding to paper making, China led the world in almost every sphere. There was also a spiritual and cultural boom – there were more poets in the Tang than at any time in history. In between these great dynasties, average temperatures plunged and chaos reigned. The Chinese empire retreated, and was even driven into the sea by the invading Mongols who established the Yuan dynasty (1271-1368). The longest period of relative cold lasted from the end of the Tang to the fall of the Qing dynasty in 1911.
Now temperatures are on the rise again, matched by scorching economic growth. According to the Yellow River Conservancy Commission, the average annual temperature was 10.3 Celsius from 2001 to 2007 – the same as in the Tang dynasty.
Zhu’s research was based on records which make for interesting comparisons with the present day. Rice could be harvested twice a year to the north of the Yellow River in the Eastern Zhou dynasty, whereas the region is generally dry now. Plum trees were common along the Yellow River in the Tang dynasty, but since then have only grown further south.
Xu Ming, chief author of a study by global environmental group WWF on the impact of climate change in the Yangtze River region, said China should focus less on prevention and more on mitigation. Instead of ploughing money into expensive carbon reduction technologies, it should build more water redistribution facilities, plant trees and develop new crops that could endure temperature fluctuations.
‘China should do something within its limited capacity to reduce greenhouse gas emissions, but no matter what we do, global warming is inevitable. Therefore we must get ready for it,’ said Xu, a professor at the Institute of Geographic Sciences and Natural Resources Research under the Chinese Academy of Sciences.
He said a rise in sea levels would pose a long-term threat to coastal cities including Shanghai, which could end up below sea level and needing protection by dykes.
‘Adaptation requires a tremendous amount of money, resources and advanced technology. China is far from ready. Our citizens are complaining about uncommon icy rains, droughts and snowstorms. They count on the government for protection.’
Topics:
Company Expansion
Environmental Issue
________________________________________
Source URL (retrieved on Aug 28th 2013, 12:35pm): http://www.scmp.com/article/700638/china-gives-history-lesson-warming
+10
+ 10 more. Very interesting.
This post reminded me of a post that appeared in WUWT back in 27th April 2016.
Which posted about a paper that had details of ice freeze data of two lakes in Japan and Finland that dated back to as far as 1442. Which showed winter warming since the end of the LIA.
Has anyone looked into the European/British monastery records. They were pretty good record keeps as I recall.
Yes.
I have examined manorial records back to the 13th century. They give the nature of each season as that was important for farming. I also had translated with the full help of a colleague a set of manorial records that were in Norman French and Latin and other documents that were in the archives of the same building in Devon that houses the Met Office archives.
C Pfister wrote a good paper on such records covering East Anglia (eastern England)
tonyb
Did many in England and Wales survive the period 1536 and 1541. Those in the Scottish borders wouldn’t have got past the “Rough Wooing” 1543 – 1551, if they actually survived previous burnings. The Anglo Saxon Chronicle gives details of extreme weather incidents. I would imagine that much of the data would require a lot of effort to get into a reasonable state covering for example the Chronicle of Lanercost covers less than two centuries 1201-1346, and has known lost texts
The warmers have ever since their conference at villack that we should not take any notice of past historical records as they did not have instruments to record things.
Well they would say that would’nt they.
So we are to ignorevthe minion, the roman & the medieval periods,, plus eric the reds settlement of greenland.
But what about human obvervation & the record keeping of the chinese.pus records from the middle eastern area. Egypt and the states of what are iraq, iran, palistine isreal etc.
This is a truly wonderful record of the past. Its lonng overdue that thge ipcc was told to includ both past records of weather, plus accounts of change which are not connected with their fixation on only co2, and ” man made”
In the resl world what the ipcc does is called fraud.
Mje
Methinks your phone is not very smart.
HDHoese, yes, it’s the same David Ludlum. He’s a true hero of meteorology. I often wonder what he would have to say about the state of today’s climate research.
Amazing what you can learn if you take the trouble to read those old books and dig out the archives of long-gone bureaucrats.
Fascinating.
The hockey stick was and remains an outlier from the majority of climate reconstructions. It’s prominent publication in the IPCC report and in every major news outlet around the world, was a significant event in the creation of skeptics. It was overwhelming evidence that it was no longer a science debate, and probably never was.
In a way, trumpeting the hockey stick as a new, undisputable truth, explained the previous 10 years of confusion among those who actually followed climate science. There 90’s were surreal, but not so much that skeptical scientist considered that he or she might be wrong. The stick ended the doubt of the skeptical. It confirmed all that we feared.
S[eaking of the ’90s, here’s a link to “An investigation of historical temperature and precipitation data at climate benchmark stations in Illinois,” a study by the Illinois state water board in the mid-90s, that compared the accuracy of benchmark weather stations using the old, inference-based analysis of past decades with a New Algorithm provided by Climate Science™ — the algorithm was found to be biased in favor of warming.
That was an interestin paean to Mao. Can anyone suggest a recent paper with a similar paean to the IPCC?
So we’ve already survived a 2deg temp rise OH NO I didn’t know I was burning in the fires of uncontrolled climate change.
James Bull
When was it translated? Was ‘climate change’ a phrase in 1973?
It was translated very recently. The phrase “climate change” innocently, without the laughable connotations of Climate Change(TM). This should be clear from the time and place of origin.
was used innocently …
But what do the tree rings say?
Table 6. Beijing temperatures in the 18th, 19th and mid-20th centuries averaged to a tenth of a degree. Really? Why not to three decimal places, you know, for even more verisimilitude?
take the paper.
substitute cold for warm.
ask yourself..would evidence of this quality change your mind if it showed the opposite of what you believe.
of course diarists will eat it up.
I don’t think anyone in their right mind would regard the conclusions in this paper as infallible. I’m pretty sure the author would not do that, either — after all, he was an experienced scientist, and every true scientist will always remain open to criticism and revision. On the other hand, it would be asinine to simply discard this historical evidence out of hand. And yes, in your hypothetical case, I still would consider this evidence relevant. I have been proven wrong so often in my life that being wrong once more would hardly surprise me.
Let’s assume we have some sort of climate proxy — ice core records, for example — that we believe indicate that Greenland was just about as warm in the MWP as it is now. At the same time, we find the unmistakable remnants of farm buildings on Greenland in what is nowadays permafrost. How do we reconcile these two pieces of evidence? A dogmatist armchair scholar would probably insist that those Vikings were foolishly attempting to till the permafrost. A person with a real scientist’s mindset would consider that our interpretation of those ice core records may be incorrect.
“The rise and fall of the temperature in Greenland in the last 1700 years showed similar profile to what we concluded in this article (see Figure 2).”
Between 1100 and 1500 they are inverse and not in unison. Alley’s GISP2 series is very cold in the late 700’s, and relatively warm through the Antique Little Ice age.
Look at the begining of the king james bible for a example of paying homage to the poeers at the time.
Today with the grants for research it still happens..always say thankyou to whom ever supplies the cash.
Mje