
Guest essay by Eric Worrall
h/t Benny Peiser / GWPF – Former NASA GISS Director James Hansen and current director Gavin Schmidt think nature may conspire of the next ten years to produce the impression of an ongoing pause in global warming. Though of course it may not.
Global Temperature in 2017
18 January 2018
James Hansen, Makiko Sato, Reto Ruedy, Gavin A. Schmidt, Ken Lo, Avi Persin
Abstract. Global surface temperature in 2017 was the second highest in the period of instrumental measurements in the Goddard Institute for Space Studies (GISS) analysis. Relative to average temperature for 1880-1920, which we take as an appropriate estimate of “pre-industrial” temperature, 2017 was +1.17°C (~2.1°F) warmer than in the 1880-1920 base period. The high 2017 temperature, unlike the record 2016 temperature, was obtained without any boost from tropical El Niño warming.
…
Prospects for continued global temperature change are more interesting and important. The record 2016 temperature was abetted by the effects of both a strong El Niño and maximum warming from the solar irradiance cycle (Fig. 4). Because of the ocean thermal inertia and decadal irradiance change, the peak warming and cooling effects of solar maximum and minimum are delayed about two years after irradiance extrema. The amplitude of the solar irradiance variation is smaller than the planetary energy imbalance, which has grown to about +0.75 ± 0.25 W/m2 over the past several decades due to increasing atmospheric greenhouse gases.5,6 However, the solar variability is not negligible in comparison with the energy imbalance that drives global temperature change. Therefore, because of the combination of the strong 2016 El Niño and the phase of the solar cycle, it is plausible, if not likely, that the next 10 years of global temperature change will leave an impression of a ‘global warming hiatus’.
On the other hand, the 2017 global temperature remains stubbornly high, well above the trend line (Fig. 1), despite cooler than average temperature in the tropical Pacific Niño 3.4 region (Fig. 5), which usually provides an indication of the tropical Pacific effect on global temperature. Conceivably this continued temperature excursion above the trend line is not a statistical fluke, but rather is associated with climate forcings and/or feedbacks. The growth rate of greenhouse gas climate forcing has accelerated in the past decade. There is also concern that polar climate feedbacks may accelerate.
Therefore, temperature change during even the next few years is of interest, to determine whether a significant excursion above the trend line is underway.
…
Read more: http://www.columbia.edu/~jeh1/mailings/2018/20180118_Temperature2017.pdf
Will temperatures rise or fall over the next decade? Temperatures could rise, stagnate or even fall (if solar factors prove a little stronger than expected) according to Schmidt and Hansen’s each way bet. Though they claim that real global warming, the planetary “energy imbalance”, will still be occurring under the cover of whatever happens to global temperature.
The latest prediction does extend the period in which Hansen and Schmidt’s theories cannot be falsified by temperature observations. Up, down or sideways, this paper covers their butts.
This isn’t the first time Hansen has slipped in a prediction that global temperatures will be forced down, despite CO2 driven warming. The diagram at the top of the page is from a previous Hansen paper J. Hansen et al.: Ice melt, sea level rise and superstorms, in which Hansen predicted a possible abrupt drop in global temperature in the near future, caused by ice melt shutting down global ocean currents.
Is this paper really what passes for “settled science” these days? If I was a Congressman the question I would be asking, is a “settled science” prediction that temperatures could go up, down or sideways really good value for taxpayer’s money?
Why doesn’t the US Government save some taxpayer’s money, ask Punxsutawney Phil for his climate predictions, instead of continuing to pay NASA GISS for their each way bets? Punxsutawney Phil might get it wrong sometimes, but at least the theory that Punxsutawney Phil makes good predictions is falsifiable – Phil’s predictions can be compared to temperature observations.
Nothing like using the contrary evidence of your position as evidence for your position…wow.
Those darn cargo planes will be landing any day now!!
Ah, yes, the intergovernmental panel on cargo cults
Gavin Schmidt on the airport concourse loud speaker:
“Attention in the gate area, Flight number 666 is currently delayed. The new ETA for the Flight to Hell is now 2030… Thank you for your patience while we continue to adjust our bamboo headsets for a new ETA to be announced around 2022. And Thank You for flying GISS ScamAir.”
great sculture. from the neck downwards, it really looks like the Fonz. He’s definitely captured his body movements. Shame the artist put the wrong head on it.
Face looks more like Richard Feynmann. LOL
hang on. didn’t we get a paper a few years back (from Santer?) that the climate models show a pause greater than 17 years is highly unlikely?
doesn’t this new paper thus contradict the climate models?
I’m still waiting for climate science to explain the cause of the Little Ice Age and how we can be certain that current warming is simply not a continued recovery from the LIA.
Me too.
So, that null hypothesis is now retired, eh? Are there any others left standing?
No, this is called the bi-null hypothesis method. You know nothing about modern science. Please try to keep up.
In layman’s language the bi-null hypothesis method is called : heads I win, tails you lose.
As I understand it the notion of an El Nino event requires 5 consecutive months, and by all accounts there were 3 months in 2017 that were within the El Nino period, but can’t be called an El Nino event on their own. So the use of the phrase “without any boost” is a fabrication. Is this an accurate read of Hanscmidt’s work?
http://www.woodfortrees.org/graph/plot/hadcrut4nh/from:2000/plot/hadcrut4sh/from:2000
Obviously, Mark, the temperature got a boost from the el nino, because temps started high from the el nino. As of this point, the southern hemisphere temps are among the coolest that have been since the year 2000. The northern hemisphere is still anomolously high. It should be noted that southern temps are generally more stable than the north. And it should also be noted that northern and southern temps oft join each other at some point. (seeing how southern temps are the more stable of the two, if they do join up again soon it will be the north joining the south) Hard to say what exactly will happen, this el nino being such an unusual event with such a great separation between the two data sets. At any rate, 2018 should shape up to be a very interesting year…
global mean lags about 5 mth behind Nino34 anyway, so any “boost” should be expected to be still affecting the global average through most of 2017.
Their definition, their words, — others may say and do otherwise, and do.
NOAA Climate Prediction Center From the CPC site:
El Niño: characterized by a positive ONI greater than or equal to +0.5ºC.
La Niña: characterized by a negative ONI less than or equal to -0.5ºC.
By historical standards, to be classified as a full-fledged El Niño or La Niña episode, these thresholds must be exceeded for a period of at least 5 consecutive overlapping 3-month seasons.
CPC considers El Niño or La Niña conditions to occur when the monthly Niño3.4 OISST departures meet or exceed +/- 0.5ºC along with consistent atmospheric features. These anomalies must also be forecasted to persist for 3 consecutive months.
This is a bit like Nostradamus saying ‘I have a new and truly incredible prophecy. The world may not end in the next 10 years’.
I encourage everyone to support Nostradamus on Patreon. He has to earn a living.
Hi Eric, I would agree except that we are 20 years into the thirty year heating cooling solar cycle and climate muggins knows full well that we will have another 10 years of cooling…and then back to thirty years of “Global warming” again.
Unless of course…as you all say…we don’t. Because the way the sun is behaving we may very well begin to slip into another mini ice age, or worse, so pump out that CO2 guys, when the ice age resumes, and we are overdue, we will be needing every little bit of CO2 we can get, because at a measly 400PPM we are in big trouble when glaciation resumes.
Oh, I can’t, Bill. I don’t have a car any more. I had to junk it. But I can rent cars when I need to. Will that help?
I’m hyperventilating right now!
(I’ll my best attempt at a Leif impersonation…)
….err No. TSI of the last 20 years looks very much like the TSI of the last 60 years.
http://lasp.colorado.edu/home/sorce/files/2011/09/TIM_TSI_Reconstruction-1.png
What Joel said, plus this:
Interesting graph Joel. So it appears that the early 20th c. warming was due to solar increase but the recent drop has not had a counter effect, What do you think could preventing temps dropping now?
zazove , what is that Steinhilber solar graph about . I don’t see any evidence of a drop in solar before y2k, so how did they make it peak before 1990. More creative “smoothers” that distort the data. Pick the one which distorts it in a way to support your agenda.
What do you think could be preventing temperatures from dropping now? Temperature adjustments.
Well, temps are dropping now.
Prove me wrong.
It helps if you stop asking what is happening “just now”, as it is something very undefined. Why? Ask GISS, because they tend to fix the anomaly years after.
I’m not sure how much the Sun has affected temps, but I assume it could well be a large portion of the warming in the 20th century. What come to this new paper. I think the paper is much about covering all opportunities so that we can’t bust them for being wrong. Deep in their heart they know they don’t have a strong case on CAGW, but they also know deep in their heart that once CAGW vanishes, their funding and fame vanishes as well.
zazove says
January 24, 2018 at 7:43 pm
What Joel said, plus this:
Creative graphs in Adjustocene zazove, that is.
“What do you think could preventing temps dropping now?”
Yeah, you have to admit that Hockey Stick chart mimics the CO2 rise very closely. The dishonest manipulators of the temperature record did a very good job of modifying the temperature record to make it look like CO2 is the reason for the warming: CO2 goes up, the temperature goes up in concert. A huge scam has been perpetrated on the world because of this temperature manipulation.
TSI of the last 20 years
——————–
from the graph TSI varied 1 part in 1360 over the past 400 years. This does not explain the cooling and warming over the same period. prior to 1950 there was very little human influence on climate, yet the climate most definitely changed. where was the change in forcings?
quite simply climate science has yet to explain the past. up until the 1990’s it was believed that CO2 increased ahead of temperature and this explained climate change. however the ice cores turned this upside down in the 1990’s, showing that temperature drives CO2. climate science theory has not yet caught up.
the theories still cling to the old beliefs because there is no replacement theory for CO2. which means that climate science cannot explain the past let alone predict the future. And this is clearly demonstrated by this latest paper, which predicts climate may or may not change.
“What do you think could preventing temps dropping now?”
system reaction lag time
that’s some awesome conspiratorial ideation there…
+1
That Mother Nature’s a shneaky lady, ain’t she.
Don’t elevate pretentious weathermen to these positions….and you won’t continue to get weather forecasts
When does Schmidt plan to retire? 10 years from now?
9
So- just looking at that- its pretty much a paper to say “Something is going to happen, not sure what yet”…
Damn! Wish I had thought of that when I was going for my PhD!
Well it does look more like a message of hope and encouragement for the climate alarmista.
It could be interpreted as: ‘As long as Trump is in office there will be continued global temperature hiatus’.
And to have faith: ‘Just hold-on my pretties, in ten years the nightmare will be over and we’ll be back to the global warming good ol’ days of the Obama years’.
This is a letter of hope.
Always useful to get your excuses in beforehand.
Exactly. Total and deliberate mush.
I’ve got to the point now where these ‘new studies’ from the CAGW gang are becoming white noise or dogs barking in the far distance.
The only thing interesting about them is watching how the weasels are maneuvering.
P.S. Sorry about that insult to weasels.
Huh? If they say its going to rise it is dishonest alarmism, if they say not sure it is dishonest excuses?
Can’t win. That is like arguing with creationists. If there is no warming in the next ten years will you congratulate them?
I love it when alarmists pretend the world started yesterday.
They are being ridiculed because they are so late to the party. The rest of us have noticed the pause 20 years ago and have been predicting that it will continue.
For that sin, you and your heros have been attacking us for years.
Now they proclaim that there may well be a pause for the next ten years but don’t worry, CO2 is still in control.
Za, don’t look at the people (and what they’re saying) rather look at the models. Ten more years of no warming will put temps well below the range of the models. This will mean an epic fail for those models which are already overperforming. (that’s the test for agw theory)…
Hansen promised warming of δ5K by 2020s in US in 1986 (if nothing is done). Emissions are now much larger than 1986. I congratulate him on becoming less alarmed. I don’t congratulate him on his BS.
If there is no warming in the next ten years, I congratulate me myself for the stable climate we have.
I need a capital Δ.
Don’t we all!
zazove: If there is no warming in the next ten years (one of the three “predictions”), then temp will not be following CO2 and you’ll have to take your chart into the CCC (Climate Change Chiropractor) for some more adjustment. Looks like your chart has been to the CCC a lot since 1930.
Speaking of excuses … I believe I should be able to use this extennnnnnnded pause in Warming as an excuse to STOP paying Jerry Brown’s increased gasoline taxes, and carbon trading taxes, vehicle registration increases … and the ADDED $3.00 bridge fares making it $10.00 to cross the Bay Bridge during heavy commute hours !!! No NEED Jerry!! Give me my $$$ back!!!
The $10 is to keep poor people from using the bridge when rich people may need it. Nothing to do with AGW.
Does the $10 relieve congestion?
If not, it is just supply/demand gouging, like raising gas prices before a predicted hurricane. They don’t care about rich people or poor people; they care about making their jobs easier.
Here’s my tip for always winning on the horses, bit like theirs with the weather.
If you back every horse in the race you’re bound to win.
Simples:
James Bull
JB: I thought the same thing, except they are at the crap table betting every number.
Well, after 10 more years of “Pause”, and when the temperatures have started to trend DOWN, perhaps the Warmies will finally be ready to admit the truth; that we’re going into a “Dalton Minimum” style mini-ice age.
They’ll call it a “Hansen Hiatus”.
Hansen Hiannus?
I don’t think that would happen, and I’d be ready to bet on that, should there be a stock exchange that supported that kind of betting.
that kind of betting
============
they are called mutual funds (and climate models). you open 100 new funds each year and randomly choose stocks. Each year you keep the top 50 funds and close the rest.
Over time you will end up with a few funds that are way ahead of the market year after year. You promote the heck out of these to investors as they clearly show you know how to predict winners. You charge a hefty management fee on these winners and clean up.
In reality, you have no skill at predicting the future. Because you chose stocks randomly, your aggregate position goes up and down in sync with the market. But because of your pruning of losers, it makes the winners look like there is real skill involved in the funds you are promoting.
Climate science fails to recognize that this mutual fund “fraud” is the exact same way that climate models are built. The mutual funds have “strategies” to try and outperform the market, but none of them work long term. They only appear to work because of pruning of the losers hides the fact that the winners got it right simply by accident.
If you accurately report all funds, no fraud, just running your gains and cutting your losses. Better to look at yearly accounts than advertising promo.
ferdberple,
You just passed neatly P-hacking and borderlined Bayesian inference. It is not what the result is, it is also from what pool you drew your lottery tickets. Probabilities are an interesting beast.
Please correct me if I’m wrong, but didn’t one or both of them previously say there never was “a pause”?
I guess Man’s greatest impact on Nature is in reporting what Nature is doing.
“the next 10 years of global temperature change will leave an impression of a ‘global warming hiatus”
not to mention the impression that none of the authors has a clue about how climate science works.
Hanson’s note is on the cutting edge of climate research. Warming is not a smooth curve but “stair steps”. Two recent papers document this and propose a mechanism for it (a “store and release” of ocean heat).
Understanding how this works might allow more accurate temperature forecasts over 5-10 year time horizons.
Details here: https://fabiusmaximus.com/2018/01/20/global-warming-in-2017-and-beyond/
Hansen can’t even get a 1999 U.S. surface temperature chart right. Apparently he got it so wrong in 1999, he had to later turn it into a Hockey Stick chart with a completely different temperature profile than the 1999 chart.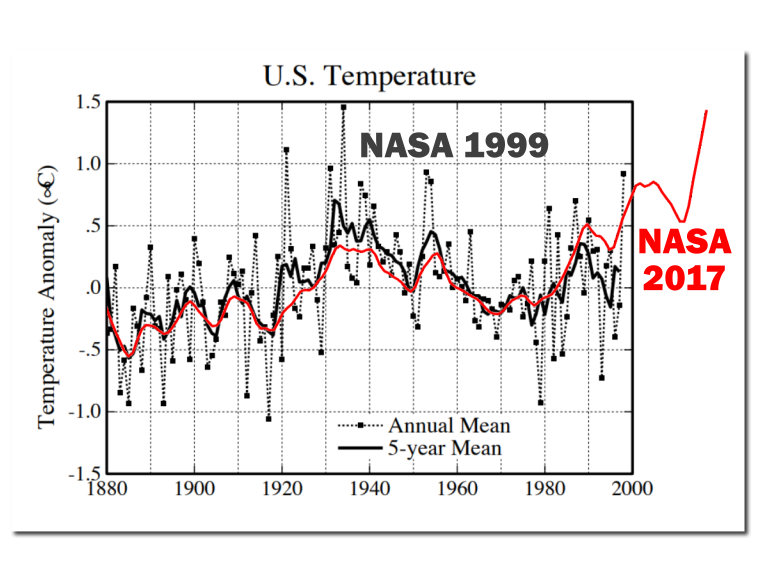
This comparison shows how wrong Hansen got it. The black is the original Hansen; the red is what it had to be changed into to “correct” it.:
It does not look like anything controversial except that for the names on it. Big red rags.
I don’t think focus on personalities is helpful.
After 30 years of nothing but personal attacks against anyone who doesn’t accept the global warming dogma, you are now complaining that we aren’t being nice to your heroes.
Your whines would be a lot more convincing if you had spoken up years ago about the sins of your side.
I didn’t complain and I do not belong to any side except the side of open minds. I hope you are also.
I find the Heller graph funny as hell. Why is what? Because it shows how the warming in the 1900’s happened in the 2000’s.
And we know almost all that red-line warming is basically a result of a statistical handling of station records afterwards. There would be almost nothing besides natural variation without these methods. Torture, and the data confesses. But it is of no use complaining. It doesn’t much matter what the anomaly says if there is practically no adverse effects from the warming satellites can confirm.
Open minds already made up is more like it.
Does anyone really believe that the baseline, “average” temperature MEASURED over the period of 1880-1920, as cited in the abstract of the Jan 2018 paper by Hansen et.al., has an accuracy within +/- 0.5 C of the accuracy of “average” temperature measurements being performed today. Before you respond, please consider multiple factors such as improvements in temperature measurement techniques and instruments, increased area-of-Earth measurements and frequency of measurements contributing to the “average”, corrections (or lack of same) for urban heat island effects where/when temperatures were measured, corrections (or lack of same) for various measurement-location altitudes comprising the “average”, etc, etc.
Was the temperature anomaly data for 1880-1920 as shown in the above graph Karl-ized (excuse me, adjusted) in any way, even for the NASA 1999 data? What might one conclude about “global” temperature trending if the graphed data of 1880-1920 was shifted upward by just 0.5 C?
I look at your page Mr Kummer and you are correct – if there is a 10 year hiatus on ocean heat that is 100x more important and then everyone needs to rethink. Stair steps and hiatus in the atmosphere is obviously small variations overlaid the man-made warming. I think the people who ask for a straight line misunderstand.
No misunderstanding that one of the authors of the paper in question predicted that the West Side Highway in Manhatten would be underwater, windows there taped due to high winds, and fresh water in short supply, by this year.
So Hanson and those that take him seriously, what say you now?
Rah,
The reporter, Bob Reiss, later corrected the quote he gave from his interview with James Hansen. Here is the quote from “Stormy weather“ by Suzy Hansen in Salon, 23 October 2001, with 2 corrections from his 2004 book The Coming Storm: Extreme Weather And Our Terrifying Future. The original date didn’t make any sense.
Absolutely. And people who cherry-pick and manipulate in order to draw neat straight lines do what?
Warming is mild, and local (spatial, temporal) variation dwarfs it.
The revised date of 2030 has the advantage of not being past, but that’s about it. There’s a *zero* percent chance that temperature-driven sea level rise will threaten the highway in just twelve more years.
Further, even if there had been dramatic sea level rise acceleration, it was *still* a stupid prediction. The idea that a city with the resources of NYC would tamely sit by and let the rising sea swallow its infrastructure over a 40 year period is daft. Had the future that James Hansen predicted happened– that obviously is NOT going to happen by 2030–NYC would have adapted.
revised date of 2030
——————–
come 2030 there will be another correction to the article, pushing the date further into the future.
after all, sometime in the future, the highway likely will be underwater. it might take a couple of billion years, but to be fair the prediction is likely correct. only the year was wrong.
Sure…
Just like chess players can redo their moves 10 years after the game.
With half of Hansen’s time period to a drowning New York already past; it was very clear that New York was not drowning soon.
Ergo; an extension of time by “reframing” the original storyline. Just like the internet, the original story still stands.
N.B. None of the “revised” Hansen “New York will drown” timelines has demonstrated any veracity.
That first prediction is just as false as the following extended time till flood predictions. i.e. All of Hansen’s sea level predictions are bogus.
Ok fine. Then 2030 is the year when the lowest portion of the West Side Highway will be flooded now ? It is 2018 and he is talking about the impression of 10 year hiatus? That leaves 2 years for several thousand Gt of terrestrial ice to melt to get to the lowest portion of the West Side Highway. 361.8 Gt of terrestrial ice melt equals 1 mm of global SLR correct?
Got to love the delicate handling of fact by Hansen et al in this paper!
What does an “impression” mean here? Either GMST does not increase for some period, or it increases. It’s physical data, not like interpreting signals from your date on the dance floor.
A job for Brad Keyes, obviously.
It is a simple prediction based on the super El Nino of 2015-2016. He knows from the 1998 El Nino that it is unlikely for temperatures to surpass this level for many years. However, he will be wrong. By then the AMO will have flipped and cooling will have begun.
Great line Larry – “It’s physical data, not like interpreting signals from your date on the dance floor.”
Love it.
I want to make sure that I understand this proposal by Mr. Hansen.
This pearl-clutching announcement is in regard to a statistical estimate, not an actual temperature rise, of three-quarters of a degree worldwide, a “rise” which not one of us will be able to feel, sense or detect in any way at all. And it is offered with the 10-year warranty option, too.
However, it overrides Mr. Hansen’s previous statistical guesstimates because it does take into account that the planned/proposed/prophesied warming statistic did not come into effect.
Normally, I would say Mr. Hansen is grasping at straws, that he is trying to stay relevant and trying to keep his job (does he even have one?) but it appears to me that this is more of an ego trip which will result in our being told ‘It is if I say it is!” by Mr. Hansen because our own senses and instruments and other useful observations tell a different story.
I do wish Mr. Hansen would find something else to do besides annoy me. Perhaps he could take up needlepoint. I understand that Rosie Grier, the football player, did needlepoint to relax and focus his mind. It seems to me that Mr. Hansen and Mr. Schmidt need to find a new direction to follow.
Frankly, I don’t believe anything they say. I have read science fiction that was more believable than this nonsense.
I wouldn’t trust that man with knitting needles. He’d knit half a sweater with three sleeves.
And it wouldn’t make you any warmer!
HAHAHAHA OMG John +100
We agree there’s been no global warming for 20 years (except for adjustments).
We now think there’ll be no global warming for another 10 years.
But it’s gonna happen!
But the adjustments will increase!
If 30 years the records will only be paperless.
Your kids and grand-kids won’t know what paper is. They won’t know just how wrong today’s Climate Heroes were.
(And their Notepads and Smartphones will be starving for a recharge. … If the cagwer’s get their way.)
I just love the idea of Nature “conspiring” against former NASA GISS Director James Hansen and current director Gavin Schmidt in their noble task of advancing the fictional Global warming theory. Nature may even go further and produce the strong impression of an actual decrease in World temperatures over the next ten years. I am sure however, that the stalwarts of NASA can draw on their past expertise at NASA to fake up something for us to look at.
So not worry, as we go into the solar minimum next two cycles, they will blame the sun for the reason AGW is not occurring, that or say that policies to limit CO2 worked and that they saved the world from AWG.
Hansen, and the protege Schmidt use the outlandish scare mongering on AGW as an excuse to bloat NASA’s budget for ESD and GISS. When it did not happen as forecasted, then Schmidt started tweaking all the land station measurements with [political] adjustments and made up data where no thermometers exist cooling the past before the satellite record, but the gig is up. Outside the taxpayer funded propaganda, scientific understanding overall accumulates and they know that cannot fool people forever, even with $115 million marketing budget spent there to “educate” the public akin to what North Koreans are told about Kim. A lot of federal agencies used AGW to bloat their budgets, politicians for votes, or afraid to question the same, but for NASA the AGW hype had worked best as excuse for more finding, some at sacrifice of actual space stuff, NASA’s Earth Science Division which hosts GISS extracted $ millions from taxpayers on made-up stuff supported by made-up stuff. If things change and we have global cooling in a decade, GISS will just change tune to study AGC morphed from “climate change” which replaced AGW. The only thing correlated with CO2 is more green plants, and money in NASA’s GISS budget, and Mann made hot air by Schmidt rising above Tom’s Restaurant the corner of W 112th St. and Broadway and Greenbelt, anything else is a spurious correlation at best. But when you have experts and religion basing everything on some forecast which keeps not coming true, who needs the truth?
http://spacenews.com/wp-content/uploads/2015/03/NASA_Earth_Space_Science-Funding.png
JP, they won’t be able to run (and hide) from AGW theory. They’ve been saying catastrophic warming for thirty years now. If AGW theory collapses completely, it will be deemed the biggest false paradigm since the flat earth. (no way that they’ll be able to walk away from that)…
Neurologist Egas Moniz won the 1949 Nobel Prize in Medicine for inventing the lobotomy which was considered the cutting edge state of art operation to cure mental illness. People forget. Hansen is retired. How my young people remember “scientific” global cooling scare from late 1970s and can say decades later they were wrong on short term forecasts? I agree that AGW is the biggest scientific scam of century, but what about lobotomies? People forget. Flat Earth? – my favorite book is Flatland (1884), and hard to convince people in R2 that there existed R3, facts and non facts appeared as religion.
Prediction – the temperature will go up; or it will go down; or it will stay the same. Got it! All the rest is technobabble.
A few years ago they were assuring us that CO2 was so powerful that it had completely swamped all natural cycles.
They’ve hedged so much, they’ve covered their “buts.”
This appears to be a complete acceptance of Professor’s Akasofu’s 2010 prediction. I do hope they will acknowledge his foresight and apologise for their “denial” of his insight. Imagine where climate science could be now if they had all followed the science instead of the grants.
Might be a “hiatus”? What will they say if the some of the cyclical folks are correct and we get 20 years of cold and temperatures dropping 2 C? “We predicted that too and it is CO2” probably.
Probably not. Gore and Mann played that sort of game with the recent cold snaps and got hammered by their own colleagues. (ain’t gonna happen)…
‘….temperatures dropping 2 C? ‘
Highly unlikely, it would take a lot longer for world temperatures to fall that far, but a drop of 0.5 C over the next two decades is plausible. Similar to the 1950s and 60s.
Considering the 30 or so “best” climate models used by the IPCC as the basis for its predictions to Earth’s inhabitants, quite of few of the various models’ programmers are sure to say “Ooops . . . I put in a plus sign where I should have entered a negative sign.”
If CO2 drives climate… And atmospheric CO2 concentration continues to rise faster and faster… And CO2 drives the climate by warming it… Um? How exactly is CO2 driving ANYTHING if it could get warmer, or colder, or do absolutely nothing over 10 years?
It could contribute. It could complicate. It could do very little… BUT IT CAN’T BE ***DRIVING*** CLIMATE CHANGE!!!
There. I feel better now. Thank you.
“it is plausible, if not likely, that the next 10 years of global temperature change will leave an impression of a ‘global warming hiatus’.”
What a ridiculous statement. There is no such thing as “an impression of a global warming hiatus.” Either there is a hiatus or there is none. Impression is for interpreting artwork. Science uses statistics, Their use of nonsensical language is to coverup their failure to predict past hiatus before 2016 El Nino and inability to predict what will happen in next 10 years. “We don’t know what we’re talking about” would be a more sensible and honest statement.
Let me try to restate what they said in that same paragraph in clearer language. They are saying despite the 0.75 W/m^2 energy imbalance over the past several decades due to greenhouse gases, it is plausible or likely that temperature will stop rising in next 10 years due to solar variabllity. The logical conclusion here is solar variability has a stronger forcing than greenhouse gases. Or an alternative hypothesis is Trenberth’s missing heat went to the deep ocean and we don’t know when it will resurface to cause global warming. Maybe in next 10 years, maybe next decades or next century or few centuries. Therefore, the science is settled – climate is chaotic and inherently unpredictable.
the american people won’t be able to understand this, you see. it takes a climate scientist.
climageddon is baked in – only you can’t see it cuz it’s masked by a vast right wing cooling conspiracy funded by fossil fuel denialiststs. but don’t be fooled! it’s like the catastrophic sea level rise that’s masked by sinking oceans – probably with russian collusion.
They know the 2018 La Nina coupled with a SC24 minimum for the next 3 years is going to lower GMST. The lowering station temps are likely to be so dramatic in the next 3 years (with 60’s-70’s like cold temps across the world) that they cannot hope adjust out GISTEMP with the usual go-to homogenizations and infills.
You got it on the nose, and GISS will not be able to keep faking temperature data deviating from RSS or UAHv6, all they can do is cool the past (pre 1978) with more adjustments. Gig is up. 2018 and 2019 and next two decades will likely be cooler and they know enough to know that. La Nina, solar minimum, and maybe a volcano for a few year dip, meetings at NASA for switch of focus for asteroid scare to keep funding going. I wish Trump would direct cabinet execs to stop all this gov spending on propaganda, Schmidt should go, but would appear like a political thing, and return to science.
Dr. Strangelove
They are referring to a period of 10 years duration during which temperatures either remain static or do not rise much. To some folk, and let’s face it, to some folk right here on this site, that would be more than enough evidence to give the confident “impression” of a hiatus. They would be wrong, of course.
10 years is too short a period over which to gain such an impression. Likewise, ‘warmists’ would be mistaken in gaining the impression that the previous 10 years, 2008-2017 inclusive, are indicative of rapid warming just because they were the fastest warming 10 years in the UAH satellite record.
10 years, added to the previous 20 years.
Let’s face it, no matter how long the “hiatus” you will always find an excuse to proclaim it too short a period to be definitive.
““We don’t know what we’re talking about” would be a more sensible and honest statement.”
Well put. Another good one would be “we’re just guessing”.
Wait – is it the hiatus that did occur or the hiatus that did not occur that is going to continue or not continue for the next 10 years?
Good question, Kb.
GISS must be getting very nervous that it will be axed in the FY2019 budget!
And Gavin is looking over his shoulder for ICE. Gavin is an illegal alien from Australia!
Ha ha
I think it’s more likely he knows he can’t keep lowering the past any further to keep the hustle going, couple that with a declining GMST in the next few years, and now this “Hail Mary to 2030.”
IPCC AR6 planners with their CMIP6 have already begun using adjusted downward solar TSI’s in order to a shift the blame away from their failed CO2 hypothesis and onto a weaker than expected solar input.
“SATIRE model. ”
That is so funny..
Is it April 1st ?
We already have the “travesty”, now the satire
We know the whole thing is a sham, but expect to see the SCORN model soon !!
SATIRE, as funny as the MAGICC model that predicts the ” temperature reduction” that would occur with a CO2 reduction.
Lomborg used it to show the Paris accord would lead to a <0.05C temperature reduction.
“Gavin is an illegal alien from Australia”
NO, Gavin is from the UK, send him back there..
WE DO NOT WANT HIM in Australia.
Terribly sorry old chap, but we don’t accept the return of any faulty goods…caveat emptor.
( the buyer alone is responsible for checking the quality and suitability of goods before purchase )
I didn’t pay for him! Take him away!
Scammers never give up. Cover all bases and you will never be wrong.
More moving goal posts…
… even more precious because NASA apparently soooooooo knows what GMST was in 1880.
and knows it to within a tenth of a degree C.
No warming for 10 years no problem .
Do a Hansen… shut all the air conditioning off in government buildings
quote NOAA climate fudge, show the latest The Inconvenient Squeal and wait for the cash to roll in .
It worked once
Re: it is plausible, if not likely, that the next 10 years of global temperature change will leave an impression// of a ‘global warming hiatus’.
Impression? Nature foiling the “hide the decline” gang by “hiding the the increase?” with negative feedback?
Armageddon is just around the corner, but we don’t rule out the possibility that the corner is receding in the distance faster than Armageddon approaches. Either way it’s out fault. Repent now all ye sinners.
The answer to the reason for the projected 10 year pause in the decline is obvious – they expect Trump to be in power for two full terms… and the extra two years are to give them a little time after that to get back to adjusting the temperature records.
“No warming for 10 years ”
Will look hilarious against the models. !
What’s the red line?
If global warming/climate change fails to produce any actual warming/change, is it still dangerous?
Only the climate change AGENDA.
It certainly is one of the most dangerous things facing modern civilisation.
If the actual temperature does not rise, does that mean all the scary weather will stay away?
Bravo! I applaud Mr Hanson’s persistence to set the record straight. As a simple but interested Geography major from the 1970s, however, I do have some recall and perspective of the winding path of knowledge that got us to this point in time, and I believe it should be obvious, obvious, that scientific methods or data can’t be bent over time to fit one’s outdated hypothesis. He should come clean and say that his original hypothesis was proved wrong and put forth a new one. I am certain that whatever that is, it will be wrong also.
You cannot clean a turd.
But you can roll it in glitter
Looks like there’s no stopping it.
https://junkscience.com/2018/01/claim-sandwiches-cause-global-warming/
Warmists don’t have a clue what future climate will be and are trying to cover all bases. People are catching on to their wishy washy prognostications more than they realize.
..10 More Years of Global Warming Pause (Maybe)….
Hansen is 76. That statement will keep him clear of embarrassment until he is 86. If I were him I would have played it safe and gone for 14 years, taking him up to 90….
Comments on:
Global Temperature in 2017
18 January 2018
By James Hansen, Makiko Sato, Reto Ruedy, Gavin A. Schmidt, Ken Lo, Avi Persin
[Excerpt]
“However, the solar variability is not negligible in comparison with the energy imbalance that drives global temperature change. Therefore, because of the combination of the strong 2016 El Niño and the phase of the solar cycle, it is plausible, if not likely, that the next 10 years of global temperature change will leave an impression of a ‘global warming hiatus’.”
Allan’s comments:
Stop the Presses! These are the very same people who have been telling us for decades that “the science is settled” and that natural variability and solar variability were INsignificant and increasing atmospheric CO2 was the primary, dominant and essentially the ONLY important driver of global temperature. Therefore, they said that global warming would be clearly obvious by now and it would be dangerous. AND NONE OF THIS HAS HAPPENED!!!
They have also vilified us as “deniers”, encouraged their acolytes to threaten and harass us, launched frivolous lawsuits against us, attacked academics who did not share their overheated views and got some of them fired, and generally acted like crazed sociopaths in their fervor to “fight catastrophic global warming” that did not and does not exist.
In contrast, I published an article in the September 1, 2002 Calgary Herald that stated:
[excerpt]
“If [as we believe] solar activity is the main driver of surface temperature rather than CO2, we should begin the next cooling period by 2020 to 2030.”
So now the sociopaths are saying essentially the same thing that I published in 2002!
How are we supposed to deal with this? Should we be gracious, and say “all is forgiven?”
– After tens of trillions of scarce global resources have been squandered on science fiction?
– After entire careers have been built on deliberate falsehoods and skullduggery?
– After tens of millions of people have suffered and died due to lack of cheap, abundant, reliable energy?
I say NO – you warmist thugs shall remain UNforgiven, and you will carry your crimes beyond the grave.
I’m feeling particularly benevolent tonight – tomorrow I may tell you how I really feel!
Regards, Allan
Below is an excerpt from my 2002 Calgary Herald article. “Global cooling starting circa 2020 to 2030” is my only remaining prediction from 2002. I had hoped to be wrong about this cooling. Humanity and the environment suffer in a cooling world.
Our eight other predictions published in 2002 have all materialized in those countries that fully embraced global warming alarmist falsehoods. In contrast, NONE of the global warming (aka “climate change”) alarmists’ scary predictions of catastrophic global warming and wilder weather have materialized.
As a Professional Engineer, I do not lightly publish my opinions. We knew all this more than 16 years ago, and published it with confidence.
Regards to all, Allan
https://wattsupwiththat.com/2016/05/15/a-new-lower-estimate-of-equilibrium-climate-sensitivity/comment-page-1/#comment-2215871
[excerpt}
Kyoto hot air can’t replace fossil fuels
Allan M.R. MacRae
Calgary Herald
September 1, 2002
[excerpt]
The world has been a lot warmer and cooler in the past, long before we ever started burning fossil fuels. From about 900 to 1300 AD, during the Medieval Warm Period or Medieval Optimum, the Earth was warmer than it is today.
Temperatures are now recovering from the Little Ice Age that occurred from about 1300 to 1900, when the world was significantly cooler. Cold temperatures are known to have caused great misery — crop failures and starvation were common.
Also, Kyoto activists’ wild claims of more extreme weather events in response to global warming are simply unsupported by science. Contrary to pro-Kyoto rhetoric, history confirms that human society does far better in warm periods than in cooler times.
Over the past one thousand years, global temperatures exhibited strong correlation with variations in the sun’s activity. This warming and cooling was certainly not caused by manmade variations in atmospheric CO2, because fossil fuel use was insignificant until the 20th century.
Temperatures in the 20th century also correlate poorly with atmospheric CO2 levels, which increased throughout the century. However, much of the observed warming in the 20th century occurred before 1940, there was cooling from 1940 to 1975 and more warming after 1975. Since 80 per cent of manmade CO2 was produced after 1940, why did much of the warming occur before that time? Also, why did the cooling occur between 1940 and 1975 while CO2 levels were increasing? Again, these warming and cooling trends correlate well with variations in solar activity.
Only since 1975 does warming correlate with increased CO2, but solar activity also increased during this period. This warming has only been measured at the earth’s surface, and satellites have measured little or no warming at altitudes of 1.5 to eight kilometres. This pattern is inconsistent with CO2 being the primary driver for warming.
If solar activity is the main driver of surface temperature rather than CO2, we should begin the next cooling period by 2020 to 2030.
______________
So even WITH Karlization they can’t get the temperature to go up anymore?
AND they’re admitting that natural variation is big enough to swamp CO2 forcing?
“the 2017 global temperature remains stubbornly high”. It is a historical record. It cannot change (except by more NASA data fiddling).
Ture in 2028 you can bet they will find a need to ‘adjust’ it downward, if the money is still flowing in their direction.
What’ll they say if the next ten years give the appearance of a little ice age?
The headline states:
But the paper states:
They are not predicting the continuation of a ‘pause’, as the headline of the above article suggests (‘…10 *more* years…’). They are suggesting that it is plausible, for the reasons given, that over the *next* 10 years global temperatures may not continue the pronounced warming trend that has been observed in all global temperature data sets, including satellite TLT (and yes, UAH), over the previous 10 years.
This would not be the continuation of a ‘pause’; rather it would be a whole new ‘pause’ of 10 years duration. It the past 10 years of confirmed rapid warming isn’t indicative of a long term warming trend, then the next 10 years of (possible) zero trend can hardly be celebrated as indicative of a long term a ‘pause’, can it?
Even if you’re ‘rapid’ warming claim was right, and that is one mega size IF, how does the lack of warming fit into the settled science claims which made it clear that increasing levels of CO2 , must equal increase temperature s?
Let’s face it , this classic snake oil style , heads you lose tails I win. No science required, and certainly no good science expected.
Because “increasing levels of CO2” (~2ppm/year) do not = increasing temps WITHOUT natural variation being imposed on top of that trend.
Something that is continually ignored here, unless it involves cooling or more correctly now – a “hiatus” as NV can no longer completely cancel the AGW trend.
Minimum 30 years to judge the true trend of that.
knr
Every data set we have, both surface and satellite lower troposphere, shows rapid warming over the past 10 years. Even UAH TLT (v6), the coolest of all the global temperature data sets, saw its fastest 10-year rate of warming on record between 2008 and 2017, 0.450 ±0.433 °C/decade (2σ). http://www.ysbl.york.ac.uk/~cowtan/applets/trend/trend.html
DWR54: Did you mean that value of 0.450 +/- 0.433 C? First off, three significant digits is a fraud, and a variance of nearly 100% of the value is statistically insignificant.
Would you like to try again?
“Minimum 30 years to judge the true trend of that.”
33 years of ZERO warming out of 39 of the satellite data.
ONLY warming is during El Nino events.
which are ABSOLUTELY NOTHING to do with any human or CO2 increase.
Remove your blindfold Tone !
Unless of course someone is PAYING you not to. !!
“Every data set we have, both surface and satellite lower troposphere, shows rapid warming over the past 10 years.”
It’s not any more rapid than the period from 1910 to 1940.
The only warming in the last 10 years was the recent El Nino.
The fact that you have to include an El Nino in order to create the impression of warming is sufficient to prove that even you know the gig is up.
DWR56,
I’ve been managing an investment fund over the last 10 years. The fund has made a return of 16.374% +/- 15.286%.
I have paid out returns to the investors in the range between 1.088% and 31.660%. Some of the investors got together and then asked me why the huge difference in return payments. I told them not be concerned, I’ve verified the precision to five significant figures.
Do you want to invest in my fund?
Rapid? There is nothing rapid, unless you think slow cooling after El Nino is rapid warming.
When SAT in 2022 turns to be the same or lower than in 2003, there is no way to explain that within the hypothesis that CO₂ is the main driver of climate change.
But they have 10 years to work over the past temperature record.
Sounds to me like we’re dealing with normal variation from the insane number of variables involved. Wait -Wasn’t that said starting years ago by those awful climate deniers?
When oil prices fell while Reagan was President, they cut government funding for energy crap which was budgeted up after OPEC and later 1970s inflation, some energy experts hitchhiked on CO2 and AGW (a theory which was around more than a century) which exploded, DOE, then NASA, later all agencies, USDA designing seeds and climatic hubs to deal with AGW, make your own boat for something to study and make living courtesy of US taxpayers.
Nature does not need to conspire to hide something it never started.
I still don’t understand why NOAA et al use thousands of weather stations to get an average global anomaly, but use ONE CO2 reading from the middle of the Pacific Ocean for global CO2. I have a feeling that if they took daily high and low CO2 readings at those weather stations, the average would be a heck of a lot higher than 401 ppm or whatever it is now. Probably more like 800-1000 ppm, which would totally blow the models out of the water.
Because temperature does change dramatically even over a space as short as a mile or two.
CO2 doesn’t.
Really? You figure that the CO2 concentration over, say, Manhattan or LA, isn’t drastically different away in Yonkers or Santa Barbara?
Do we KNOW this? Were thousands of samples taken worldwide back in 1955, and it was determined that they didn’t vary so much that one sample wasn’t good enough? Where is this study? When was it published?
I understand was it’s assumed to be well-mixed, but is this proven — or assumed?
Measure atmospheric CO2 concentration 2 miles downwind of any active or semi-dormant volcano at any altitude between 10 m and and 1000 m . . . report back what you find.
Do the same for any for any area of active surface geology, such a Yellowstone National Park’s geyser field.
That’s my point. Where is the definitive paper with the evidence showing one measurement is good for the entire Earth?
They know their hypothesis is wrong.
They know their models are overheating.
They know surface average temperature has been going down for 23 months.
They know they are underestimating solar forcing.
When the inevitable happens they want to be able to say: “See? We predicted it. Climate change is still the result of our emissions.”
Anybody with two working neurons and a modicum of skepticism will oppose the hypothesis that CO₂ is a primary driver of climate.
“Anybody with two working neurons…”
We have Nick, Tone, and a few other non-entities, that PROVE your point.
There very obviously aren’t many “climate scientists” (lol) with even two working neurons.
“We have Nick, Tone, and a few other non-entities, that PROVE your point.
There very obviously aren’t many “climate scientists” (lol) with even two working neurons.”
Isn’t it interesting that this denizen, who allegedly possesses “two working neurons” continues to fall back to ad hominem rather than using those ” two working neurons” for something approaching polite scientific discourse on here?
Why is that?
Couldn’t be that the pot calls the kettle black could it? (rhetorical)?
And really it is you who has not “even two working neurons”?
And, just out of curiosity you understand – to what do you attribute your “expertise” such that it far surpasses climate scientists?
This announcement was entirely predictable from Schmidt and Hansen after their paper a short while back saying they needed to adjust forcings in their models to account for lack of warming. They have serious problems matching reality now and they know it. I have no doubt this is CYA and they are going to struggle with keeping the story going.
A further 10 years of “apparent” pause will leave the overall pause at what – twenty five or close to thirty years? Long enough to be “climate” in its own right. And the previous statements about a pause of 15, then 17 years being the limit?
I think Roy spencer probably has the models sussed, with their inability to simulate multi-decadel oscillations. But another 10 years will likely see Gavin Schmidt to a nice comfortable retirement and pension. Buying time. Perhaps a pardon from a future Democrat POTUS?
I think Tommy Wills of Swansea University actually nailed it in the Climategate emails:
“What if climate change appears to be just mainly a multi-decadal natural fluctuation? They’ll kill us probably …”
Indeed.
I vote we volunteer them as test subjects for cryogenic suspension. Poetic justice and an actual contribution to science all rolled into one.
Yes, but with a cryogenic system powered by wind or solar power without grid or battery backup.
“What if climate change appears to be just mainly a multi-decadal natural fluctuation? They’ll kill us probably …”
It has and the AMO, PDO, NAO, AO and ENSO have been promoted for many years.
It is impossible to have a lengthy pause and the recent warming not be significantly influenced by nature.
None of the IPCC models will agree. If they are claiming a pause, they are no longer relying on CO2 as the most significant variable. The rate of change of CO2 will remain unchained over the next 10 years, so how can they blame CO2?
Simple, Objective and Inexpensive Approach to Exposing the CAGW Hoax; Live By The Computer, Die By The Computer
https://co2islife.wordpress.com/2018/01/19/simple-objective-and-inexpensive-approach-to-exposing-the-cagw-hoax-live-by-the-computer-die-by-the-computer/
Punxsutawney Phil might get it wrong sometimes…
Phil is a meteorologist, not a climatologist. Weather prediction six weeks out is imprecise.
I see that reality is beginning to intrude upon the dangerous global warming team. They say ” it is plausible, if not likely, that the next 10 years of global temperature change will leave an impression of a ‘global warming hiatus’.”

Climate is controlled by natural cycles. Earth is just past the 2003+/- peak of a millennial cycle and the current cooling trend will likely continue until the next Little Ice Age minimum at about 2650.See the Energy and Environment paper at http://journals.sagepub.com/doi/full/10.1177/0958305X16686488
and an earlier accessible blog version at http://climatesense-norpag.blogspot.com/2017/02/the-coming-cooling-usefully-accurate_17.html
Here is the abstract for convenience :
“ABSTRACT
This paper argues that the methods used by the establishment climate science community are not fit for purpose and that a new forecasting paradigm should be adopted. Earth’s climate is the result of resonances and beats between various quasi-cyclic processes of varying wavelengths. It is not possible to forecast the future unless we have a good understanding of where the earth is in time in relation to the current phases of those different interacting natural quasi periodicities. Evidence is presented specifying the timing and amplitude of the natural 60+/- year and, more importantly, 1,000 year periodicities (observed emergent behaviors) that are so obvious in the temperature record. Data related to the solar climate driver is discussed and the solar cycle 22 low in the neutron count (high solar activity) in 1991 is identified as a solar activity millennial peak and correlated with the millennial peak -inversion point – in the RSS temperature trend in about 2003. The cyclic trends are projected forward and predict a probable general temperature decline in the coming decades and centuries. Estimates of the timing and amplitude of the coming cooling are made. If the real climate outcomes follow a trend which approaches the near term forecasts of this working hypothesis, the divergence between the IPCC forecasts and those projected by this paper will be so large by 2021 as to make the current, supposedly actionable, level of confidence in the IPCC forecasts untenable.””
For the current situation and longer range forecasts see Figs 4 and 12 in the links above.
Fig 4. RSS trends showing the millennial cycle temperature peak at about 2003 (14)
Figure 4 illustrates the working hypothesis that for this RSS time series the peak of the Millennial cycle, a very important “golden spike”, can be designated at 2003
The RSS cooling trend in Fig. 4 and the Hadcrut4gl cooling in Fig. 5 were truncated at 2015.3 and 2014.2, respectively, because it makes no sense to start or end the analysis of a time series in the middle of major ENSO events which create ephemeral deviations from the longer term trends. By the end of August 2016, the strong El Nino temperature anomaly had declined rapidly. The cooling trend is likely to be fully restored by the end of 2019.
Fig. 12. Comparative Temperature Forecasts to 2100.
Fig. 12 compares the IPCC forecast with the Akasofu (31) forecast (red harmonic) and with the simple and most reasonable working hypothesis of this paper (green line) that the “Golden Spike” temperature peak at about 2003 is the most recent peak in the millennial cycle. Akasofu forecasts a further temperature increase to 2100 to be 0.5°C ± 0.2C, rather than 4.0 C +/- 2.0C predicted by the IPCC. but this interpretation ignores the Millennial inflexion point at 2004. Fig. 12 shows that the well documented 60-year temperature cycle coincidentally also peaks at about 2003.Looking at the shorter 60+/- year wavelength modulation of the millennial trend, the most straightforward hypothesis is that the cooling trends from 2003 forward will simply be a mirror image of the recent rising trends. This is illustrated by the green curve in Fig. 12, which shows cooling until 2038, slight warming to 2073 and then cooling to the end of the century, by which time almost all of the 20th century warming will have been reversed
The hadsst3 data shows global sst temperatures are now below the pre El Nino trend.

For a nice example of the early 21st century trend switch trend see Fig 11
The pause occurred because global and Tropical cloud levels had stopped declining. Previous decline in cloud levels were nothing to do with CO2 and caused ocean warming by increasing solar radiation into them. Ocean warming warmed the atmosphere giving global warming and therefore the evidence SWR was to blame from the sun.
All linked with the AMO and ENSO so other than data manipulation no room for CO2.
Because of the thermal inertia of the oceans there is a 12 year+/- delay between the solar activity driver peak at about 1991 and the millennial temperature peak at 2003/4
“The pause occurred because global and Tropical cloud levels had stopped declining. ”
You have it backwards.
Tropical cloud coverage decreased because there was a reduction in SST’s due the dominating -ve PDO/ENSO regime during that time.
This amounts to retirement insurance for the scammers.
My thoughts exactly!
“Relative to average temperature for 1880-1920, which we take as an appropriate estimate of “pre-industrial” temperature, ”
The basis for their writing is that they took the average temperature from that period that they deduced as “appropriate”.
I question the veracity of the satellite measurements from that era.
“The high 2017 temperature, unlike the record 2016 temperature, was obtained without any boost from tropical El Niño warming.”
Ranking the individual climate zones, I find for 2017:
North Frigid Zone; Rank 2
North temperature Zone; Rank 3
North Torrid Zone; Rank 3
South Torrid Zone; Rank 4
South Temperature; Rank 1
South Frigid Zone; Rank 10
Note that the South Temperature had experienced the warmest year. May be, this is caused by following event noticed by New York Times, April 6, 2017.
“Making matters worse, meteorologists say, is the arrival of a localized El Niño event, a sudden rise in ocean temperature in the Pacific, which this year has happened off the coast of South America.”
Their “analysis” frankly sounds like two undergrads wondering about climate in the lunchroom.
The chart labeled “Global temperature 250km smoothing w/base period 1950-1980” really blows my mind. That adults can take that chart seriously when no decent temperature station actually replicates that data.
Hansen states that the “global energy imbalance” is 0.75% +/- 0.25%. At most, then, it is 1%. The 2017 total eclipse reduced the total solar irradiance by 7.4% for 90 minutes. That is the equivalent of completely wiping out the energy imbalance for a period of 11 hours. That should surely show up somewhere.
First, they use 1880 as the start of industrialization. Fully 94% of all CO2 produced by man has been produced since 1945. The previous 200 years produced the other 6%. The reason that Hansen and climate alarmist like to use either 1880 or 1979 is that it optimizes the temp rate.
The issue is that even though practically no co2 was being produced from 1880-1945 the temperaturee of the earth soared about as much as it has since we produced the 94% of CO2.
This could be interpreted as a proof of the failure of the CO2 model and everytime they go back to 1880 they are emphasizing to those people who examine it that temperatures mystically went up as much as after we were producing all this massive co2 thus providing an argument that the warming now has nothing to do with CO2. If I were them I would stick to 1945. I realize it is hard to give up half the warming for them. It’s much better to say 1.0C then 0.5C if you want to alarm people although the actual alarm is supposed to happen at 4.0C and that would require a massive explosion of temperatures not another 10 year pause.
One wonders how Hansen expects to get to 3 or 4C in 2100 if we keep having pauses and we’ve only gotten 0.5 since 1945. Clearly instead of the 0.5C we’ve gotten in the last 70 years they need the next 70 years to produce approximately 3.5C or 3C or something like that to scare people. However, even someone a little chalenged in math will realize they are not projecting pause for 10 years. They are projecting that temperatures surge every year by massive amounts (much higher than we’ve seen before) for 70 years in a row with no pause.
Put it this way. For the next 80 years till 2100 to get the 3.2C say that they say will kill the planet and all life or whatever the temperature has to rise at 0.4C/decade. Every decade without stopping. It has been going up 0.05C/decade for the last 7 but nevermind that. We need it to go up 8 times that rate WITHOUT pausing.
Now, if it pauses for 10 more years then there will be only 7 decades to get the 3.2 by the end of the century. That means you need nearly 0.5C/decade for 7 decades in a row to get to where they project. We have only gotten 0.5C in 70 years so far. (Not even that if you just look at satellites and take out scurrilous adjustments) We haven’t gotten 0.5C in a decade ever.
So, missing 10 years of warming would essentially kill what is already killed because there is no way to get 0.4C/decade for 8 decades in a row.
This became a big problem because in 1989 when they started doing this temps were going up during the next 2 decades by 0.2-0.3C/decade and given that back then you had 120 years to get to 2100 you could easily get 3.2C in 120 years at the rate we saw in the 1980s and 1990s. In other words the theory and the predictions could plausibly work. You might disagree but at least it was feasible.
What happened is that by having 2 decades of pause and virtually no temperature increase we have now had a much lower rate of warming we’ve seen and it also means that the rate they need to make their prediction has climbed dramaticaly because there is less time to make the prediction and the missing rise has compounded the failure of the theory.
If Hansen is right and I think he is. The AMO/PDO cycle consistent with solar variations shows a negative cycle now that will not end until 2030. In other words if PDO./AMO continue (which the latest el nino validates is still working) then we will see moderate temp change for another 12 years. After which PDO/AMO will switch to a positive and we will get a double wammy.
While this might seem to argue that we will get massive temps in 12 years when PDO/AMO switch we will likely get pretty large increases but I don’t believe we will see anywhere near the 0.5C/decade they require. Thus the theory is screwed still.
Some might say but didn’t we have an El nino in a downcycle of PDO / AMO and so doesn’t that argue that PDO/AMO are failing? No. If you look at the history I predicted this el nino of 2015 because mid-cycle of every PDO/AMO downward phase there is a big el nino. It happened in 2 prior down cycles 60 and 120 years ago. So, that means in fact it appears to validate that ocean cycles and sun cycles are dominating CO2 (remember el ninos are caused by ocean and sun NOT by co2 so using el nino as argument for how co2 is driving temperatures is blatantly wrong.). My point is that Hansen is right. There is very high likelihood that we will see 12 more years of haitus. No amount of warming after that will save this bogus disproved theory.
It’s either going to stay high or go down. Mark my words!
“…it is plausible, if not likely, that the next 10 years of global temperature change will leave an impression of a ‘global warming hiatus’.”
I see. The next 10 years will only leave an “impression” of a warming hiatus. That’s because they intend to do whatever it takes to adjust the temperature record and get rid of the hiatus. It will then exist only as an impression in people’s minds and not in the “official” temperature records. They will likely do this by cooling the past to make more recent temperatures look warmer. Or they may find another trick to use like they did to get rid of the last hiatus. They did that by replacing ocean temperature readings from modern buoys with less reliable readings from ocean-going vessels. The fact that they knew the buoy temperatures were cooler than the ship temperature data was just a coincidence. When your paycheck depends on something, you will find a way…
‘When your paycheck depends on something, you will find a way…’
Don’t underestimate the importance of propping up one’s world view.
I’ve said many times how insidious Global Warming is. It actually hides it’s presence so it can sneak up on us later.
Aye!
You can’t find it this year or the next, or possibly for the next ten years; but it will be back!
As Bug’s would state, what a pair of maroons.
That a former NOAA Director is involved in this fakery is an embarrassment.
That a current NOAA Director is involved in this fakery is a clarion call for NOAA to be investigated, thoroughly; and held to the US Government’s rigid rules regarding changing historical data, Hatch act activism, abuse of science, etc.
How oddly nearly identical to the recent New York Times data abuse charts and their choice of baseline! A coincidence that strogly indicates more government employees leaking/colluding with activists to defraud people and government.
Hansen/Schimdt, “Mark from the Midwest nails the term Hanschimdt” accurately describing activist mentor/flunkey combination:
• Hanschimdts’ purposely use an impossible comparison, then write about this impossible comparison as if it is legitimate.
• No mention is made of the massive global temperature collecting stations disparities across the time periods in question.
• No mention is made of NOAA’s modern new temperature stations, largely sited at locations heavily affected by UHI influences; e.g. airports.
• No mention of Hanschimdt’s aggressive temperature adjustments throughout the entire period.
• No mention, whatsoever regarding the near total lack of temperature recordings within polar latitudes.
• No mention that NOAA expunged higher altitude, rural and higher latitude temperature stations from their temperature collecting network.
• Unsurprisingly, Hanschimdt fail to use error bars for their alleged comparisons. Unmentioned is the several degree range for the 1880-1920 period and the slightly smaller range for modern temperatures.
e.g. “The GISS analysis1 extrapolates observations as far as 1200 km from measurement points, thus covering practically the entire globe”; Hanschimdt’s analysis ignores the range of errors this type of temperature adjustment forces. Instead, Hanschimdt claims a “more accurate estimate”, an of claim given that their smeared temperatures have proven erroneous time and again. What the smear method does accomplish, is temperatures are driven in a direction preferable to Hanschmidt advocacy.
Evidence of this bias is evident in Hanschimdt’s 2017-2015 temperature graph/charts; N.B the higher 2017 temperatures are all located where NOAA’s 1200km temperature smear adjustment method is operative.
NOAA’s 1200km smear method, allows NOAA to use warmer temperatures from any station, including infilled data, to adjust temperatures up to 1200km away.
Now Hanschmidt are reaching snake oil sales pitch levels.
Remember, Hansen’s final years in NOAA had Hansen predict a “super El Nino” every year. Hansen needed those “El Nino” global temperature surges for his CO2 advocacy. Just as Hansen needed cooked data, turned off A/C, “Hear See Speak no evil” Administrations, and compliant employees
Hanschmidt now introduce “ocean thermal inertia”, whatever that is.
Part of the “Now you see it, now you don’t” snake oil pitch.
N.B. No evidence is given for the “ocean thermal inertia” or the two year delay; Another “the heat is hiding in the ocean” magic claim.
N.B. Nor does Hanschmidt explain how hidden ocean temperatures that are well below atmospheric temperatures cause higher Earth surface temperatures at airports and urban centers to increase; again with Hanschmidt showing where waters cooled while raising Earth’s surface temperature. So much for conservation of energy.
Hanschmidt blame “ocean thermal inertia” and “Total Solar Irradiance” (TSI) for the two year delay in temperatures…
Again, Hanschmidt fails to address why declining TSI influence causes temperatures to rise, as evident in their graph.
When these calculations and claims utterly fail in their many models, put the claims into words and make the same sophist claims in alleged research. Another effect from “doubling down” on falsified claims.
• “Therefore”,
• “because”,
• “plausible”,
• “if not likely”, indeed? “not likely!” Do you get the idea they didn’t carefully proofread?
• “next 10 years of global temperature change will leave an impression of a ‘global warming hiatus’”.
Waffle words, leaps of logic, assumed correlations, distractions…
And, most importantly, Hanscmidt absolutley ignores two critical climate factors!
A) Natural variability. Written records clearly demonstrate a very wide range of natural variability. Hanscmidt’s focus on a very short and highly modified modern period utterly ignores history.
B) History clearly records, and paleo reconstructions sans mannian statistics verify; that much warmer periods have occurred during the Holocene.
– a) Hanschmidt therefore disregard Earth’s climate warming since the depths of the last “Little Ice Age” (LIA).
– b) Instead Hanschmidt greedily assumes natural warming since the LIA is anthropogenic once past 1920-1950.
More shady shuffling.
A) Their trend line, is either a running 12 month mean or a running 132 month mean. Doh!
Nether means’s lines expect current temperatures adherence.
Oops! Running out of room in a flaky research paper; gotta lump in all the other absurd claims.
• “conceivably”
• “not a statistical fluke”
• “rather is associated with climate forcings and/or feedbacks”
• “growth rate of greenhouse gas climate forcing has accelerated in the past decade”
• “also concern that polar climate feedbacks may accelerate”
And pigs fly in NOAA la la land.
What Hanschmidt’s lumping everything else into that final paragraph really verifies is:
A) Hanschmidt acknowledge climate ignorance. Settled science does not exists and this alleged research paper is akin to a gambling addict betting quarters and nickels on bets hoping something wins.
B) Note the vague reference to “greenhouse gas climate forcing has accelerated”!
Global greenhouse gas forcing relies almost entirely upon water. Whether in gaseous, liquid or solid form water’s forcing swamps any ability to measure or identify other GHG effects.
C) “polar climate feedbacks may accelerate”!
This is where that vague GHG accelerating forcing leads to; that atmospheric water vapor increases in polar waters will drive significant warming.
Joe Bastardi has discussed this mechanism several times and presented an old table depicting what water vapor changes mean to temperature.
Since the NASA/NOAA Inspector General has utterly failed to hold NOAA officials accountable; it is time that an independent IG is assigned the task.
I suggest one, or more of the military IGs to field teams and investigate NOAA methods, adjustments, manipulation, advocacy, external influences, etc.
It did leave a global warming hiatus, but you non-scientists changed the data to support your political agenda of greed, power and unlimited funding.
Only admitting defeat, but skeptics knew that for years the alarmists had already lost on science, but have tried to hang on with data manipulation.
Nearly 60 years by then with little warming only means no CAGW with no noticeable harm to life on planet Earth. Therefore no urgent action needed, otherwise power and greed will continue to thrive on the gravy train.
The AMO should change negative over the next 10-15 years and when it does global cooling will take place noticeable. Arctic ice will also increase in this situation towards previous high levels.
The ENSO will change to step down global temperatures like it last did in the 1960’s/1970’s.
The global warming is just resting.
The lamest excuse ever heard.
“in which Hansen predicted a possible abrupt drop in global temperature in the near future, caused by ice melt shutting down global ocean currents.”
That ought to produce a dramatic increase in temperatures around the equator as solar energy input has no place to go, combined with a drop in temperature at the poles. Perhaps the average will stay the same while the habitable zone squeezes into two temperate latitudes. GAT (Global Average of Temperatures) says very little about habitability.
I’ve pulled down the NOAA monthly GHCN temp files, and chosen a few stations that I thought might have very little UHI influence, and had long, good records. Here are the stations, and their per-decade increases:
Station USW00093729, Cape Hatteras AP: 0.02 ± 0.05 over 60 years
Station ASN00015590 Alice Springs AP: 0.3 ± 0.05 C over 70 years
Station RSM00024671 Tompo 0.5 ± 0.05 C over 60 years
Station CHM00057461 Yichang 0.0 ± 0.05 C over 60 years
If well-monitored stations (all part of the GSN as well) , from the US to China to Australia to Russia show such stable temperatures over the past 6 or 7 decades, there must be serious outliers elsewhere to boost the average anomaly to the heights it’s at now. That, or the weighting and other adjustments to the data that goes on causes the result.
It would be very interesting to plot each individual station with its anomalies to see what the world data set looks like before it gets all smushed together into a meaningless average. Maybe I’ll take that on over the next few weeks/months just to see how it looks.
From the abstract: ” Ice melt cooling of the North Atlantic and Southern oceans increases atmospheric temperature gradients, eddy kinetic energy and baroclinicity, thus driving more powerful storms”
Where to begin with this physically and observationally challenged statement…firstly, polar freshwater ice melt is likely WARMER than the supercooled saline water it enters. Secondly, Antarctic ice mass and Southern Ocean sea ice extent are increasing. Thirdly, north Atlantic surface temperatures are INCREASING (possibly, but not likely from warmer freshwater melt), but in any event, running counter to the increased “eddy kinetic energy and ‘baroclinicity’ (pressure gradients)” supposedly responsible for the nasty storms.
Let me understand. The Climate Models that are being used are so accurate that they can forecast temperature to +/- .01C 100 years in the future. So if we are to believe this, then the same models in the late 90’s could not predict the climate pause. But none of these models worked for the pause, but we are to trust the entire world economy on them now.. When the climate forecasters can accurately predict 10 yrs out then the world might consider the 100 yrs predictions. Look back at the Nation Geographic stories in 1975 that predicted the pending ice age. That did not work out for them so they jumped to man made global warming (and all its successor name changes). They even adjusted history to prove their models true. BUT someone forgot to to tell the sun and now we are heading for an extended period of cooling..
“The record 2016 temperature was abetted by the effects of both a strong El Niño and maximum warming from the solar irradiance cycle (Fig. 4). Because of the ocean thermal inertia and decadal irradiance change, the peak warming and cooling effects of solar maximum and minimum are delayed about two years after irradiance extrema. The amplitude of the solar irradiance variation is smaller than the planetary energy imbalance, which has grown to about +0.75 ± 0.25 W/m2 over the past several decades due to increasing atmospheric greenhouse gases.5,6 However, the solar variability is not negligible in comparison with the energy imbalance that drives global temperature change. Therefore, because of the combination of the strong 2016 El Niño and the phase of the solar cycle, it is plausible, if not likely, that the next 10 years of global temperature change will leave an impression of a ‘global warming hiatus’.”
I’m sorta feeling a bit ripped off here, as I had figured out most of their points first several years ago, and talked about it many times here at WUWT as it happened from 2014-2017, and many times in summary long before these much more experienced and well-connected guys finally figured it out. Others have also published work since 2014 that closely resemble conclusions of my research that I discussed at WUWT, like the lag from peak TSI to peak SST, and its relationship to ENSOs.
My comments about my solar-terrestrial research work here were often received with malice and ridicule for several years from self-satisfied sun-earth ‘expert(s)’, but now it must be OK if these official ‘experts’ can talk about the same things without the usual critic(s) carping about these guys saying it.
Maybe my critics have finally gotten it through their heads that I’ve been right all along. Anyway, it is nice to see that others are finally catching on now about TSI. That is the point of my WUWT participation.
But it’s well past time to set the record straight – because I was there, here, before the so-called ‘experts’!
How about that no sunspot low TSI cooling this winter!? Cosmic ray clouds didn’t do that…
The cause of the pause was the cause before the pause, and so it will be again – solar activity.
I’ve been working on something that will provide context to current conditions, and to give people unfamiliar with my work some perspective leading up to posting it at the 2018 Sun-Climate Symposium.
Ouch. Your article is gonna leave a bruise. 🙂
1880 to 1920 as representative of pre-industrial temperatures? That’s a pretty tall glass of water.