From the UNIVERSITY OF ARIZONA and the learn Liebigs Law before you make unsupportable claims department, comes this laughable paper that was conceived by the author, Valerie Trouet, at her parents house while reading the weather section of the newspaper. The headline of the press release says it all; alarmists trying once again to make a case for “extreme weather” in the present. But, this paper has at least two fatal flaws, read on to see why.
Jet stream changes since 1960s linked to more extreme weather
Increased fluctuations in the path of the North Atlantic jet stream since the 1960s coincide with more extreme weather events in Europe such as heat waves, droughts, wildfires and flooding, reports a University of Arizona-led team.
The research is the first reconstruction of historical changes in the North Atlantic jet stream prior to the 20th century. By studying tree rings from trees in the British Isles and the northeastern Mediterranean, the team teased out those regions’ late summer weather going back almost 300 years — to 1725.
“We find that the position of the North Atlantic Jet in summer has been a strong driver of climate extremes in Europe for the last 300 years,” said Valerie Trouet, an associate professor of dendrochronology at the University of Arizona Laboratory of Tree-Ring Research.
Having a 290-year record of the position of the jet stream let Trouet and her colleagues determine that swings between northern and southern positions of the jet became more frequent in the second half of the 20th century, she said.
“Since 1960 we get more years when the jet is in an extreme position.” Trouet said, adding that the increase is unprecedented.
When the North Atlantic Jet is in the extreme northern position, the British Isles and western Europe have a summer heat wave while southeastern Europe has heavy rains and flooding, she said.
When the jet is in the extreme southern position, the situation flips: Western Europe has heavy rains and flooding while southeastern Europe has extreme high temperatures, drought and wildfires.
“Heat waves, droughts and floods affect people,” Trouet said. “The heat waves and drought that are related to such jet stream extremes happen on top of already increasing temperatures and global warming — it’s a double whammy.”
Extreme summer weather events in the American Midwest are also associated with extreme northward or southward movements of the jet stream, the authors write.
“We studied the summer position of the North Atlantic jet. What we’re experiencing now in North America is part of the same jet stream system,” Trouet said.
This winter’s extreme cold and snow in the North American Northeast and extreme warmth and dryness in California and the American Southwest are related to the winter position of the North Pacific Jet, she said.
The paper, “Recent enhanced high-summer North Atlantic Jet variability emerges from three-century context,” by Trouet and her co-authors Flurin Babst of the Swiss Federal Research Institute WSL in Birmensdorf and Matthew Meko of the UA is scheduled for publication in Nature Communications on Jan. 12. The U.S. National Science Foundation and the Swiss National Science Foundation funded the research.
“I remember quite vividly when I got the idea,” Trouet said. “I was sitting in my mom’s house in Belgium.”
While visiting her family in Belgium during the very rainy summer of 2012, Trouet looked at the newspaper weather map that showed heavy rain in northwestern Europe and extreme heat and drought in the northeastern Mediterranean.
“I had seen the exact same map in my tree-ring data,” she said. The tree rings showed that hot temperatures in the Mediterranean occurred the same years that it was cool in the British Isles — and vice versa.
The part of an annual tree ring that forms in the latter part of the growing season is called latewood. The density of the latewood in a particular tree ring reflects the August temperature that year.
Other investigators had measured the annual latewood density for trees from the British Isles and the northeastern Mediterranean for rings formed from 1978 back to 1725.
Because August temperatures in those two regions reflect the summer position of the North Atlantic jet stream, Trouet and her colleagues used those tree-ring readings to determine the historical position of the jet stream from 1725 to 1978. For the position of the jet stream from 1979 to 2015, the researchers relied on data from meteorological observations.
“There’s a debate about whether the increased variability of the jet stream is linked to man-made global warming and the faster warming of the Arctic compared to the tropics,” Trouet said.
“Part of the reason for the debate is that the data sets used to study this are quite short — 1979 to present. If you want to see if this variability is unprecedented, you need to go farther back in time — and that’s where our study comes in.”
With the discovery of much older trees in the Balkans and in the British Isles, Trouet hopes to reconstruct the path of the North Atlantic jet stream as much as 1,000 years into the past. She is also interested in reconstructing the path of the North Pacific jet stream, which influences the climate and weather over North America.
###
The paper: https://www.nature.com/articles/s41467-017-02699-3 (open access)
Recent enhanced high-summer North Atlantic Jet variability emerges from three-century context
Abstract
A recent increase in mid-latitude extreme weather events has been linked to Northern Hemisphere polar jet stream anomalies. To put recent trends in a historical perspective, long-term records of jet stream variability are needed. Here we combine two tree-ring records from the British Isles and the northeastern Mediterranean to reconstruct variability in the latitudinal position of the high-summer North Atlantic Jet (NAJ) back to 1725 CE. We find that northward NAJ anomalies have resulted in heatwaves and droughts in northwestern Europe and southward anomalies have promoted wildfires in southeastern Europe. We further find an unprecedented increase in NAJ variance since the 1960s, which co-occurs with enhanced late twentieth century variance in the Central and North Pacific Basin. Our results suggest increased late twentieth century interannual meridional jet stream variability and support more sinuous jet stream patterns and quasi-resonant amplification as potential dynamic pathways for Arctic warming to influence mid-latitude weather.
Below are a few of of the figures from the paper and press release.
First the press release showing the author coring a tree. Maybe you didn’t notice the scientific dysfunction going on in full display but I did.
Note which side of the tree she’s taking a core from, and note the branches above her are either non-existent or growth stunted.

Why that tree? Maybe it’s because this “climate scientist” doesn’t understand the most basic bit of science about plant growth known as Liebigs Law of the Minimum. It’s not referenced in the paper at all.
I covered this law before on WUWT in relation to the Yamal “tree ring circus” of Briffa, Mann, and company claiming that trees (and tree rings) are accurate thermometers of the past, they aren’t and the reason is simply explained by Liebigs Law of the minimum:
A look at treemometers and tree ring growth (excerpts)
I touched on the idea of trees used for dendroclimatology being rain gauges before: Bristlecone Pines: Treemometers or rain gauges ? There has obviously been years of drought when trees also did not grow as much, so how do we separate temperature and moisture in the growth analysis?
But, right now what I really want to introduce readers to is Liebig’s Barrel.
…
Liebig’s Law of the Minimum, often simply called Liebig’s Law or the Law of the Minimum, is a principle developed in agricultural science by Carl Sprengel (1828) and later popularized by Justus von Liebig.
It states that growth is controlled not by the total of resources available, but by the scarcest resource (limiting factor). This concept was originally applied to plant or crop growth, where it was found that increasing the amount of plentiful nutrients did not increase plant growth. Only by increasing the amount of the limiting nutrient (the one most scarce in relation to “need”) was the growth of a plant or crop improved.This principle can be summed up in the aphorism, “The availability of the most abundant nutrient in the soil is as available as the availability of the least abundant nutrient in the soil.”

Liebig used the image of a barrel—now called Liebig’s barrel—to explain his law. Just as the capacity of a barrel with staves of unequal length is limited by the shortest stave, so a plant’s growth is limited by the nutrient in shortest supply.
Liebig’s Law has been extended to biological populations (and is commonly used in ecosystem models). For example, the growth of an organism such as a plant may be dependent on a number of different factors, such as sunlight or mineral nutrients (e.g. nitrate or phosphate). The availability of these may vary, such that at any given time one is more limiting than the others. Liebig’s Law states that growth only occurs at the rate permitted by the most limiting. For instance, in the equation below, the growth of population O is a function of the minimum of three Michaelis-Menten terms representing limitation by factors I, N and P.

It is limited to a situation where there are steady state conditions, and factor interactions are tightly controlled.
…
The point I’m making with all this is: If “the total growth response of a tree is the product of all environmental factors”, and forest modelers have to separate temperature and precipitation diameter increments, plus create different models for different forest regions, how can then one accurately divine temperature over millenia from width analysis of tree ring growth from trees in a single region?
Or for that matter, how could anyone disentangle all the elements (temperature, precipitation, solar, shade, nutrients, etc.) and tell us it’s a proxy for the jet-stream position? The answer is: they can’t.
The task is hugely full of uncertainty. And when the lead researcher cores a tree that has one side that has obviously been shaded by another adjacent tree, as seen in the press release photo, that introduces a bias that has absolute nothing to do with the jet-stream, temperature, and precipitation. If Truett pre-selected trees that looked like, which she seems to be doing in the photo, she’s no better than the flawed science of the Yamal fiasco where a single tree biased the entire temperature record.
Further, it seems she didn’t pay attention to recent literature, such as Briffa and Melvin, 2011 and Brienen et al., 2012a,b
Basically, older trees grow slower, and that mimics the temperature signal paleo researchers like Mann look for. Unless you correct for this issue, you end up with a false temperature signal, like a hockey stick in modern times. Separating a valid temperature signal from the natural growth pattern of the tree becomes a larger challenge with this correction.
…
Dendrochronologists observed that the older a tree was, the slower it tended to grow, even after controlling for age- and time-driven effects. The result is an artificial downward signal in the regional curve (as the older ages are only represented by the slower growing trees) and a similar artificial positive signal in the final chronology (as earlier years are only represented by the slow growing trees), an effect termed modern sample bias. When this biased chronology is used in climate reconstruction it then implies a relatively unsuitable historic climate. Obviously, the detection of long term 15 trends in tree growth, as might be caused by a changing climate or carbon fertilization, is also seriously compromised (Brienen et al., 2012b). More generally, modern sample bias can be viewed as a form of “differing-contemporaneous-growth-rate bias”, where changes in the magnitude of growth of the tree ring series included in the chronology over time (or age, in the case of the regional curve) skew the final curve, especially 20 near the ends of the chronology where series are rapidly added and removed (Briffa and Melvin, 2011).
Or this one:
A likelihood perspective on tree-ring standardization: eliminating modern sample bias
J. Cecile, C. Pagnutti, and M. Anand
University of Guelph, School of Environmental Sciences, Guelph, Canada
NONE of those papers are in her list of citations which you can view here: https://www.nature.com/articles/s41467-017-02699-3#Bib1
It seems she was as good at selecting references as she was trees.
With this kind of incompetence, she ends up with garbage data, and the output becomes little more than a statistical coswallop based on her own beliefs and uncorrected biases.
It’s science, but not as we know it.
Here’s the “output” of her paper:


Why should only good scientists publish papers? We need more diversity. This paper is a step in this direction.
Plot the jet travel miles of leonardo dicaprio versus extreme weather that would be an interesting paper in the spirit of diversity. It’s all his fault.
Yes, research like this is the same as having a lot of poor students in your class. They shift the curve and make the good students look even better. Real science stand out like diamonds in pig poop amongst this sort of nonsense.
Yeah, but then the overwhelming majority of dumb students can easily gang up on the good students and beat the crap out of them if they don’t fall in line and stop making the bad students look bad.
Which is, when you think of it, pretty much what has happened in ClimateScience™.
Just wondering where is the impact on the tree ring growth due to the increase in CO2? Not insignificant yet no mention or adjustments to her “data”.
I wonder how, with the meanderings of the jet stream, that they figure that they have an almost 300 year record of the position of the jet stream. It can meander quite a bit and over and over during a growing season in Britain. This goes into the round file of really, really, really reaching for the data you want, regardless of the source or indirect derivation or pretending. Next, they will reconstruct the history of the planet from growth rings.
Exactly, Higley!
If she spent any time at all paying attention to the position of the jet stream (or streams, as sometimes the flow is split) she would know that it is a relatively rare event for the jet to become locked into a particular position for more than a few days or weeks at a time.
There are years where the jet alternates between a zonal flow, mostly west to east, and a more convoluted pattern, with digging troughs and building ridges.
Other years the amplitude seems more steady, and the whole pattern shifts eastward over time.
Sometimes there are cut off lows that stay in one place for a while, and occasionally a long while.
I have noted occasions where a cut off low will travel in a retrograde direction.
And all of these patterns are intermixed with each other in what I am fairly certain is a more or less random pattern…no two years are exactly the same all over the Earth, although often one year matches another in a particular location, or broadly matches a certain type of pattern.
On top of everything else, there are sometimes incursions of tropical weather.
In fact, there are a number of factors that are not likely at any time but are sprinkled here and there over time and over space on the earth.
And they all interact in various random ways.
And then there are known long term changes that others have noted…increasing CO2, various factors relating to human influences, and the fact that three hundred years ago we were in the LIA and now are not in it anymore.
Fact is, we have drought indices that go back a very long way, and we can see that droughts are not getting more frequent or severe in the US.
We can see that the same is true of flooding.
If she studies dendrochronology she ought to be an expert in changes in the drought monitor over time, and know like the back of her hand the various long term and short term patterns and trends regarding floods and droughts.
Why is it that climate scientists are always writing papers that ignore all that has been elucidated previously?
Why do they all seem mostly or completely ignorant of what is known of past trends and data that anyone can look at any time they want?
Why do they all seems so incredibly ignorant of even the relevant research in their own field of study, both new and old?
Any theory has to account for all that is known.
Take a tunnel visioned snapshot and extrapolating it out to the whole world and all of time is not scientific, it is jackassery.
People that do these things are not scientists or educators, they are opinionated indoctrinators.
Trees can only tell you when they were growing and not growing….they can not tell temps….any temp history claimed from trees is f a k e news
“Trees can only tell you when they were growing and not growing”; Trees can not tell you why. Is it temp, rain, winter snow, Sunshine, CO2, undergrowth, etc? Many variables and little sense of their quantative control.
Mann says trees react to temperature. Trouet says precipitation. Theynare both right, and there both of their conclusions are wrong.
If the press was on our side, this “flexible fantasy proxy” disclosure could completely discredit the hockey stick in the minds of everyone not mesmerized by their unbending faith in the Church of Omnipotent Greenhouse in Carbon.
I hereby declare (through no authority of my own) that tree rings will hence be known as “The Flexy Proxy”.
Can I get an Amen?
(crickets chirping)
Climatology is multidisciplinary: Dendrology, zoology, meteorology,etc. all with a heavy dose of statistics. Seems easier than it should be to point out inconsistencies between the constant march of climate conclusions and the standard procedures required by each individual discipline.
multi-undisciplinary?
A semblance of a correlation and a consistent with model that is a feature of post-normal science.
Much ado about nothing.
Which is why a similar jet stream formed around 1977, pretty much the coldest period in 80 years or so in the NH (ie, since the 1940’s)

That January 1977 jet stream in the illustration looks a lot like the position of the jet stream today, dipping down into the eastern part of the U.S. bringing arctic cold with it.
The “normal January” jet stream is a joke. That might be where part of the jet stream is located for a few days or weeks, but the location and shape of the jet stream constantly changes position, so there is no “normal” static jet stream.
There may be an average position, like there is an average temperature, or average rainfall, but what is “normal” is for all of these things to vary constantly.
It may be that the average position is the one least likely to occur, like average rainfall years may be very unusual, with most years being somewhat above or below the average.
The average temp at my house occurs for a few minutes on some of the days of the year…half the year it never gets that cool, and half the year it is only that warm in midafternoon.
From the point of view of a biologist:
Tree growth is an accurate reflection of the climate. Indeed, the flora *is* the definition of the climate.
Around here, people tend to think of climate as a huge admixture of weather records. At least 30 year series of temperature, rainfall, flooding, droughts, and on and on.
But plants already do all the integration of all the weather variables for us. In a very real sense, what is growing and where tells us the climate.
This reminds me of an incident on a field biology outing on the seashore. One student saw a crab foraging in the sea grass. She called the the Prof. over and asked “What is it?”.
The Prof replied: “Never mind what it’s scientific name is. That tells you nothing. Look at him. Where is he? What is he doing? He is living in the tidal grass. He is feeding off insect like critters living on the grass stalks. He is having a ball! That tells you who he is.
In the same way, what is the climate? Look around you, see what is growing. That is your climate.
Not really Tony….say a tree grows for 5 months….did it not grow the other 7 months because it was too hot? or too cold?
If you can not figure that out I can not help you. We must observe, but we can not do so from the point of total ignorance or abject stupidity.
This reminds me of a parable from computer science.
In the Artificial Intelligence Lab:
Student is painstakingly deprogramming a Neural Network, Professor sees this activity.
Professor: “Why do you deprogram the Neural Network?”
Student: “I want the neural net to have no prior data to process”
Professor: {Closes his eyes!}
Student: “Professor, why do you close your eyes?”
Professor: “I want to have no prior knowledge of what is in this room.”
Student: Is Enlightened!
Latitude, the hot/cold question? I am surprised by you, even after all this time you should know better, of course it was too hot! There is only one reasonable conclusion. /sarc
Of course Tony avoided the question…..
He couldn’t figure it out either…..but at least we got a cute parable out of it
@ Duncan Smith
Oh Please
Latitude can not determine if the trees went dormant because of hot or cold. OK, fine.
Are the trees heat tolerant, or cold tolerant? Look around! Are the other plants on the area heat tolerant or cold tolerant.
There are three possibilities:
1) It gets hot, the flora are heat tolerant, Cold would kill them.
2) It gets cold, the flora are cold tolerant. Heat would kill them.
3) Your neural network got deprogrammed.
I have a wonderful picture I took on the island of St. John in the USVI. The Pic shows an extremely drought tolerant cactus along side a water loving species. Both are at the base of a coconut palm, right at the water’s edge. I always figured that St. John is so quiet and laid back (What century is this?), that the plants do not bother to sort themselves out into their proper environments.
“The Pic shows an extremely drought tolerant cactus along side a water loving species.”
A smallish island. Ever heard of niche broadening?
Tony, just hot/cold? What about….
Disease
Pests
Fire
Water (or the lack there of)
Soil conditions
Snow fall (or the lack there of)
Volcanic eruptions
Nutrients
Sun light (as other tree’s block light as they grow taller)
Etc, etc.
Tree’s make a horrible proxy.
Tony, some common ground…for what it is worth.
USVI? I lived in St Croix (USVI) and Tortola (BVI), three years on each when I was a kid. One side of the island was desert like, the other rain forest like (rain shadow). Went through a few hurricanes that were fun as a kid. Ditches were like water slides. Good memories. Now in balmy Canada.
Trouble is, “climate ” isn’t just temperatures…. or just precipitation.
Its about “how much” and “when” and numerous other variables.
Best growth is attained when the balance of everything suits a specific species best.
There’s also an upper limit. Plants can only use so much of anything. Past around 85F degrees is the upper limit for arctic/temperate/tropical plants.
I didn’t ask you for your help…and frankly don’t need it
Tree growth is not a accurate reflection of the climate…only to tell you if it was or wasn’t conducive to tree growth
Latitude ==> Not to belabor the point but TonyL says that tree growth is an accurate reflection of climate — beneficial, good, harmful, less good — as far as the tree is concerned. You say “a accurate reflection of the climate…only to tell you if it was or wasn’t conducive to tree growth”.
You make his point for him. You are both right.
It may have been a good climate year for the tree and a lousy one for wheat, but we are asking the tree, so “good year” the answer.
Tree rings, obviously, do not tell temperature, nor Jet Stream Position.
Is Tony L the perfect example of a teacher/prof or what? Lots of flannel no substance. He will go far, if he hasn’t already.
Kip…he didn’t say beneficial, good, harmful, less good….he said reflection of climate…a narrow tree ring can be the result of too hot a climate…or too cold a climate….too wet…or too dry…a long winter and short summer……a short winter and summer got too hot too fast…a absolutely picture perfect summer in a drought…..a sloggy raining too much summer……tree rings are not an accurate reflection of climate
Live oaks grow from Virginia down to South Florida and westward through Texas in the southwest US.
They are not a good indication of the climate.
Neither is the corn that covers Iowa in summer.
No, that’s not climate, that’s the biome. As the only species to move large numbers of non-native species into areas where they were not designed by nature to exist, what relevance does looking at what’s growing around you tell anything about what the climate is—especially since temperature is bastardized by averaging everything during an entire growing season?
How Do You Know A Climate Alarmist Is Lying? Their Lips Are Moving
Claim #7: We’ve seen…spreading famine
Response to Claim #7: This is the most absurd claim. CO2 is plant food, and higher CO2 levels result in higher crop yields. That BTW is about as settled as science can be and easily demonstrated in a lab. Higher CO2 is the answer to ending famine, not the cause. If there is famine today it is due to a food distribution problem, not a food production issue. Most likely, the cause of famine is a war, tyrannical government or other man-made causes blocking the delivery of food to needy people.
https://co2islife.wordpress.com/2018/01/13/how-do-you-know-a-climate-alarmist-is-lying-their-lips-are-moving/
little more than a statistical coswallop based on her own beliefs and uncorrected biases.
So she acted like a ‘good ‘ climate scientists , started with the result she needed and they got the ‘data’ to fit it.
But who needs reality when you have ‘magic’ tree rings.
Is she really trying to claim that the weather is more extreme now then it was during the LIA?
So if we had a other summer like in the year 1816 (the year without a summer) she would have claimed this as a proven case for global warming.?
“By studying tree rings from trees in the British Isles and the northeastern Mediterranean, the team teased out those regions’ late summer weather going back almost 300 years — to 1725.”
But why use unreliable treerings? There are at least five good climate series from Europe going back to 1725 or before: Central England 1659, De Bilt, Netherlands 1701, Bologna, Italy 1716, Uppsala, Sweden 1722, Padua, Italy 1725.
But perhaps reliable data was not what they wanted….
Yes that what l was also thinking. Europe have the best long term weather records on the planet.
So why would you not use this.?
TTY
Yes, and the EU taxpayer, including me, funded a highly detailed examination of those very long lived records that You cite. They are freely available
http://www.isac.cnr.it/~microcl/climatologia/improve.php
The paper under discussion is interesting, but like many here I am bemused as to why the author did not use the highly detailed information that is available, without the need for complex examination of trees, which are highly susceptible to their micro climate.
Perhaps someone could ask the author? There must have been a valid reason.
Tonyb
Any discussion in the paper about what the jet stream was doing before the Little Ice Age? Maybe the pattern she is seeing, assuming we can rely on her tree ring data (a big if!), is just a return to normal behavior. What evidence is there of any anthropogenic (what a pretentious word for “human”!) influence?
Start with the first statement of the abstract.
What, “more extreme weather events in Europe”?
If this statement is not shown to be factual then the whole paper is garbage from its conception. Causation without correlation! Many other hurdles follow from this kindergarten concept to anything even remotely scientific!
Garbage activist crap!
Another “unprecedented” claim, this time by an Associate Professor who obviously also studies the “History of Now”.
I’d advise Valarie to consult someone in the Geology Department to ascertain whether the earth’s history goes back further than the BRIT chronology. /sarc
“Unprecedented” is the key word. Without it, this doesn’t get a high-profile journal, if published at all. Pity really. Someone ought to document the use of the U word in the literature. I predict that it is overused.
Yes, Jit, the overuse of the word is unprecedented.
the new definition of “unprecedented” is not in my life time.
I have cored thousands of trees on my woodlot to establish a cut control, or a sustainable harvest over a rotation. I found I could pretty much come up with any result I wanted, merely by observing in advance a slightly different compass heading and distance to the trees I wanted to measure. Where you put your plot determines the data and in my particular case, I always wanted evidence of an abundant forest that grew the quickest. Most of you can probably figure out why.
I was the lead compass man, pulling the chain, and plotting the course. It is supposed to be random, and probably would be if done by an unbiased person. But I was of course looking for the fattest trees growing in the best medium. Those site index conditions can usually change drastically within 25-50 feet and and still be within the margin of error of where a plot center should be. That can usually be seen within 100 feet of the plot center by observing the crowns, and then finally veering slightly in the direction I wanted to stop at the 300 Ft grid.
With finding the best trees within a 50 foot radius accomplished, I could then statistically prove whatever growth rate I wanted (within reason) as well well as a ground suitability site index which would show projected growth rates. That could all change within 15-20 feet, since a big fat Fir tree could be growing on a much more suitable mineral soil site less than a half stone throw away. Or a big fat Spruce tree could be growing within the Prism Radius, just because it was situated in a hollow shallow filled with organics that had triple the surface water available within that 15-20 feet because it collected the surface runoff. Hence why a Spruce tree was growing there.
When it came to coring the trees within the Prism Radia, I would always select the south side of the tree which of course collected more sunlight. The Tree Ring count would always be the same whatever side you drilled the tree from, but the widest rings would usually be on the south side, obviously. Trees are drilled at DBH (Diameter Breast Height) so by picking the plot, and the site index, and then just drilling the tree on the south side, I was able to prove statistically that when all the plots were averaged and entered into a computer program with all the other data such as height, DBH, disease, species etc, that this particular forest could be growing at almost any rate per year I wanted. I was of course only lying to myself, so no harm was done, and I could also reduce the growth rate of the forest if I did the opposite. My point being is that he or she, who collects and anyalizes the sample, is in complete control of the desired outcome.
Dendrochronology has its place, but certainly not in establishing climate from hundreds of years ago. Maybe in a very broad general sense, but I could also deliver you any climate scenario you were willing to pay for. Beware of hucksters with tree rings trying to sell you on a narrative.
Earth, you just hit on the biggest secret of treerings
You can tap 20 trees..all within 20 ft of each other…and end up with 20 different ring series you can’t even match up
Tony L
“Never mind what it’s scientific name is. That tells you nothing….” Lots of biologists turning over in their graves over that statement. Harvey took out some very old live oaks of uncertain age. Century old pictures look the same. Suspect lots of variation, forestry and botany types seem to avoid trying to age these.”
Knew somebody that did not know what the crab was, threw it in the harbor. It was a land crab, probably drowned.
Try this one, actually looks like fusion of several trunks.
https://www.atlasobscura.com/places/the-big-tree
Establishing a dendrochronology laboratory is relatively easy and low-cost, and techniques can be mastered relatively quickly, compared to e.g., establishing a lab to obtain carbon-14 age dates, or a lab to measure precise isotopic compositions as proxies for past temperature. Thus, dendrochronology labs seem to be proliferating. This produces some psychology in reporting from such labs. To be noticed, the relatively new dendrochronology lab (or researcher) has to either demonstrate unusually high quality data measurements and interpretation, or draw research conclusions that raise alarm, while following the politically expected trend. Guess which approach is easier. By contrast, the other two lab examples know that they will be judged by the quality of their data and that there will be few competitors. This tends to make their conclusions more guarded (though not necessarily true).
““I had seen the exact same map in my tree-ring data,” she said.”
So it’s not dependent on ‘climate change’ then.
“Our results suggest increased late twentieth century interannual meridional jet stream variability and support more sinuous jet stream patterns and quasi-resonant amplification as potential dynamic pathways for Arctic warming to influence mid-latitude weather.”
Tail wags the dog science. It’s the meridional and southerly jet pattern that drives the Arctic warming.
from the article While visiting her family in Belgium during the very rainy summer of 2012, Trouet looked at the newspaper weather map that showed heavy rain in northwestern Europe and extreme heat and drought in the northeastern Mediterranean.
i think she forgot what Belgian weather is… really
belgian weather in summer means: never trust that the sun will be there and always have a shelter ready for when it rains if you plan a BBQ…
it’s a moist temperate climate: relative cool summers and mild winters.
to reach – 18°C is rather a rarity then being a norm. It does happen but once every few years. Generally a cold winter or very warm summer does arrive in “clusters”: that means a near cycle of every 12-15 years you got 2 or 3 winters that are cold and summers that are hot.
this has to do with the NAO pattern: it’s global tendency tends to shift a month. each year. now we’re near the end of the positive NAO winter string so next two winters will go up and down and around 2020 again a string of colder winters will occur.
a positive amo signal does weaken these differences though a negative AMO signal does amplfy this
“With the discovery of much older trees in the Balkans and in the British Isles, Trouet hopes to reconstruct the path of the North Atlantic jet stream as much as 1,000 years into the past. She is also interested in reconstructing the path of the North Pacific jet stream, which influences the climate and weather over North America.”
Send lots more money.
Hmm….
The Biologists rejected Darwin and his two theories “On The Origin of Species” and “The Descent of Man” because his method … “Looking At … Rocks [???]” … was consider Heretical by Biologists who espouse the idea that Earth is a living creature maintained and built by living creatures ordained by God … a Biological God … Not A Rock God!
That is why there are Departments of Paleontology and classes in Paleontology.
The Biologists lost a Major War 1860-1920 and we win!
Ha ha
The photo of the tree (& trees) appears to be in a harsh location. Note that one is broken off.
Here is a link to a photo: LINK
The source website has a bit more. These are called “flag trees”, and are wind related. Appearance is somewhat based on the type of tree.
I will note that this whole tree thing has been called “Dendrochronology” for a reason. The idea is based on order of occurrence in time. It seems to me that the further these research types stray from dating wood, the greater probability is of going off the rails.
And the fluctuating Earth’s tilt? Why is magnetic North moving? Don’t we wobble? Bigger picture. Sea level was much higher and not that long ago. Or did the land rise up out of the water leaving inland seas suspended. First salt, then fresh. Bottom line. People are trying to make sense or find patterns/ stability in an unstable world with numerous variables. Like trying to understand confusion or chaos. Forget it! You will go nuts yourself trying to.
I planted a million trees in Scotland in the early 80’s. Theynl all looked pretty much the same back then. They are all different now. Especially the ones they cut down to make room for the wind farms.
There is surely another big reason why this research is nonsense – why use dendrochronology when instrumental data exist for the same period. More than 40 years ago H H Lamb in the U.K. was able to construct daily pressure charts for Europe back to the 18th Century because data on air pressure have been measured at many locations for long period. Surely it should be possible to infer/estimate jet stream positions much more accurately from that source, rather than attempt something very dubious with an unproven connection to tree rings?
First you have to list everything that affects tree health. Then you have to disprove all of them being dominant in your analysis. Then you get to your signal as the last step. If nothing else is discussed but what you want for a signal, then the paper is junk. For example, prove that it is rainfall from jet streams and not west coast U.S. upwelling and morning coastal fog giving the tree moisture, or forest humidity, or canopy coverage preventing desiccation. Broad leaf trees grow faster than pines and provide canopy coverage/shade, so the amount of broad leaf trees in the canopy has to be studied. The flip side of rainfall is desiccation, so soil fertility and slope and shade all have to be determined. You just show up and find a jet stream signal means you don’t have the concept of what a forest is.
Which explains why evergreens and pines are first to colonize open land and grow.
The evergreens are eventually overgrown by a procession of broadleaf species as each crowd out their predecessors.
Young conifers easily outpace broadleaf trees.
Tree deformation shown is most likely from snow and winter glaze blown in winter prevailing winds. and not indicative of rainfall and going to affect the ring growth other than a preference for larger rings with the strike of the dominant foliage direction. Trees are affected by dozens of things, one of them grossly correlated in 80 years of literature is rainfall, and that is about it. If you want to get extreme weather, you are competing with sunlight competition, bug infestations, fungus, soil fertility, duration of snow melt for soil moisture, forest humidity, fires, terrain slope angle and direction of tilt, and on and on it goes affect tree health and growth.
The tree behind the coring lady is bare to branches for significant height.
My first thought, considering younger nearby trees were fully branched 360°, is that that area is subject to occasional avalanches. Occasional serious wind storms are possible.
In spite of assumptions, one never knows who/what or it has fertilized/watered/abused that tree.
https://youtu.be/AihvuZiDhsg
“Only by increasing the amount of the limiting nutrient (the one most scarce in relation to “need”) was the growth of a plant or crop improved.” by Liebig´s law of the minimum
This database demonstrates that most tested plants improve growth at increased the CO2 levels:
http://www.co2science.org/data/plant_growth/dry/dry_subject.php
(See the 300 ppm column for results where CO2 is increased by 300 ppm)
By Liebig´s law, that database kind of demonstrates that CO2 is currently a limiting nutrient for plant growth.
Fossil fuel seems to be the greenest energy source – it actually makes the earth greener:
Carbon Dioxide Fertilization Greening Earth
“An international team of 32 authors from 24 institutions in eight countries led the effort, which involved using satellite data from NASA’s Moderate Resolution Imaging Spectrometer and the National Oceanic and Atmospheric Administration’s Advanced Very High Resolution Radiometer instruments to help determine the leaf area index, or amount of leaf cover, over the planet’s vegetated regions. The greening represents an increase in leaves on plants and trees equivalent in area to two times the continental United States.
It’s worse than that. She assumes that the he jet stream controls the he “extremes” but nowhere can she prove that, since we have no record of the jet stream other than the “extremes”.
So she is measuring nothing. She is begging the question, assuming get conclusion to prove her conclusion.
The high quality instrumental record is unfortunately off-message showing an incontrovertible decrease in frequency of extreme weather events and hurricanes. So what to do for a snowflake millennial ecofasc1st not wanting their pure and simple minds polluted by scientific facts? Answer – ignore the instrumental record in favour of a cooked-up tree ring proxy that gives reassuring confirmation of the only acceptable view – climate is deteriorating and its worse than
weout dear leaders thought.In order to determine that what is happning is unpresidented one would have to compare the tree ring data with tree ring data from the Medieval Warm Period the Roman Warm Period and other warm periods during the Holocene. One would also need accurate weather reports for those same periods. The data to make such comparisons does not exist.
“Unprecedented”. “Unpresidented” is what America was during Obama.
If a tree falls in the forest and lands on a dendrochronologist, and kills them, will anybody notice?
Many moons ago, I lived/worked in Essex. A fairly ‘dry’ part of South East England.
My flat was next to a fairly busy road, bang-next-door to a filling station. The road sloped downhill, I was ‘below’ the fuel station.
Having always been hateful of waste (farming folk *never* throw anything away), I came upon 8 little Leylandii hedging plants at the town market, just as it was closing. I got a Good Deal on those baby trees.
I planted along the low wall that defined my garden from the pavement alongside the busy road then shortly afterward, moved away – renting out the flat. I came back to 10 years later to clear it all out when I sold it.
The little trees, being Leylandii (triffids by any other name) were then not so little but very noticeable that the uphill (top) one was about 8ft tall. The lower downhill one was only about 4ft tall and the ones in between formed a beautiful ‘rising trend. (The guy renting the flat had dared not touch them. Remember, these are all identical clones of each other. Leylandii are hybrids and only grow true from cuttings)
I mentioned this to my mother (the gardener of the family) and straight away said it was (rain) water running off the forecourt of the filling station that caused the effect. The top tree got loadsa water and the bottom tree hardly none.
This was 8 trees, planted about 4ft apart alongside a busy main road and being watered by the (doubtless pollution filled) rain water coming off a petrol station.
I suspect Mademoiselle Trout would have kittens should she have seen that.
She still could, they are nicely visible on the satellite images – go find Rainsford Lane, Chelmsford, Essex.
The fuel station is now a Tyre depot & Domino Pizza, my trees are just above right of the bus-stop marked on the road. There’s another big shrub in the garden, an ultra slow growing prostrate conifer of a name I can’t recall right now.
“…She still could, they are nicely visible on the satellite images – go find Rainsford Lane, Chelmsford, Essex.
The fuel station is now a Tyre depot & Domino Pizza, my trees are just above right of the bus-stop marked on the road….”
What a small world. Chelmsford being my hometown, I know exactly where you mean and will have a wander next time I’m down visiting.
Peta
Nice story.
I thought we had all learnt by now that trees are prisoners of their micro climate. Those that get more water, sun, shade, warmth, wind, crowding etc etc will grow very differently to close neighbours.
Tonyb
It does seem that her tree based methodology is inadequate since it fails to capture reduced jet stream meridionality during the late 20th century warming period.
The jets were indeed more meridional in the cooler period up to the climate shift in the mid 70s but from then until 2000 the jets were more zonal and only since 2000 have they become more meridional again which resulted in the recent temperature pause.
If the jets stay more meridional or indeed become even more meridional then my hypothesis should be confirmed by a commencement of cooling.
If the jets become more zonal then warming would resume.
http://joannenova.com.au/2015/01/is-the-sun-driving-ozone-and-changing-the-climate/
Still, nice to see the jet streams getting more attention after my going on about them for the past ten years or so.
‘….my hypothesis should be confirmed by a commencement of cooling.’
It has already begun in the Southern Hemisphere and extreme mid latitude weather is proof of your theory.
‘If “the total growth response of a tree is the product of all environmental factors”, and forest modelers have to separate temperature and precipitation diameter increments, plus create different models for different forest regions, how can then one accurately divine temperature over millenia from width analysis of tree ring growth from trees in a single region?’
You chop down the trees and saw them up into staves and make a barrel out of them and confirm which one is the shortest. Then rinse repeat with lots of trees and barrels and feed them all into the computer to make a hockey stick out of them. This is Dendro101 stuff.
Quote from article:
“Or for that matter, how could anyone disentangle all the elements (temperature, precipitation, solar, shade, nutrients, etc.) and tell us it’s a proxy for the jet-stream position? The answer is: they can’t”.
I believe that the author is correct in stating that it is very unlikely that tree ring widths can be used to measure the meanderings of the jet stream – particularly if multiple tree species are used in multiple geographic locations. It is is even more likely, if other limiting factors upon tree growth, other than precipitation and/or air temperature, are not definitively ruled out.
However, there are circumstances where one major limiting factor to tree-growth can be identified and it is almost a dead certainty that that this factor has not changed over millennial time scales. One such case is when the trees growth rates (i.e. tree-ring widths) are used to measure minimum air temperature in coastal mountainous regions near the tree-line. It is possible to identify tree species at a specific altitude whose growth is severely limited by changes in nearby sea-surface temperatures.This can be achieved for the simple reason that sea-surface temperatures affects the height of the tree-line – which is itself a proxy for the temperature-limited rate of tree growth at a given altitude.
Use of tree ring widths to measure minimum air temperature at a given altitude and then using this to infer nearby sea-surface temperatures can be shown to be valid by using modern instrumental records. Provided the trees are carefully selected and bench-marked using modern sea surface temperature data, there is no logical scientific reason why these tree ring widths cannot be used a sea-surface temperature proxies in the past.
Please do not throw the baby out with the bath water! Tree ring widths can be used a temperature (or precipitation) proxies if due diligence is carried out.
Who is it that wrote this article and what ar the two fatal flaws precisely?
Was the author actually consulted for her views on the criticism?
This reads like an anonymous and nasty piece of baseless bullying.
The author name is right at the top, under the headline.
Setting aside the nasty and apparently unjustified condescension and patronizing evident in your article ad criticisms, did you contact her and offer her the opportunity to address the “fatal flaws”in her paper?
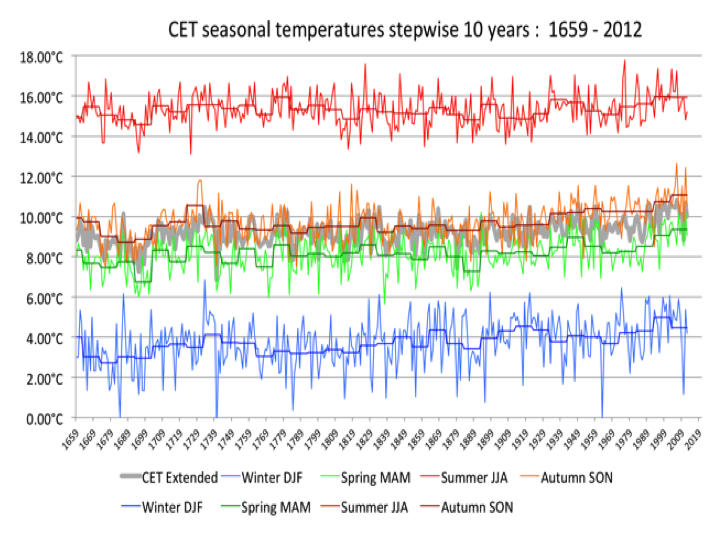
Why would one try to resonstruct the British climate for the last few hundred years from tree rings when we already have the CET extending back further than that?
Stephen I make that point below and link to the data. We know all this so why try to reconstruct using tree rings?
tonyb
Hmmmmm. . . . Without even questioning the correlation that may (or may not) be identified in this paper this is still terrible “science” that does not consider other factors which may be influencing the jet stream and therefore the weather of the northern hemisphere.
Could it be the sun? We know that the sun was far more active than its historical norm over the second half of the 20th century. And given the somewhat brief historical period covered, it would certainly be well out of the norm. That is a well acknowledged fact. Could the solar activity be influencing the jet stream? I am not smart enough to figure that out, but I would wager bigly on the sun impacting the jet stream long before I would consider wagering on mankind’s contribution to CO2 levels in the atmosphere.
Yet this scientist doesn’t even consider that solar activity could explain not only the jet stream shifts, but it could also impact temperatures, cloud cover and therefore precipitation which all have huge impacts on. . . . Wait for it . . . Trees!!!!
Lord help us if this is the future of scientific study.
It’s a tree ring circus with these climate clowns.
I am somewhat bemused at the elaborate methodology of this paper.
 ?w=300&h=225
If the author wanted to know British temperatures they are available from the met office back to the 1600’s.
Rainfall records, for what they are worth, are available from Phil Jones, recently retired from UEA. His mentor hubert lamb in the 1970’s worked out wind directions and speeds back to the 1500’s.
The periods of changeable wind direction can be clearly seen in this data presumably as the jet stream oscillates annually.
There is certainly no sign in any of that of much more severe weather these days
Wind direction is a fundamental driver of weather and climate which we can observe through the mwp and Lia to the modern day.
Incidentally according to Phil Jones and the data, the 1730’s were the warmest uk decade until the 1990’s so this reference to the 1960’s seems misplaced
Tonyb
” the 1730’s were the warmest uk decade until the 1990’s ”
It’s even “worse” in Sweden. In the Uppsala series starting in 1722 the warmest year ever is still 1724.
This is about planting trees. If a person plants 2 trees same size same type, 40 feet apart, they do not grow the same. If a person plants 2 trees, both maples, one 15′ & one 4′, the 4′ will grow faster than the 15′, 4′ will reach the 15′ stage quicker than the 15 reaches a 20′. Eventually they both will be the same size and the 4′ has more of a chance of making it than the 15′, bc of growth requirements. Less water for the 4′ than a 15′, first couple of years to grow. A person will find while digging that Every few feet under ground either horizonal or vertical the conditions change. I landscape, have been watching this for 30 years.
My understanding is that it used to be common practice that when your paper was using data from an area outside your area of expertise you consulted with experts in that field and gave them credit on your paper.
It seems that climate scientists consider themselves to be experts in all areas of science so they don’t need to such consultations anymore.
Here is the reason they did not use instrumental data:
http://onlinelibrary.wiley.com/doi/10.1029/2000JD900300/pdf
A paper based on long instrumental series that shows that temperature variability in Europe has decreased by about 10% in recent times compared to the eighteenth-nineteenth centuries.
Incidentally Phil Jones is one of the authors.
The idea that English summers are getting more extreme in terms of rainfall or drought is laughable.
The long running England & Wales Precipitation Series shows no such thing:
https://notalotofpeopleknowthat.wordpress.com/2018/01/09/is-arctic-warming-influencing-uks-extreme-weather/
That rather invalidates the whole paper I would have thought.
Scaremongering such as this is proof that no real “climate change” problem exists. Endless scrounging around for scraps & even those aren’t there, so just make things up.
When I tapped Maple trees for sap I always put the spike on either south-east or South-West side of the tree. Would go out in the morning or at noon and, on a clear day in March, collect the sap from the buckets on the south-side … they were full. Back out in the late afternoon, around 5PM and the south-west buckets were full, hardly a dribble in the south east buckets. I’ve also felled many trees and looking at the stump it’s clear that the center rings are off-center relative to the circle of the stump … if that makes sense. Let me try again. The stump is round (a circle) but the tree ring center is displaced toward the north. Rings are wider on the south side vs rings are narrower on the north side. I know nothing of dendrochronolgy, but surely this basic feature of growth in my area (Ottawa Ontario Canada) and even more so north of here, has been taken into account in this study? BTW this observation applies more to White Pine than Maple, but the effect is visible in both. Of course White Pine is distinctive being being somewhat lopsided in branch growth — more on the south side of the tree, or in many cases on the Lee side of the tree, or sometimes when near water on the wet side of the tree, or where insulation is an issue on the sunnier side of the tree, or while the tree is growing under the Maplecanopy pretty even all around then when it breaks through the canopy more branches on the south side, …
Or maybe I’ve spent too much time in the bush? 🙂
How many trees did these scientists use in their study? Using tree rings as a proxy for the historic annual temperature of a country or a continent seems foolish to me. Using tree rings to determne the historic jet stream pattern over a country or a continent seems absurd. “A tree ring circus” is a good way to put it, Bruce Cobb.
Though it has been nigh unto 10 yrs since this was published, it appears the Dendrites still haven’t absorbed the implications of it
wattsupwiththat.com/2008/06/13/surprise-leaves-maintain-temperature-new-findings-may-put-dendroclimatology-as-metric-of-past-temperature-into-question/
“The assumption in all of these studies was that tree leaf temperatures were equal to ambient temperatures,” lead researcher Brent Helliker told AFP. “It turns out that they are not.”
http://www.nature.com/articles/nature07031
From the Abstract
We show a remarkably constant leaf temperature of 21.4 ± 2.2 °C across 50° of latitude, from subtropical to boreal biomes. This means that when carbon assimilation is maximal, the physiological and morphological properties of tree branches serve to raise leaf temperature above air temperature to a much greater extent in more northern latitudes.
Since the foliage provides the only interface for the tree, it would be very hard for the tree record any temperature related data since the leaves are kept within tightly bound limits.
Its been shown convincingly that the jet streams moved as a result of ozone depletion.
http://science.sciencemag.org/content/early/2011/04/20/science.1202131?sid=b660ea02-3901-4c11-b4d5-a391e8880825
and here
http://search.columbia.edu/search?q=sciencemag.org&btnG=Go&num=20&filter=0&as_dt=&as_sitesearch=&as_eq=&as_oq=&entqr=0&output=xml_no_dtd&sort=date%3AD%3AL%3Ad1&client=Engineering&ud=1&oe=UTF-8&ie=UTF-8&proxystylesheet=Engineering&site=Engineering&year=2017&template=search&op=Search
hope the links came through.
This has been in the public domain for more than 5 years so should have been assimilated by anybody dealing with jet streams. More sloppy research!
So it must be the extreme jet stream movement in the sixties that made treemometers useles and created the need to hide it.