Guest Opinion: Dr. Tim Ball
The “Bomb Cyclone” of 2018 is another example of hyperbole and distortion designed to scare the public and promote false perceptions.

It followed the pattern of presenting normal events as if they are abnormal. In fact, it was just another “Nor’easter.” It wasn’t even close to the blizzard of 1888, reported in the 1976 U.S. Department of Commerce book “American Weather Stories,” that,
“…cut off and immobilized Washington, D.C., Philadelphia, New York City, and Boston. Snowfall average 40 to 50 inches over southern New York State and southern New England, with drifts to 30 and 40 feet. In Middletown, N.Y., snowdrifts were reported to have covered houses three stories high. The townspeople had to tunnel through the snow like miners, even shoring up the passageways with timber. For 2 days, frequent gale-force to near-hurricane winds accompanied below-freezing temperatures which ranged from near zero to the low twenties over much of the area.”
The “bomb cyclone” extremism followed the outbreak of cold Arctic air that alarmists explained was due to warming. Most people don’t know much about the historic pattern of storms so that hyperbole slipped through. However, the illogic of the cold is due to warm, made many scratch their heads. As a result, the apologist in chief, Seth Borenstein offered an explanation.
Frigid weather like the two-week cold spell that began around Christmas is 15 times rarer than it was a century ago, according to a team of international scientists who do real-time analyses to see if extreme weather events are natural, or more likely to happen because of climate change.
This is a classic example of the deception about the deception. Of course, it is likely that cold spells are rarer than a century ago because from 1900 to 1940 there was a more dramatic warming than occurred in the much-hyped 1980 to 1998 period. The remainder of the comment is similar rubbish. What is “real-time analysis”? What warming trend does the cold spell “buck”? The world has not warmed since at least 1998. Why don’t “the team of international scientists” compare the cold spells with longer records, such as those from 1680, the nadir of the Little Ice Age. Whoops, sorry, I forgot the hockey stick eliminated the LIA in their “real-time” analysis.
This level of twisted illogic and extremism is the best thing that could happen, and an inevitable result of the nature and pattern of the deception.
I always wondered what the role of extremists was in a society. They seemed so destructive and serving no observable purpose. Over 40 years, I came to realize their job was to define the limits of new thinking, known as paradigm shifts for the majority. The paradigm shift of environmentalism appeared in the 1960s, given momentum by visual imagery so essential to capturing people’s minds quickly. The old saying that a picture is worth a thousand words is an understatement – it is worth a million words. The image, in this case, was the composite photograph of the Earth taken by a camera held by a human on board Apollo 8 17 (Figure 1).

Figure 1
Catch phrases appeared to underscore the perceptive importance such as “Planet Earth,” “Spaceship Earth,” and the Little Blue Marble.” Our home was a very small finite space with no evidence of human existence. The message was the central theme of environmentalism – we better tread carefully and lightly and limit the number of people because it could only carry so many. It engendered the paradigm shift to environmentalism. As is always the case, a small group saw the financial and political opportunity and seized the moral high ground. As anthropologist Margaret Mead said,
“Never doubt that a small group of thoughtful, committed citizens can change the world. Indeed, it is the only thing that ever has.”
The majority of people were pushed off the moral high ground, and any who questioned were openly and personally attacked. Anthropogenic global warming (AGW) was a subset of the new paradigm of environmentalism. It took the unproved hypothesis that human CO2 was causing warming and set out to prove it. In doing so, the Intergovernmental Panel on Climate change (IPCC) narrowed the definition of climate change, ignored, modified, or created false explanations for evidence that contradicted it. Two early pieces of evidence include the infamous Chapter 8 incident in which Benjamin Santer, as lead author, altered the agreed text dramatically. One of four changes he made included this sentence
“While some of the pattern-base discussed here have claimed detection of a significant climate change, no study to date has positively attributed all or part of climate change observed to man-made causes.”
This became
“The body of statistical evidence in chapter 8, when examined in the context of our physical understanding of the climate system, now points to a discernible human influence on the global climate.”
Dennis Avery and Fred Singer noted in 2006,
Santer single-handedly reversed the ‘climate science’ of the whole IPCC report and with it the global warming political process! The ‘discernible human influence’ supposedly revealed by the IPCC has been cited thousands of times since in media around the world, and has been the ‘stopper’ in millions of debates among nonscientists.”
The second example was the claim that the cooler period from 1940 to 1975 was a ‘dimming’ of solar energy caused by sulfate aerosols from human sources. They determined this by ‘simulating’ the effect in their models. The problem was that after 1975, sulfate levels continue to increase but so did temperature. This technique of tweaking the model to match nature masquerades as validation of the models, but is far removed from reality.
The pursuit of evidence to prove AGW was a treadmill that diverted away from understanding and advance of understanding. Just the focus on temperature was limiting. Now the evidence is accumulating that the AGW hypothesis is incorrect. Many of the claims of impending environmental disasters are not emerging. Aaron Wildavsky identified many of them in his book “But is it True.” Predicted climate disasters, such as an end to Arctic ice in summer, and continued warming, are also failing. Most people are bemused, nonplussed, unsure, but still afraid of potential catastrophe. Their concerns are addressed by the extremists, those who will not face the reality of a failed hypothesis. They can either revisit and revise what they claimed or continue to push the agenda. This can only be achieved by becoming increasingly extreme and illogical.
This is the situation with the AGW claim. They switched from global warming to climate change, but people mostly knew that climate changes. The only option was to exaggerate, but in doing so, they further raised the skepticism. Some knew that the science is never settled, as Al Gore claimed. Many more recognized the illogic of claiming the recent outbreak of cold Arctic air across the US was due to warming. However, many were bedazzled by the “Bomb Cyclone” used to describe a typical US east coast Nor’easter. Sadly, too few climate science skeptics can provide the known scientific explanation for the current patterns of weather.
Middle Latitude Mechanisms

Figure 2
Figure 2 shows the average latitudinal balance between incoming solar and outgoing long wave energy from the North to the South Pole. The points marked Zero Energy Balance (ZEB) mark a very critical boundary in both Hemispheres. It defines the boundary between the warm surplus air of the tropics from the cold deficit air of the polar regions. Notice the point is slightly different in each hemisphere being at approximately 38°N and 40°S because of the different land/water ratios. Approximately 39 percent of the Northern Hemisphere is land, while it is 19 percent in the Southern Hemisphere. The ZEB is coincident with the boundary between the two major air masses that divide the atmosphere and was historically known as the Polar Front. The ZEB is also coincident with the greater change in temperature with latitude known as the Zonal Index. Since wind speed is determined by the temperature and thereby pressure difference is a function of distance it is where you find the strongest persistent wind speeds properly known as the Circumpolar Vortex but more generally known as the Jet Stream. Figure 3 illustrates this juxtaposition.

Figure 3
A similar dome of cold air exists in the Southern Hemisphere except that everything is amplified by that land/water ratio. It is why there is a so-called hole in the ozone over Antarctica and not over the Arctic.
Everything would be simple if the Earth was not tilted on its axis, didn’t rotate around that axis and didn’t rotate around the sun. Just the tilt creates very different seasonal patterns of energy balance. In the Northern Hemisphere, the ZEB migrates from approximately 30°N in the winter to 65°N in summer (Figure 4). The idea of the dome of cold air sitting over the polar regions is essential to understanding the dynamics and impacts of seasonal and longer period climate change.
There are very important boundaries associated with the seasonal positions of the Front.
· The snow line, which significantly alters the area of high albedo seasonally and long term.
· The northern and southern limits of the Boreal Forest.
· The path of mid-latitude cyclones.
· The seasonal prevailing wind patterns.
· The change in ocean surface currents.
· The flight pattern of migrating birds.
· The latitude at which the circumpolar vortex confronts major mountain systems such as the Rockies, the Andes, and the Himalayas.

Figure 4
One of the most intriguing phenomena in nature is the occurrence of sinuosity. Some speculate it is an energy conservation process. Regardless, it is manifest whenever you have a gas or a liquid flowing through a uniform medium. The Jet Stream is a river of fast-flowing air moving through the air. As a result, it develops waves identified by Carl Rossby in the 1940s and known as Rossby Waves (Figure 5).


Zonal Flow Meridional Flow
Figure 5
Relationship Between Rossby Waves, Climate Patterns, and Severe Storms.
Claims of AGW included the prediction that storms would increase. This was incorrect because the major storm systems are mid-latitude cyclones that form along the Polar Front. The intensity of the storms is determined by the temperature difference across the Front. AGW claims that the polar air will warm more than the tropical air. In fact, this would reduce the difference and diminish storm potential.
There are natural conditions that will cause increased storm frequency and intensity.
The problem for the AGW claimants is they are related to a cooling world and the expansion and change in dynamics of the cold air dome. Remember, cold air, which is heavier and denser than warm air, determines what happens. So, an expansion of the dome will cause greater intensity and a different track of the storms. It was a major area of study for Hubert Lamb and more recently Marcel Leroux.
When reconstructing past weather patterns, you must accommodate the gradual change of the seasonal positions of the dome of cold air with long-term climate change. This was the problem I faced when asked to reconstruct the weather patterns Sir Francis Drake would have confronted when he arrived on the west coast of North America in 1579. Here is my map (Figure 6) of the estimated mean summer position of the Polar Front in 1579 in western North America.

Figure 6
The Rossby Wave patterns divide into two groups, 1-4 Waves around the Circumpolar Vortex associated with Zonal flow and 5 to 8 associated with Meridional flow. Zonal flow produces low amplitude waves with NW winter and SW summer winds dominant and relatively stable weather patterns. The 5 to 8 waves associated with Meridional flow are high amplitude with more north/south winds in summer and winter and much greater extremes of temperature and precipitation. This is the condition existing now, so the AGW promoters are correct, it is climate change, but it is not new, and it is due to cooling not warming.
The waves migrate from west to east taking on average 4 to 6 weeks to pass through a location. I used to tell the farmers to watch for a significant change in the weather and anticipate that general condition for the next 5 weeks as an average. This helped them a great deal for seasonal planning. It also helped municipalities and automobile associations in Canada I worked with as they used the data to plan staff and equipment needs for snow and cold in the winter. This pattern is the basis for the Groundhog forecasts of 6 more weeks of winter or early spring.
With Meridional Flow the wave pattern increases carrying outbreaks of cold air much further toward the Equator as with the “Bomb Cyclone,” and warm air toward the Poles. Occasionally, the waves become high amplitude and stalled in a pattern that simulates the letter omega (Ω) on the weather map (Figure 7).

Figure 7
When that happens, the forecasters talk about a ‘blocking high’ because the systems persist for 8 to 12 weeks. This creates prolonged and worrying patterns, whether it is of temperature, precipitation or drought.
It appears that Zonal or Meridional patterns can dominate for long periods such as the climate cycles from a longer temperature pattern, such as the Medieval Warm Period and the Little Ice Age. Two distinctive centuries in this were the 14th century and the 17th century. The transition out of the former and its impact on the human condition was well documented by Barbara Tuchman in her book “A Distant Mirror.” She took a single life of a man who was born in 1300 and died in 1399. The century was predominantly Meridional with seasonal changes so that there were cool, wet summers and warmer drier winters so seasonal differentiation became very difficult. It led to the survival of pathogens and disease-causing crop failures and major plagues. The same occurred in the 17th century. An interesting event was the occurrence of warm winters that again allowed plagues and diseases to decimate the population. It is estimated than in the winter of 1688 1695/96 two thirds of the population of modern Finland starved to death or died from the plague. Samuel Pepys’ records the consternation including the fact that the King ordered citizens to pray for colder weather to make things healthier again.
What we need today are prayers to save us from those who use science and environment to spread falsehoods for political control. As Mencken said decades ago,
“The whole aim of practical politics is to keep the populace alarmed, and hence clamorous to be lead to safety, by menacing it with an endless series all hobgoblins, all of them imaginary.”
Consider this quote from Lowell Ponte’s book The Cooling.”
It is cold fact: the global cooling presents humankind with the most important social, political, and adaptive challenge we have had to deal with for ten thousand years. Your stake in the decisions we make concerning it is of ultimate importance; the survival of ourselves, our children, our species.
Change the single word “cooling” to warming, and the real bomb cycle continues. The book underscores the hysteria and falsehoods of AGW, because Stephen Schneider, a major architect of the warming deception, wrote a foreword;
The dramatic importance of climate changes to the world’s future has been dangerously underestimated by many, often because we have been lulled by modern technology into thinking we have conquered nature. But this well-written book points out in clear language that the climatic threat could be as awesome as any we might face, and that massive world-wide actions to hedge against that threat deserve immediate consideration. At a minimum, public awareness of the possibilities must commence, and Lowell Ponte’s provocative work is a good place to start.
God help us because the AGW crowd won’t. They are too busy helping themselves to another profitable serving of deception.
The only national security threat are those in government and media who espouse such fallacies.
https://www.google.com/amp/s/amp.bangordailynews.com/2018/01/13/the-point/the-climate-is-americas-most-pressing-national-security-threat/
Clip of what the Admiral says in above article….sounds like a coup to me.
… If the Trump White House insists on ignoring the inevitable, the professionals at the relevant departments and agencies have to take it upon themselves to develop real strategies, and put real resources, into keeping the U.S. and its global interests secure far into an uncertain future.
Yeah, sounds like a call for treason to me.
john,
You represent that special kind of stupid the framers of our US Constitution envisioned. Those very smart men wrote in checks and balances to bring accountability to each Federal govt branch by the other two.
Obama’s over-reaching bureaucrats were frequently being checked by the federal courts, and more recently by Congress via the CRA powers to roll back regulations. The EPA, State, Treasury, IRS, Energy Departments are no doubt full of moles from Liberal special interests.
So I agree we need those “professionals” to show themselves in an exercise of unconstitutional resistance, so that we may identify these self-appointed law-makers and then we can throw them out on their keisters.
Apologies to you john if you were merely quoting the clip and those were not your feelings. If so you should be moreful to make clear when you are quoting versus your own words and opinion.
more careful
Merely quoting. Just exposing what the founders envisioned and yes, not only throw them out, but that special kind of treason needs to be addressed.
No apologies needed!
Which makes the use of quotation marks imperative.
I guessed you might have supplied a quote…
But, I read your comment a number of times, then followed the link to see if I could ‘quickly’ find the quote.
I did not find the quoted phrase, before the author’s slick sophistry sickened me. Returning, I mentally agreed immediately with Joelobryan’s comment thought.
Not very much comes close to that incredible storm or the extreme weather of the years around then. Well, except for the extreme weather of the 1930s.
I managed to ignore the hype pretty well and wound up being surprised by the recent nor’easter’s strength. Boston’s barometric pressure matched what they had in the Northeast Blizzard of 1978, but the storm didn’t stall so overall the damage was merely remarkable.
I hope to write a post on the snow storms of 1978 to post in early February.
Did the Blizzard of 1978 (or 1888) occur during a king tide and supermoon like this recent one did?
Lessee, per moonrise times at http://aa.usno.navy.mil/cgi-bin/aa_rstablew.pl?ID=AA&year=1978&task=1&state=MA&place=Boston Feb 6/7, 1978 was close to the new moon, as was the Mar 11/14, 1888 storm.
According to https://www.fourmilab.ch/earthview/pacalc.html , a lunar perigee occurred on Feb 5 21:20 (UTC?) in 1978, and but in 1888 the moon was close to an apogee. (That source also has moon phases.)
So, “spring tides” for each, maybe “king tide” (at least “perigean spring tide”) for 1978.
I remember the Blizzard of 1978. I live in northeast Oklahoma and we had snow three feet deep. The streets in town were impassable.
TA: That Oklahoma storm was not the same storm that set a new snowfall record in Boston in February 1978. The Northeast Blizzard of 1978 formed from an Alberta Clipper moving southeastward and merging with a weak but moisture-rich storm from the Gulf states, resulting in a major nor’easter.
icisil: The early January 2018 “bomb cyclone” reached peak intensity on January 4th, and brought its greatest storm surge at least 2 days after the king tide of the New Years Day supermoon full moon. And when the moon is closest to the earth, the moon is moving through its orbit most quickly. So I think the atsronomical high tide was not exceptional.
A technical note to Ric: I just clicked on the link “Ric Werme’s guide to WUWT” and got a “Privacy error – your connection is not secure” message. Maybe the link should be given an explicit http (rather than https) prefix, or else the server that hosts it should be configured with the appropriate certificate.
Yeah, that’s a problem. I need to talk to Anthony or other person who can change the URL to an odd https one that should work.
or 1993 March ?
The March 1993 storm had lowest central pressure of 960 millibars. The 1991 “Perfect Storm” had lowest central pressure of 972 millibars. The Blizzard of 1888 had lowest known pressure of 982 millibars, but I suspect it could have gotten into the 970s. The early January 2018 “bomb cyclone” had lowest central pressure of 949 millibars, as analyzed by a weather model, and probably accurate within a couple millibars, unlikely failing to actually dip down at least to 953 millibars.
But I don’t think the 2018 “bomb cyclone” was the most intense nor’easter to form in the last few centuries in the Bermuda Triangle, or between the Bermuda Triangle and New England & the Canada Maritimes. This recent storm had its center head to where a warm gyre on the western edge of the Gulf Stream was getting Arctic air from the coldest Arctic air blast to hit the eastern US since January 1994. The satellite photo shows the 2018 “bomb cyclone” as a typical intense extratropical cyclone, which got its energy mainly from a horizontal temperature gradient. Since the Arctic changes temperature more than the rest of the world does when global temperature changes, I expect global warming to work against low barometric pressure and high wind speed in this kind of storm, and that even stronger storms of this kind happened before where the 2018 “bomb cyclone” did within the past few centuries, after Columbus crossed the Atlantic. But most of this time, we didn’t have weather models analyzing offshore storms like this from data that was spotty around the center of the storm. And we didn’t have many ships bringing barometers into such storms – ships tried to stay out of such intense storms. And when a ship went into such an intense storm, its crew was concerned with keeping it afloat (I think usually unsuccessfully) rather than reading a barometer.
Joe Bastardi has addressed these claims and using the NCEP/NCAR reanalysis of the surface temperature anomaly for N. America shows that for the period Dec/21 to Jan/10 we have had the same or very similar conditions as this year in the years:
1967-68
1969-70
1976-77
1978-79
1983-84
and
2000-2001
Proof that the climate scientists making the claims above are incapable of even researching the available weather data from previous years and are thus incompetent.
Didn’t we also have the ominously named Polar Vortex winter back in 2013-2014? I took a picture of my outdoor thermometer in Feb 2014 showing -11F at 10AM. I live in southeast Michigan. That winter’s Polar Vortex cold snap was much colder than the recent one in my neck of the woods.
Yea I forgot to include 2013-14. That was the last real blizzard we had in N. Central Indiana. I was called in to team for a run up to Romulus, MI then down to Smithville, TN and back up to Romulus. Even the interstates were closed so I just slept in the truck that night and after digging it out the next morning we left as soon as the Indiana DOT website showed I-69 going from red to yellow. The further north I got the better the roads got but I-69 was very dicey.
The team co-driver that I was teamed with wanted to turn around after we got on the interstate and saw a another rig jackknife. I promised him I wouldn’t kill him and drove on. We made it to Romulus only to find out that the load we were to take had not yet arrived from Canada so we waited 12 hours for it to arrive.
There is a fine line between hardcore and stupid and I may have crossed that line that day. But we made it with no incidents so I guess all is well that ends well and we ended up making two round trips. We kept some of the production lines at the TENNECO Smithville plant running.
And worse: -31F, Nowata, OK, Feb. 10, 2011
February 2011 – A plume of “bad weather” flies down Lake Michigan, accompanied by gale force winds and snow and shuts down northbound Lake Shore Drive in Chicago. It was actually forecast to be that bad. People were stranded on the Outer Drive, and also got stranded on unplowed county roads when they were told to stay off those roads and wait until morning. Roadside diners are always open all night.
Photos are at the link to the Trib. http://www.chicagotribune.com/news/weather/chi-110201-monster-snowstorm-2011-pictures-photogallery.html
I took photos of the snow as it started, then more the next morning of the 4’6″ of snow drifted up against my storm door. I respect avalanche rescuers more than ever now. It is indeed like cement when it’s piled up like that.
My neighbor dug out my front steps and door. I gave him hot cocoa. And this winter, Ace Hardware can’t seem to find a market for its snowblowers, so they’re talking about putting them on sale, if anyone is interested.
Oh, yeah – that was the storm that piled as much as 14 feet of snow on Boston, wasn’t it?
January 21,1994 it was -31 deg. F on Lake Wallenpaupack Wayne County Pennsylvania. I watched as ice crystallized out of the remaining moisture and suspended itself in mid-air outside. How cold was it? It was so cold that the passive and active leafs in two of my wood sliders bent due to the change in specific heat between the glass and the wood—thought that they were going to shatter but thankfully they didn’t. I had to stuff bath towels in between the two leafs to keep the cold air out. Unfortunatety the double pane seals didn’t survive and I wound up replacing the two six-foot sliders when the Spring finally arrived. In retrospect I should have filed an insurance claim as the replacement cost was over $3000 total. I guess my brain was permanent bent from the experience. I also added a propane fired wood stove as the house temperature dropped to 60 deg. F as my geothermal heat pump and electric coil back-up was struggling to keep my log hose warm. R-19 walls and R-33 ceilings were inadequate–who’da thunk it?
Log house–bend brain is permanent!
A small mistake that needs correcting in an otherwise great article.
The great Finnish famine took place in 1696, not 1688.
https://en.wikipedia.org/wiki/Great_Famine_of_1695%E2%80%931697
It also affected Scotland, where 15% of the population is estimated to have died during the ill-years. Some think the repercussions from this climatic-induced event were instrumental in Scotland joining the United Kingdom.
Scotland went on an investment spree which went belly up. They needed the rest of UK to bail them out. I guess a bit like now.?
Stephen Richards
Please, don’t start me. Whilst I like the idea of an independent Scotland, the SNP used the concept to hoodwink my country into full blown socialism.
I hope to retire back there in 4 or 5 years time, but not with that mob of borderline communists in power.
No, see, it was all those millions of hiroshimas going into the oceans. Bombs go in, bombs come out. Simples!
stop giving them ideas on how to further the big climate lie!
Nice write up – small correction; The Earth image from space attributed to Apollo 8 was actually taken by Apollo 17 and was not a composite photo (multiple individual photos ‘glued together’) but a single ‘snapshot’.
https://www.nasa.gov/content/blue-marble-image-of-the-earth-from-apollo-17
Meteorologists seeking relevance. Why should they let Climatologists get all the headlines?
USGS: California Landslides.
https://landslides.usgs.gov/research/ca-rainfall/scal.php
https://www.scientificamerican.com/article/atmospheric-rivers-california-megaflood-lessons-from-forgotten-catastrophe/
From above link:
A 43-day storm that began in December 1861 put central and southern California underwater for up to six months, and it could happen again
IPCC models predict increasingly positive NAO/AO with rising GHG forcings, which is contrary to increased meridionality.
http://www.ipcc.ch/publications_and_data/ar4/wg1/en/ch10s10-3-5-6.html
Are the highs and lows reversed in the illustration of the omega block (Figure 7)? Assuming a general flow from west to east the blocking high should be in the middle flanked by the lows on either side. Is that correct?
The one on the east should probably be labled “Blocking HIgh.” The low pressure in the middle is where the “bomb” sits. And sits. And sits…
When the air flow becomes predominately north-south alternating with east-west the pattern interrupts the usual jet stream circulation from west to east with relatively small north-south components.
I thought it amusing when the BBC had a local weatherman from Florida on their news program and kept asking him what was causing the “Bomb” fishing for a climate change answer and the meteorologist kept telling them its weather it happens sometimes and it’s normal… the disappointment in the answer was tangible….
‘What is “real-time analysis”?’
I have a mechanical wristwatch. It’s waterproof. The winding stem screws down to seal it. Thus it’s a nuisance to unscrew it to set the time and then rescrew (I made that word up) it. So I never set it.
When someone asks me the time I look down at my watch, but I don’t answer. I’m certain they’re wondering why I’m not answering. I’m trying to do the calculations in my head (yearly time changes plus the watch runs fast). Finally I answer, “Um, it’s about almost ten o’clock. They waited all that time to get an approximation. A friend of mine refers to this watch as “Tom time.”
I don’t know what they’re referring to when they say their analysis of the climate is in “real time.” However, we can probably ascertain that the analysis was not done in “Tom time.”
You see, in “Tom time” there would at least be some thought processes involved along with not stating in absolute certainty something provided by their measuring instruments (in this case my watch) that don’t have the precision to provide that certainty.
Real-time means there is an upper limit on how long it will take to perform some operation. So in this case, there is a limit on how long it will take to examine the contents of an anal orifice, and create an excuse that maintains the viability of the current set of excuses, with the predetermined conclusion, based on the composition of the material found there.
And then there is this:
https://www.msn.com/en-us/news/opinion/the-news-in-cartoons/ss-BBHuIzA?ocid=spartanntp#image=12
I love that quote by Mencken! So true!
I-95 seems to be the rain-snow boundary of these storms, although this one tracked a little east and the snow line was more at the coast. When you have 80F Gulf Stream water and extremely moist air sitting 30 miles off Hatteras and 10F polar air moving towards it with a jet moving northeast along the polar boundary something BIG is going to happen.
And when it does it happens pretty quickly. The Nor’easters start in October when the fronts are finally cold enough to get a good temperature differential and run to April, when the temperature difference shrinks.
Then we have a lull until the Hurricane season, which are another set of storms that run the same track but are formed under a completely different mechanism.
“The problem was that after 1975, sulfate levels continue to increase but so did temperature. This technique of tweaking the model to match nature masquerades as validation of the models, but is far removed from reality.”
Increasing sulfate levels in China over recent decades didn’t stop warming there either. It had proved over time that sulfates in the lower atmosphere had no influence on previous cooling temperatures.
‘Climate Change’ should really be called ‘Climate Deception’ because that exactly what it is and has been. They don’t know about the weather over the planet over historic periods and this is a crucial part to understanding how climate changes. They don’t even know about the behavior of the atmosphere either, shown by their lack of knowledge in blaming many things that can be shown to be false.
One thing noticed over the years has been so called climate scientists with an alarmist agenda even trying to reinvent weather terms or ideas that had been known for decades. This has always taken the word ‘Charlatan’ to a new level. Fair enough if it was to advance understanding, but it had mainly been treated as it was something new.
The Great Storm of October 1987 with hurricane force winds over especially the UK and France was caused by a weather bomb. Many weather bombs had occurred before and after, but this was an extreme example.
https://www.metoffice.gov.uk/learning/learn-about-the-weather/weather-phenomena/weather-bomb
https://en.wikipedia.org/wiki/Great_Storm_of_1987
It was well known at the time that global warming was suppose to cause a more positive NAO and AO. Global warming / Climate Deception has nothing to do with increasing negative NAO/AO and occurred more often during past colder decades with more frequent colder winters.
Climate Deception is blamed on whatever has been observed now or just recently and this behavior never ends.
“It had proved over time that sulfates in the lower atmosphere had no influence on previous cooling temperatures.”
Err, and how does that work when atmospheric sulphates reduce SW intensity at the surface?
So really what you are saying is that the Sun’s strength is irrelevant.
Amazing!
The sulfates don’t last long enough, so SW has little/no effect. China is a prime modern example of sulfates no cooling the local environment.
“The Great Storm of October 1987 with hurricane force winds over especially the UK and France was caused by a weather bomb. Many weather bombs had occurred before and after, but this was an extreme example.”
It was caused by an explosively developing wave depression deepened by a jet streak.
I was on Duty in the Met Office at an RAF station the day after it stuck.
I had never heard of a “weather bomb” until a year or so ago”.
But actually on Googling it must have been US centric all those years because ….
From: https://en.wikipedia.org/wiki/Explosive_cyclogenesis
It has a precise definition….
“In the 1940s and 1950s, meteorologists at the Bergen School of Meteorology began informally calling some storms that grew over the sea “bombs” because they developed with a great ferocity rarely seen over land.[5]
By the 1970s, the terms “explosive cyclogenesis” and even “meteorological bombs” were being used by MIT professor Fred Sanders (building on work from the 1950s by Tor Bergeron), who brought the term into common usage in a 1980 article in the Monthly Weather Review.[5][10] In 1980, Sanders and his colleague John Gyakum defined a “bomb” as an extratropical cyclone that deepens by at least (24 sin φ/ sin 60°)mb in 24 hours, where φ represents latitude in degrees. This is based on the definition, standardised by Bergeron, for explosive development of a cyclone at 60°N as deepening by 24mb in 24 hours.[14] Sanders and Gyakum noted that an equivalent intensification is dependent on latitude: at the poles this would be a drop in pressure of 28 mb/24 hours, while at 25 degrees latitude it would be only 12 mb/24 hours. All these rates qualify for what Sanders and Gyakum called “1 bergeron”.[10][12]
The pressure dropped more than 24 mb in less than 24 hours in this Great storm so makes it a weather bomb. I have heard of them for many years so know idea why you haven’t. The pressure dropping this suddenly causes explosive cyclogenesis. It was a rapid deepening depression, but the jet streak was nothing special.
http://www.wetterzentrale.de/reanalysis.php?map=1&model=noaa&var=3&jaar=1987&maand=10&dag=16&uur=0600&h=0&tr=360&nmaps=24#mapref
It was at the time as it was missed.
As I said I live in the UK and we tend to be, shall I say, less sensationalist. Doesn’t go down well with us professionals talking of “bombs”.
“Explosive deepening”, yes.
And honestly, as I’ve said, I would have attributes it to the sensationalist media.
What is it someone said?
The Americans and the Brits are separated by a common language.
1930’s meteorology
Just a question, in regard to how the weather affects diseases.
There seem to be two flu strains this year. I got a shot for one of them, as did many other people I know, but people are still getting sick – quite sick, in fact, going into pneumonia, even if they did get the flu vaxx. Viruses do better in cold weather than in warm weather, and flu viruses have a high mutation rate. The Spanish Flu epidemic was caused by an avian flu virus which became part of that bird flu panic in 2006. And I hope I’m not the only person who remembers the panic about a potential swine flu pandemic in 2009.
Is there any way to guesstimate the possible rate of mutations of these various flu viruses?
And how much will this be affected by increasingly cooler weather year-round?
They all seem to have the ability to mutate into recombinant viruses that are invulnerable to flu vaccination attempts, and tamiflu does not work on many of them. I think this is something that should be looked into more closely. The DNA and RNA flu viruses both have high mutation rates, and they appear to be able to combine into new strains in the wild, hence the bird flu panic in 2006.
If the CAGWers can’t accept something like a cooling trend, and continue to grossly exaggerate which way the wind will be blowing down the road, they’ll be as responsible for any bad results from a real pandemic because people who don’t believe in vaccinations won’t get them. And then, you’ll have an entire population group that was hornswoggled by this deception into not getting something to prevent getting sick. There’s where your “pandemic” will really start.
In the Dark Ages who held accountable for bad crops, bad weather, or plague?
The climate extremists control the conversation and the agenda. It will be quite difficult to hokd them accountable for the bad results of their failed predictions, policies and plans.
Regarding the flu, as with most human respiratory infections, winter weather tends to favor their infectivity, because the agent is expelled by the infected person in microscopic liquid droplets floating in the air. Under cold humid conditions the droplet takes longer to dry and the agent survives longer and has a higher chance to infect another person that respires the droplet. These conditions set the peak epidemic time during the Northern Hemisphere winter.
Once a new host species has been colonized permanently by a parasite, a disarmament race is established. Host and parasite co-evolve so the parasite produces the least amount of damage at the highest infection rate. It is in the interest of the parasite to permanently infect the host and not reduce its fitness. That’s why new diseases like AIDS can have a very high mortality rate while old diseases rarely do so. Syphilis developed in the New World and when it arrived to the Old World with Columbus sailors it was a very virulent disease with horrible results. A few centuries later it evolved to a less virulent form where infected people could continue to have sexual relations for many years without great manifestations, favoring the spreading of the disease.
The flu is not a human parasite. It is avian. So we don’t co-evolve towards less virulence. It usually infects humans after adapting to another mammal. Due to the mixed duck/pig economy in China, where pigs get exposed to duck droppings often, most flu strains originate in China.
It is a high mutation rate virus. New strains will suddenly appear, spread quickly in the population, become abundant, and then get displaced by newer strains and become less frequent until they disappear from the population. Humans get rid of the virus in about a week so keeping a high rate of infection is a must for the virus and tends to mutate in that direction, trying to change the antigens recognized by the human immune system. Otherwise it runs out of hosts and disappears. People younger of 15 are more susceptible to infection, as they have been infected previously few times and have little immune memory. Old people tend to suffer the worst effects, but that is not always the case.
The Spanish flu did not originate in Spain. As a neutral country in the WWI Spain reported its cases in the press. The strain had a high mortality that affected mostly young people probably not exposed previously to a similar strain. Countries at war censored the news to keep morale so it appeared that it was a problem in Spain when in reality the awful conditions at the trenches made mortality from the flu there much worse.
It is just a question of time that a new killer strain appears. It is hoped that the WHO will be able to slow its spread and develop, and produce a vaccine, and immunize the World population before it has a chance of decimating it.
The black death that hit the Old World during the LIA is a rodent parasite that uses fleas and susceptible rodents as vectors. It is endemic in Central Asia rodents that during the drier colder conditions during the LIA and due to unusual drought conditions migrated to invade human grain stores spreading the disease to humans and susceptible rodents, like rats. So it was a climate related epidemic. Also the disease affected Europe no long after a series of climate related famines that had left the population weakened and more susceptible to the disease.
Other food pathogens are plant fungus. They are usually favored by warm humid conditions. So warmer, wetter winter-spring conditions can give the pathogen a kick start at the next growing season severely compromising that crop.
Sara, I know quite a lot about this because one of my companies involves broad spectrum topical antimicrobials. Influenza is an enveloped virus. H and N are envelope proteins the virus used to infect a cell. Coded in the viral DNA and replicated as the virus takes over the cells reproductive machinery to make more copies of itself. H=hemagluttinen (18subtypes). N=neuraminidase (11 subtypes). Most of both types are specific to avians, a few are specific to humans, and others are specific to humans and pigs, or dogs, or horses. Flu vaccine is simply antigens against these proteins cultured in flu infected fertile chicken eggs.
What is done is to survey the end of the flu season, then ‘guess’ which two or three HxNy strains will be most prevalent the following year and prepare the vaccine for them. Two things can happen to throw this vaccine strategy off.
First, A different lesser strain emerges as the predominant one for whatever reason and the vaccine is essentially useless. That was the 2009 swine flu pandemic problem (strain was specific to humans and pigs), with the strain emerging in Argentina’s winter before traveling to the northern hemisphere. It predominated because the vaccine was not prepared for it but did work for what were supposed to be that years most common varieties.
Second, viral replication is not perfect. Both H and N errors can build up as the flu season progresses. As antigens are highly protein detail specific, the vaccine becomes less protective as the Hx and Ny proteins morph in detail. In the 5-6 hours between infection and cell death from bursting open stuffed with new virons, literally 10s of thousands are formed. Details are complicated because influenza is a negative RNA virus. Because of this the geneic resortment is vast, but most new viron mutants are not viable. Studies suggest that on average only 25 are. 25:1 in under six hours. Havoc. It is those 25, changing every 6 hours, where the protein drift occurs that reduces vaccine antigen effectiveness.
Dr. John Holden did the same thing in 2014:
That was a long 2 minutes having to listen to Holden.
Holden is using the same circular obfuscation and “heads I win, tails you lose” bs that his mentor, Ehrlich, has built a career on.
The fact is that there are no significant increases in bad weather events.
Just like Ehrlich having the audacity to pose as some sort of successful forecaster, Holden relies on bluster and position to hide his lack of reliability.
There you go presenting facts and reason in a public square dominated unreason and fictionalized narratives.
Yup: there’s Lies, Damned Lies, and Narrative. And they’ll fight to the death for the Narrative, because its all they got left.
Excellent article. I was born/raised in Arkansas and I remember the winters of 1976-1978 and that was the first time I read about the jet stream. We had snow on the ground for about two months!
Arkansas. One of those places that when it comes to snow or ice covered roads they figure God put it there and God will take it away. They may call one of their few salt shakers out after there are a number of accidents along a particular stretch of interstate.
Arkansas? Sounds a bit like Finland.
Finnra Road Traffic Cameras Road 9671 Savukoski, Martti
Thank you Tim – another great article.
I recently ran a rough analysis of the Transient Climate Sensitivity (TCS) for the period 1940 to 1977. As you may recall, this was a period of (natural) global cooling, even as atmospheric CO2 strongly increased, according to the IPCC.
I chose this time period because 1940 is the time when fossil fuel consumption strongly accelerated, and 1977 is the time of the Great Pacific Climate Shift, when the PDO changed from cooling to warming (on average).
I used HadCrut3 Surface Temperatures (ST’s), although HadCrut4 would give similar results.
I made the same basic assumption to Christy and McNider (C&M2017) – similar to that of the IPCC, that essentially ALL the global average temperature change was caused by increasing atmospheric CO2. C&M2017 concluded that for the climate satellite era (1979 to mid-2017) the Transient Climate Sensitivity for the Lower Troposphere (LT TCS) is PLUS 1.1C/(2xCO2).
I calculated that the Transient Climate Sensitivity for the Surface Temperatures (ST TCS) for 1940-1977 is about MINUS 1C/(2xCO2) [cited herein as AMM2018].
Repeating, both C&M2017 and AMM2018 use the IPCC assumption (which is HIGHLY questionable) that atmospheric CO2 is the primary driver of global climate, and calculate a Transient Climate Sensitivity of +/- 1C/(2xCO2). This is a VERY LOW TCS, whether positive or negative, such that there is NO real global warming (or cooling*) crisis caused by increasing atmospheric CO2.
CONCLUSION
The IPCC’s global warming scare is caused by a greatly exaggerated, false assumption of the magnitude of TCS/ECS, an assumption that is unsupported by the evidence.
Furthermore, a rational person must reject as false the IPCC’s basic assumption that alleged runaway global warming is driven by increasing atmospheric CO2, unless one is also prepared to conclude that the same increasing atmospheric CO2 ALSO causes global cooling.
This corresponds to Rex Murphy’s satirical “One Holy Underlying Theory of All Weather”.
http://nationalpost.com/opinion/rex-murphy-too-frigid-for-global-warming-this-is-why-they-rebranded-it-climate-change
“Any variety of weather whatsoever can be traced, if you keep the grants flowing and the contradictions unexamined, to the One Holy Underlying Theory of All Weather.
… they have long ago “rebranded” Global Warming so it does not mean that anymore. It’s Climate Change now, up, down, across and around. Climate Change, meteorology’s ToE (Theory of Everything).”

* Post Script:
It is increasingly probable that global temperatures change due to natural factors, are roughly cyclical, and Earth is at the end of a natural warming cycle, and about to enter into a natural cooling cycle. Bundle up!
Notes on the above analysis:
Using the same assumptions at Christy and McNider 2017 (~all changes are due to increasing atm.CO2), I estimated TCS equals MINUS ~1C/(2xCO2) for the global cooling period from 1940 to 1977, ~equal but opposite sign to the PLUS 1.1C calculated by Christy and McNider for 1979 to 2017.5.
I conclude that “This TCS is so low that there is no real global warming or cooling crisis caused by increasing atm. CO2.”
Regards, Alan
CASE 1 – AFTER CHRISTY & MCNIDER (2017) – SATELLITE ERA, WHICH CORRESPONDS TO THE GLOBAL WARMING PERIOD – YEARS 1979-2017.5
https://wattsupwiththat.files.wordpress.com/2017/11/2017_christy_mcnider-1.pdf
http://woodfortrees.org/plot/uah6/from:1979/to:2017.5/scale:100/trend/plot/uah6-land/from:1979/to:2017.5/scale:100/plot/esrl-co2/from:1979/to:2017.5
YEARS 1979 TO 2017.5
LT Temperature Anomaly scaled*100
http://woodfortrees.org/plot/uah6/from:1979/to:2017.5/trend/plot/uah6/from:1979/to:2017.5
YEARS 1979 TO 2017.5
CASE 2 – PREVIOUS GLOBAL COOLING PERIOD WHICH CORRESPONDS TO THE GLOBAL COOLING PERIOD – YEARS 1940 TO 1977
http://woodfortrees.org/plot/hadcrut3gl/from:1940/to:1977/scale:100/trend/plot/hadcrut3gl/from:1940/to:1977/scale:100/plot/esrl-co2/from:1958/to:1977
YEARS 1940 TO 1977
ST Temperature Anomaly scaled*100
http://woodfortrees.org/plot/hadcrut3vgl/from:1940/to:1977/trend/plot/hadcrut3gl/from:1940/to:1977
YEARS 1940 TO 1977
CALCULATIONS
1979 TO 2017.5 = 38.5 years
Delta T = +0.49dC
Delta CO2 = 405-335 = +70 ppm atm.CO2
+0.49/+70 = +0.0070dC/ppm CO2
LT TCS calc. = +1.1C/(2xCO2)
1940 TO 1977 = 37 years
Delta T = -0.08dC
Delta CO2 = 332-320 = +12 ppm atm.CO2
0.08/+12 = -0.0067dC/ppm CO2
ST TCS est. ~= -1C/(2xCO2)
CONCLUSION:
SUBJECT TO THE CAVEATS IN THE NOTES BELOW, ESTIMATED TCS IS +/- 1C/(2xCO2)
This TCS is so low that there is no real global warming or cooling crisis caused by increasing atm. CO2
Notes
Christy and McNider included the impact of major volcanoes in their calculations.
I did not include the impact of major volcanoes in my estimate for the previous period.
Volcanic activity was significant in both periods. https://en.wikipedia.org/wiki/List_of_large_volcanic_eruptions_of_the_20th_century
I did not include any logarithmic effects in my rough estimate.
My Jan 1978 Boston/NY/DC/STL trip lives on in my memory. I’m not sure this year’s event even matches that one.
This year’s winter certainly doesn’t match 1978, when we had three feet of snow on the ground here in Oklahoma. Today there is no snow on the ground in Oklahoma.
In about 2012 the low temperature around here hit -12 F. It hasn’t gotten lower than +10 F so far this year.
“The “Bomb Cyclone” of 2018 is another example of hyperbole and distortion designed to scare the public and promote false perceptions.”
Yes, I agree with you, it p****s me off too.
However I would suggest that it was invented by some editorial journalist (or possibly some US TV “weather-caster” in order to sensationalise and “big up” the news.
It would never have been used by prefessional Meteorologists (which I was with the UKMO for 32 years until 2006).
No conspiracy to scare just media doing what media do.
Do try and distinguish between the two.
“The second example was the claim that the cooler period from 1940 to 1975 was a ‘dimming’ of solar energy caused by sulfate aerosols from human sources. ”
It was.
“They determined this by ‘simulating’ the effect in their models”
No they didn’t – it was determined by analysis of pan evaporation and other sunlight data from around the world…..
https://www.huffingtonpost.com/amarnath-amarasingam/what-is-global-dimming_b_740996.html
https://imedea.uib-csic.es/master/cambioglobal/Modulo_I_cod101601/Ballabrera_Diciembre_2011/Articulos/Stanhill.2005.pdf
“The problem was that after 1975, sulfate levels continue to increase but so did temperature.”
Cant see that here Tim.
“The world has not warmed since at least 1998.”
Willis didn’t think much of that Tim.
https://wattsupwiththat.com/2018/01/12/proof-that-the-recent-global-warming-slowdown-is-statistically-significant-at-the-99-confidence-level/#comment-2715906
“Claims of AGW included the prediction that storms would increase. This was incorrect because the major storm systems are mid-latitude cyclones that form along the Polar Front. ”
https://www.ipcc.ch/pdf/assessment-report/ar5/wg1/WG1AR5_TS_FINAL.pdf
“Globally, there is low confidence in attribution of changes in tropical cyclone activity to human influence. This is due to insufficient observational evidence, lack of physical understanding of the links between anthropogenic drivers of climate and tropical cyclone activity, and the low level of agreement between studies as to the relative importance of internal variability, and anthropogenic and natural forcings.”
“Projections for the 21st century indicate that it is likely that the global frequency of tropical cyclones will either decrease or remain essentially unchanged, concurrent with a likely increase in both global mean tropical cyclone maximum wind speed and rain rates (Figure TS.26). The influence of future climate change on tropical cyclones is likely to vary by region, but there is low confidence in region-specific projections. THE FREQUENCY OF THE MOST INTENSE STORMS WILL INCREASE SUBSTATIALLY IN SOME BASINS under projected 21st century warming
(see Figure TS.26). {11.3.2, 14.6.1}” (my caps).
They were talking of Tropical cyclones and not mid-latitude depressions.
“The 5 to 8 waves associated with Meridional flow are high amplitude with more north/south winds in summer and winter and much greater extremes of temperature and precipitation. This is the condition existing now, so the AGW promoters are correct, it is climate change, but it is not new, and it is due to cooling not warming.”
A straw-man – it is not new in terms of past warming no. BUT it’s THIS warming were interested in, that’s the point.
Thanks for at least recognising that it’s warming.
So what’s causing the warming Tim?
“The transition out of the former and its impact on the human condition was well documented by Barbara Tuchman in her book “A Distant Mirror.” She took a single life of a man who was born in 1300 and died in 1399. ”
So we bring a book of fiction to the evidence table.
Now that’s new!
“It appears that Zonal or Meridional patterns can dominate for long periods such as the climate cycles from a longer temperature pattern, such as the Medieval Warm Period and the Little Ice Age.”
No more or less than in the current climate.
Unless you have quantative data saying otherwise.
“Samuel Pepys’ records the consternation including the fact that the King ordered citizens to pray for colder weather to make things healthier again.”
What’s that got to do with agriculture in the 21st cent pray!
“The book underscores the hysteria and falsehoods of AGW, because Stephen Schneider, a major architect of the warming deception,”
You haven’t debunked any “falsehoods here Tim.
You’ve merely promoted some of your own.
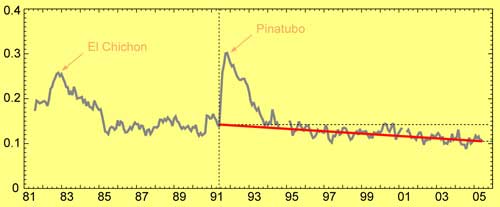
Image above: Sun-blocking aerosols around the world steadily declined (red line) since the 1991 eruption of Mount Pinatubo, according to satellite estimates. The decline appears to have brought an end to the “global dimming” earlier in the century. Credit: Michael Mishchenko, NASA.
http://4.bp.blogspot.com/_y6iO7QHMoXA/TDVyVkuWDzI/AAAAAAAAATc/SHkHeordG4A/s1600/Fig2.gif
Tim Ball wrote:
“The second example was the claim that the cooler period from 1940 to 1975 was a ‘dimming’ of solar energy caused by sulfate aerosols from human sources. ”
ToneB wrote:
“It was.”
Nice try Toneb – nice sleight of hand – nothing up your sleeve, etc.
You claim above to dismiss the global cooling from ~1940 to ~1975 with a plot of volcanic Aerosol index data from 1981 to 2005! Total false nonsense!
Similarly your phony SO2 emissions argument has indeed been used by modelers to falsely hind-cast their models to force-fit this same ~35-year period post 1940.
Global dimming indeed – your arguments reflect your own intellectual dimming.
http://wattsupwiththat.com/2015/12/20/study-from-marvel-and-schmidt-examination-of-earths-recent-history-key-to-predicting-global-temperatures/comment-page-1/#comment-2103527
[excerpt]
Re aerosols:
Fabricated aerosol data was used in the models cited by the IPCC to force-hindcast the natural global cooling from ~1940-1975). Here is the evidence.
Re Dr. Douglas Hoyt: Here are his publications:.
http://www.warwickhughes.com/hoyt/bio.htm
Best, Allan
http://wattsupwiththat.com/2015/05/26/the-role-of-sulfur-dioxide-aerosols-in-climate-change/#comment-1946228
“You claim above to dismiss the global cooling from ~1940 to ~1975 with a plot of volcanic Aerosol index data from 1981 to 2005! Total false nonsense!”
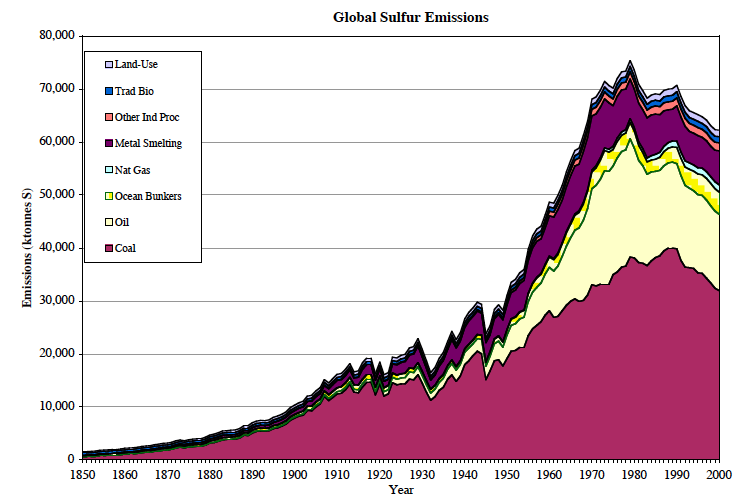
You obviously did not notice the one I posted that runs from 1850 which plainly shows industrial output and pollution taking off after WW2.
I posted it to actually show that mR Ball was wrong when he says that Sulphates did not go down after 1975.
Also as regards the “cool period” up to ’75, the PDO had a long period in -ve territory (like the now defunct “hiatus”) to boot.
It was NV with the added -ve forcing of anthro aerosol “dimming”.
“Global dimming indeed – your arguments reflect your own intellectual dimming.”
From your own link to the paper…
“Current climate forcing due to anthropogenic sulfate is estimated to be –1 to –2 watts per square meter, globally averaged. This perturbation is comparable in magnitude to current anthropogenic greenhouse gas forcing but opposite in sign. Thus, the aerosol forcing has likely offset global greenhouse warming to a substantial degree.”
Right, current GHG forcing is estimated to be 1.9 W/m2
Yet you say that a -ve forcing of 1-2 W/m2 should be dismissed.
Another goal-post moved to the next town.
Well done.
And why is it certain denizens feel the need to resort to ad homs.
Could you tell me please Allan?
ToneB
RE ad homs – your responses are deceptive and nonsensical.
I presume this is deliberate, and I am calling you on it.
From the article: “This is a classic example of the deception about the deception. Of course, it is likely that cold spells are rarer than a century ago because from 1900 to 1940 there was a more dramatic warming than occurred in the much-hyped 1980 to 1998 period.”
There you go, Nick. 🙂
And that being the case, why should we assume today’s warmth is caused by CO2 in the atmosphere, when the warmth up to 1940 was all natural? If it warms at the same magnitufe during the 1910 to 1940 period and during the 1980 to Present period then it would be logical to assume the same cause for both time periods. CO2 is not necessary to get the current level of warming because it wasn’t necessary in the past.
Until proven otherwise, we should assume that the current warmth is from Mother Nature, not human-caused CO2.
Let me put my 1999 Hansen chart here so people can visualize the two warming periods:

“And that being the case, why should we assume today’s warmth is caused by CO2 in the atmosphere, when the warmth up to 1940 was all natural? If it warms at the same magnitufe during the 1910 to 1940 period and during the 1980 to Present period then it would be logical to assume the same cause for both time periods.”
But it wouldn’t be logical as things in the 40’s were not as they are now.

to whit ……
CO2 Forcing had not fully emerged in the 40’s.
310ppm vs 404ppm.
We had increased atmospheric CO2 by 30ppm in 1940 and since then by another 90+ ppm
Because both the PDO and the AMO were +ve in the 40’s.
http://homework.uoregon.edu/pub/blogs/g2.png
http://eesc.columbia.edu/courses/ees/slides/climate/hansen/figure11.gif
“CO2 is not necessary to get the current level of warming because it wasn’t necessary in the past.”
The current level is well beyond “the past”.
http://2.bp.blogspot.com/-T65Ti_Kr_I4/Vp-ygKu_7XI/AAAAAAAADWU/PZrDckqeavY/s1600/Untitled.png
“Until proven otherwise, we should assume that the current warmth is from Mother Nature, not human-caused CO2.”
OK where is this coming from as well?

And please no “the data is sparse”
“cannot measure to 0.01C”
“It’s undersea volcanoes”
“It’s recovery from the LIA”
There is an obvious imbalance in SW solar energy absorbed and terrestrial LW emitted. Most of which is being stored in the oceans.
Occasionally they disgorge some (+PDO/ENSO and to a smaller extent the AMO) and occasionally they take more in (-vePDO/ENSO = “hiatus”).
Natural variation happens overlying the AGW warming trend.
In the past the Pacific cool periods used to cool the atmosphere to a -ve anomaly. Now it’s just a reduced cooling “hiatus”.
Also, even though many here imagine the Globe to be just the US it’s but 4% of it.


The fact that the US had a “dust-bowl” climate in the 40’s can be adequately explained by the prolonged +ve PDO then.
Along with the fact that that graph does not compare apples to apples – the US had amateur observers with non-standard practises back then which needed to be accounted for when a warming bias emerged in the changeover to standard (morning max reading) practise.
ToneB, what of “CO₂ isn’t necessary” didn’t you understand?
ToneB wrote:
“Because both the PDO and the AMO were +ve [positive] in the 40’s.”
More sleight-of-hand from ToneB.
In fact,
The PDO turned negative in ~1945, and except for ~1956-1960, stayed negative until ~1977.
Here is the plot of the PDO data:
https://www.facebook.com/photo.php?fbid=1538024529608437&set=a.1012901982120697.1073741826.100002027142240&type=3&theater
\
“More sleight-of-hand from ToneB.
In fact,
The PDO turned negative in ~1945, and except for ~1956-1960, stayed negative until ~1977.”
More sleight of hand Allan.
So did US Temps “turn negative” by then.
Look again at the US temp record.
Goes down quite a bit in the early 40’s, with the highest temps actually in the 30’s

Really it’s not difficult.
Just look at the data with the bias turned off.
And….
“ToneB, what of “CO₂ isn’t necessary” didn’t you understand?”
Is that bit of hand-waving supposed to mean something?
Try reading what I said and the data I linked/posted … again without the confirmation bias, and instead with a modicum of scientific insight if you can manage it.
ToneB, your comments are your usual smarmy nonsense.
Yes, global cooling occurred from ~1940 to 1977, even as fossil fuel consumption accelerated strongly. That is what I have been saying all along. This observation DISPROVES the “runaway global warming” hypothesis. This ~37-year global cooling period was naturally-caused, and was NOT primarily driven by increasing atmospheric CO2, unless you believe (as many warmists do) that CO2 is the “magic molecule”, that can cause both global warming AND global cooling.
It appears you are unacquainted with the Scientific Method, or perhaps need a refresher course.
RICHARD FEYNMAN ON THE SCIENTIFIC METHOD (1964)
at 0:39/9:58: ”If it disagrees with experiment, it’s wrong.”
At 4:01/9:58: “You can always prove any definite theory wrong.”
At 6:09/9:58: “By having a vague theory, it’s possible to get either result.”
THAT IS THE “CLIMATE CHANGE” ALARMISTS’ KEY STRATEGY:
“By having a vague theory, it’s possible to get either result.” – Richard Feynman
“A theory that is not refutable by any conceivable event is non-scientific.” – Karl Popper.
The “Climate Change” hypothesis is so vague, and changes so often, that it is not falsifiable and not scientific. It should be rejected as unscientific nonsense.
The “Runaway Global Warming” hypothesis is at least falsifiable, and IT HAS BEEN ADEQUATELY FALSIFIED:
1. By the ~37-year global cooling period from ~1940 to 1977.;
2. By “the Pause”, when temperature have not increased significantly since the mid-1990’s, despite increasing atm. CO2;
3. By the fact that sea surface temperatures have not increased significantly since ~1982, and corresponding air temperatures increased largely due to the dissipation of the cooling impact of two century-scale volcanoes in 1982 and 1991+;
4. By the fact that CO2 lags temperature by ~9 months in the modern data record, and the future cannot cause the past (in this space-time continuum).
Your comments are not serious – they are deliberately intended to mislead.
__________________________________________________________________________
“EXTRAORDINARY POPULAR DELUSIONS AND THE MADNESS OF CROWDS”
Charles Mackay (1841)
https://en.wikipedia.org/wiki/Extraordinary_Popular_Delusions_and_the_Madness_of_Crowds
Quotations
“Men, it has been well said, think in herds; it will be seen that they go mad in herds, while they only recover their senses slowly, and one by one.”
“Of all the offspring of Time, Error is the most ancient, and is so old and familiar an acquaintance, that Truth, when discovered, comes upon most of us like an intruder, and meets the intruder’s welcome.”
Allan says: 1) ” temperature have not increased significantly since the mid-1990’s”
Allan says: 2) ” CO2 lags temperature by ~9 months in the modern data record.”
….
Therefore logic says CO2 has not increased significantly since the mid-1990’s using items above.
…
Reality proves Allan is wrong.
“Yes, global cooling occurred from ~1940 to 1977, even as fossil fuel consumption accelerated strongly. That is what I have been saying all along. This observation DISPROVES the “runaway global warming” hypothesis. This ~37-year global cooling period was naturally-caused, and was NOT primarily driven by increasing atmospheric CO2, unless you believe (as many warmists do) that CO2 is the “magic molecule”, that can cause both global warming AND global cooling.
No it doesn’t, but carry on doing the “d” thing.
I’m not repeating what I’ve already outlined and playing your game.
Try using some valid scientific argument will you.
Science doesn’t consider your assertions nor your quotes from Feynman as relevant
What matters is observation and theory. Correlation and causation, of which there is i. Spades. THAT is the scientific method my friend.
Thus consensus science has come to the conclusion it has. If you have evidence otherwise, do the paper and have it peer-reviewed to change that science. Relying on ideologically motivated blogs is not science. Sorry.
Oh and CO2 is not “magic” – it is a GHG. The most important one in the atmosphere as it does not condense.

You of course have seen this…..
“Your comments are not serious – they are deliberately intended to mislead.”
Actually the opposite – they are deliberately intended to make you aware of and lead you to the science, you know – the 97% that you dismiss as being fraudulent (presumably).
I of course know that it is futile.
But no matter.
Ignorance should be denied.
I call that it is certain Blogs that are deliberately intending to mislead.
And hence yourself here by uncritically looking at the full body of evidence.
(knowing how the science works would help enormously too)
Would I be correct in supposing that you vehehently oppose the (proven) contention that anthro CO2 is causing GMT’s to rise?
And that that informs your view of the science.
Do you bother to challenge your views (as all scientists must) by looking a the totality of the science, not that only filtered through the Blogs of a “contrarian”?
Otherwise we have to turn logic and common-sense on its head and say that the world’s climate scientists (and all other Earth scientists too) are either incompetent or liars.
And that you and the odd Blog author know more than they do.
“You are a pair of bullsh!tters who have negative credibility..
You make false allegations about what is being stated and then shoot them down.
Why don’t you state what you believe, instead of hiding in the bushes taking potshots at your own red herrings?”
Look Allan:
What you need to do is to come up with some peer-reviewed science to counter the peer-reviewed science I talk of and link to.
That is how science is done …. and a consensus naturally emerges when that science cannot be refuted and is confirmed by further science.
That has been done for ~150 years as regards the fact that increasing CO2 in our atmosphere will warm it.
You coming on here to throw ad homs at those who point out that you science gain from blogs either cherry-picks the bits they like or outright misrepresenting it.
You plainly, as do most on here, have no idea what consensus climate science says in terms of the physics and evidence of it, and whats more, like mos on here have no interest in knowing.
I suggest that that is because you are ideologically driven.
And despite what you so obviously believe, science isn’t, becasue it is open to falsification.
You are not – you default to the “d” option.
That you believe that experts are wrong and you are correct defies belief to those of us who have an open mind.
Addendum:
Alan:
Please tell us how it is possible for the oceans to both emit CO2 to the atmosphere in the quantities necessary to achieve the the rise from 280 to 400 ppm and at the same time absorb such that ph is actually decreasing? (to do so it must sink it!)
It is simple impossible things such as this that you unquestioning believe that boggles the mind.
No Tom Bjorklund, your assumption and conclusion are wrong. Many people have made this same error, and it’s becoming quite old and tiresome; you should know this if you read WattsUp.
You incorrectly assume that I say “Temperature is the ONLY driver of atmospheric CO2”, when in fact other drivers could include fossil fuel combustion, deforestation, volcanoes, etc., etc.
Note however, that the ONLY apparent signal in the data is that dCO2/dt closely correlates with Temperature, and CO2 (the integral of dCO2/dt) lags Temperature by 9 months. See this plot – does this look like mere coincidence to you?
http://www.woodfortrees.org/plot/esrl-co2/from:1979/mean:12/derivative/plot/uah5/from:1979/scale:0.22/offset:0.14
I wrote the original paper on this observation in 2008:
http://icecap.us/images/uploads/CO2vsTMacRae.pdf
Humlum et al expanded this observation in 2013:
http://www.sciencedirect.com/science/article/pii/S0921818112001658
Highlights of Humlum:
– Changes in global atmospheric CO2 are lagging 11–12 months behind changes in global sea surface temperature.
– Changes in global atmospheric CO2 are lagging 9.5–10 months behind changes in global air surface temperature.
– Changes in global atmospheric CO2 are lagging about 9 months behind changes in global lower troposphere temperature.
– Changes in ocean temperatures explain a substantial part of the observed changes in atmospheric CO2 since January 1980.
– Changes in atmospheric CO2 are not tracking changes in human emissions.
https://www.facebook.com/photo.php?fbid=1551019291642294&set=a.1012901982120697.1073741826.100002027142240&type=3&theater
“closely correlates”
…
Big error on your part.
…
First you say “CO2 lags temperature”
…
Then you say: ” dCO2/dt ” correlates.
…
Two different animals. CO2 lagging and dCO2/dt are not the same thing.
…
Which is it?
…
You are knowledgeable enough to know the derivative (dCO2/dt) removes the trend in the rise in CO2.
See what the derivative does to the trend?
..
http://www.woodfortrees.org/plot/esrl-co2/plot/esrl-co2/trend/plot/esrl-co2/derivative
Finding a correlation between the noise in the CO2 signal (dCO2/dt) and the temperature ANOMALY is not significant. Besides, we all know correlation is not causation.
Tom wrote:
“Two different animals. CO2 lagging and dCO2/dt are not the same thing”
My reply:
Actually, the relationship between the “lead of the derivative” versus the “lag of its integral” are fundamental to mathematics. Consider acceleration versus velocity.
Tom wrote:
“You are knowledgeable enough to know the derivative (dCO2/dt) removes the trend in the rise in CO2.” [Are you trying to be offensive? It seems so.]
My reply:
Yes, and you are apparently NOT knowledgeable enough to bother reading or understanding my reply.
I have heard your argument many times before since 2008, and the answer is that there are several possible causes of the increase in atmospheric CO2, but the ONLY apparent signal in the data is the one I described – that dCO2/dt changes ~contemporaneously with temperature, and CO2 lags temperature by ~9 months.
Also, CO2 also LAGS temperature by ~~800 years in the ice core record, on a much longer time scale.
So CO2 lags temperature at all measured time scales.
Therefore, global warming alarmism assumes that the future is causing the past.
Note also that CO2 started to accelerate strongly circa 1940, and yet there was GLOBAL COOLING from ~1940 to 1977. This corresponds to a Transient Climate Sensitivity (TCS) of about MINUS 1C/(2xCO2). Then in the satellite era, Christy and McNider (2017) calculated that from 1979 to 2017.5 the TCS was PLUS 1.1C/(2xCO2).
https://wattsupwiththat.com/2018/01/13/a-climate-history-lesson-extremism-of-stories-like-bomb-cyclone-is-a-good-thing/comment-page-1/#comment-2716175
So CO2 is the “Miracle Molecule”, which not only causes Global Warming, but also causes Global Cooling (but not much of either) and also enables “the future to cause the past”. That is essence of the Runaway Global Warming Hypothesis, and it is untenable.
Finally, your saying “correlation is not causation” is a throwaway line in this case – irrelevant given the facts.
Karl Popper proposed in 1963 that a scientific theory could not be proved but could be disproved or falsified. He claimed that ‘It must be possible for a scientific system to be refuted by experience. A theory that is not refutable by any conceivable event is non-scientific.
Richard Feynman stated in 1964: ”If it disagrees with experiment, it’s wrong.”
The Runaway Global Warming Hypothesis is disproved by many arguments, based on real world-scale evidence. Increasing atmospheric CO2 has occurred during ~38-year periods of BOTH Global Cooling AND Global Warming. While increasing atmospheric CO2 may indeed cause some atmospheric warming in theory and laboratory-scale tests, the sensitivity of global temperature to increasing atmospheric CO2 is very low, and is much less than the sensitivity of atmospheric CO2 to temperature – if it were otherwise, the strong correlation between dCO2/dt and temperature and the resulting ~9-month lag of CO2 after temperature would not exist.
Tom
Even the warmist camp has “moved on” from your arguments.
The close relationship that I published in 2008 between dCO2/dt vs global temperature T and the resulting ~9 month lag of CO2 after temperature in the modern data record was first dismissed by the warmist camp as false, but then later accepted as technically correct, but again dismissed as a “feedback effect”. Their argument is “We KNOW that CO2 primarily drives global temperature, therefore it MUST BE a feedback effect.”
I reject both those arguments as false, since they are contradicted by the evidence.
This latest warmist argument (”feedback effect”) tends to violate Occam’s Razor, and falls into the category: “But if frogs had wings, they wouldn’t have to bump around on their asses.” 🙂
Allan says: “So CO2 lags temperature at all measured time scales.”
…
WRONG WRONG WRONG.
…
Case in point. 1) ” temperature have not increased significantly since the mid-1990’s” and CO2 has increased significantly since the mid-1990’s. That proves you WRONG.
“Highlights of Humlum:
– Changes in global atmospheric CO2 are lagging 11–12 months behind changes in global sea surface temperature
– Changes in global atmospheric CO2 are lagging 9.5–10 months behind changes in global air surface temperature.
– Changes in global atmospheric CO2 are lagging about 9 months behind changes in global lower troposphere temperature.
– Changes in ocean temperatures explain a substantial part of the observed changes in atmospheric CO2 since January 1980.
– Changes in atmospheric CO2 are not tracking changes in human emissions.”
**– Changes in atmospheric CO2 are not tracking changes in human emissions.**
Yes, obviously, because they have filtered out human emission increase (it being a fairly steady 2ppm/yr). – As the inter-annual change is natural it does have 12 month variability. That is superimposed on the long-term trend of fossil CO2.
It is an ENSO based effect which spreads out across the Globe over that period.
From: http://www.realclimate.org/index.php/archives/2012/09/el-ninos-effect-onco2-causes-confusion/
“Simply by choosing a method that ignores trends associated with human activity, they argue that atmospheric CO2 is ‘largely independent of humans‘. This logic is circular reasoning, but since they did not specify time scales, their argument gets a bit fuzzy (the argument is true on short time scales but not on decadal time scales ”
To see this on their graph – the CO2 rate of change curve is always positive, whereas the T rate of change curve is sometimes positive and sometimes negative. To express it as simply as possible: when temperature goes up, CO2 goes up. When temperature goes down, CO2 still goes up !!!!!
Also it is impossible (as Humlum et al say) for increasing atmos CO2 to be coming from the oceans, as if that were the case then the ocean ph would be rising.
It is falling (becoming more acidic)
The oceans are sinking more CO2 NOT emitting more.
Tom and ToneB
You are a pair of bullsh!tters who have negative credibility..
You make false allegations about what is being stated and then shoot them down.
Why don’t you state what you believe, instead of hiding in the bushes taking potshots at your own red herrings?
The fact that Seth B. can’t even write mathematics bothers me. Now it may come to the situation in the future that is consider fine to say 15 times rarer. But mathematicians and educators abhor this.
Quite simply: if 1917 probability was 8% and 2017 probability was 8/15 % we do NOT say 15 times rarer.
We say that it has a 1/15 th the prior probability
or
a 93% reduction
or
7 and 7/15% less probability.
But we DON’T say 15 times rarer.
I wonder if Seth uses ‘more optimal’, ‘lesser minimum’, ‘bestest’, and ‘worstest’.
Regarding “The world has not warmed since at least 1998”: The link is about a slowdown, not a complete lack of warming. Even UAH V.6 says warming did not stop at 1998.
Donald L wrote:
“Regarding “The world has not warmed since at least 1998”: The link is about a slowdown, not a complete lack of warming. Even UAH V.6 says warming did not stop at 1998.”
Don:
Earth is still cooling after the recent strong El Nino – wait six months or so and then we’ll see about the trend.
The “bomb cyclone” was less intense on US land than the Blizzard of 1888 because the “bomb cyclone” was more offshore. The satellite photo at the top of this article shows its center being about 300 miles offshore.
I agree, the alarmism is undermining the political superstructure of the climate industrial complex. They don’t see it happening and that is another good thing.
“according to a team of international scientists who do real-time analyses to see if extreme weather events are natural…”
I love how these guys do real-time analyses on something that can ONLY BE DETERMINED IN RETROSPECT.
What we have is a continuing failure to communicate, a continuing failure of journalism, the loss of journalistic standards and ethics. The reporter in our local paper said the storm was going to explode among us. (Actually, although it was cold and windy, there was not much snow here.) I have noticed that in lieu of neutral language to report the news, all news, not just climate news, reporters increasingly use loaded, emotional language. There is also an increasing use of slang. And hard-print providers wonder why their readership is declining.
Old MSM adage:if it bleeds, it leads. Loaded emotional language ‘bleeds’.
Except that in the new era you have to synthetically make it bleed then lead.
As for a change in global temperature making the northern polar front jet stream more zonal or more meridianal: I think the answer is to look at what happens when seasons change in the northern hemisphere. The main effect I see of summer is that the jet stream is on average slower and more north. And nor’easters are less windy. Blocking patterns are common in all seasons, and so is zonal flow. This looks like a good indicator of what northern hemisphere seasons other than summer will be like when global warming makes them more summer-like.
Please correct me if I’m wrong but it seems to me, Mr layman, that terms that meteorologist used among themselves are now being used more often in weather reports to the public?
“Bomb Cyclone”. “Polar Vortex”. “Derecho”.
None of these events are new to those of the public old enough to remember but the name of the event is.
One of the problems with modern education is the degree of specialisation to which practitioners are driven.
I have met people who were exceptionally knowledgeable in their particular field yet spectacularly ignorant of relatively simple facts in other areas.
Every “climate science” course should have a compulsory History module.
Even the briefest acquaintance with historical fact would debunk the hysterical claims of ‘unprecedented’ events.
😎
“If it happened before in history, it doesn’t matter! It never happened before in Myhistory!! (at least, that’s what they tell me.)”
I grew up overlooking a very large lake (in Ireland). When I was a little boy my Father told me that once, when he was a little boy it froze over and that people crossed it on horses and carts. I won’t say I didn’t ‘believe’ him, but it kinda stretched my credulity. My father died in his 90s.
A couple of years ago the lake froze over again…and people drove across it in tractors!
I think there’s something about being young that makes us skeptical of what our folks tell us, and gullible with regard to what the media tell us.
“I think there’s something about being young that makes us skeptical of what our folks tell us, and gullible with regard to what the media tell us.”
It’s called “youth and inexperience”. 🙂
I have a similar story. My mother (born 1917) told me that it once ( when she was a child) snowed in my village. 90 years later it happened again.
I believe it was Cicero who said that if you did not learn what happened before you were born you would be a child forever.
The over-hyped Global Warming alarmism is undermining the political credibility of the Climate Change / CAGW hypothesis. but like the Zombie, it just won’t lie down and die. There is still too much money flowing after each time the corpse twitches, that the acolytes keep on poking the body.
How Do You Know A Climate Alarmist Is Lying? Their Lips Are Moving
Claim #8: We’ve Seen…Storms That Are Growing Stronger
Response to Claim #8: The evidence simply doesn’t support this claim. Tornados have not been becoming more frequent or strong, and they certainly aren’t tied to the rate of change of CO2. Once again, warming isn’t evidence that man is causing the warming. Unless you can explain how CO2 can warm the oceans, there must be some other factor causing the warming. The most likely cause is simply fewer clouds over the oceans allowing more visible radiation to reach the oceans.
https://co2islife.wordpress.com/2018/01/13/how-do-you-know-a-climate-alarmist-is-lying-their-lips-are-moving/
“Response to Claim #8: The evidence simply doesn’t support this claim. Tornados have not been becoming more frequent or strong, and they certainly aren’t tied to the rate of change of CO2. Once again, warming isn’t evidence that man is causing the warming. Unless you can explain how CO2 can warm the oceans, there must be some other factor causing the warming. The most likely cause is simply fewer clouds over the oceans allowing more visible radiation to reach the oceans.”
Tornadoes are not storms.
They in large part get their energy from the overlying cooler (relative to a SALR) and drier air.
The moist surface air is but one part of the equation and a smaller one when compared with the CAPE aloft in the cloud.
“Unless you can explain how CO2 can warm the oceans, there must be some other factor causing the warming.”
It has been explained – but again…
For the same reason that the GHE works – it slows cooling.
The ocean/atmos interface is where the cooling takes place.
However in order for waters below to lose heat at that interface then the deltaT from there to the skin layer must be as great as possible (cooler at the skin).
The GHE reduces that delta such that the flux is slowed and cooling slowed as a result.
From Nick Stokes website….
https://moyhu.blogspot.co.uk/2010/10/can-downwelling-infrared-warm-ocean.html
https://www.researchgate.net/publication/223950477_Measurements_of_the_oceanic_thermal_skin_effect
“The most likely cause is simply fewer clouds over the oceans allowing more visible radiation to reach the oceans.”
Well that happens when ocean SST’s are below normal. But they are above normal in the Pacific in +ve PDO/ENSO regime. So it evens out.
The much touted graph often posted here simply shows that effect during the “hiatus” period. It is an effect. Not a cause.
1) Tornadoes and hurricanes are frequently used as evidence of extreme weather caused by climate change. The recent cold winter weather is being used by Michael Mann and Al Gore.
2) The air above the oceans has a high concentration of H2O, making CO2 irrelevant. You can’t find a CO2 signature until you are way up in the atmosphere, above where H2O has dropped out.
3)Clouds are also triggered by cosmic rays, and other. Many causes other than warming or CO2 can alter clouds.
I do wish the alarmist would give it up. “Man’s CO2” causes “Global Warming!”. It causes “Freezing, caused by ‘Global Warming!'”
Drop the politics, return to science.
What’s happening is natural, even if unpleasant.
(What would be more unpleasant would be to surrender worked for treasure and freedoms to fight a computer generated “Bogey Man”. Worse yet is to deny cheap energy energy to those who need it based on an hypothesis that is only supported by politics, PR and the MSM. Not by science.)
“1) Tornadoes and hurricanes are frequently used as evidence of extreme weather caused by climate change. The recent cold winter weather is being used by Michael Mann and Al Gore.”
Nither Mann nor Gore is the IPCC.
The real extremes are decades away.
Present Hurricans are difficult to quantify as meteorology impacts also. Vis ENSO and wind-shear and the dryness of Saharan air. Check out Pacfic Monsoon/Typhoons however.
“2) The air above the oceans has a high concentration of H2O, making CO2 irrelevant. You can’t find a CO2 signature until you are way up in the atmosphere, above where H2O has dropped out.
CO2 is well-mixed in the atmosphere (look at CO2 levels at the south pole FI).
CO2 backradiates LWIR. it just does. It’s effect is over and above H2O.
“3)Clouds are also triggered by cosmic rays, and other. Many causes other than warming or CO2 can alter clouds.”
Not to any proven degree in the actual atmosphere. Just to a small degree in the lab.
Besides the correlation is backwards as weak solar allows more GCR’s (supposedly more cloud/cooling) but apart from the solar cycle being just that (cyclic – and therefore evening out) the sun has been slowly weakening for ~50 years! Whilst the Earth has warmed – the vast majority of it being stored in the oceans.
Also find any thread here where Leif Svalsgaard has chipped in.
Thank you for your lucid treatise. If common sense does not prevail i dread the world my offspring will have to endure. AGW are but one weapon in the arsenal of population manipulation. The phrase “the meek shall inherit the earth” resonates to my core … we are soon to be categorized as either Lemmings or Lepers.
How prepared are we for the end of this inter-glacial?
Putting all our eggs in one basket is one huge mistake.
Yes, …err I mean no. Or perhaps… still chewing…
Climate history lesson: History repeats itself. In the 17th century, it was called weather cooking. In the 21st century, it’s called global warming
There isn’t a single one. The only disaster emerging is the spreading cultural marxism.
“There isn’t a single one. The only disaster emerging is the spreading cultural marxism.”
None were expected to emerge as yet (bar the odd rogue scientist saying something daft).
What makes you think they should do when CO2 is increasing at just 2ppm/year?
We are decades away as yet.
Decades away from what? Greater crop yields? Less deaths from cold? Lower energy usage for heating? Higher biological productivity in polar waters? Forests expanding into tundra? Generally increased rainfall? Generally increased plant growth w/savannahs expanding into deserts?
I don’t see the problem, in fact I pretty much see advantages. Don’t you?
Toneb, post a misleading statement since it is well know that the 1990 IPCC report made a prediction that it would warm on average of .30C PER DECADE, yet Satellite shows only half that rate from that date.
2001 and 2007 IPCC reports say it was still supposed to be .30C per decade, Satellite data still shows HALF that projected rate from those dates.
Your lies are boring.
“2001 and 2007 IPCC reports say it was still supposed to be .30C per decade, Satellite data still shows HALF that projected rate from those dates.
Your lies are boring.”
Err, I said nothing of that my friend.
You goal-pos shifting is typical of here and boring.
But since you bring it up ….
And of course you mean UAH rather than RSS sat data even though it is plainly runnng cold with Radiosonde data ….. which RSS partially corrected for.
http://postmyimage.com/img2/792_UAHRatpacvalidation2.png
Compared against surface obs its looking pretty good.
And Hadcrurt and JmA show the same – so no goal-post shifting. … “adjusted” thanks (which was the US anyway with SSTs from the past reducing the trend.
http://www.realclimate.org/images//cmp_cmip5_sat_ann.png
Also you are disingenuous in not giving a full quote from FAR ….
https://www.ipcc.ch/publications_and_data/ar4/wg1/en/spmsspm-projections-of.html
“Since IPCC’s first report in 1990, assessed projections have suggested global average temperature increases between about 0.15°C and 0.3°C per decade for 1990 to 2005. This can now be compared with observed values of about 0.2°C per decade, strengthening confidence in near-term projections. {1.2, 3.2}
Model experiments show that even if all radiative forcing agents were held constant at year 2000 levels, a further warming trend would occur in the next two decades at a rate of about 0.1°C per decade, due mainly to the slow response of the oceans. About twice as much warming (0.2°C per decade) would be expected if emissions are within the range of the SRES scenarios. Best-estimate projections from models indicate that decadal average warming over each inhabited continent by 2030 is insensitive to the choice among SRES scenarios and is very likely to be at least twice as large as the corresponding model-estimated natural variability during the 20th century. {9.4, 10.3, 10.5, 11.2–11.7, Figure TS.29}
There are uncertainties my friend and a bald statement of 0.3 C/Dec is “contrarian” cherry picking, when a range of 0.15 to 0.3 what was projected
Oh, and I’d suggest that if it is “boring” for you, that perhaps you broaden you horiizons and actually follow the science.
So cherry-picks in one statement.
Well done.
Using mal-adjusted temperature data as always , and STILL the 2016 El Nino peak barely reaches the average.
Thanks for showing us all JUST HOW PATHETIC those models really are. :-).
Wonder what happens when we add UAH6.0 and RSS3.3, aligned to 1980.

Seems the modelling guys need to widen out their range even further, hey. !!
Build an even bigger barn ! 🙂
And you know Ratsac was specifically selected and adjusted n a vain attempt to help the models, so stop being so mendacious.
ps. you now have 2017 data,
Why have you not added it to your graph.?
We all know why, don’t we. 😉
So we’re to believe that these cold events are becoming rarer( because of climate change) but at the same time when they do occur, that is also evidence of climate change?
The article was disjointed
and far from Mr. Ball’s usual
consistently good articles
(at least last year)
It morphed from climate politics
to some complicated paragraphs
on meteorology, that were unnecessarily
confusing, and then back to climate politics.
Bomb cyclone was a new scary name
for an old weather pattern with a harmless name.
That’s leftist propaganda.
I don’t understand the purpose of the
charts and meteorology paragraphs
when discussing the politics of climate change.
This seems like two articles melded together-
one on climate politics, written clearly,
and one on meteorology, that was confusing,
unless you were a meteorologist, I suppose.
Any complicated subject can be explained simply
by a person who is an expert in the subject.