From UCSD/Scripps Institution of Oceanography
New study reveals strong El Niño events cause large changes in Antarctic ice shelves
A new study published Jan. 8 in the journal Nature Geoscience reveals that strong El Nino events can cause significant ice loss in some Antarctic ice shelves while the opposite may occur during strong La Nina events.
El Niño and La Niña are two distinct phases of the El Niño/Southern Oscillation (ENSO), a naturally occurring phenomenon characterized by how water temperatures in the tropical Pacific periodically oscillate between warmer than average during El Niños and cooler during La Niñas.
The research, funded by NASA and the NASA Earth and Space Science Fellowship, provides new insights into how Antarctic ice shelves respond to variability in global ocean and atmospheric conditions.
The study was led by Fernando Paolo while a PhD graduate student and postdoc at Scripps Institution of Oceanography at the University of California San Diego. Paolo is now a postdoctoral scholar at NASA’s Jet Propulsion Laboratory. Paolo and his colleagues, including Scripps glaciologist Helen Fricker, discovered that a strong El Niño event causes ice shelves in the Amundsen Sea sector of West Antarctica to gain mass at the surface and melt from below at the same time, losing up to five times more ice from basal melting than they gain from increased snowfall. The study used satellite observations of the height of the ice shelves from 1994 to 2017.
“We’ve described for the first time the effect of El Niño/Southern Oscillation on the West Antarctic ice shelves,” Paolo said. “There have been some idealized studies using models, and even some indirect observations off the ice shelves, suggesting that El Niño might significantly affect some of these shelves, but we had no actual ice-shelf observations. Now we have presented a record of 23 years of satellite data on the West Antarctic ice shelves, confirming not only that ENSO affects them at a yearly basis, but also showing how.”
The opposing effects of El Niño on ice shelves – adding mass from snowfall but taking it away through basal melt – were at first difficult to untangle from the satellite data. “The satellites measure the height of the ice shelves, not the mass, and what we saw at first is that during strong El Niños the height of the ice shelves actually increased,” Paolo said. “I was expecting to see an overall reduction in height as a consequence of mass loss, but it turns out that height increases.”

After further analysis of the data, the scientists found that although a strong El Niño changes wind patterns in West Antarctica in a way that promotes flow of warm ocean waters towards the ice shelves to increase melting from below, it also increases snowfall particularly along the Amundsen Sea sector. The team then needed to determine the contribution of the two effects. Is the atmosphere adding more mass than the ocean is taking away or is it the other way around?
“We found out that the ocean ends up winning in terms of mass. Changes in mass, rather than height, control how the ice shelves and associated glaciers flow into the ocean,” Paolo said. While mass loss by basal melting exceeds mass gain from snowfall during strong El Niño events, the opposite appears to be true during La Niña events.
Over the entire 23-year observation period, the ice shelves in the Amundsen Sea sector of Antarctica had their height reduced by 20 centimeters (8 inches) a year, for a total of 5 meters (16 feet), mostly due to ocean melting. The intense 1997-98 El Nino increased the height of these ice shelves by more than 25 centimeters (10 inches). However, the much lighter snow contains far less water than solid ice does. When the researchers took density of snow into account, they found that ice shelves lost about five times more ice by submarine melting than they gained from new surface snowpack.
“Many people look at this ice-shelf data and will fit a straight line to the data, but we’re looking at all the wiggles that go into that linear fit, and trying to understand the processes causing them,” said Fricker, who was Paolo’s PhD adviser at the time the study was conceived. “These longer satellite records are allowing us to study processes that are driving changes in the ice shelves, improving our understanding on how the grounded ice will change,” Fricker said.
“The ice shelf response to ENSO climate variability can be used as a guide to how longer-term changes in global climate might affect ice shelves around Antarctica,” said co-author Laurie Padman, an oceanographer with Earth & Space Research, a nonprofit research company based in Seattle. “The new data set will allow us to check if our ocean models can correctly represent changes in the flow of warm water under ice shelves,” he added.
Melting of the ice shelves doesn’t directly affect sea level rise, because they’re already floating. What matters for sea-level rise is the addition of ice from land into the ocean, however it’s the ice shelves that hold off the flow of grounded ice toward the ocean.
Understanding what’s causing the changes in the ice shelves “puts us a little bit closer to knowing what’s going to happen to the grounded ice, which is what will ultimately affect sea-level rise,” Fricker said. “The holy grail of all of this work is improving sea-level rise projections,” she added.
###
“The holy grail of all of this work….”
Egads! Mixing biblical metaphors and science. Yeah, that’s the ticket.
Here is the paper: https://www.nature.com/articles/s41561-017-0033-0
Response of Pacific-sector Antarctic ice shelves to the El Niño/Southern Oscillation
Abstract
Satellite observations over the past two decades have revealed increasing loss of grounded ice in West Antarctica, associated with floating ice shelves that have been thinning. Thinning reduces an ice shelf’s ability to restrain grounded-ice discharge, yet our understanding of the climate processes that drive mass changes is limited. Here, we use ice-shelf height data from four satellite altimeter missions (1994–2017) to show a direct link between ice-shelf height variability in the Antarctic Pacific sector and changes in regional atmospheric circulation driven by the El Niño/Southern Oscillation. This link is strongest from the Dotson to Ross ice shelves and weaker elsewhere. During intense El Niño years, height increase by accumulation exceeds the height decrease by basal melting, but net ice-shelf mass declines as basal ice loss exceeds ice gain by lower-density snow. Our results demonstrate a substantial response of Amundsen Sea ice shelves to global and regional climate variability, with rates of change in height and mass on interannual timescales that can be comparable to the longer-term trend, and with mass changes from surface accumulation offsetting a significant fraction of the changes in basal melting. This implies that ice-shelf height and mass variability will increase as interannual atmospheric variability increases in a warming climate.
But presumably an El Nino adds a vast amount of snow to the land-based ice sheet in Antarctica, thereby lowering sea level. The land-based ice is much more extensive than the floating ice-shelves.
The title of the post and the press release seems to be in conflict with each other:
“Study: strong El Niño events increase height and mass of Antarctic ice shelves”
“A new study published Jan. 8 in the journal Nature Geoscience reveals that strong El Nino events can cause significant ice loss in some Antarctic ice shelves while the opposite may occur during strong La Nina events.”
I think the title is wrong.
as they explain, “…a strong El Niño event causes ice shelves in the Amundsen Sea sector of West Antarctica to gain mass at the surface and melt from below at the same time, losing up to five times more ice from basal melting than they gain from increased snowfall…” the net effect is El Nino decreases ice shelf mass.
Science journalists are quite often scientifically illiterate.
The title should probably read
“Study: strong El Niño events increase height but decrease mass of Antarctic ice shelves”
[???? Why make that editorial change? .mod]
Mod…
The title states that “…El Niño events increase…mass…”
but
The article states that the Ice Shelves, From melting below, lose mass overall
I thought the same thing.
The title of the article is inconsistent with the study.
Why all these studies on the west Antarctic losing ice?……
…When the East is gaining so much ice it doesn’t matter
Because that is the only place there is a small net ice mass loss in Antarctica.
AND it is the western side where all the geothermic activity is located. (91 volcanos)
Besides that it’s the most accessible part of the continent and though I don’t know, I would guess the most susceptible to changes due to warm currents from an El Nino?
New Zealand scientists are currently drilling through the ice shelf to measure the water temperature below. The sensors will remain in place for some time providing valuable data.
http://www.nzherald.co.nz/nz/news/article.cfm?c_id=1&objectid=11963400
It’s scary to think that just a warm tropical breeze could send half of the Antarctic ice into the ocean and flood Manhattann.
I was curious about how satellite altimetry could determine basal melting rates at the Amundsen Embayment (PIG, Thwaites,… subject to much previous bogus alarm from JPL covered in essay Tipping Points). Paper is paywalled but SI isn’t. And sure enough, the basal melting rate was inferred from a model, not measured. So this PhD thesis actually proves next to nothing. Just like the previous Amundsen SLR alarm papers.
I wonder if the researchers factored in the effects of the swarm of sub-glacial volcanoes in West Antarctica and the Antarctic Peninsula? You know, the ones that are part of the Pacific Ring of Fire. The abstract suggests not.
SI maks no mention of them, but the glaciers (PIG, Thwaites, and the other four Amundesn Embayment) are exactly in that region. PIG even has volvanic ash layers imbedded in it.
Any glacial melt water from geothermal activity can only flow in one direction: downhill (beneath Thwaites) into the ocean underneath the ice shelf
Large heat flux @ -120 forms part of Thwaites head.

Notice also the array of volcanoes (white dots) in the area. A couple under PIG as well (just below WA).
“Large heat flux @ -120 forms part of Thwaites head.”
You need to give the units. It’s 120 milliwatts per sq m. Enough to melt about 12 mm of ice per year.
I was referring to -120 longitude.
Keep in mind those heat flux values are modeled, not measured. Could be much more, and definitely would be with any kind of geothermal/volcanic venting.
And that map may, or may not, represent what is going on now. I believe the aerial magnetic survey took 50 years to complete. I have no idea when the western part was done.
The main cause of the ice variability is the Antarctic Circumpolar Current bi-polar wave, with two peaks/(troughs) separated by about 8 years, possibly synchronised by the ENSO events.
The warm patches are 2 to 3°C warmer than the mean sea surface temperature (SST) and the cold patches are 2 to 3°C cooler than the mean SST. The ACC is one of the world strongest currents and could be seen as a rotating warm/cold mass of water.
http://www.parks.tas.gov.au/fahan_mi_shipwrecks/infohut/images/acw2.jpg
Antarctic Circumpolar Wave circulating around Antarctica. Warm pools are in red; cold pools are in dark blue.
No mention then of the 91 new volcanos that researchers from the University of Edinburgh recently discovered underneath the West Antarctic Ice sheet which they, too, claimed could impact basal melting. More settled science I do believe.
not to mention the seafloor around there dotted with them. Also a sub ice volcanic eruption was measured seismically a couple of years ago by Washington University researchers.
The notion of an East and West in Antarctica seems strange to me when the whole place is a circle.
A compass is also a circle.
[? Certainly, certain compass types can draw or scribe a circle. .mod]
What about volcano (submarine) activity effect?
https://www.theguardian.com/world/2017/aug/12/scientists-discover-91-volcanos-antarctica
The article states, “What matters for sea-level rise is the addition of ice from land into the ocean, however it’s the ice shelves that hold off the flow of grounded ice toward the ocean.” I see this statement made frequently. However, I have never seen a strong defense of it. Personally, I question whether the floating ice provides anywhere near the buttressing effect from inertia that the friction with land provides. Tension cracks develop in the floating ice shelves, strongly suggesting that the ice is not experiencing compression from the movement of the grounded ice. That is, the alleged buttressing effect is probably negligible compared to ice-land friction.
Grounded ice is what they refer to I believe.
Gary,
If the “ice shelf” is grounded, then ‘warm’ ocean water will have difficulty getting under it and melting it. Every time a major chunk calves, everyone gets alarmed because it means it will be less effective at buttressing — or so they claim! A grounded ice sheet experiences essentially the same dynamics as a continental glacier except that the ice is buoyed by the surrounding water and that reduces the friction. Also, being immersed in water, the contact surface with the underlying bedrock is probably more lubricated, meaning even less friction. What is at issue is how effective floating ice is at buttressing the grounded ice.
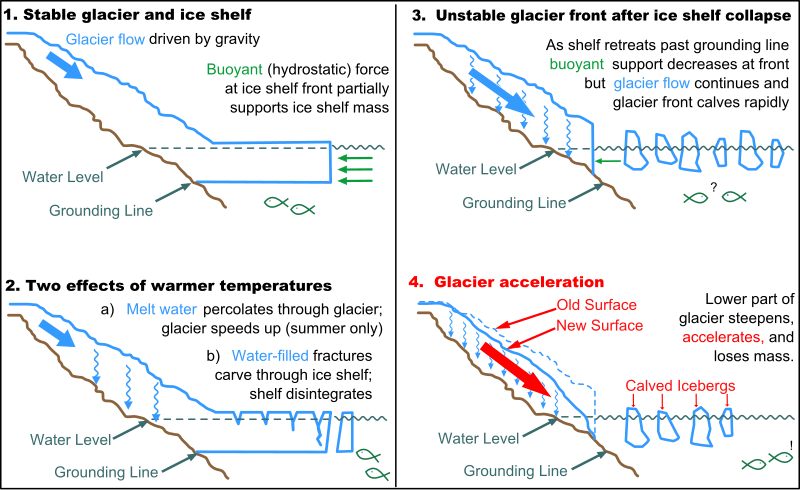
I think that’s probably right. The graphic below claims that hydrostatic force restrains ice shelf movement away from land, but I think that’s BS (push a flat object through water fast and there is strong resistance; push it slowly and there is virtually none.). Ocean currents and buoyancy probably work to move the ice shelf away from land.
“The study was led by Fernando Paolo while a PhD graduate student and postdoc at Scripps Institution of Oceanography at the University of California San Diego. Paolo is now a postdoctoral scholar at NASA’s Jet Propulsion Laboratory.”
jet propulsion lab really doesn’t work on jet propulsion at all, does it?
“jet propulsion lab really doesn’t work on jet propulsion at all, does it?”
No they do Argo adjustments also.
Are ice shelves sea ice or land ice? Or just another term to confuse thangs.
Per graphs at NSIDC and Climate4you the Antarctic SEA ice swings from about 3 E6 km^2 to almost 20 E6 km EVERY year and if you can tease some kind of trend out of that you’re a true Mann-ian statistician.
The Arctic does the same EVERY year, but opposite to the South Pole.
“Are ice shelves sea ice or land ice? Or just another term to confuse thangs.”
Land ice, as they flow from the land and are grounded below the ocean surface. IE they do not float.
Both isn’t it? Once the water gets deep enough the shelf floats?
Toneb
Ice shelves are NOT considered sea ice by the “sea ice community” DMI, NSIDC, Cryosphere, Dr Curry, etc, according to their various replies to my earlier queries. Neither, by the way, is fresh water ice – Lake Baikal (Russia), Crater Lake (US), Great Lakes (US-Canada), etc. The sea ice community does count the St Lawrence River Gulf ice as sea ice, but it is a very, very small area compared to the entire arctic sea ice area.
Right, not sea ice, but ice shelves do float beyond the grounding line
Sea ice is ice that forms in open water, eg, arctic. Therefore, a floating ice shelf is not sea ice because it forms on land.
“Ice shelves are NOT considered sea ice”
????
Err, that’s just what I said!
Headline:-
First line of main text:-
So which is it?
… “strong El Nino events can cause” … The word ‘can’ is a weasel word.
… “strong El Nino events can cause” … The word ‘can’ is a weasel word.
… “strong El Nino events can cause” … The word ‘can’ is a weasel word.
If the paper proves anything, it proves that ice mass is increasing on the ice shelves due to increased deposition. That’s what they actually measured. But then the paper goes on to model two factors that reduce that measured increase, one of which makes sense, and one which makes no sense. The one that makes sense is a compression factor, where loosely compacted ice (due to increased weight from above, due to more deposition) compacts the ice below. This loss of height was only modeled, but it was only a small effect, and at least makes sense. The one that makes no sense is an imaginary (modeled) increase in melt from below during an El Nino. The reason I say it makes no sense is because during an El Nino, western Pacific tropic to polar currents are reduced due to the collapse of the trade winds that push them. Warm tropically heated water is sloshing east and so less is flowing toward the poles. There should be less melt from below during an El Nino event. And then after the El Nino breaks up, maybe more as extra warm tropical water rejoins the tropical to polar convective flow.
Anthony, your article’s headline contradicts its subject matter.
This study was poorly planned. They are aware that El Nino and La Nina are both phases of the ENSO oscillation but show an interest only in El Nino. They should know that El Ninos and La Ninas are generated in pairs because a\ La Nina comes from the backwash of an El Nino in the Pacific and both are spread around the globe be the Northern Hemisphere westerlies. As a result the global wind pattern is an advancing carpet of progressive warm and cold ENSO waves. One complete such ENSO cycle, containing both an El Nino and a La Nina, takes four to five years to pass overhead. To study this periodicity you should allocate at least that much time and perhaps twice as much to record the full effects of ENSO. To learn more, read “What is ENSO?” in “What Warming.”
“The intense 1997-98 El Nino increased the height of these ice shelves by more than 25 centimeters (10 inches). However, the much lighter snow contains far less water than solid ice does. When the researchers took density of snow into account, they found that ice shelves lost about five times more ice by submarine melting than they gained from new surface snowpack.”
The trouble with this reasoning is that they seem to regard snow and ice as two separate things. They aren’t. An ice shelf is on average about 200 meters thick. About half-way through (c. 100 m) the pressure is large enough to compress snow into ice. So if 25 cm of snow falls on top of an ice-shelf, an equal mass of snow is converted to ice a hundred meters below.