Global warming/climate change advocates want us to believe that computer models will accurately predict temperature out to the year 2100, yet NOAA, which uses computer models to predict the next seasonal outlook, couldn’t even get that right. The north, northeast, and deep south have been in a deep freeze, with blizzard like conditions, and well below normal temperatures. Temperature records have fallen all over the eastern half of the USA in the last two weeks. Meanwhile, advocates of global warming/climate change certainty, such as Al Gore and Michael Mann, took advantage of the cold snap and said have said “that’s exactly what we should expect from the climate crisis“.
Meanwhile, back in the real world, reality bites for NOAA’s short term climate prediction.
From climate.gov, excerpts of their prediction in October.
Both the temperature and precipitation outlooks lean on typical La Niña impacts, particularly those of the past 30 years, and bear some resemblance to the outlooks issued for last winter (not surprisingly since the forecast guidance is similar – more on that below). In the image above, the winter precipitation outlook favors below-normal precipitation across the entire southern U. S., with probabilities greatest (exceeding 50%) along the eastern Gulf Coast to the coasts of northern Florida, Georgia, and southern South Carolina. In contrast, above-average precipitation is more likely across much of the northern parts of the country, in the northern Rockies, around the Great Lakes, in Hawaii, and western Alaska.

The temperature outlook shown above indicates above-average temperatures across the southern US, extending northward out West through the central Rockies and all the way up to Maine in the eastern part of the nation. Above-average temperatures are also favored in Hawaii and in western and northern Alaska. Chances are greatest in an area extending from the desert Southwest to central and southern Texas and Louisiana (greater than 50%).
Probabilities are tilted toward colder-than-normal temperatures along the northern tier from the Pacific Northwest to Minnesota and also in southeastern Alaska. However, the likelihood of below-average temperatures across the North is modest, with no probabilities in these regions reaching 50%.
…

Read the full outlook here
Surprisingly, the much maligned (as being with skill according to most NOAA meteorologists) Farmers Almanac got it somewhat right with the headline:
WINTER OUTLOOK 2017–2018: COLDER THAN LAST YEAR
Overall, the long-range winter forecast for 2017–2018 shows generally colder temperatures than last winter for the U.S. and Canada but not colder than a typical winter, based on historical averages.
However, their national forecast map didn’t really do justice to the cold wave we’ve seen.

The result is that 2017–18 winter temperatures will be colder than last winter, they will likely still be above normal in the eastern and north-central states, with below-normal temperatures the rule from the Gulf States westward to California and from the Intermountain region westward to the Pacific Northwest.
The reality has been quite different than the climate forecasts.
Arctic air brings bone-chilling temperatures to US (CNN)
Arctic Outbreak Was One of the Coldest on Record For Late December Into Early January (TWC)
Parts of the central and eastern U.S. experienced one of their coldest late December through early January periods on record.
…
Dozens of other cities from the northern Rockies to Texas to the Great Lakes and East Coast had at least a top-five-coldest two-week stretch ending Jan. 5, according to the SERCC.

According to data from the Southeast Regional Climate Center, (SERCC) the following cities shivered through their record-coldest Dec. 23-Jan. 5 stretch:
- Bangor, Maine
- Worcester, Massachusetts
- Buffalo, New York
- Flint, Michigan
- Green Bay, Wisconsin
- Duluth, Minnesota
- Rockford, Illinois
- Waterloo, Iowa
- Lincoln, Nebraska
While winter is not yet over, and a warm-up is forecast for mid-week as the jet-stream changes, forecaster Joe Bastardi suggests that we’ll see more below normal weather soon afterwards.
https://twitter.com/BigJoeBastardi/status/950005857193951232
https://twitter.com/BigJoeBastardi/status/950007855314341888
UPDATE: Dr. Ryan Maue quantifies just how cold it’s been:
https://twitter.com/RyanMaue/status/950134254725451777
In central NC, USA, my kitchen pipes froze, twice this week, encouraging me to take preventative measures — breaking out the quartz heater, opening the kitchen-sink cabinets, and blasting with warm air for a couple hours before bed and a couple hours upon arising, which solved the problem. The pipes on that side of the house run inside the walls for a short horizontal span above ground from the main line under ground and under the slab foundation.
I left some elephant-ear bulbs in the ground this year, hoping that they might overwinter okay. I’m having second thoughts now, even though I mounded up a foot of composting materials on top.
I had read the almanac prediction, hoping the cold would not get too ridiculous this winter. I have to say that the weather was misleading, being as warm as it was for so much later into December. Then, blam!, when winter hit, it hit decisively.
It is a scientific consensus that it got cold in the south and pipes froze. Now that is a censorious that I can get behind. I am from South Carolina and remember those times that you would get the occasional cold spell and have to take measures for prevent freezing pipes. I had to rescue a family that lived in a pre-manufactured home one winter. It was a mess when it thawed out. I had a neighbor that had one small section of pipe that was routed in an uninsulated space. It froze.
I lived in Georgia in the mid to late ’80s. There was a cold snap over Christmas one year where it got down to zero F. So many pipes froze, broke and then spewed water while people were away for the holidays that the water supplier forgave half of their water bills.
Try a cold water faucet fast drip on any water lines that are exposed to outside walls. Keeps the water running. Basement included. Less likely to freeze pipes.
In addition if needed, put a piece of styrofoam or thick cardboard pieces behind the water pipes and then leave cabinet doors open so warm air can circulate.
After our high quality frost-less spigot finally froze, all the replacements froze until we covered them with those Styrofoam covers from the orange apron.
Of course they predicted warmer… what else could they say?
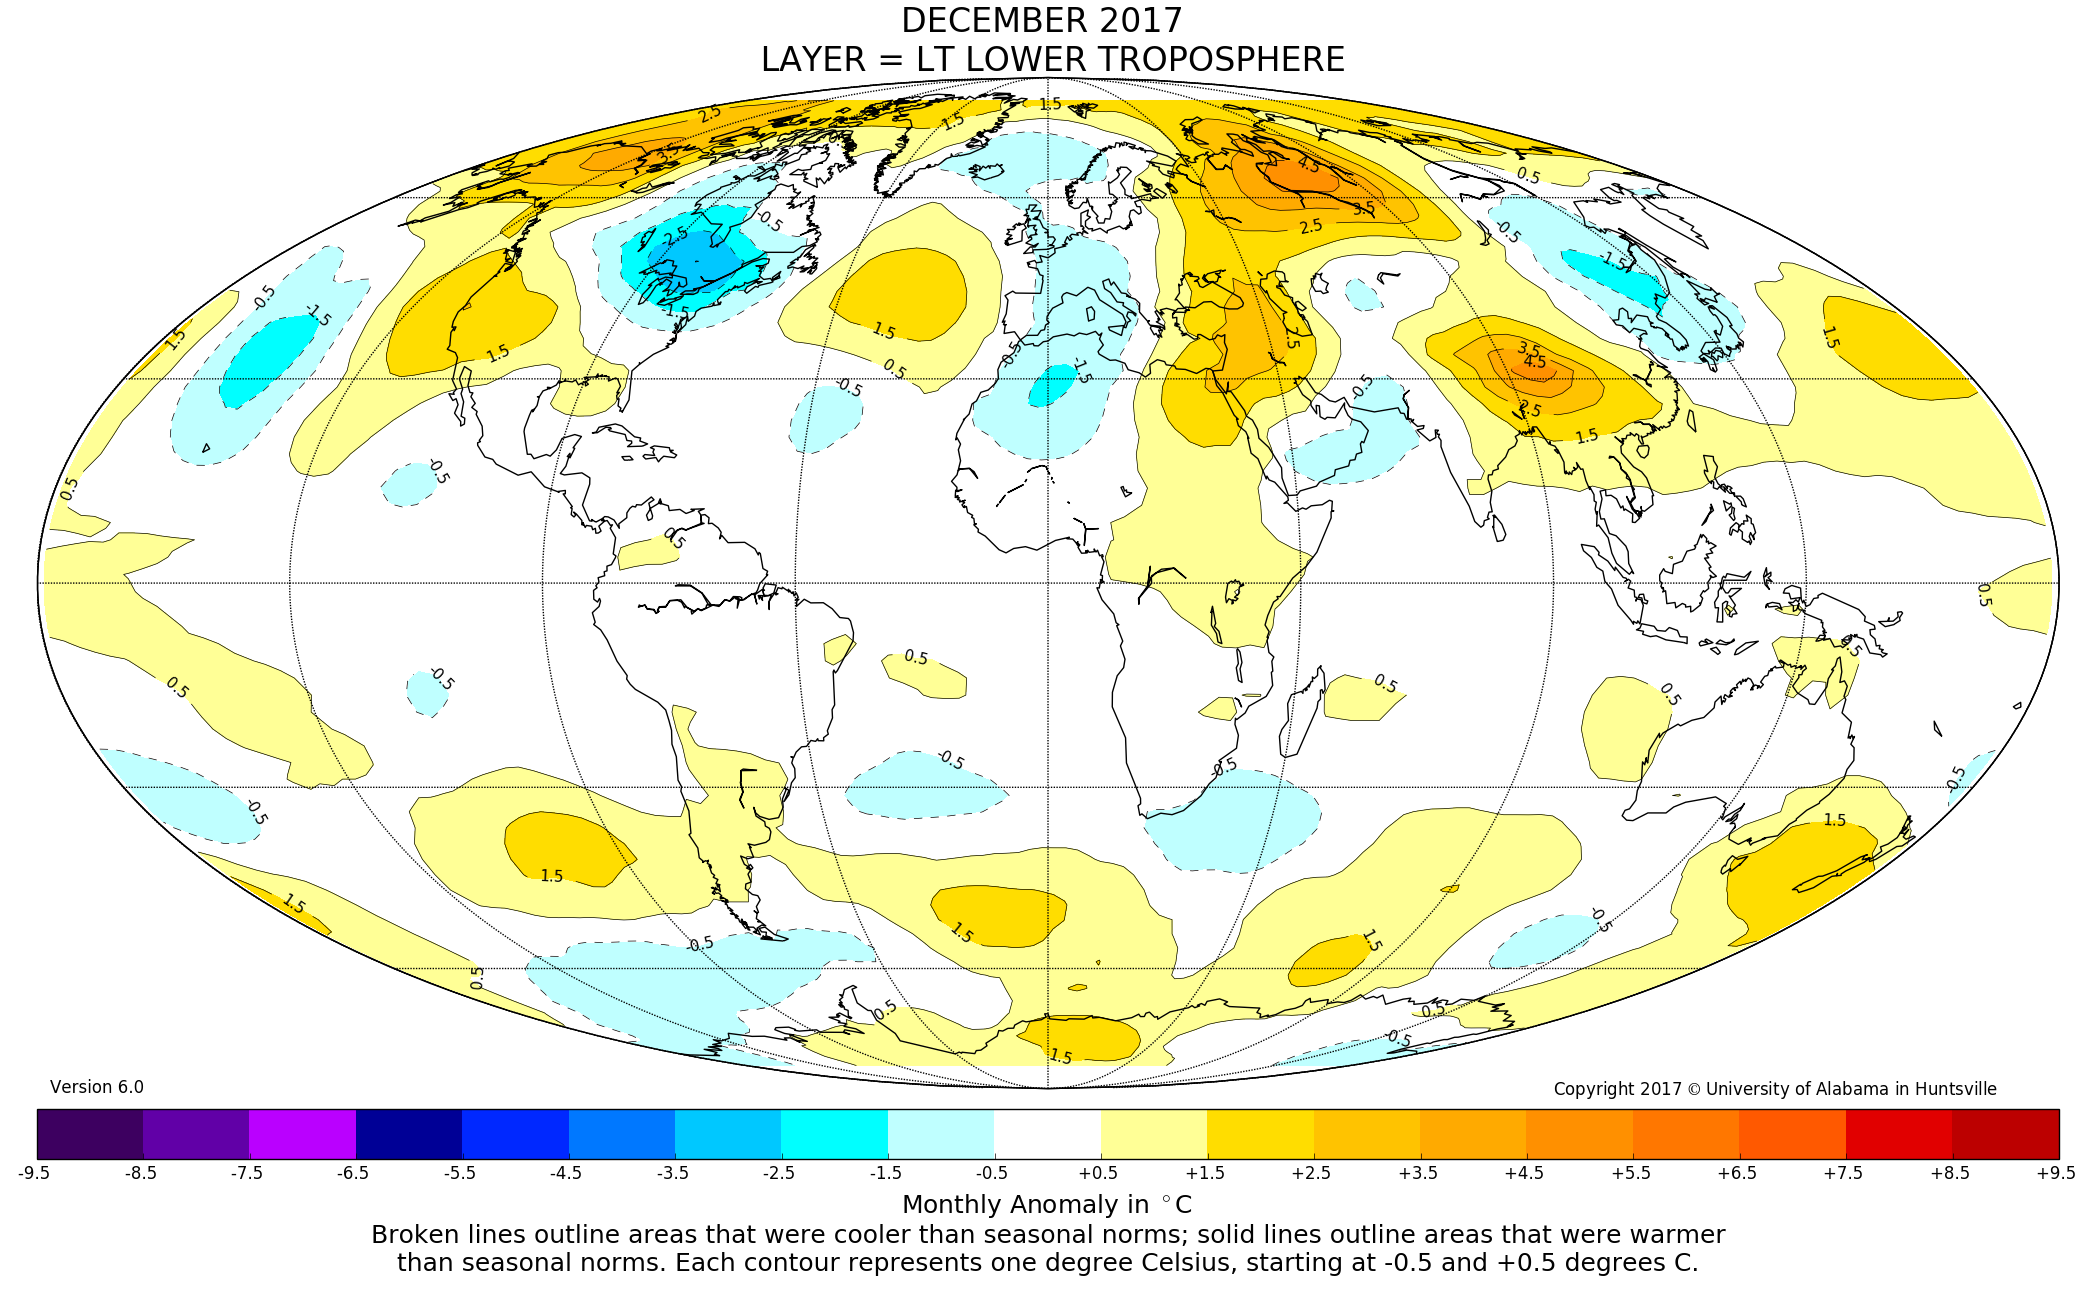
Unlucky given the warmer anomalies over the NH….
That pesky CO2 likes to ‘clump’. And it seems to ‘clump’ where I never go, there again its where most people never go, isn’t it? Anomalous anomalies; perhaps that should be a new measuring criteria for all GIGO modellers.
So, Alaska and Siberia are having a mild winter?
great to see that a small part of Northern Russia is -15C instead of the usual -20C 🙂
Which do you think they might prefer?
Seems to be some cool areas for summertime in the SH, too.
Ian Plimer’s book (Heaven and Earth) mentioned that people in Siberia used to get an extra ration of vodka when it was -15C or lower. Curiously, there seemed to be days when it was only -14 or 13?
When the ice cores were showing an ice age in North America, other cores at that time were showing warmer than usual temperatures in Venezuela and other areas. What we are seeing, today, is what an ice age is supposed to look like.
Ahem. Being a longterm New Hampshire resident, I may be required to point out that your reference is to the Old Farmers Almanac, proudly published in Dublin NH and founded in 1792, https://www.almanac.com . Joe D’Aleo had a long article in it about climate change and atmospheric/oceanic oscillations several years ago.
The Farmers Almanac is a lesser publication based in Maine since 1818, that no self-respecting New Hampshire curmudgeon would buy, even though it is their bicentennial. https://www.farmersalmanac.com/
Somebody probably already has done this, but it would be interesting to see a graph of both Almanac’s predictions with the Climate Model’s predictions vs actual observations (observations as reported at the time rather run through the blender later).
PS How the pressures compare from this “bomb” compare to ’78?
I haven’t looked into it in detail, and please excuse the mixed units, but I think the center of the storm reached some 956 mb. That was well offshore. Boston matched their minimum pressure they had in 1978. Near Concord NH, my minimum was just below 29.00″, that doesn’t happen often.
The 1978 storm stalled and brought four high tides, this storm kept moving, much to many people’s relief.
I think a lot of the people who were flooded weren’t on the seacoast in 1978 and didn’t realize how bad it can be.
Does anyone know if there is any science behind the Farmers Almanac forecasts?
They CLAIM to have a secret algorithm for predicting weather. They say it uses sunspots and historical weather patterns. I have long suspected that the “formula” involves darts augmented by copious amounts of beer. https://www.almanac.com/content/how-we-predict-weather
So that’s why they are more accurate than NOAA. I get it now.
Why is algor involved?
They say they have 3 components: planetary position, what the weather was, and the secret sauce they will not divulge.
Given that the forecasts are completed in early March for the following year (21 months ahead) they are remarkably good at predicting trends, major storms and rainfall.
A few years ago there was an edition in which they claimed to have moved on and were going to give up that old witchcraft and use climate models like proper scientists – proud ‘scientist’ photo and all. The forecasts were useless. They soon went back to what worked.
Weather is weather and climate is climate and never the twain shall meet unless they do and then it is still all man’s fault. It matters not the weather or climate where you live, they have a dialogue all set to go whatever they encounter.
The script is set and ready to load to the teleprompter and as every politician knows never stray from the teleprompter. .
Bill Powers
Weather is what fishermen and old wives predict to assess fishing and clothes drying prospects for the next day. Seaweed is a favoured predictive mechanism, as are red skies.
Lives, and drying linen, depend upon accurate daily predictions.
Climate prediction is the excuse for failed weather predictions by climate scientists, projecting their failures into the future, with the excuse that climate is easier to predict than weather. Climate predictors will, of course, be dead when their predictions are proven wrong or right.
Climate scientists make a living from long term climate forecasts they will never risk their lives on, but from which, they will derive considerable profit.
I’ll trust a fisherman or a washerwoman before I’ll trust the charlatan, voodoo science promoting, witch doctors of climate science.
Okay but let’s see the names and the committee members involved in the NOAA forecast next time for the ownership factor and the model basis and model components. Otherwise it is just another almanac call.
It wasn’t a model. It was done on the basis of analogues of typical La Nina driven NH circulation pattern. Weak, medium or strong and where the greatest +ve SST anomaly was likely to be.
Maybe they got that wrong. The methodology is there in the link provided.
It must also be said that a “typical” La Nina winter is not all LN winters.
But, but, the science is settled!! Oh I guess that’s just for projections out 20 -30 years or more. When it comes to giving an accurate outlook for the coming winter then the science is not so settled. BAWAAA!
Anomalous anomalies strike again!
Why was weatherbell correct in forecasting that this cold was coming, as far back as late Oct.? Why do the European forecasts have a much better rate of accuracy than the US models? There is a historical link between high Atlantic ACE years and cold early winter in the eastern US. How that fits with a “typical La Nina pattern” I can’t guess. All I know is that the SOI has had the bottom fall out recently and we are in a moderate phase 2 of the MJO. What that points to is a teleconnection of conditions very similar to what you posted above, ToneB. Check for yourself-
http://www.cpc.ncep.noaa.gov/products/precip/CWlink/MJO/mjoupdate.pdf
Toneb
You are suitably gullibleised.
Despite all the predictions of disappearing Arctic ice, massive sea level rise, catastrophic weather events, drought, population exodus etc. etc. None of them, over the past 40 years of these ridiculous predictions have materialised.
Isn’t that obvious to you?
And as far as I can gather, the only observable evidence of increased atmospheric CO2 is that the planet has greened.
Scientifically, isn’t that all that matters, the observable evidence?
So what else has happened? The planet has warmed a tad in the last 40 years since the global cooling scare of the 70’s. And is there any evidence that warmer is worse than what we have now?
No, quite the opposite. During the Roman warm period, soldiers manning Hadrian’s wall were complaining of the miserable cold conditions compared to their homeland.
And during the MWP, prosperity flourished.
WTF is your problem with a warming planet? There is more evidence that it is good rather than bad.
If increasing atmospheric CO2 is the problem, it’s done a pretty good job for us so far.
“…Why do the European forecasts have a much better rate of accuracy than the US models?…”
Ahem. https://wattsupwiththat.com/2013/06/14/12-reasons-why-the-met-office-is-alarmed/
and
http://www.dailymail.co.uk/debate/article-3187587/What-shower-money-Met-Office-gets-ludicrously-inaccurate-doom-mongering-climate-change.html
“Isn’t that obvious to you?”
The opposite actually.
I come here and see the bizarre cherry-picking “d” word in angry action.
Try to…
A). Realise there is weather.
B) the USA is not the NH, and not the world.
C) warm/cold air gets moved around. Because it is cold over the US or even snowing on tha Atlas moutains, that has left the arctic regions a little less cold.
B) that there are spells when NV slows the long-term warming trend of anthro CO2.
And that that NV (chiefly PDO/ENSO) should in fact be taking GMST down. Yet despite that, that enormous cold outlier of (not surface) global temps (and multiply, ahem adjusted – but makes no matter because of the double standards applied) …. UAH (v6.0 no less) continues to rise.
RAH:
I say again the winter forecast for the contiguous US was done on the basis of analogues (see the link in the article). A despite your desperate attempt to denigrate climate science re global warming, it has not the slightlest linkage to it, nor indeed to NWP weather forecasting.
Jim:
“That pesky CO2 likes to ‘clump’. And it seems to ‘clump’ where I never go, there again its where most people never go, isn’t it? ”
I take it that’s a joke? because surely no one can be so ignorant as to think that anyway applies.
Pop:
“Why was weatherbell correct in forecasting that this cold was coming, as far back as late Oct.? Why do the European forecasts have a much better rate of accuracy than the US models? There is a historical link between high Atlantic ACE years and cold early winter in the eastern US. ”
Exactly so – there is a link, and that is what this forecast attempted to use – Analogues (expected) of similar years.
Weatherbell did not do that forecast in Oct it used the MJO and ENSO from then through to Dec to construct the forecast of the severe cold plunge.
The ECMWF and UKMO NWP models are indeed superior to the GFS model.
Why, I don’t know exactly. But at far as the ECM forecast goes it runs some hours later with the data cut-off therefore likely having a better analysis …. from which a better forecast would follow.
Yes, and so there is a link between LN and early winter cold spells in the UK.
“WTF is your problem with a warming planet? There is more evidence that it is good rather than bad.”
At least you acknowledge t is warming.
No there is certainly no evidence (beyond a cut-off point) of that kind outside of the likes of WUWT. Try widening your “science” horizons. You wont find it here – only the reflexive attack of it.
My problem is with the selfish of this world who do not think of the mess we are making for future generations. It is most likely it will not affect the people on here directly in our lifetimes.
Modern civilisation has adapted to the climate of the last 200 years. When it changes enough that it needs to relocate – be it in mass migration due crop failure, or to escape coastal flooding.
WTF is your problem such that you need to attack the science in order to bolster your Ideological beliefs.
And before you say I do. I voted Brexit.
I understand the science that is only ever attacked on here. The logic of the science is enough for me, as well as applying common sense.
As we have these alternatives…..
1 All Earth scientists are incompetent.
2 All Earth scientists are fraudulent, money-grabbing fraudsters.
3 They know more than the average denizen here.
So unless and until we find Elvis alive and well in a UFO on Mars, then it has to be option 3 my friend.
Toneb
Nothing “desperate” about my reply. Res ipsa loquitur!
The gang at weatherbell used analogues and came up with a very accurate winter outlook that was published well before NOAA’s was issued. As Joe Bastardi has explained many times, the first trick is selecting the correct years to use for comparison. NOAA either failed to do that or failed to properly analyze what they were pointing to. Doesn’t matter if models were involved or not. (Though I would bet they at least had some influence on their outlook) What makes their failure even worse is that harsh winters for the eastern US are the general rule when La Nina conditions exist in zones 3.4.
No matter what the reason NOAA’s outlook for the winter was a big fail showing warming over vast areas where it has been anomalously cold. And yet we are to trust their claims and projections about the climate? Get real man. Your trying to defend the indefensible.
A Siberian cold air mass slipped around our side of the northern hemisphere and dragged south by the jet stream this last cool blast out of the North. It happens every once and awhile. I don’t think it means anything. Unless thus becomes a new trend over the coming decades. I sure hope not, but either way, I am moving south. So count me in as a climate refugee, but ass backwards. I am escaping the cold and dark winter nights.
As for NOAA predicting the climate out to 2100, that’s a mugs game. Or something you make a bet on in the commodities/futures markets, or worse, Las Vegas. But a long time to wait to see any result. May as well consult an astrologer. After all, they have thousands of years of a head start on NOAA. And there guess isn’t much better than the future of chaos.
You are welcome to join us in the Deep South but it was in the teens all week here in North Central Alabama so don’t forget the long johns.
It was in the teens for a few nights here in the Florida panhandle as well.
Joe knows snow. I started checking in on the Weatherbell.com site about a year ago and quickly made it a daily practice. The guy’s been money all year. Likeable character as well. Don’t waste your time with TWC, or the like. You’ll also learn a ton from.Joe at Weatherbell.
I agree Freddy – Joe d’Aleo and Joe Bastardi at Weatherbell are the best in the weather forecasting business, imo.
Over a number of recent years, the NWS Winter Forecast has been too warm. The NWS December 2017 forecast looks a bit shaky – let’s see how they do for the rest of the winter.
Here is a story you may find of interest.
https://wattsupwiththat.com/2017/01/13/new-butt-covering-end-of-snow-prediction/comment-page-1/#comment-2397292
A little recent history about Winter weather forecasts:
The National Weather Service (NWS) of the USA forecast a warm winter for 2014-15 and my friend Joe d’Aleo told me in October 2014 that the NWS forecast was seriously incorrect, and that the next winter would be particularly cold and snowy, especially in the populous Northeast. This was the second consecutive year that the NWS has made a very poor (excessively warm) Winter forecast, in Joe’s opinion – and he and his colleagues at WeatherBell have a great track record of accurate forecasts.
Joe and I had been working together on a paper on Excess Winter Mortality, and I suggested to Joe that this false “warm winter” NWS forecast was dangerous, especially if the country and its people were unprepared. Joe agreed, but did not know how to tackle the problem.
I proposed an approach, and we prepared a presentation for my friend at the US Energy Information Administration (EIA). Joe then prepared his own monthly Winter Forecast by region for the EIA, who re-ran their winter energy demand calculations. Using Joe’s forecast, the EIA projected 11% more winter energy required for the USA than the “warm” NWS forecast had projected.
After that brutally cold and snowy winter, a back-analysis showed that the actual energy used was 10% more than the NWS forecast projection, and just 1% less than Joe’s forecast projection.
(Note: all numbers are from memory.)
So I think we did a good deed.
As far as the subject 2017 paper is concerned, I expect the climate in the US Northeast to get colder, not warmer, starting soon. Those states that have adopted foolish green energy schemes will soon find that green energy is not green and produces little useful energy.
Regards to all, Allan
Allan,
In many ways I hope you’re wrong, but I suspect you’re right. Tragically, that means much suffering for many people unless the legs are cut from under the green blob.
Tragically, again, that won’t happen until the planet begins another cycle of cooling, for which there will be yet another knee jerk political reaction to an event well predicted by people like you and your colleagues, which will precipitate yet another climate crisis.
Hello HotScot and very good to hear from you.
I wish you and all of Scotland an early Robert Burns Day, as the Calgary Burns Club and so many others worldwide supp on the wild Haggis and remember the Bard.
The fact is Earth already experienced ~35 years of natural global cooling from ~1940 to ~1975, even as CO2 concentrations strongly increased..
We can already quantify climate sensitivity to increasing atmospheric CO2 – it is no more than ~1C/(2xCO2) and global warming is NO real threat to humanity or the environment.
Does society have to experience more decades of natural global cooling, and many resulting deaths, before our idiot politicians accept the obvious? Apparently yes.
Your aye, Allan MacRae of the Clan MacRae 🙂
Post Script:
FIGHT SONG – AT EILEAN DONAN CASTLE
https://m.youtube.com/watch?v=mOO5qRjVFLw
Joe Bastardi is a great teacher of Meteorology. If you look up the stuff he mentions and take a few notes, you will guaranteed get an education in “the why before the what”.
Anybody who would diss this guy is probably not a true meteorology geek. At least, they don’t watch his daily labors to realize he is the ultimate weather (and sports) archive.
He is also good on Hurricane prediction. Truth over agenda.
Maybe not so good at sea ice extent prediction though. Here he is in 2010 predicting that 2011 minimum Arctic sea ice extent would return to 2006/06 levels of around 5.5 million square km:
https://wattsupwiththat.com/2010/11/23/joe-bastardis-2011-arctic-sea-ice-prediction/
2011 minimum extent was 4.3 m/km2; but what’s 1.2 million square kms between friends?
DWR54 aka WD40
I never bother to check your stuff anymore because it is typically biased, incorrect, or just more of your usual BS.
You are a professional troll – you do “drive-by shootings”, without bringing any value to the discussion.
Here is a question for you:
Why did the world cool for about 37 years from ~1940 to ~1977, even as fossil fuel combustion rapidly accelerated after the start of WW2?
Hint:
All the other responses I’ve seen to date (except “Due to natural causes”) have either avoided the question or are just more blatant falsehoods, unsupported by credible evidence.
Is atmospheric CO2 such a miracle molecule that it is the primary cause of BOTH global warming AND global cooling? If you answer “yes” like Al Gore and others, please explain the physics of this remarkable phenomenon. Also kindly explain why “up is down”, “black is white”, “in is out”, etc.
What’s with the “boxes”? What’s with the 5-day temps? If this was a heat wave we would get every station very day if a new max was reached. Let’s see a list of record lows for each day and every station. How many record lows were recorded in total? Would like to see this before they can “correct” the data.
So looked through 1967 and 2011 historical data….I’ll take it. It’s not going to be warm (although it hit 70F at the end of March in 1967), but it’s not going to be -60F wind chills either.
The troublesome is the snow depth–if we are going to return, great on the non-snowy drive into work days, but overall, the farmers are not going to be happy at ALL (yes I can hear you, when are they ever happy with the weather). I mean just over a foot of snow is not going to do our crops much good come Spring.
But all in all, I’ll take it, even though I’m looking at a 3 day thaw and rain in January.
One thing I’ve never been able to understand (more than 1 but lets keep it simple) about the alarmists…why is a warmer Earth a BAD thing? Never understood how a longer growing season, more CO2 for the plants and less ice and snow is considered a BAD idea. I guess if I were into coastal real estate I would think differently I suppose. But it’s like there won’t be any adjustments made…of course there will be. Just look at the real estate on barrier islands. There used to be a gorgeous hotel off 1 of them in NC–the last time I was there it was almost completely underwater. Now some will proclaim the sky is falling over it, while more pragmatic people would knock some sense into the developer. You don’t build on the north end of a barrier island you idiot. You build on the southern end because they MOVE.
😀
Jenn wrote:
“One thing I’ve never been able to understand (more than 1 but let’s keep it simple) about the alarmists… why is a warmer Earth a BAD thing? Never understood how a longer growing season, more CO2 for the plants and less ice and snow is considered a BAD idea.”
You are correct Jenn – a slightly warmer world with more atmospheric CO2 would be a better world, for both humanity and the environment. The recent paper by Christy and McNider (2017) concludes that climate sensitivity to increasing CO2 is NO higher than ~1C/(2xCO2), which means that even IF all the recent warming is due to rising CO2 (and it is NOT), then future global warming will be moderate and beneficial to humanity and the environment.
It is much more probable that most of the recent warming is driven by natural factors, not CO2, and I predicted in 2002 that natural global cooling will recommence in the next decade or so, similar or more severe than the natural cooling that occurred from ~1940 to ~1975 (even as CO2 concentrations strongly increased).
Earth is cooler than optimum for humanity, as evidenced by this paper*. In past natural global cooling periods during the Maunder and Dalton Minimums, huge numbers of people perished. If cooling resumes, we should do better this time with modern technologies, except that our idiot politicians have compromised energy systems with “green energy” schemes that are not green and produce little useful (dispatchable) energy.
Regards, Allan
* COLD WEATHER KILLS 20 TIMES AS MANY PEOPLE AS HOT WEATHER, September 4, 2015
by Joseph D’Aleo and Allan MacRae
https://friendsofsciencecalgary.files.wordpress.com/2015/09/cold-weather-kills-macrae-daleo-4sept2015-final.pdf
I think I can answer Jenn Runion’s question: why is a warmer Earth a BAD thing?
There are people who are not happy unless they have something to complain about. The bunch that we have loosely termed CAGWers or Warmians, or any of those other euphemisms, are simply not happy if they don’t have a “warm Earth” to complain about, because a cooler Earth shows up their inaccuracies and and failures. And that makes them unhappy. Therefore, everything is attributed to a warming planet when it seems to be going in the opposite direction, and that makes them even more unhappy, giving them more to complain about.
Jenn:
Wrong.
I worked during my youth on a dairy farm, lived amongst farmers then and where I live now. I am far more comfortable in the company of farmers than I am in the company of urbanites.
I am related to farmers and still help out occasionally, when needed or when I need a touch of reality…
Claiming farmers never like precipitation is absurd. Farmers depend upon precipitation.
Griping means nothing
Outside of dreading rainfall at harvest times, farmers are quite tolerant of rainfall. Yes, heavy rainfall during planting season can delay farmers, temporarily. No big deal, the land will dry sufficiently soon.
Griping about rain, snow, sleet, dry weather, hot weather, whatever is perfectly normal. It certainly does not stop or slow farmers waking, dressing and heading out to work.
Just what exactly are you claiming?
• A) You intimate that farmers work the soil during or immediately after a thaw?
Working thawing soil or soon after thawing is a sure method to compact that soil. Farmers work hard trying to aerate their soils, don’t expect them to ruin carefully aerated soils.
• B) 2′, i.e. 2 feet of snow, or even 3 feet of snow equates to roughly 2-3 inches of water. Two to three inches of water released upon the fields at the rate snow melts…
Only when warm downpours rush the melting of heavy snow loads is there a real danger for flooding in the fields. What is a heavy snow load? Depends on location, but think a number of feet for snow cover..
• C) “Crops and land dependent upon least 2′ of snow pack, having 1/2 of that with a winter thaw that causes overland flooding”:
Say what?
One inch of snow pack melt water causes flooding?
“It’s a concern for spring planting”? Weeks before planting season?
Big deal, anyway!
No farmer works the soil immediately after thaw. What water is excess after the snow melts, runs downhill.
Just what crops or seeds do you think farmers plant when the soil temperatures are below 55°F? Planting in soil that is old is a path to ruin.
a) When seeds are planted that soon after a thaw, what seeds actually sprout are highly susceptible to hard frosts. Farmers expect hard frosts for up to several months after the thaw.
– 1) Consider peas; peas love cool weather, so they grow best in spring and mid-fall; and they are more tolerant than most crops of soil temperatures. Only peas generally fail to germinate in soil temperatures less that 40°F. The longer seeds sit in the ground, the larger thee chance for them to spoil, mold or get found by rodents.
How does the soil temperature get from 32°F to 40°F and higher? It’s called weeks of sunlight. Warms a bit during the day, cools again at night. over weeks without snow cover.
From Cornell University:
Snow makes for an excellent protective cover for many overwinter crops, shrubs and trees.
So long as a farmer has put up fodder and hay for the animals, farmers will be content with snow covered fields.
Reminds me of “Half the oats and half the hay by Candlemas Day”, or Ground Hog Day as it is now known?
I think she meant 3 feet would be better.
@ATheoK:
LOL, you don’t know many farmers….specially in the Midwest US. They are NEVER happy with precipitation, it’s always too much or too little.
As for snow depth, when you’ve cultivated crops and land dependent upon at least 2′ of snow pack, having 1/2 of that with a winter thaw that causes overland flooding–it’s a concern for Spring planting.
The “alarmists” believed the direction was upward — global warming.
Had they believed the direction was down — global cooling — they could have been happy with that. Point is, the climate is only involved because an excuse is needed to justify the necessary control to redistribute wealth until all peoples are equally miserably poor.
Had Hansen/Gore/Mann and friends claimed something (increased wine consumption?) was causing cooling that would have been fine. The United Nations could proclaim world vineyard growth demanded indulgences and full control of world economies. In fact, any excuse would do. It just happened to be climate.
The Old Farmers Almanac certainly missed when it comes to California especially Southern California – it’s been record warm and dry. We’re off to a much drier start with then we had even during the drought. Things should change by Tuesday though.
Hey the wooly caterpillars played them. Not their fault.
So? Its hot in summer in OZ. Nearly as hot as in the 1930s when there was how much extra CO2 around?
Its called WEATHER, it changes, always has always will. Its only since silly idiots playing with useless computer ‘models’ influencing energy policies that it mattered.
I think that it is a fact there will be cold air aroudf the Noth Pole area every winter time. This cold air will move to south but nobody can predict, if the cold air will go down to North America, Europa or Seberia. This winter it was North America and at least partly Siberia. In Scandinavian countries we have had relatively mild winter so far. No snow in Southern Finland. One year climate situation is a weather phenomenon – not a climate change phenomenon..
aveollila ,
What you describe can be easily explained by the work of Carl-Gustaf Arvid Rossby, of Sweden.
https://en.wikipedia.org/wiki/Rossby_wave
FWIW,
Quote from todays paper:(1/5/2018)
“tomorrow will be the twelfth straight day with temperatures remaining below 20 degrees. This has happened only twice on record in Chicago. Back in 1895 and 1936 we also had 12 consecutive days below 20. The streak will end Sunday with highs getting back to near freezing.”
Well, it IS only the first week of January, and there are several more winter weeks ahead of us. Who knows? Maybe they might be almost right come March (or not).
So, way back in 1939 Penrith, then mostly paddocks and farms hit a high of 47.8C somewhat higher than the 47.3 of current Penrith of bitumen, concrete and steel?
Winter started two weeks ago. There’s plenty of time for NOAH’s forecast to prove accurate.
Winter started 1month and a 1/4 ago, at 1st december, the date for meteorological winter which last decembre to february, and end at 1st march. 40% of Winter already passed by. The 60% would had to be really, really hot to compensate , but, eh, why not…
Poor Rob obviously has ZERO clue about the travesty that BOM Australia has become.
The 47.3C was a one second AWS reading, that NOBODY anywhere else in the world uses.
Also NOT the hottest Richmond recorded 47.8 in 1939 when CO2 was MUCH lower.
But BBC is renowned for propagandising with FAKE NEWS. !!
Read more about the ABSOLUTE FARCE that BOM has become.
http://joannenova.com.au/2018/01/sydney-hottest-ever-mistake-generates-fake-news/
I’ve heard the excuse many times…the forecast is wrong because global warming/climate change/climate crisis is making things too weird to forecast with accuracy.
There was a similar case in Australia recently covered on the JoNova blog. The weather bureau there predicting a dryer than usual summar and it was one of wettest in many years. As the say its just a prediction not a promise, they actually have no ability to predict with certainty, unless of course it for the next 50-100 years.
As l have been posting on here over the last four years or so. l think that a noticeable increase in this type of weather patterning is linked to ice age formation. So when a ” ice age pattern” like this turns up l take a close interest. While am convinced that this type of patterning can lead to climate cooling over N America.
What l did not understand is what would make this “ice age patterning” persistent. But this recent cold spell may have given me new insight into that question. As there appears to be a indirect link to this patterning and a increase in jet stream activity over the Mid Pacific. lf am correct and there is a link then it could make this “ice age patterning” last not just days, but weeks and maybe even months. But its still early days and l will need to see what happens as we move towards spring before l can be more certain.
I’ve been posting silly stuff here for 10 years, I don’t recall your “handle”.
My bad.
Go Check Jo Nova’s site. Those records are fake news.
Another proof of climate change: without climate change, they would had been right, but CC is so deep, climate model don’t work as good as they did before. Because, you know, they WERE very good model, didn’t they?
winter doesn’t start at solstice, it starts at 1st december, for meteorologists
Joe Bastardi beats the NOAA every time.
+10
For the last couple of years I have referred questions to Joe’s forecasts. I believe he has been better than most.
Do we have a 97% consensus that it is cold?
A number of years ago I did an assessment of some Almanac forecasts.
They are 80 % correct. I checked four Almanacs. They totalled 20 + 20 + 20 + 20 = 80 %.
Last year they beat NOAA 51 to 49. It was a great game.
Both the Old Farmers Almanac and the Farmers Almanac had generally the same forecast for the first two months of winter, December and January: wet and mild.
Both of them missed the boat entirely on that score.
I’m keeping track of local stuff, and being 35 miles north of Chicago, I’m VERY interested in how this winter shapes up against the 1967 biizzard, which was forecast to be 2 inches of snow and moderate temperatures, but instead carried such a snow load that it shut down the entire city. I was living in central Illinois back then. We got the southern edge of that storm, which gave us high winds that snapped off telephone poles at their base and flipped them over, and coated phone and power lines so heavily in ice (sleet) that they sagged nearly to the ground. I have slides I shot the morning after that storm.
Sleet is not called freezing rain, for some reason. I guess one word is harder to figure out than two.
I’m also interested in how this holds up against the blizzard of February 2011, because that one trapped people in their cars on Lake Shore Drive and on unplowed county roads. The snowplow trucks were on the main roads, not the county roads that run through cornfields. For Pete’s sake, IF IT’S SNOWING AND THE ROAD ISN’T PLOWED, DON’T USE IT!!!!!
The snow from that storm drifted up against the side of my house to the bottom of the living room windows, about 9 feet, and drifted against my storm door to a height of 4.5 feet. I had to wait for one of my neighbors to dig me out. Fortunately, I went shopping and stocked up before the storm hit. Yes, I do have photos of that, too.
But it’s just weather, it does what it wants to, and what we need is good, accurate weather forecasting, not hysterical political/ideological nonsense.
Interesting to know which signals the NOAA and the almanacs followed and which led them astray.
The temperature outlook shown above indicates above-average temperatures across the southern US, extending northward out West through the central Rockies and all the way up to Maine in the eastern part of the nation.
But – if you factor in above-average temperatures in the magma 200-500km below the surface, then all the snow and subzero surface temperatures aren’t so relevant and it’s still warmer than average and worse than we thought.
/sarc
Yeah. “Millions of degrees”
I live in Bastrop Texas outside of Austin had two snow storms in the past 4 weeks really cold. This past summer wasn’t that bad he wise that is seems to me like we’re going back to the more normal weather pattern
Last Wednesday, the traffic reports around Washington DC were loaded with street closings due to water main breaks. One street had two water main breaks. There had to have been at least a dozen, maybe more. DC isn’t prepared for snow, and when it gets more than about three inches, the Federal Government shuts down (or allows telework). I had no idea that it’s infrastructure was so ill-prepared it was for low temperatures, however.
GLERL had a prediction for the maximum ice cover of the great lakes to be 25% before winter started. It’s already at 30%, and they have since updated that prediction to 60% in the past few days. It’ll be interesting to see what the final maximum ends up being.
Noaa nailed the southwest right especially So Cal for above average temps and lower than average precipitation. I’m in the high desert on the border of Antelope and Victorville Apple valley . We haven’t had a drop of rain this winter and temps are running 10 degrees above normal . It’s litterly the year without winter !
You’re confusing Climate with weather. Climate is the overall picture of an area or the planet as a whole over an extended period of time. Weather is the day to day occurrences in a particular area.
While parts of North America are experiencing extreme cold, in the Southern Hemisphere they are experiencing extreme heat.
If you have taken the time to actually read the research on GLOBAL climate change, you would know that the expectation is for EXTREMES in WEATHER and weather related events, such as fires, floods, intensified storm activity.
But instead, the choice is to remain ignorant and to write nonsensical garbage like this which is fed to a group of people who are uneducated and easily led. That’s not conservative that’s evil! Conservatives means to act in ways that are cautious to work to sustain that which exists. A true conservative knows that ignorance is a liability which increases risk. A true conservative shuns risk.
Uneducated, Stacey? Really? That’s kind of presumptious of you.
i have 29 semester hours past my B.A. I think a lot of people here are quite well educated.
In case you missed the news story, it’s summer in the southern hemisphere. They should be having summer weather down there, although I’m doubtful that Patagonia is particularly balmy right now.
You’re a bit hoist on your petard there, Tootsie. Get over yourself.
“the expectation is for EXTREMES in WEATHER and weather related events”
OOPS….. FAILED AGAIN !!!!
https://wattsupwiththat.com/2018/01/07/despite-what-youve-heard-global-warming-isnt-making-weather-more-extreme/
Your choice, Stacey, is to get an education or just rely on baseless propaganda designed for people like you who are uneducated and easily led.
And the so called extreme heat in the SH, is just NORMAL weather. Why is it that you don’t know the difference?????
“While parts of North America are experiencing extreme cold, in the Southern Hemisphere they are experiencing extreme heat. ” errr, no. Its actually pretty average and if anything less hot this summer. Where is this Southern Hemisphere heat you speak of? are you extrapolating one day in Sydney to a hemisphere? I see nothing on the scale of what the US is experiencing, but I have been having trouble with my omnipotence module lately and stand to be corrected.
Those sort of days are quite common in summer of the East Coast of NSW (where I happen to live)
What happens is that you get a persistent blocking of air movement over Central Australia, then for a couple of days that is released, and a frontal system funnels all that built-up heat over toward the East Coast.
So it gets RATHER WARM from the Central Slopes right across to the East Coast.
I remember similar days happen basically all my life. Its just NORMAL WEATHER.
Generally this heat is released by what is called a Southerly Buster, as the front moves up the coast.
Another one of those trollops that want their beliefs to be taken in the oddest ways.
A) stacey claims that we are confusing climate with weather.
B) stacey then claims that climate change causes “extreme weather”. i.e. “extreme cold in NH and “extreme hot” in SH.
Which is it stacey? weather or climate?
Not that any regulars or associates of WUWT have claimed the recent weather is “climate”.
That specious claim is your own personal false straw man stacey.
Consider that the topic of the article regards NOAA”s bad (normal for NOAA) 2017-2018 Winter prediction.
“How El Niño and La Niña affect the winter jet stream and U.S. climate”
What do you call a Winter prediction stacey? Is that weather or climate?
Let’s focus one your main claim Stacey.
stacey states that “fires, floods, intensified storm activity” are all caused by extreme weather.
One wonders just what definition stacey uses for “extreme”?
I strongly suspect it is the bogus Gore error-ridden propaganda film version of “extreme”.
When current weather is matched and exceeded by recorded history; recorded over the last 100+ years, current weather is simply normal weather, that is well within normal variance.
One also wonders just where there is actual science supporting stacey’s claim that “fires, floods, intensified storm activity” are caused by any kind of weather?
Recent fires are caused by man’s mismanagement.
• A) Man prevents fires, which causes dead wood fire burdens to build until catastrophic fires are likely..
• B) Man refuses to clear away trees, bushes and grasses known for explosive flammability when dry. Allowing fires to quickly spiral out of control and burn developments.
• C) A majority of fires are still caused directly by man.
Floods are quite normal.
Nor have floods increased in frequency or volume.
The same goes for droughts with global historical records recording far greater droughts centuries ago.
Intensified storm activity does not exist.
http://www1.ncdc.noaa.gov/pub/data/cmb/images/tornado/clim/EF3-EF5.png
All of which brings us to one obvious answer.
The ignorant one here is the one making specious claims without links or citations; i.e. stacey maxwell. What you’ve dumped here, stacey, are baseless claims without fact or merit, along with copious stacey opinion, blather and gross assumptions.
“Conservative” has a very broad vague definition.
Nowhere, in that definition implies a conservative shuns risk. e.g. Winston Churchill.
Conservatives do not like to rush actions or decisions when information is lacking. e.g. “climate change” which lacks veracity, evidence, proof, replication, verification. Especially when a country’s economy and standard of living is at stake.
Another term for that quality is called perspective. Conservatives try to attain a full perspective before making rash decisions.
Trollops with a attention spans rivaling canaries can be alarmists, but not conservatives.
Alarmists and MSM leap from one fear to another while shrilly screaming constantly.
Alarmists have cried “wolf” for thirty years now.
&bull Every claim beyond CO2 is a simple ghg is falsified.
&bull Every prediction is falsified.
&bull Every climate model is falsified.
&bull The Arctic is still filled with ice; as is the Antarctic.
&bull Storms are neither more frequent or intense.
&bull Rain still falls, well within normal rates and frequencies.
&bull Droughts are not more frequent.
&bull Animals are not dying; not even the polar bear.
&bull Glaciers are not retreating faster; especially since most glaciers were gone during earlier Holocene warming periods. Right now glaciers are retreating from natural warming since the LIA.
However, birds and bats are decimated out of the sky by wind and solar farms.
Your simple act of running in circles, scream and shouting about “extreme”, “conservative”, “risk”, “weather”, “fires”, “floods”, “intensified storms”, “climate” does reveal you are not a conservative.
Nothing but empty rhetoric for Jo to address. Lot’s of bluster from the BBC, not much fact.
And since climate ACTIVIST/alarmista, Rob, wants to bring up one day of warm WEATHER in Western Sydney, let’s look at the RAAF base data.
Note that NOT ONE of the record hot days are even THIS CENTURY !!!!
No warming in 79 years, despite massive urban growth and BOM’s highly irregular and ANTI-SCIENCE temperature methodology
Yes it was warm yesterday.. NOTHING UNUSUAL about that for a Sydney summer. !!

Looking like its back in the ice-box for America by the next weekend. Where there will be a classic U shape “ice age pattern” in the jet stream over eastern USA. The jet stream forecast suggests that the cold will become intense in the Great Lakes area over the next weekend and into Monday. l can see no real change in this patterning and its looking like lasting until at least the 18th.
The cold air will move out eastward in due course, although a big high-pressure system like that is slow to move.
One problem that remains after the really cold air is gone is the large extent of snow cover which will hamper the warmup.
Joe Bastardi is the best out there.
I remember i herard back in the late 70’s NASA PREDICTED a mini ice age not global warming. Go to Coast to Coast AM for a great scfi radio station by George Noory. Google his search you can find anything. Google Global Warming learn the truth how our govorment not Trump but the Communist Democrasts are trying to take over are the aliens already here.
Out here in not so sunny CA (today), Gov. Moonganja declared a return to CA’s permanent drought … due to “the driest December EVER (in the short term memory of Alzheimer’s patients) … so pay NO ATTENTION to the storms lined-up offshore due to hit tomorrow. Those storms perfectly ‘fit’ Jerry Brown’s climate models. They were OBVIOUSLY created by a sudden ACCELERATION of Global Temperatures … ohhhhhh mammmmaaaaa … your SINS against Gaia are gonna kill billions of humans!! Repent !!! and pay your tithes to faceless government bureaucracies … and you might be saved.
“so pay NO ATTENTION to the storms lined-up offshore due to hit tomorrow.”
I was getting ready to bring that up until I read a little farther. 🙂
Being wrong doesn’t phase some people, does it. Brown is so disconnected from reality. He’s not alone though, he has a lot of company, especially in California. These people live on a different planet.
“These people live on a different planet”
I wish!
Five weeks into Australian summer and we’ve had only ONE significantly hot day.
Maximum forecast temperatures for the capital cities today:
Sydney – a tepid 33C
Melbourne – unusually cool at 22C
Brisbane – normal at 32C
Perth – tepid at 34C
Adelaide – tepid at 27C
Hobart – cool at 25C
Canberra – normal at 33C
Darwin – normal at 30C
http://www.bom.gov.au/
Pretty lame, huh?
And yet, you want us to freak out about a BBC report on a dubious thermometer reading from one suburb in Sydney!
Read the URL if you can’t be bothered reading the article:
http://www.smh.com.au/environment/weather/sydney-weather-how-urbanisation-creates-hot-microclimates-in-our-suburbs-20170209-gu9b02.html
O yeah, beat this one: last year Jerry Brown declared a ‘permanent’ drought in California just months before dam busting record rains in Northern California. He calls it the ‘new normal ‘
Winter isnt over yet, 3rd week in March, youre having premature-evaluation
quote:
========
Therefore, for temperate areas in the northern hemisphere, spring begins on 1 March, summer on 1 June, autumn on 1 September, and winter on 1 December. For the southern hemisphere temperate zone, spring begins on 1 September, summer on 1 December, autumn on 1 March, and winter on 1 June.
https://en.wikipedia.org/wiki/Season
========
Are you from the U.S.?
Americans seem to have alternative notions about when the seasons start – notions that are alien to an Australian, for example.
The “meteorological” seasons occur with a time lag to the calendar/sun’s position.
This is because of the lag in time that it takes for the increasing or decreasing angle of the sun to reverse the warming/cooling the atmosphere and especially the oceans.
During early January, for instance when the sun is getting stronger in the Northern Hemisphere, the atmosphere and oceans are still losing more heat than gaining it.
The coldest/warmest average air temperature in the Northern Hemisphere comes almost 1 month AFTER the sun’s angle has reached the lowest/highest point in the sky.
Coldest months are Dec-Jan-Feb. Warmest are Jun-Jul-Aug.
Ocean temperatures take even longer to bottom/top out after the Winter/Summer solstice since water retains much more heat/takes longer to warm up/cool down.
The suns angle peaks around June 21st but the hurricane season often doesn’t really get going until 2 months later and the climatological peak for hurricanes is almost at the Autumnal equinox, 3 months later. That hurricane peak is September 10.
And an old saying is, “As the days grown longer the cold grows stronger”. Saying is for winter.
Just so you guys know, for my area the weather bunnies at Accuweather are predicting freezing rain (we used to call that sleet) tonight, and temps rising to upper 30s/low to mid-40s next week. Of course, they do change their minds with the direction of the blowing winds, too.
I am tracking everything they say now, including their forecasts, because I may have to get to the grocery store for popcorn and soda before the heat wave strikes. /sarc.
One unexpected benefit of the cold is the appearance of several ivory gulls in this county as well as (latest count) up to 100 sightings of snowy owls (real count: 23). The cold must be pretty bad if there’s nothing out for these birds to hunt for food, so they come this far south to find it. http://www.chicagotribune.com/suburbs/lake-county-news-sun/news/ct-lns-arctic-bird-seen-here-st-0106-20180105-story.html
I’ve also had a white-throated sparrow at my feeding station, as well as a white-crowned sparrow. Not unusual birds, just unusual for this area, as they are generally found further east.
Sara January 7, 2018 at 4:17 pm
Just so you guys know, for my area the weather bunnies at Accuweather are predicting freezing rain (we used to call that sleet) tonight, and temps rising to upper 30s/low to mid-40s next week.
Freezing rain is rain that falls through a colder layer of air and freezes, sleet is snow that passes through a warmer layer of air and melts and then freezes into ice pellets as it enters colder air. They have different characteristics when they reach the ground as a result.
Here is the dictionary.com definition of freezing rain. .”rain that falls as a liquid but freezes into glaze upon contact with the ground.” The important distinction is the “glaze”. In other words it is very slippery. Driving in sleet may be OK if you are careful because it is granular, but freezing rain can create skating rink conditions in just a few minutes.
Sara:
Thank you for the birds update! I’ll keep a lookout, though we’re in Virginia, to see if they make it this far.
The Great Horned Owl that usually winters in my patch of woods left suddenly when the cold snap started. I haven’t heard it or the rest of the group since then. Great Horned Owls are rather noisy during the wee hours.
I wondered the other day if they migrated further south.
meanwhile to help answer your sleet question:
https://www.inverse.com/article/23243-sleet-freezing-rain-graupel-diamond-dust-precipitation-snow-definition
Enjoy!
As I said, Rob.. BBC report was just EMPTY rhetoric.. It didn’t actually say anything !!
But , as we all know… “BBC is renowned for propagandising with FAKE NEWS. !!”
That is what I said, and you have put forward nothing but mindless activist yapping.
Do you agree that Sydney was NO WARMER than in 1939, despite massive urbanisation?
One small area of Australia has a hot spot, and that is supposed to compare to the intense cold wave covering about 2/3rds of North America. …https://earth.nullschool.net/#current/wind/surface/level/overlay=temp/orthographic=140.69,-26.11,1107/loc=138.341,-28.007
and North America, …https://earth.nullschool.net/#current/wind/surface/level/overlay=temp/orthographic=-103.49,53.02,672/loc=-107.882,42.372
Plus the extensive cold wave in Asia. This winter the upper latitude cold spots in western Siberia are around 30 to 40 F warmer as compared to the last 2 winters. Then look at how far south the freeze line extended with this winter into China and other areas of Asia. I had expected to see Europe impacted, but surface winds had a strong easterly heading and those winds have protected Europe so far during this winter. That is also different as compared to recent years, …https://earth.nullschool.net/#current/wind/surface/level/overlay=temp/orthographic=-198.85,73.02,672
I don’t know, it’s all a bit confusing.
Here in Sydney we have Climate in the 1st 3/4 of the day when it gets hot (42C on Sunday) and in the late afternoon we have weather, when the “Southerly Buster” (from the Antarctic, I think) comes and cools us down.
So apparently conflicting Climate change and the weather ARE compatible, they just happen at different times during the day.
Rob:
See JoNova’s website on this topic.
Besides BOM being a laughingstock, even amongst activist government agencies, whenever Mass Media breathlessly trumpets some record claim, it is worth time and effort to do a quick check. Much of the world’s mass media place fear and alarm over accuracy.
Mix bad BOM data handling habits with Mass Media’s climate ambulance chasing is a recipe for information disasters.
Winter is not even half over yet(Dec-Jan-Feb) for that NWS forecast.
December featured temperatures of 3 degrees below average, only from the Great Lakes to the Northeast US. Temperatures were slightly warmer than average in the Southeast to the Plains States. Temperatures were 5 degrees above average for the Southwestern quarter of the country and a tad below average in the Northwest.
Use this link to get recent average temperatures for different periods in the US:
http://www.cpc.ncep.noaa.gov/products/tanal/temp_analyses.php
Almost all the bitter cold occurred during the last 10 days of December and this has continued into the 2nd week of January. A massive warm up will spread across the entire country and dominate the 2nd half of January but not be enough to offset the frigid first half.
Cold anomalies so far in January(and the last week of Dec) have been 10-20 degrees below average for the entire Eastern half of the US. However, warm anomalies later this month may be almost as extreme but probably not last as long, so January will still end up colder than average(judging by the start, you would think this is a no brainer but if we have a week of temps 20 degrees above average later this month the average will come up quite a bit)
February will be the month that could make or break the Winter forecast. The weak La Nina and early Winter high latitude ridging favors cold returning and Joe is the best at picking analog years. Seasonal forecasting is not my area of meteorological expertise so I’ll let Joe’s forecast ride.
Yeah, the winter weather goes in cycles: A cold arctic front comes through, followed by a warmup, and then another cold front comes through, followed by a warmup.
There are claims that this arctic cold front is unusual. It might be unusual in how cold it is, but it is not unusual for a front of this type to make an appearace in the U.S.
I don’t recall a winter when an arctic cold front did not enter the United States at some point during the winter. Sometimes they aren’t as cold as this one, and they may not affect as large an area, but they show up like clockwork.
Well you’ve got to give NOAA credit for getting the map and all the state boundaries right.
I don’t understand the excitement. The computer models predict “Climate Change”, the NOAA things predict weather. Weather is much harder to predict than climate. / sarc
I run a small weather consulting business that caters to South Florida agricultural operations. Every fall, I write up a winter outlook for my clients. Like NOAA, I have heavily weighted the ENSO pattern into my outlooks, but have noticed that the ENSO has been a poor predictor for North America the last 5 or 6 years. Other global patterns appeared to be dominating. This is what I told my clients in my winter outlook, sent in late October:
“We have high confidence that a La Nina has set in and will stay through the winter. This would tend to bring us another mild and uneventful winter in Florida (similar to what the National Weather Service is forecasting). However, we are expecting that the ENSO pattern will NOT be the dominating feature of this winter, but that the PDO, AO and other factors will dominate and override the La Nina pattern. Once again, we expect the PDO, QBO and AO to be more negative, resulting in more deep troughs over the Eastern US, with variable periods of warm and cold, and near average precipitation.”
So far, so good.
I have been around long enough to see the ENSO pattern have a pretty good track record with general winter patterns, but something appears to be changing. I am guessing it is the sun. Here is how I tried to explain it to my Orange Growers:
“Scientists have long debated whether changes in solar activity have a direct and predictable impact on near term surface weather conditions on Earth. Many mainstream scientists don’t recognize a correlation between the weather on Earth and the ‘weather’ on the sun. Others do entertain the idea that a prolonged period of low solar activity (few sun spots) could lead to cooler temperatures on Earth. US Weather Consultants falls in this ladder category.”
“The current solar sunspot cycle peaked in 2014 and is still coming below predicted values (red line). It is coming in weaker than any cycle in over 120 years; about half as strong as the previous cycle. Solar scientists are predicting that the next cycle, beginning around 2020, will be even weaker still, rivaling the Dalton Minimum of the early 1800’s, or even the more extreme Maunder Minimum of the 17th Century.”
“The extended periods of lower sunspot numbers are associated with extended cooler periods in the Eastern US and Europe. The number of sunspots has almost no impact on the total amount of solar energy streaming from the sun, put it does have a more significant impact on the amount of ultraviolet radiation from the sun. Less sunspots equal less ultraviolet radiation. The change in ultraviolet radiation has no immediately discernable impact on near surface weather, but it does influence the amount of ozone in the stratosphere, as UV breaks up ozone molecules. Ozone, in turn, warms the stratosphere. So, less UV from the sun means an increase in stratospheric ozone leading to warmer stratospheric temperatures.
Recall the graphic depicting the two phases of the Arctic Oscillation:
(I apologize for not having any idea how to insert that graphic into this post)
Note that a key ingredient in a negative Arctic Oscillation (on the right) is a ‘less cold stratosphere’. It is still speculative but reasonable to believe that a long period of reduced solar activity could lead to a warmer stratosphere, more conducive for the negative phase of the Arctic Oscillation. This in turn would tend to increase the risk of harsh winters over Eastern Europe and the Eastern United States, and likely lead to some global cooling.”
I am putting these thoughts out to the WUWT community for feedback. I apologize for the length of the post and the fact that I don’t know how to insert graphics. I honestly can’t say if I read this little hypothesis somewhere, or came up with it on my own. If it has some validity, I hope I came up with it. If it is utter nonsense, I hope I read it somewhere else!
My take is very low solar equates to overall lower sea surface temperatures due to less UV light as well as a more meridional atmospheric circulation.
In addition very low solar will cause a slight increase in albedo due to an increase in major volcanic activity, global cloud/snow coverage. Due to an increase in galactic cosmic rays associated with a very weak solar wind/ap index.
Excellent summary of the difficulty in predicting a complex, chaotic, multi variable system (the climate). NOAA and climate modelers that claim long term climate forecasts (using weighted computer models) are more accurate than short term forecasts such as the forecast for agricultural growers in Florida are either liars or fools.
It isn’t ‘difficult’ to predict a coupled, non-linear, chaotic system (IPCC description of the earth-ocean-atmosphere system), it is impossible. See Lorenz, 1972. It’s the nature of chaotic systems. While every system is deterministic (there are no truly random systems) the requirement for accurately determining the future state of a chaotic system is to know the exact initial value of every variable and every process affecting the system to a degree of precision that is not achievable by science, not to mention the fact that we do not know every variable and process affecting the earth-ocean-atmosphere system. In a chaotic system, being off by .01% in the initial value of a system can cause wildly different results i.e., if the butterfly in Brazil flaps it’s wings .01 sec slower, there may be a tornado in Alabama instead of Kansas, or there may be no tornado at all.
This is why the current crop of climate models are posed as boundary problems rather than initial value problems. What the climate models are in reality is not ‘predictive’ models, but ‘scenario checkers’ a fact that was once readily admitted by Climate scientists but has now been forgotten.
Rob still can’t read.
NOWHERE did I state that this article was fake news. It was just an empty load of mindless rhetoric
I just noted that they RENOWNED for FAKE NEWS.
Now, Answer the question you are weaselling away from answering.
Do you agree that Sydney was NO WARMER than in 1939, despite massive urbanisation?
“. . . and meteorological winter includes December, January, and February.”
https://www.ncdc.noaa.gov/news/meteorological-versus-astronomical-seasons
And yet the peer reviewed paper 2018 hottest year ever is hot on the presses I’m sure
Raleigh, NC has apparently now set a new all-time record for continuous hours below freezing. In my book “trend” indicators like this are probably more meaningful than “point” indicators for a given low temp or given snowfall total.
If only Joe Bastardi could put a little more Del Ray in his Del Mar peninsulacentric view of the weather. Is Joe left handed? Begun to feel like everything west of the Chesepeake Bay.is just there to support his elbow while he draws lines all over the mid Atlantic. Surely the west coast difference in Dec precipitation 2016 v. 2017 was worth one daily update?
I understand that global warming scares you. It should. Regarding the cold snaps. The Arctic region is warming faster than any other, and studies suggest that this warming is weakening the jet stream, which ordinarily acts like a giant lasso, corralling cold air around the pole. Thus the cold snaps. That is weather. That does not change the overall trend of the climate. The world is getting warmer and the impact on the world will be profound.
“The world is getting warmer and the impact on the world will be profound.”
Thanks Chicken Little.
Andrew
such unsupported nonsense, who are you, Mann or Gore in disguise, your gibberish is not supported by people who forecast this weather back in December, and got it right.
NOAA’s bad science got it wrong
Why?
Well the people who got it right used analogue years from the past.
NOAA got it wrong because AGW is factored in.
1984 was worse for a cold snap, so by your logic, climate change made it colder but makes it not as cold as the past?
Baaahahahahahahahahahaha
and no, living standards for humans for the last 200+ years have increased substantially in part due to a warming world. Only mentally ill eco muts see danger
The Ice Bowl was played in Green Bay on December 31, 1967.
waiting for Rob to answer..
weaselling .. I like that word.. very descriptive 🙂
Don’t worry, NOAA will eventually get this winter’s forecast correct. 🙂
Predict, fail, and rationalize away.
You could pretty much attach this mechanism, macro and micro, to the entirety of the climate change fiasco.
The new ‘scientific method.’
That was not a projection, it was a healthy dollop of wishful thinking imo. Confirmation bias
Anthony: I’m posting this without having read the comments, so if this is a duplicate I apologize. There’s a typo in your article—”with” should be “without” in:
“Surprisingly, the much maligned (as being with skill according to most NOAA meteorologists) …”
Read a BBC story, just to tell you what s wrong with it?
Sheer waste of time.
BBC has not accurately reported anything in many years.
BBC news ranks right with huffpo, vox, desmog and other bottom dwellers. Even the National Enquirer is
better.
Just when it appears the BBC could not slip deeper into advocacy nonsense, they dive deeper.
Skip the BBC!
Which does bring up Robbie and his tantrums.
You made a “record cold” claim.
Citing BBC is a warning, that emotive hand waving rules, not rational science or legitimate sources.
Then Robbie whines that ‘we’ should go read the article on BBC and rebut it; apparently point by point.
Nope! Beneath our dignity to stray from science discussions to tabloid nonsense.
Is it cold here in the Eastern USA?
It was, and may well be cold again.
Is it as cold as previous cold episodes in the 1800s’ or the 1930s’?
I doubt it.
I especially doubt that it was colder than other periods in history; e.g. George Washington’s winter at Valley Forge.
For seven plus years, I delivered mail from door to door. There were several similar cold periods during those years.
But then, tabloids never discuss all of the near records, just the new alleged records. Nor does the BBC and their biased sources mention that many of the alleged records are based on very short temperature histories.
Joe Bastardi, Weatherbell, Ryan Maue, etc. have been predicting this winter’s cold and cold snaps for several months now.
Old news for those following Joe and Ryan’s twitters.
There is zero genuine science linking weather to CO2, global warming, whatever.
Climate change has always been in action since Earth’s atmosphere formed.
Freaking out over tiny variances requires ignoring recorded history and science. Cue the BBC and their drama queen articles.
The problem with relying too much on ENSO (like NOAA has done) is that other teleconnections come into play. The brutal NH Winters of 1976-77 and 1977-78 occurred during a strong El Nino as well as the Great Pacific Climate Shift. That period was marked by 2 very hot summers followed by brutal winters. Obviously something else was at play.
“FAIL: NOAA’s winter climate outlook claimed ‘warmer than normal’ temperature”
While winter is still far from over, they seem to have got it wrong so far because as usual they fail to take into account the sun. This failure of taking any notice of the sun is the same reason why climate predictions fail. The AMO, ENSO especially rely on solar energy and don’t magically change with CO2 because CO2 has no noticeable effect on them and never will.