Guest Post by Willis Eschenbach
I got to thinking about the records of the sea level height taken at tidal stations all over the planet. The main problem with these tide stations is that they measure the height of the sea surface versus the height of some object attached to the land … but the land isn’t sitting still. In most places around the planet the land surface is actually rising or falling, and in some places, it’s doing so at a surprising rate, millimeters per year.
The places that are the most affected, unfortunately, are the places where we have some of the longest tidal records, the northern extra-tropics and northern sub-polar regions. In those sub-polar regions, during the most recent ice age, there were trillions of tonnes of ice on the land. This squashed the land underneath the ice down towards the center of the earth … and as result of that, just like when you squeeze a balloon it bulges out elsewhere, the extra-tropical areas further from the North Pole bulged upwards in response to the northern areas being pushed down.
Now, of course, other than scattered glaciers all of that ice is gone. With that weight removed the land is now experiencing the reverse effect. This is called “post-glacial rebound”, or PGR. The effect of the PGR is the reverse of that of the ice—northern areas are rising and mid-latitude areas are sinking. So when we look at long-term records from northern Europe, for example, the land is actually rising faster than the sea level … and as a result, the tide gauges there are recording a sea level fall rather than a sea level rise.
The issue comes up when we want to know how fast the sea level is rising, both now and in the past. Unfortunately, most tide gauges around the planet don’t have co-located GPS units capable of measuring the altitude to the nearest millimeter…
Me, I’m not that interested in exactly how fast the sea level is rising. I’m much more interested in whether that rate of sea level rise is speeding up. For three decades now climate alarmists have been predicting an imminent acceleration in the rate of sea level rise that is supposed to drown whole cities by 2100, the usual Chicken Little scenario. However, I’ve not seen any convincing evidence for that claimed acceleration.
My thought about how to investigate the purported acceleration was simple. I’d get every one of the tide records, the most recent I could find. These are kept at the Permanent Service for the Mean Sea Level, or PSMSL. They are obtainable individually here or in bulk here. As the curators recommend, I used the RLR version.
Then I’d detrend them all. That would remove any post-glacial rebound. The PGR, whether slow or fast, doesn’t change much in a couple centuries. So detrending would set the PGR to zero. This would allow me to look at the average shorter term multidecadal variations in sea level. I would average the records, and see what kind of acceleration I might find in the results.
I thought about this while reading GLOBAL SEA RISE: A REDETERMINATION, by Bruce C. Douglas, available here. In it, he averages a subset of the 1509 stations after adjusting them for post-glacial rebound (PGR). However, he’s picked a tiny subset, only twenty-four stations … out of the more than 1500 tide stations available worldwide. Hmm … seemed like a very small sample.
So I thought I’d take a look at some other subsets of the tide station data. I decided to filter based on a couple of criteria. One was that I wanted to have long records. So I started with a hundred years minimum. No particular reason, it just seemed like a good place to start.
The other criterion was that I wanted them to be mostly complete, with little missing data. I started with the requirement that they be ninety percent complete. I expected that I’d find only five or ten such stations around the globe, but to my surprise, I found that there are no less than 61 tide station records that meet those criteria.
Following the usual method, I took the “first differences” of these individual sea level records. This is the change in the data over time. Since we have monthly data, the “first differences” in this instance are the month-to-month changes in the sea level for each tide station.
Then I averaged those first differences, month by month. Finally, the cumulative sum of that average of the first differences reconstructs (in theory) the average change in sea level height.
Figure 1 shows the result of that procedure. Remember that this is detrended data. I’m not looking at the trend. I’m looking at the decadal and multidecadal variations within the overall record, to see where the trend changes.

Figure 1. Averaged sea level. The average was taken as the cumulative sum of the month-by-month average of the individual station first differences. No standardization of standard deviation was performed. The yellow line is a six-year centered Gaussian smooth. I put the ocean in the background because … well, because I got bored with plain white, plus … it’s the ocean …
OK, nothing much surprising there. Yes, I know I haven’t made any effort to do a gridded or other geospatial average … but I find that for first-cut investigations the differences aren’t worth the programming time. That can come later to refine the results. First I want to take a broad view and come to an overall understanding of the oddities and the outliers and the overall style and substance of the dataset.
Now, in Figure 1, sixty-one records is not a whole lot. So my next thought was to reduce the completeness threshold a bit. I decided to look at all the hundred-year-long records which contain at least eighty percent data, instead of ninety percent. That increased the station count from sixty-one to seventy-one. And the result was what I love the most about science … a big surprise.

Figure 2. As in Figure 1, except only requiring 80% data instead of 90% data.
Dang-a-lang, sez I, say wut?!? … and I went off to find the fault in my computer program that extracts the data and draws the plots.
However, when I couldn’t find anything wrong with my program, I realized that the answer had to be somewhere in the ten additional stations that were added in between Figure 1 and Figure 2. Here are those ten stations:

Figure 3. The ten stations which were added to the subset between Figure 1 and Figure 2.
You can see the problem, I’m sure. What is going on with the tide record from the Manila South Harbor? So I pulled Manila South Harbor out of the mix … which led to big surprise number two.
Pulling out the Manila record made no particular change. The result still had the big drop seen in Figure 2.
After much faffing about, I finally determined that the miscreant was actually Trois-Rivieres, which is certainly not obviously different from its compatriots. It’s second from the bottom left in Figure 3 above, looks like the rest … except in size. I’d made the mistake of not paying attention to the different scales. Here’re the same ten stations, but this time all to the same scale.

Figure 4. As in Figure 3, but with all stations shown at the same scale.
In this view the problem is evident. We’re doing a “first differences” analysis. But that weights the data in some sense proportional to the stations’ standard deviation, how much it swings from month to month.
Setting that question aside, however, the surprising part to me was the large effect of one single record among 71 others. One bad actor in the lot totally changed the whole average … and it brings up a question for which there is no “right” answer.
How do we deal, not just with this instance of Trois-Rivieres, but with the more general underlying problem that the month-to-month variations in sea level are of very different sizes at different tidal stations around the globe?
Do we scale them all to the same standard deviation, to give them all equal weight? Or as in this case, is it valid to just heave Trois-Rivieres overboard and continue the cruise? Hang on, let me get a histogram of the standard deviations so we have some information. The standard deviation is a measure of how wide the swings in the data are … I’m writing this up as I work my way through the issues, so you can see how I go about understanding the dataset. Here’s the histogram of the standard deviations:

Figure 5. Histogram of the standard deviations of 1,509 tide stations.
OK, that’s a problem for this kind of analysis. This shows a bunch of stations with standard deviations over say 150 mm … and as we saw above, to my surprise, just one wide-swinging station can poison seventy other stations. So any analysis will be dominated by the widest-swinging datasets. Oooogh. No bueno.
As I said above, there’s no “right” answer to this question. About all that I can see to do is to set them all to the median standard deviation, which is about ninety mm. This gives them all equal weight and also makes them comparable to the raw data. Figure 6 shows the same 71 hundred year plus stations as in Figure 2, but this time after they’ve been set to the same standard deviation. Note that Trois-Rivieres is no longer dominating the results.

Figure 6. Averaged sea level. The average was taken as the cumulative sum of the month-by-month average of the individual station first differences. All first difference station data was set to a standard deviation of 88 mm before averaging the first differences.
I think that’s about the best I can do. I say that because I’m interested in decadal and multi-decadal changes … and there’s no reason to assume that tide stations with large month-to-month swings are more representative of those multidecadal changes than any other stations. With no theoretical reason to prefer one group of stations over another, I can only give them all the same weight.
(Upon reflection while writing up my investigations, I just now realized we might also find interesting results by using a yearly average of the data. At least this would get rid of the month-to-month variations … but at the cost of throwing away some data. So many possible analyses, so little time … I return to the current analysis).
Now, I mentioned that I was led to look at this by the Douglas re-examination of sea level changes. So I thought I’d take a look at the twenty-four stations he used. Here’s that result. All the stations have similar standard deviations, so I’ve not made any adjustments. Unlike my own analysis these are not detrended. In addition, the trends have been adjusted for post-glacial rebound using the data from the Douglas paper.

Figure 7. Stations from Douglas GLOBAL SEA RISE paper. These stations have been adjusted for PGR using the data in the cited paper. Note that these have not been detrended.
Hmmm … I’m not seeing any reason to prefer that Douglas subset to any of the others. It is different from any of the others that we’ve seen in that there is a clear acceleration in the rate of rise around 1970. This has not been visible in any of the other datasets. However, my main objection is the tiny size of the sample, only 24 stations.
According to the cited Douglas paper, among other requirements, to be usable the individual tide station records should “be at least 60 years in length” and be at least “80% complete”. Here’s the subset of the 1,509 records, the 235 stations that fit those two criteria.

Figure 8. Averaged of detrended sea levels, sixty year + datasets with eighty percent data. All datasets have been standardized to a standard deviation of 88 mm. This is the median standard deviation of the full 1,509-station dataset.
That’s not much different from the hundred-year-plus dataset shown in Figure 6. Let’s see what happens when we reduce Douglas’s required length of sixty years down to say forty years …

Figure 9. Averaged sea level, forty year + datasets with eighty percent data. All datasets have been standardized to a standard deviation of 88 mm.
As you can see, once there’s very little difference from adding the additional shorter-length station records. Figure 6 shows hundred-year-plus records, only 71 stations. It differs only in the smallest details from Figure 9, which shows forty year plus records and averages 500 stations.
However, there is a final perplexitude. So far, we’ve been looking at records with 80% of the data … but what if we make the requirement stricter? How about if we require that ninety percent of the data be present? It turns out that, just as with the eighty percent criterion, the results at ninety percent look quite similar at records lengths from forty to a hundred years … but the oddity is that they do not look like the eighty percent records.
Here are all the sixty year plus records with ninety percent data, 193 stations:

Figure 10. Averaged sea level, sixty year + datasets with ninety percent data. All datasets have been standardized to a standard deviation of 88 mm.
As you can see, Figure 10 is similar to the eighty percent data shown in Figure 9 in that it has the high point at the start. It’s also similar in the range from about 1875 to about 1920.
From 1920 to the present, however, the eighty percent complete records go up in a pretty straight line … and the ninety percent complete records go down, again linearly. Who knew?
So, after that voyage through the 1,509 records, what can we say? Well, we can’t say anything about the trend, because we’ve been using detrended records. Heck, we can’t even say whether there was a change around 1920, because the records with eighty percent data say yes, the rate of rise increased around 1920 … but the ninety percent records say no, there was no change in the rate around 1920.
However, something that we can say is that the one and only subset I’ve found that shows any recent 20th-century acceleration is the extremely small 24-station subset used by Douglas. It claims that there was an acceleration in the rate around 1970 or so.
All the other subsets we’ve looked at agree, eighty and ninety percent data alike, at all lengths from forty years plus to a hundred years plus. They all say that there has been a uniform gradual sea level change since around 1920, a change which has varied little over that time. In detrended terms, some subsets say it went up since 1920, some say it went down since then.
But not one of them show any recent acceleration in the rate of sea level rise.
In other words, despite thirty years of alarmists telling us that the seas are going to start rising at some accelerating rate any day now … there is no sign of that predicted acceleration in any of these subsets of the detrended tide station records. Of course, this doesn’t prove anything, you can’t prove a negative. However, it joins all the other evidence out there showing no recent acceleration in sea level rise.
My final thought out of all of this is that the sea level data from the tide gauges around the world is very sensitive to the exact selection of the subset of stations used in any analysis. There are differences even what I would have thought would be a trivial change in cr, say between eighty and ninety percent data for all stations over sixty years in length, which only went from 193 stations at ninety percent data to 235 stations at eighty percent data. And despite the fact that both groups contain datasets with what we would call good coverage, and despite the two datasets having over 80% of the stations in common … despite all of that, changing the requirement from eighty percent complete to ninety percent changes the overall change in trend since 1920 from rising to falling …
So I’d say the takeaway message is, be cautious in claims regarding the sea level rise speeding up. I’ve looked a lot of places for acceleration without finding any sign of such an increase in the rate of sea level rise, and this latest peregrination through the tidal data has only strengthened my skepticism about any claims made about the global sea level. It’s just too dependent on the methods used and the choices made to give me any sense of solidity.
Here, I’m very happy to be back from my Solomon Islands adventure. Before I left I had just finished building a large patio here by our hillside home. I rented a backhoe, bought a few pallets of blocks and bricks, and started digging and filling. Then when the rough backhoe work was done … shoveling. And more shoveling. What in a less politically correct time we called “Playing the Swedish banjo”. Here’s a shot halfway through the process with the downhill retaining wall in but not the uphill wall, featuring my weapons of mass construction, a McCloud and a couple shovels, plus my hand grader (a board attached to a rake) at the far right …

Once the level spot was made I had to decide how to treat the flat surface. I decided to brick it in. My artistic vision was to make what would look like a river of bricks running out from under our house to a pool, of brick of course, and then flowing out from that brick pool over the rapids at the far end of the patio where the retaining wall stops.
And here’s how it looked shortly before I left, with my gorgeous ex-fiancee tending her beloved plants …

And finally, here it is this lovely warm December morning upon my return, with verdant, insistent nature starting to push up through the spaces just like I’d hoped … I plan to let it grow and periodically mow it short.

So, propped up against the south wall of our house, enjoying the physical realization of my vision of a river of bricks, and smiling like an idiot up at the sun, I remain,
Yr. Obt. Svt.,
w.
PS—Please, folks, when you comment I ask you politely to QUOTE THE EXACT WORDS YOU ARE DISCUSSING. I can defend my own words. I cannot defend your understanding of those same words. Without the quotation, I often have no idea what you are referring to. I know it’s perfectly clear to you … but on this side of the screen, it is often a total mystery just what it was that I said that someone thinks they are referring to. So do yourself and all of us a favor and quote before replying, so we can follow your logic and comprehend your argument.
Finally, no, generally I don’t remember what I said in some discussion with you six months, six years, or often even six days ago. I’ve written over six hundred posts for the web, many of which have engendered long and complex discussions with a huge number of people, with most of the people using fake names. I make no attempt to remember who said what, or what I said. Instead, I simply do my utmost to tell the truth as best I understand it at all times so I don’t have to remember all the trivia—if I need it I’ll look it up.
So please, if you’re going to say anything resembling “But Willis, you were wrong last time when you said that …” to me or anyone, please follow that with a quotation of the exact words that were said. NOT what you remember about those words. NOT what you’ve understood those words to mean. THOSE EXACT WORDS!
Thanks,
w.
DATA: The data in the PSMSL archive is in a horrible format, with a separate file for each station with individual start and end dates. I’ve combined them into the normal data block, stations in columns, times in rows, as a zipped CSV file here. So … if you have questions about the results or you think I should have done some other kind of analysis … the ball’s in your court. Drop the CSV sea level data file into Excel or your favorite program, do the analysis you think I missed or messed up on, and let us know what you find out.
Thanks for a very good examination of the acceleration myth. Great to have someone with statistical skills have a trawl through the somewhat confusing data. This is exactly why WUWT is such a great resource.
great analysis ,love the garden.nice work all round.
I would conclude that tides, like climates, are very localized events.
So picking and choosing which data to put into the computer changes the output? Who’da thunk it?
Sarc, of course. Btw your brickwork is so awesome I think I don’t like you anymore. I’m not jealous at all, no not at all.
Foghorn, thanks for your kind words.
w.
Trois Rivieres? That town is hundreds of miles away from the sea? They have tidal gauges there? It’s about 50 miles away from Montreal. My apologies if there’s another Trois Rivieres.
Trebla
December 30, 2017 at 3:30 pm
Yes, the St. Lawrence is tidal even hundreds of miles from the open sea. Montreal might (only) just be and thus Trois Rivieres could be too.
From the metadata
ID Lat Long Name
203 126 46.33333 -72.55 TROIS-RIVIERES
w.
Harmonics.
Montreal is located as far west as sailing ships could go because of the rapids there. Eventually locks were built around the rapids.
And not the faintest chance that the results in that river or those three rivers, is a consequence of the exchange of the kinetic energy of moving water, and the potential energy of tidal heights, and has nothing to do with tidal data.
If you had a tidal bulge rushing west across the Atlantic at around a thousand miles an hour, why would you expect it to build up even higher when it is forced to stop going Westward by the Coasts of the Americas.
I’m not even going to ask if the results Willis got, relate more to the algorithm he came up with for his analysis, than they do with the data he fed into that algorithm.
G
Trois Rivieres? I have what I hope is not a foolish question regarding the Saint Lawrence River. Does the volume of water flowing in this river change year to year or decade to decade? I’m thinking floods and droughts and how a tide gauge would be affected.
http://www.maplandia.com/guadeloupe/trois-rivieres/
3,436 km
Distance from Guadeloupe to Montreal
1saveenergy
December 30, 2017 at 4:03 pm
That makes more sense! Thanks.
Willis Eschenbach
December 30, 2017 at 4:18 pm
OK, Vive la Quebec libre!
vive LE Quebec libre est plus correct…still meanlingless..free of what?
lemiere jacques
December 31, 2017 at 2:40 am
“Vive le Quebec Libre” was (in)famously uttered by Charles De Gaulle when he visited Quebec in 1967 giving new momentum to the nascent separatist movement there. It was a cause of huge controversy in Canada and led to a considerable souring of relations with France. This was around the time the separatist movement (FLQ) had kidnapped and killed the British consulate in Montreal…if my memory serves me correctly.
There seems to be only one Trois-Rivierres in the PMSL database Willis links to and its GPS coordinates places it in Canada on the St Lawrence river.
Since when are sea levels measured on rivers, especially at locations at least 100 miles from what the mouth at Quebec City?
From Wiki (I think we can trust this snippet, if not others):
To John in Oz: You’re right. Wikipedia also says the St. Lawrence estuary starts at the eastern tip of the Ile d’Orleans just downstream of Quebec City. Google Earth shows the altitude of the water surface at Trois-Riviere is 18-20 feet. The river channel is likely to be dredged for a shipping channel to a depth of 28 feet, like it is in the shipping channel in the Detroit River and Lake Erie (I have marine charts for those). So is the dip in the Trois-Riviere plot in the 1950’s due to dredging for the construction of the St. Lawrence Seaway shipping channel to be widened and deepened for sea-going vessels? The Seaway was finally approved in the Eisenhower administration.
Quebec City’s river surface is also a few feet above sea level according to Google Earth, and should probably be excluded from the tidal gauge data, since it is more likely to be river depth data. And Montreal is further upstream from Trois-Riviere and is the site of the first lock on the St. Lawrence at the suburb of St. Lambert with a 15 foot drop.
What’s worse is the flow over Niagara Falls (upriver from Trois-Rivierres) is modulated on a daily basis. Therefore, humans *are* at fault for changing water levels.
Water levels need to be measured on any tidal river that is used for navigation, or one could end up embarrassing themselves by getting stuck in the mud. If I remember correctly, the Potomac River in DC has a 3 foot swing in the tides.
The problem at Trois-Riviere is likely due to two factors. Winter ice and Spring floods on the many rivers feeding the St Lawrence. e.g. Lake Champlain — which drains into the St Lawrence via the Richelieu River. The “tide gauges” there regularly swing between 93 feet in late Fall and 99 feet or more during the Spring snow melt. I would assume that the other parts of the St Lawrence basin also have large seasonal swings.
“How do we deal, not just with this instance of Trois-Rivieres, but with the more general underlying problem that the month-to-month variations in sea level are of very different sizes at different tidal stations around the globe?”
yeah, there is a right way:
you do your charts for each individual station with no averaging.
averaging makes mud.
“Averaging makes mud” … right, we definitely should stop using averages for anything and everything, some random anonymous internet popup says so.
w.
won’t want you as the sound engineer in any recording studio, for sure.
your response is idiotic, too. you just lose it when your vanity isn’t coddled, eh?
gnomish, truly, biting my ankles by calling me names? Really? Do you think anyone respects you for that?
If you have a scientific objection bring it on … but your endless whining and bitching goes nowhere.
Sadly,
w.
i guess i will just explain it so i can say i did.
when you average data from one place and another completely different place, you are destroying data.
so your conclusions are as relevant as saying that the average person has one ovary and one testicle.
here’s how to do this- pay attention so you can ignore me properly:
produce the trend for each individual station (this preserves the geographical relationships you obliterated with the averaging.)
then sort them into populations of similar trends
and then one can say what proportion of places have what trends and one can say something about regional subsidence.
the same can be done with temperatures (i did a rather more elaborate job for sweden temps years ago before the novelty wore off this topic)
maybe you’re gnawing your own cankles, willis.
allow me to demonstrate this according to your often stated requirements:
you said this:
“gnomish, truly, biting my ankles by calling me names? Really? Do you think anyone respects you for that?”
so let’s see if you will follow your own rules as an honest man would-
as you accuse me of calling you names you will now quote me, howbow dah?
truly, tho- you troll your own threads all the time. so far as i know, heckling the crowd is was mostly done by the carnival clown at the dunk-tank.
habits are very hard to break, n’est ce pas? but you can’t resist the tarbaby, so enjoy your pastime in your golden years.
have a happy new year and my best to the lady.
may she soothe you when you’re overwrought and calm you when you’re agitated. Xanax for the rest, eh?
I agree. There are great regional differences in sea level rise, which can get washed out by averages. One has to take account of where the stations in the subset are, whatever subset is examined,especially if one is using the criteria he did. The inclusion of the Trois-Riviere station is an example of how much this can affect the results – it should never have been included since it is so subject to short-term factors. How many others are there than shouldn’t have been used?
This site shows a map of more recent change, measured by satellite altimetry, which avoids the problem of land level changes. http://www.soest.hawaii.edu/coasts/sealevel/
you really are a pissant aren’t you …
The averaging will show the nett sea level change over the sample and timescale. Using your logic, you also have to consider how a global temperature is deduced. In order to combine different data types (sea and land temperatures) we end up with an ‘average’ global temperature. )See Michael Mann Hockeystick drawing.
https://en.wikipedia.org/wiki/Hockey_stick_graph
It is important to remember that the primary job of most tide gauges is as an aid to shipping …
Tide gauges have a practical application in the shipping and fishing industries where low or high tide levels can hinder or prohibit access to shallow bays or locations with bridges. To this end, many industries have installed private tide gauges in ports across the country and also rely on government agencies (such as NOAA).
Data collected from tide gauges is also of interest to scientists measuring global weather patterns, the mean sea water level, and trends – notably those potentially associated with global warming.
https://en.wikipedia.org/wiki/Tide_gauge
The Trois Rivieres gauge may be the most extreme example of this.
Same issue as using temperatures from airports…
trois rivieres is halfway between quebec city and montreal, the st lawrence is brackish until the ile d orleons just east of quebec. there is a large tidal effect at quebec.
I found the way that one rogue station messed up the results to be the most interesting part of this article.
The main lesson for this is to check for stations that differ significantly from the others. Imagine if Willis Eschenbach had generated Figure 2 first and tried to draw conclusions from it.
Having identified a rogue station the correct thing to do is what this group has done; study that station to determine why it is different.
In this case the reason is that it is a long way up a river. I understand why they measure the water levels there, however, there is clearly a lot more than tide affecting the readings. So in this case the correct response is to remove the station’s data from the analysis.
All this applies to many other areas, we all know that much, if not all, “global” warming is due to some stations being exposed to localised heating. Honest climatologists would attempt to identify and remove such rogue stations.
“Eventually locks were built around the rapids.”
The full St. Lawrence Seaway:

Oh Lordy, it’s worse than we thought… Erudite analysis on sea-level effects of global warming ice melt in this article.
“Just as standing atop a trampoline causes it to sag, packing extra weight on our round Earth causes the Earth to become squished.”
“Turns out, the squishing effect is big enough that our satellite altimeters—which measure the height of the ocean surface relative to the center of the Earth, but don’t notice what’s happening at the seafloor—may be underestimating global sea level rise.”
“Underestimating”…….. We’re all doomed…..Damn that squishing.
https://earther.com/climate-change-is-causing-the-seafloor-to-sink-1821632553
“Damn that squishing” is my new favorite saying.
Nice analysis. Had not seen it done that way in the past. See my guest post here some time ago on sea level rise and closure for an alternative analysis that reaches the same conclusion you do about no evidence of acceleration. PMSML has about 140 diff GPS land motion corrected tide gauges, but only about 70 with records at least 60 years long (the minimum formtrends because of lunar and current (AMO,PDO) tide variations. Those give about 2.2mm/year and no acceleration. What is noce is that the estimate ties closely to the best estimates of the closure problem.
When two completely different methods yield the same ‘no acceleration’ conclusion, it is a strong reinforcement of an Anti CAGW message. Regards.
Thanks, Rud. Do you have a link to the list of corrected stations? that would be interesting.
w.
Willis, sort of easy. Google ‘GPS PSMSL’ or some such. Appropriately linked keywords Should take you directly to the GPS PSMSL webpage. Lots of pictures and explanations, but no data. That webpage links to where the data actually is, SONEL.org. Link over there, and a beautiful map appears of all such stations—with no data on the essential minimum 60 year record length. So, you have to build your own data table by subtracting from the SONEL list all those stations with less than 60 years on the equivalent PSMSL list. The remaining uncertainty, as you identified in your post, is record completeness.
Sonel.org maintains a database of the Tide Gauges which are co-located with GPS stations and there are now more than 200 co-located stations that are operating past the 5 years which is required to obtain a good consistent GPS vertical uplift record.
The data can be obtained here:
http://www.sonel.org/-Sea-level-trends-.html?lang=en
1960-1992, GPS adjusted tide gauges –> +1.82 mms/year.
1992 to 2013, GPS adjusted tide gauges –> +2.12 mms/year.
In 2011, GPS adjusted tide gauges -> +2.79 mms.
In 2012, GPS adjusted tide gauges -> +4.25 mms.
In 2013, GPS adjusted tide gauges -> -0.345 mms.
Since sea level changes with the ENSO, we should expect a very large rise in 2015 and then a large decline in 2016 and a flat 2017.
The GPS stations can and do reflect actual elevation of the station. Takes many samples of 4 satellites, but can be done. Lat/long accuracy is a piece of cake using the actual carrier wave and post processing like they do with surveys.
Problem is the “earth monument” used for the sea level value could be moving, not just up/down but horizontally, as Willis and others point out. So I like the U.S. Navy satellite data of the oceans, as the data is referenced to the center of the Earth.
There are pictures from south Louisiana that show the subsidence of the land. Apparently some street signs were embedded in either rock or deep enough to show the vertical loss of land. Due to river diversion, levees and other exampes of man’s messing around with mother nature, the land is going away because the area isn’t flooded anymore. Additionally, the hydro pressure is not what it was when I was a kid in the 50’s growing up in New Orleans. That shore south of I-10 is losing about a football field of soil every hour due to basic tides.
As with the use of a 30-year baseline for all the anomaly graphs, maybe we should do the same for the sea level using the satellite data. The sea level is not as important to the military navies as the depths, shoals, seamounts and such. The tides are players, but you use relative sea level for amphibious landings and such. So take 30 years and do as the temperature dudes do with “anomalies”.
Gums….
Bill Illis:
Thanks for the link.
Accounting for vertical land movement, Los Angeles, Sitka, Skagway, Unalaska, and Brisbane AU all show a net drop in sea level.
Juneau, between Sitka and Skagway, shows a net sea level rise of 2.69 mm/year. That doesn’t make much sense.
There are two GPS units shown for the Los Angeles gauge. One 2168 m distant but still on the coast gives a net sea level change of +1.07 mm/year, while another 24,686 m inland gives a net change of -2.21 mm/year.
Distance of GPS locations from the Alaska gauges range from 10,238 to 24,922 m. The closest GPS to the Brisbane gauge is 18,490 m. Maybe the GPS should be a bit closer to the tide gauge to be useful.
verdeviewer,
You are right, the GPS stations should be as close as possible. Most of these stations have a GPS station in the same facility as the tide gauge but 1.0 or 2.0 kms away should be good enough as long as they are not on opposite sides of a fault or a landfill/sinking area.
The other issue this raises, is that one needs a very large number of tide gauges to be able to measure general sea level change properly. Besides the issue of vertical land movement, there is just a lot of variability between the stations. Even corrected for vertical land change, the tide gauges vary between -2.7 mms/year to 5.0 mms/year.
I would say you need 300 or 400 good stations to so this properly. I have played around with this data enough to know that is what is required. If a study used less than this, a person could carefully cherrypick a set of 200 stations and get any number you want. Church and White, for example, have done lots of these sea level studies and use a large number of stations in each, but they change the ones they use from study to study which is odd of course and one should wonder why. In my numbers above, I manually adjusted the dataset to ensure the exact same GPS-adjusted tide gauges were used throughout.
I recently watched an episode of “Mega Builders” about the construction of commuter rail project in Istanbul:
While digging for the central subway station foundation at Yenikapi they ran into shipwrecks which were once at the bottom of one of Constantinople’s commercial harbors called Harbour of Eleutherios and later Harbour of Theodosius. This article says it was built during the late 4th century and in use until at least the 11th century based on dating of the excavated wrecks. The article goes on to say:
Presumably if the sea level were rising the harbor would not have been abandoned due to silting.
More examples on this page
http://www.use-due-diligence-on-climate.org/home/climate-change/sea-level-rise/local/
See Harlech Castle built 1289,
The castle was supplied by ship. Yes, but not by the sea. A stream about 2 foot across at the foot of the castle hill was diverted and canalised to form a channel some 10 foot wide and today some 3 foot deep for 1 mile to a point called Ty Gwyn y Gamlas at Ynys Talysarnau which opened up to a tidal river Afon y Glyn. Much of the flat marsh was in existence at the time the castle was built. Historians state that Edward I when visiting the construction had horse races organised. There is a farm today on the marsh between the sea and castle called Fridd Rasus in English means field of races.
There is no need to take my word for this the canal is readily observed from google maps and more pertinently satellite images. There is no reason for drainage to make the cut so large and in the direction it took the only plausible reason is for shipping. The full name for the point at which it enters the tidal river is Ty Gwyn y Gamlas, which means the white house of the canal. Fridd Rasus may be googled for the recycling centre site today and from that the recycling centre is marked on the OS map near Ty Glan Mor.
The ditch is clearly artificial, the name indicates that it was used for shipping, it leads to the foot of the castle. The only question is when was it constructed? the land it passes through was in existence during the castle’s construction as they had horse races further out towards the sea. the existence of the low level gate in Harlech castle is a fact but was it a sea gate or a gate to the canal?
http://www.coflein.gov.uk/en/site/415281/details/ty-gwyn-y-gamlas
please see the alternative explanation to the sea gate on Harlech castle. The truth is no one has ever shown me conclusive proof as to whether the canal is contemporary to the castle construction or was an afterthought. Or whether the sea actually reached the foot of the castle when it was built. It is often stated that Edward I, castles in Wales were lapped by the sea. Yet FFlint and Rhuddlan are both on tidal rivers and Castell y Bere was inland. Beaumaris, Cricieth and Caernarfon are coastal so the assumption has been that Harlech was on the sea.
for the site of the race course
which supposedly dates to the casltes construction
Say Gerontius; interesting narrative there, and the horse races too.
I even remember when I was younger; circa 1951 going to the horse races on Boxing
Day (day after Christmas) specifically to watch the Auckland cup and associated races; NZ’s biggest horse race.
You would never guess which horse won the Auckland Cup race that year …. Beaumaris !!
The second race for the double that day (for two year olds), was won by a really fine horse by the name of “Mainbrace”. As I recall the second horse was named “The Unicorn”, which was the principle competition that Mainbrace ever came up against. A filly I can’t remember was third, and paid more to show than either of the other two horses paid. I remember Mainbrace was such an odds on favorite, that it only paid 19/6d for a pound to win.
You actually lost sixpence on every quid you bet to win. I remember it well because I talked my mother’s lady friend into switching her bet for a place from the filly to The Unicorn. Last time I gave anybody some expert advice.
G
Patio is incredible…..fantastic job!!
Nice analyses of many data sets. Looks like another climate change myth has been uncovered.
Thank you Willis.
Why your “ex”??? WHAT DID YOU DO???
nabbiz
16 minutes ago
See here for the answer to your question …
w.
I would guess he married her…hence c-fiance, new wife
Usually in movies they build the patio /afterwards/ to hide the body 😉
Willis, I just wish I had the money to have a garden like that. Little greenies build so small a town with so many people in I have no chance.
We bought this land nearly forty years ago, no way I could afford it today …
w.
Where is that, north Cali? I love Michigan but it is tough right now, 10 deg F.
Yeah, about an hour and a half north of San Francisco, and maybe five miles inland from the coast. So far this is looking like a dry year here, but nobody’s mentioned the “D” word yet … last year was very wet, ending the previous four years or so of drought.
w.
Plus 10? Consider yourself lucky. We’re at -7F (-22C) with “dangerous windchill” warnings until noon Monday here in northern Vermont. Oh well — There are no bugs out and I don’t have to worry about mowing the lawn which is under a foot of snow and ice.
Great post, but the patio looks like a pigs ear.
I think of it as a silk purse …
w.
Willis,
Thank you for an interesting exposition. One thing occurred to me when reading this and that has to do with the detrending. I assume that a least squares linear fit is removed from each dataset. I’m curious what the effect is of the differing station series lengths in this process. If a station with 60 years of data is included in a given analysis, what might the trend be for that short time period compared to the trend of a nearby station with a continuous record going back 150 years?
The scenario I envision would be something like this… Suppose Station A has a continuous record from 1857 to 2017. Further, suppose it shows two distinct phases, one from 1857 to 1920 where there is a consistent decrease in apparent sea level and another from 1921 to present where there is a consistent rise in apparent sea level from 1921 to present. Now suppose Station B exhibits the same apparent fall then rise in mean sea level, but the records exist for only a subset of the 160 years that Station A has.
If Station B records are for the early time period, say 1857 to 1916, then the detrending would show a flat line as there was a steady decrease over that time period. But if the records for B run from 1875 to 1934, then the detrended data would show the transition from decrease to increase. Likewise if the B records run from 1940 to 1999, for exanple, then the detrended data would again be flat.
My wondering, perhaps you could even call it concern, is that by analysing datasets of differing lengths using a detrending step you will have the effect of flattening out any decadal signal that might be present in the raw data. Does that sound like it might be happening in this analysis?
Is it a reasonable assumption that the missing years are randomly distributed? Probably yes.
I note that Willis’ subset analyses give the same message whether the good data length is increased or decreased.
Chugiak? Sounds supiciously Alaskan to me, I do love that state.
Onwards to the statistics. IF the results were different between say the hundred-year-plus and the forty-year-plus results I’d be more concerned about that. But they’re not. Doesn’t mean it’s not an issue, just goes to size.
However, I do understand and have considered the issue. One thought I had was that I’d choose a subset of the data regardless of length that had good data from say 1950 to 2000. Then I’d detrend them all based on just that chunk. That way, everyone would be rotated around a common point.
As I said, so many analyses, so little time …
w.
I love this stuff from Willis. Lots of reasons to scratch my already bald head.
The other enjoyable part of this (probably not so much for Willis), will be, as the thread grows, the several folks who either fail to follow guidance and quote Willis’ words, or simply just make stuff up and accuse Willis of having said or implied it.
Ignorance you can address; but you just can’t cure stupid.
PS:
I also just returned rom the Solomons (November) – I’m a WWII history buff & son of a WWII US Marine. Guadalcanal was my specific interest.
Love it, Willis
Just shows what a bit of lateral thinking from an amateur (albeit a very gifted amateur) can do to put these things in perspective. Haven’t seen the Douglas paper but it looks very much like your bit of peer review could be useful!
(aside – do we take that all your subset analyses of the Douglas data are GIA-adjusted in the same way as the original paper?)
We have CORS almost everywhere now….and certainly close enough to tide gauges to measure rebound or subsistence…
Yes, and using it to correct tide gauge data for rebound or subsidence to determine actual sea level rise would be a relatively easy and profoundly enlightening Doctoral dissertation for a geology grad student.
In the meantime, below is my favorite (and previously posted) video on sea level rise. It compares actual tide gauge data to alarmist projections and also illustrates the effects of rebound and subsidence at numerous locations:
By the way, the brickwork looks great. I undertook a similar project about ten years ago, but it was about one fourth the size. I have tremendous respect for the work that went into yours!
No need to detrend. My suggestion is a histogram of linear fits to the first differences from 1975 compared to the period from 1900 to 1940. If you can’t spot a distinct subset with a narrow distribution in the broad distribution, the data is not good enough to see acceleration with out subjective choices that could introduce a trend that is not there.
A couple of alarmists come out with a study that claims to show accelerating sea level rise. It gets peer reviewed by several like-minded alarmists who, of course, give it their stamp of approval because it confirms their own assumptions. All of a sudden it is declared as “settled science” and anyone who challenges it is a denier. Thanks for your efforts to bring some balance and actual science to the debate.
Making the data available in more accessible form is a great boon for those who would like to check on AGW claims. I recall that the the USCRN data was only available station by station some years ago when I wanted to analyze the data. Haven’t checked it recently but if still available only piecemeal it would be nice if there was available an algorithm for getting all the data in one piece. Maybe a Website where persons could deposit their programs for getting temperature, tide station, etc. data in one Excel/other file.
Wasn’t it some scientist at the University of East Anglia who said that he wouldn’t release his raw data because someone would try to find something different with it, compared to his own conclusions?
The noble Professor Jones, University of Easy Access & Climategate fame.
““Even if WMO [the World Meteorological Organisation] agrees, I will still not pass on the data. We have 25 or so years invested in the work. Why should I make the data available to you, when your aim is to try and find something wrong with it”
I got lost on the statistics – I’ll have my wife, the PhD economist take a stab. But I also want to relate the views of the crab fisherman from Maryland who said he has not see a water level change since 1970. http://dailycaller.com/2017/08/01/commercial-crabber-of-50-years-tells-gore-sea-level-hasnt-changed-since-at-least-1970/?utm_source=site-share
Fascinating analysis, and reassuring that you won’t have to add another layer of paving bricks to your beautiful patio. I didn’t note in your analysis whether the ~19-year Metonic Cycle in sea level would affect anything. The cycle sets the lower limit on number of years for averaging, and supports the 60-year suggested minimum averaging to give at least three cycles. NOAA Tides & Currents has a reprint of American Council on Surveying and Mapping “Understanding Sea Level Change” that describes the cycle, and measurement of sea level. Link is here:
http://www.tidesandcurrents.noaa.gov/publications/Understanding_Sea_Level_Change
Willis, Can you identify what criteria was used by Douglas that changed the subset down to 24 sites? You mention his 60 years and 80% produces a subset of 235 stations. How did he get down to 24?
Different topic: an interesting alternate analysis could detrend these records relative to a standardized period, say a 1920 to 1960 baseline (most of the records are pretty flat in that period). The choice of baseline period obviously would alter the results, but each record would present the changes relative to that same “normal” period. This would probably put the early 1800s bump into a proper perspective, rather than tilting everything to match the average that includes that, but missing in some. Early 1800s probably featured a lot of ice melting, end of LIA. All of these analyses show things were different after about 1870. This would also provide a constant rate just before the claimed 1970 increase, with all records agreeing that 1961 is the beginning of results that might show acceleration.
I would suggest that he looked at all the sites and then chose the ones that gave the story he wanted to tell.
On that basis they have now been caught with the their fingers in the Adjustment pie and are now busy rewriting Tide Gauge History.
https://notalotofpeopleknowthat.wordpress.com/2017/12/05/adjustments-to-create-spurious-sea-level-rise-have-now-infected-the-psmsl-tide-gauge-data/
A C
Is that –
On that basis they have now been caught with the their fingers in the Adjustment pie and are now busy rewriting Tide Gauge History – with several fat fingers on one side of the scales?
Perhaps?
Auto.
Me, I simply looked over the records and found that with few exceptions, the tide gages only reported an admittedly noisy linear trend. Short ones do, long term ones do. And when you do find an exception it’s usually some sort of step change … that simply prompts you to look for local earthquake activity at the time of the change and BINGO…you find that there was that kind of change which caused the different rate.
I simply looked
≠=========
my math prof from years ago was big on the mark one eyeball as the primary analysis tool. he taught that it was easy to fool yourself in statistics and find spurious trends that were not actually part of the underlying data. rather a product of the methods chosen.
this is confirmed in the work Willis has done above. changing the method changes the result.
this points to an inherent problem in statistical analysis. methods shopping. trying different statistical approaches until a method is found that returns a specific result. the problem is that in all likelihood this result is a false positive.
the problem comes when this is submitted for peer review. if the researcher mentions that multiple methods were tried until a result was found everyone will know the result is likely false.
so the researcher has a large incentive to keep quiet about the different methods tried and only mention the one that returned a result.
and we are left with an epidemic of false positives in science. unfortunately peer review cannot detect a lie of omission so peer review is not a solution to the problem.
“my math prof from years ago was big on the mark one eyeball as the primary analysis tool. he taught that it was easy to fool yourself in statistics and find spurious trends that were not actually part of the underlying data. rather a product of the methods chosen.”
Ferd, I was making a final pass through this thread to see if I’d failed to address any comments directed to me. Your comment caught my eye. I pretty much agree with your professor. BUT we do have a counterexample here. My eyeball says Trois-Rivieres is pretty much “normal”. So did Willis’s. And probably yours as well. Turns out it’s not. Even knowing it’s a problem, it’s hard to see eyeball-wise that it’s a problem or why.
Another triumph of observation over ‘truth’..
I love it.
Teachings of Progressivism must be exposed truth by truth.
One by one.
Nice work.
Looks like a lot of world war data gaps. These add a non random component as during WWI the planet was sharply warming, and during WWII sharply cooling from a maximum in the late 30’s.
It is generally agreed that the ocean surface temperature drives atmospheric temperature. To whatever extent the ocean surface warms, it simply must expand; and the reverse when cooling.
This should drive sea level rise (and fall), unless there is compensating cooling at depth…
Separate comment from accelerating SLR. Man, that was a lot of leveling/paving stone work you did. Made me tired just thinking about it. Nice job. In Wisconsin on my dairy farm, we have to use all that energy laying in firewood to heat in winter. Not much energy left for anything else. so we have just gravel the acre plus barnyard in two grades, breaker and crusher run. The tractor with 7 foot grader blade levels it sort of out sometimes, and occasionally (like every 3-4 years) we have to bring in more dumptruck loads. Poor mans solution to your rich (figuratively and spiritually) mans beautiful result.
Thanks, Rud. The tractor work was quick doing the excavation of the notch on the hill and putting it down below.
After that, it took me a number of months over the summer doing just a bit a day. My saying for this kind of work is “At least it’s another tile in the mosaic …”.
I work at not thinking about how many bricks and blocks that it will take to get to the end. I just focus on one tile at a time, and take joy in placing it just right … the whole job took me over six months.
Best to you and yours,
w.
So it appears that the primary difference between Douglas’s trends and yours is that he includes post-glacial rebound (PGR) and you don’t. But (IIRC) PGR was quantified using sea level as a metric — I don’t have the citation. If so, then Douglas is using a “degenerate” procedure, which is to say, sea level and PGR are interdependent so you can’t treat them as orthogonal to draw conclusions about one or the other. That’s my first take on it, anyway.
Also, elevation is an alias for gravitational scalar. Where the Earth varies from perfect spheroid, the “elevation” becomes a matter of convention. The presence or absence of miles-thick ice sheets deforms the Earth’s shape away from spheroid. Lots of tweak-room there, maybe they’re solving for it beautifully, I don’t know, just mentioning it as relevant.
With a such beautiful place and beautiful ex-fiancee, what the Hell are you doing messing with trying to educate us, the unwashed? I’d be heels up next to the pool trying to figure out whether I liked Corona or San Miguel better and not worrying about anything else. I’m starting to think you are not as smart as I think you are.
William Grubel
It’s a sickness … and a joy. Mostly I love the surprises when I do the research, that’s the fun part. The rest is good too, though, even the bad parts where I’ve made some error or mistake. The good news is, mistakes and errors don’t survive long at WUWT. So it is indispensable in my work to publish here, it has saved me heaps of time following blind alleys based on my own foolishness …
w.
It should be noted that:
“Tide gauge data is worthless for determining Global Sea Level and/or its change unless it has been explicitly corrected by on-site CORS-like GPS reference station data capable of correcting for vertical land movement. Since the current standard for Tide Gauge data, the PSMSL GLOSS, is not corrected for vertical land movement, all studies based on this uncorrected PSMSL data producing Global Sea Level Rise findings of any kind — magnitude or rate-of-change — are based on data not suited for the purpose, are not scientifically sound and do not, cannot, inform us reliably about Global Sea Levels or Global Sea Level Change.”
Vertical land movement is not the simple result of “post-glacial rebound” — most tide gauges are attached to piers, quays, docks, and other structures built at the juncture of the sea and land — almost always land that consists of fill — and land that is mud. Dockland subsides — it does not subside evenly over a hundred years.
Only a few lucky sites, such as The Battery, in NY City, are firmly mounted on bedrock — the rest ooze and sink into the mud, slowly or quickly.
No tide gauge data not expressly corrected with an on-site, same structure continuously operating GPS reference station should be consider for use for anything other than determining local relative SLR.
There are other things that impact ground level. Such as drawing down an aquifer or pumping out oil.
kip, see my 2016 guest post on SLR, acceleration, and closure. This is not new news.
ristvan ==> Certaintly isn’t new news — I wrote about here, you wrote about it, the PSMSL writes about it.
Anyone who seriously considers Sea Level Change knows about it and the technological improvements needed to use tide gauge data for global analysis.
Kip, thanks for the reply, but I fear that quoting yourself without attribution, as though you were quoting some independent authority agreeing with you, doesn’t impress me much …
In addition, I’ve looked at heaps of tide station records. The overwhelming majority of them don’t have some kind of kink in them where e.g. dockland “does not subside evenly”. Not saying it doesn’t happen. Just saying it’s not all that common.
To confirm this, I just took a look at the Levelling Connections for 21 tide gauges in Australia … and I didn’t see one GPS record that is anything like what you are claiming, where the settling is not even. The majority of them don’t change in elevation by a single mm in two decades … so no, I reject the idea that the majority of tidal stations are useless because they are on land which is settling unevenly enough to be significant.
w.
willis ==> :eveling is an entirely different subject. The use of “nearby” (which can mean 15 kms) GPS stations is not meant to nor does it capture subsidence of the structure to which the tide gauges are attached.
This is not my opinion, but the opinion of the PSMSL group — which has a program to accomplish this in order to finally be able to use the tide gauges for determination of global sea level changes.
See mine here.
willis ==> You can read about the need and the plan in the PSMSL’s GLOBAL SEA-LEVEL OBSERVING SYSTEM (GLOSS) IMPLEMENTATION PLAN – 2012.
The attempt to use leveling techniques is a stop-gap measure simply because it is better than nothing. In reality, both PSMSL and NOAA fully acknowledge that truly useful data will not be available until there are enough high quality tide gauge stations matched to same-structure continuous GPS reference stations that have been running long enough — 3 years is usually cited — to reliable correct for Vertical Movement of the tide gauge itself.
Thanks, Kip. I agree that visual levelling is not the best, but it is way better than nothing. And yes, you are correct that we need continuous co-located GPS stations to get the final answer.
w.
willis ==> And the good news from the Sea Level field is that, unlike other aspects of climate change science, the Sea level people (at least the professional groups) know this and are actively working to make it possible to have correct and usable data.
Once there is a large enough network of tidge gauges linked to co-located (same structure) Continuous GPS stations, they still will only end up with very good local relative sea level data — we will be able to know what sea surface height is doing at each location.
As the satellite data has revealed, the sea rises and falls differently in different places — some rising, some falling, all at differing rates.
Turning that data into a “global average” will be a complex, complicated technical chore and may, in the end, still return a number that represents something other than how much and how fast the volume of water in the oceans is changing.
Summary: It ain’t easy.
Tru’ dat, Kip, it ain’t easy.
Thanks,
w.
Kip, a further note. You say to be useful a site must be:
This is not entirely true. Actually, in the field any nearby high-resolution GPS can be and often is used as a reference station to visually measure the absolute change in the vertical position of the tide gauge. There are a number of examples in the Levelling Corrections information I linked to above.
Best regards,
w.
Mr Eschenbach, there are other reasons for Tide gauge movement, one absolutely classic is the Earth Quake that caused the Tsunami that hit Japan and took out the Fukushima Nuclear Power Station.
“The Tohoku quake lifted the seafloor by 30 feet (10 m) over an area the size of Connecticut.”, so locally that must affect tide gauge readings as well, especially where the coastline is affected.
What your analysis strongly suggests is that the study you referenced used Cherry Picked data to get the result they wanted.
GPS can measure vertical movement and East-West and North-South Movement. This has revolutionized continental drift movement and theory (we actually know now).
This is the data from the GPS station on the western side of the San Andreas fault at San Francisco (Tiburon Peninsula). The data is actually quite stable other than the earthquakes. Almost all GPS stations are like this with fairly stable trends. Wait five years and that is enough to be reasonably sure.
– west at 19.0 mms/year;
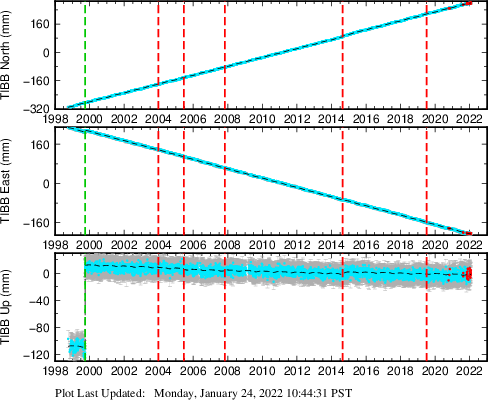
– north at 25.0 mms/year; and,
– down up 1.0 mms/year (a Magnitude 5 Earthquake in 1999 shifted the station up by 120 mms).
Data here:
https://earthquake.usgs.gov/monitoring/gps/SFBayArea/tibb
http://www.sonel.org/spip.php?page=gps&idStation=3024
Cherry Picked data
=======
that was my first thought when I saw the low number of stations used in the study.
the problem is that the cherry picking can be subconscious. the researcher can honestly believe they have produced a fair and honest result and be completely unaware of the bias they have introduced.
thus the importance of experimental design. I personally would be sceptical of any result that doesn’t discuss the experimental controls that were employed to prevent subconscious bias.
willis ==> Leveling is not the same as determining VLM — related but different subject.
“Tide gauge data is worthless for determining Global Sea Level and/or its change unless it has been explicitly corrected by on-site CORS-like GPS reference station data capable of correcting for vertical land movement”
On the other hand Global Sealevel is only usefull for determining the amount of water in the oceans, but that tells little of local level relative to land, and that is the important measure, which tide gauges tell about.
If PGR is real and means the sea floor sinks 0.3mm/year, then the land should rise ~1mm/year, because the Earth has the same volume.
Ooh, Willis, that is a FABULOUS patio you’ve built! Haha–Weapons of mass construction! I really like the flowing water look and the plants growing in the openings.
Thanks, dear lady. As a rank amateur, I was overjoyed that my initial vision could actually come to pass … to make that happen I laid brick, and pulled sections of brick back up and laid brick down again, until I was satisfied.
My criterion was that my eyes should not “catch” as they wandered around the pool of brick. I wanted every part to flow, nothing to hang up free movement.
So once I had bricked over the entire expanse, and even before then, every evening I’d sit and just let my eyeballs roll around on the surface of the pool … and the next day, I’d start by pulling out what caught my eye and replacing it with something new.
That was all done with intact full bricks. Then was the final adjustment. I used a big giant screwdriver. Stand on a brick, insert the screwdriver, lever and you can move big sections of brick. That took some days, I found out that brick doesn’t much care for going around in circles.
The last part of the brick puzzle was cutting filler pieces out of whole bricks using a brick wet-saw. Slow. Plus in the process I noticed some more sections that had to come out and get redone.
Finally got it it all adjusted, nothing catching my eye, so I poured white sand over the surface and swept it into all the cracks to hold it in place. Blew off the excess with my shop vac, called my journey done.
“Ten leagues beyond the wide world’s end,
Methinks it is no journey …”
Always good to hear from you, Joanne, best to you and yours,
w.
PS—As with many things I’ve done in my life, this was indeed my very first foray into both the building of block retaining walls, and also laying patio brick. Go figure … I’d say not bad for a first effort. Given the amount of sweat invested, and given that I generally don’t sweat unless there’s emotional attachment, I figured with any luck there wouldn’t be a second effort, plus it was my own house, so why not go wild?
Enjoyed both the sea level material and the patio work. A very nice addition — both.
Hope you don’t mind this: “The combination tool was created in 1905 by Malcolm McLeod.”
I’ve used, and explained the use of, this tool many times and its name is pronounced as you have spelled it.
Interesting. I always thought it was named after the town in N. California spelled the way I spelled it. I stand corrected … I see I’m not alone in my error, however. Google returns almost half a million results for “McCloud tool” …
Thanks,
w.
Hi Willis,
Happy New Year!
Another story regarding tools is that Ed Pulaski “invented” the pulaski.
This is likely not a “fact”, but an “alternative fact.”
It is possible that he saw a drawing of such a tool in a printed catalogue from a northeastern company (I no longer have the reference), then either made one or had the FS blacksmith make one.
So when legend becomes fact, print the legend.
(I have a very early one, about half the size of the heads sold now. No date.)
He is respected for this (wiki): Drawing on his knowledge of the area and of the dynamics of forest fires, Pulaski led his men to safety in an abandoned prospect mine.
It is said that he lost most of his eyesight because he stayed awake and, with pistol, held his men in the tunnel.
John
I wondered about the Pulaski after I got corrected on the McLeod … thanks for the info. It’s the best tool for splitting kindling, because you can lever on the handle.
w.
Thanks Willis, nice to see you are still looking for the acceleration that *has* to be there to satisfy the CAGW alarmists.
Of course, for me the ‘take home’ is that even if the trend is hard to figure out, compared to wind driven waves, much less the daily ebb and flow, any signal in that trend is really inconsequential. It was pictures of Big Ben drawn submerged beneath projected future sea-level rises that got me interested in Climate. That would be 25 years ago now and I think it’s really time the alarmists were called to account on this particular piece of alarm.
Another point I never hear raised, but which could be of interest to your enquiring mind: Given the very large ranges in tides between geographical locations (eg ~1m max here in Perth, Western Australia, to ~12m up in Broome, ‘just’ 2,400km to the North), it seems to me that any (even quite small) changes in the location of amphidromic points (point locations with no tides, but I’m sure you knew that) could have a major impact on attempts to measure sea-level rise at a location. As with so many cyclic phenomena, I begin to wonder what is driving what!
Good work, but we are subject to the daily vertical displacement of the Solid or Land tide even while we are pretending to measure it. It is nonsense to suppose that the sea tide rises and falls by itself, while the land beneath the sea remains static. At times of king tide, there is a king tide in the land also, hence the clustering of earthquakes around perigees (e.g. watch for an increase around 2-6 January).
There are many lunar factors affecting the height of the sea on any day, and no comparable date in the past when all factors came together. Among them are wind direction, air pressure, currents, declination and perigee, phase, and undersea eruptions most of which are unrecorded and undetected but nevertheless will drive water towards or from a beach. A differential in land mass will change the land tide, so that a mountain range seismically may potentially skew readings at the nearby sea coast, c.f. a flat harbour. Then there is the volcanic atoll, and various Pacific countries which go up and down like elevators.
Comparing sea levels is like counting the barks of dogs across different decades, and declaring dogs to be more disgruntled today, justifying one’s fear of them.
Just saying..
Ken Ring
2 hours ago·
Ken, I looked into this question in a post called “Tides, Earthquakes, and Volcanoes“. I was unable to find any evidence that tides had anything to do with earthquakes …
Regards,
w.
I have written a 264-page book called “How To Predict Earthquakes (in advance)” which explores the fact that the big Christchurch earthquakes of 2010 and 2011 occurred coming up to low tide at their nearest tidal point. Low tide at sea means high tide in land. It was the same with the 7.8mag shake at Kaikoura on 14 November 2016. To me that is direct evidence. Twice the needle on the tidal drum jumped off the scale in the 2011 series.
Ken, you cannot build a theory on three earthquakes, or even six. You need to look at all of the quakes. As I mentioned above, I’ve done that in my post “Tides, Earthquakes, and Volcanoes“.
In that post, I compared the timing of no less than 13,541 earthquakes with a strength of greater than 5 on the Richter scale that occurred since 1900 to the strength of the tidal forces on the earth at the moment of the quake … and I found no correlation. I also looked at 3,396 volcanic eruptions that occurred since 1800 … again, I found no correlation with the strength of the tidal forces.
If you have problems with my analysis of the 13,541 quakes I encourage you to investigate them yourself. The earthquake dataset is from the USGS. I point out in my analysis how to calculate the tidal forces. Perhaps you’ll have more luck than I did, as I could not find a correlation.
Best regards,
w.
So basically you’re saying, that from the existing data, the only way the oceans are going to cover us, is if we’re buried at sea?
Remember that I detrended all the data …
Thanks,
w.
The sea is as high as it ever gets, as we are at or near the end of the current interglacial. So the sealevel can only go down, as the South (wherever it ends up being) Pole attracts more water for ice. But we shouldn’t notice anything for at least 8000 years.
That is the only true climate change, and it happens so slowly that there is plenty of time for everything to adapt. And what cannot change like the millions of already extinct species ends up having no place here.
Ken Ring
20 minutes ago
Huh? Seas all over the ocean are still rising, whether you measure by tide gauges or satellites. So no, the sea is not “as high as it ever gets”.
w.
Willis
Like I did with my data set on minima and maxima, to get a global overview, I think you have to balance your data set to zero latitude.
Alternatively, you could look at one station with good data on the equator, like this one where you just came from:
http://www.psmsl.org/data/obtaining/stations/1861.php
Going by the above result it seems there is down trend from around 2000….
which confirms a [my] cooling trend (from the Gleissberg, remember?)
(sorry, I don’t have the time to actually follow up on my own idea with the tidal gauges, maybe later)
Thanks for the post. Can you more fully explain, in simple terms, “detrending?”
Certainly. “Detrending” means removing a trend from the record. Suppose there were actually no change in the sea level … but the ground was slowly sinking. The measured sea level would show a trend over time, with the sea level rising with respect to the land. The trend might be something like two millimetres per year.
What I’ve done is calculated the underlying trend, and subtracted the trend from the data. In the case of the tides, this should remove any effect of vertical land movement and let me investigate the multidecadal trends.
w.
Stuinflag. Think of the trend as the first derivative of the data curve. The CAGW claim is this is accelerating. That the second derivative equivalent. So subtract the first derivative, and if there is acceleration then the residual has to be rising.
Open question to Willis Eschenbach
Willis We all know that you have seen no evidence that the sun causes warming or cooling semi permanent changes on a global scale. Now the sea level rise for modern times is doubtful as well. So what in your opinion causes long term changes in the earths climate? What is the most likely cause to put mankinds research in? The question is an important one because we think that in less than 2 billion years the suns decreasing furnace will freeze our planet. However much before that we will be hit by an ice age which might doom us as well. So given that an ice age will come, when will it happen and why? In other words why does the climate change?
Alan Tomalty
9 minutes ago
No, the look I took can’t say anything about the rate of sea level rise. It is only useful to show the lack of acceleration in the records.
Back in the Roman times, the world was warm. Then during the dark ages it cooled some. Nobody knows why it was warm, or why it cooled.
Then it grew warmer during Medieval Times … at which point it plunged into what is called the Little Ice Age in the 1600s and 1700s. Nobody knows why it was warmer in Medieval times, and nobody has a clue why we got the Little Ice Age.
Then, and once again for reasons that no one understands, instead of plunging into a real Ice Age the climate started warming again. Who knows why? And that warming has continued, in fits and starts, at about half a degree C per centure for the last couple of centuries.
And again … nobody knows why.
Despite that, a bunch of well-intentioned folks have convinced the world’s population that they can tell us what the temperature will be in the year 2100 …
Sigh.
Short answer? Nobody knows why the Earth goes through such warming and cooling times … but boy, there are a lot of folks out there who claim that the science is settled …
w.
Nice work double checking the Douglas paper, Willis. I don’t recall having seen it. But the fact that he gets just the “right” result by selecting a small subset is notable.
The detrending is a bit unnecessary in this presentation since it will only shift the graphs up or down by subtracting a constant rate from each dataset.
oops , failed to put a slash on the closing blockquote ;(
Yes, this is one of Willis’s best pieces. Finding the problem with Trois-Rivieres was a beautiful piece of detective work. It certainly shows the perils of data selection, and of how just one data series can massively change the end result. And it pretty well destroys the Douglas paper.
I don’t agree with Willis on everything, but I’m sure he is right when he says there is absolutely no evidence of any recent sea level acceleration.
Chris
Trois-Rivieres looks like someone made a transcription error writing mm changes as being cm changes.
Another extremely relevant and well written piece by Willis. Many of the comments are also enlightening. I am a simple person (although a retired engineering hydrologist) and prefer to look for changes in trends at individual stations rather than analyzing the average of a number of stations. I have plotted up annual mean sea levels at 51 long-term locations worldwide and still cannot see any evidence of increasing sea levels in recent decades. https://briangunterblog.wordpress.com/category/sea-level/
Happy New Year to you all. Now only just over three hours left in 2017 here in eastern Australia!
Brian
I looked at your work and found it most interesting. Amazing that the Scandinavian results show a downtrend.
Are we sure that this is due to the land moving upwards? That is quite a volume at that negative rate….
One would have to account for the movement of land as otherwise this whole exercise is fruitless.
Is the arctic ice melt even discernible in the data?
Willis,
could you tell me where you got the figures for the movement of land [at the gauge]
I’ve wondered what happens to tide gauges when waves get bigger or smaller. Then I wonder what would happen if I dumped an oil spill next to a gauge on a windy day. Would it work normally? Dunno.
Like the garden, but as an ex climbing plant nurseryman I think it needs more climbers….
JF
Be grateful that the patio didn’t involve this: wordpress.mrreid.org/2011/02/26/penrose-tiling/
Julian — older tidal gauges generally use a float in a settling tube. The settling tube is sized to filter out waves and ripples, but not tides and other longer term variations. Since all Willis’ sites have many decades of use, they probably use one of the variants of settling tubes. More modern gauges often use radar or sonar to detect the water surface then average the reported heights electronically. (CAVEAT- I’ve never actually seen a tide gauge, just pictures).
Thanks — I’ve wondered if a polluted sea surface would change the way the old gauges react to waves. I’m suffering from the ‘if all you have is a hammer, everything looks like a nail’ syndrome.
JF
Don, somebody did a post on some of the problems with Tide gauges, but I can’t remember who or what Forum.
It may even be on here.
It was a 3 part post by Kip Hansen on here.
https://wattsupwiththat.com/2017/09/13/sea-level-rise-and-fall-part-1/
https://wattsupwiththat.com/2017/10/07/sea-level-rise-and-fall-part-2-tide-gauges/
https://wattsupwiththat.com/2017/12/19/sea-level-rise-and-fall-part-3-computational-hubris/
Great piece of work Willis. Would that Mann, Briffa, et al had the good sense to identify the data set that triggered their $%^# hockey-stick then do a bit of thinking.. (Not that being better at science than Michel Mann seems all that difficult). I’d been thinking about doing pretty much the same thing you did and had actually gone so far as to look at a few sites. I was pretty sure there is no meaningful acceleration in sea level in the past few decades. Now I’m even more convinced. The data is so noisy that I suppose a small acceleration — 0.002 mm/yr/yr or so — COULD be hidden in there.
A couple of points.
1. Because of the way the world is laid out, a lot of tide gauges are close to subduction zones. One of the characteristics of subduction zones is that every few centuries they adjust the elevation of the surface on both sides by a meter or two accompanied by a magnitude 9 or so earthquake. I would have thought that filtering for “step changes” would be necessary. Apparently not.
2. I wouldn’t have thought that a large sample size was necessary. It’s a little disconcerting that a single site can trash the results of a computation that looked on the surface to be pretty robust. How many other “straightforward” computations elsewhere are being controlled by one or two data sets that need to be defanged?
3. Any chance the mild acceleration in the Douglas data is an artifact of the Glacial Isostasy Adjustment that you didn’t make? Offhand I can’t see how. But the widespread use of GIA without any acknowledgment that might not be all that accurate is kind of annoying.
———————————-
The patio looks absolutely terrific. Would that I had the ability to visualize things like that then actualize them. Although my back hurts at the very thought of tackling anything like your project. What do you plan to do about the plants growing in the cracks? I’ve been pulling them out or our patio by hand because my usual herbicide — vinegar (biodegradable, minimal harm to the local wildlife) — probably would degrade the stonework over time. But our patio is nowhere near the size of yours.
Glacial isostasy isn’t a problem over such a short interval – it is linear. The exception being sites really close to an extant icecap where rapid elastic responses to glacial load occurs, e. g. Greenland where medieval norse settlements are now underwater due to icecap growth during the LIA.
Once more I will display favorite example of the constancy of glacial isostasy and the absence of “acceleration”. The tidal gauge at Kungsholmfort in southern Sweden, on solid rock of the exceptionally tectonically stable Precambrian Baltic shield. It was established in 1886 and by pure coincidence at a point where glacial isostatic rise (1,5 mm/year) was exactly equal to absolute sea-level rise (1,5 mm/year). 130 years later they are still equal, average sea level in 2016 was one millimeter lower than in 1886:
http://www.psmsl.org/data/obtaining/rlr.monthly.plots/70_high.png
Footnote 1: There are no tides in the Baltic, so it feels a bit odd calling it a tidal gauge.
Fottnote 2: Because of the self-gravity effect changes of the Greenland icecap has practically no effect in Scandinavia, so there could be some acceleration, provided it is exclusively due to melting of the Greenland icecap.
GIA corrections may be dead on for some places. My problem with GIA is that folks blithely make GIA corrections for place thousands of kilometers from the nearest depths of the previous ice age permanent ice. Lagos, Nigeria -0.13mm/year, Jakarta -0.38. http://www.psmsl.org/train_and_info/geo_signals/gia/peltier/drsl250.PSMSL.ICE5Gv1.3_VM2_L90_2012b.txt
Is a GIA correction for those places needed? Could be. Do we know what the appropriate correction should be? To two decimal places? Seems to me more than a bit dubious.
“Is a GIA correction for those places needed?”
No, but “the forebulge” goes quite some way outside the former icecaps. Lagos and Jakarta, no. Bermuda and the Mediterranean, yes.
That is a beautiful timeseries tty – trusting your explanation of it. Thanks for posting it again as it’s the first time I’ve seen it. Sometimes if you want to test a theory, it makes sense to seek out the very best way you could prove or disprove it. Is that cherry-picking? Probably so when the answer you get from doing it doesn’t fit with your preconceived agenda.
Willis,
Personally, I think the exercise might be more interesting when presented as a lesson in selection of data for further analysis, than as an example of sea level change. That selection lesson has a wide candidate audience in the climate field for topics away from sea level change as well, but that is incidental to the important message of pre-testing different sets of potential input data before one does a larger analysis. By stitching it to sea levels, you have complications from unknown amounts of change in storage reservoirs on land, movement of ocean basin bottoms and so on. But this is only a personal view.
BTW, better to write ‘acceleration of sea level rise with time’ than ‘acceleration in the rate of sea level rise’. Clarifies the differentials. Geoff.
Interesting article from Nature which discusses sea level rise from a satellite perspective.
“Nerem’s team calculated that the rate of sea-level rise increased from around 1.8 millimetres per year in 1993 to roughly 3.9 millimetres per year today as a result of global warming. In addition to the satellite calibration error, his analysis also takes into account other factors that have influenced sea-level rise in the last several decades, such as the eruption of Mount Pinatubo in the Philippines in 1991 and the recent El Niño weather pattern”
https://www.nature.com/news/satellite-snafu-masked-true-sea-level-rise-for-decades-1.22312
Well, yes that’s a problem. The satellites seem to be looking at a different planet than the tidal gauges are. But keep in mind that the “GPS corrected” tidal gauges should be operating in the same reference framework as the satellites. Seems to me you have a few choices.
1. The open ocean sea levels are rising much faster than coastal station sea levels and are accelerating.whereas coastal station sea levels aren’t accelerating
2. There is some sort of problem with GPS that no one is aware of.
3. There’s some sort of problem with processing of satellite Radar Altimeter data.that no one is aware of.
4. Something else
Pick one or more. To me, only 3 and 4 seem remotely plausible.
Don, they were adjusted.
The earlier European Satellite showed Falling sea levels and was quickly discarded, the GIA was added to the Satellite data and we soon have that naughty fall turned in to a rise.
But even NASA admit to no rise in the last 3 years.
https://sealevel.nasa.gov/
Don, they were adjusted.
The earlier European Satellite showed Falling sea levels and was quickly discarded, the GIA was added to the Satellite data and we soon have that naughty fall turned in to a rise.
But even NASA admit to no rise in the last 2 years.
https://sealevel.nasa.gov/
Click on the 3.4mm Sea Level Rise to see graph
5. There’s some sort of problem with the processing of satellite Radar Altimeter data that some people are perfectly aware of.
Here is an interesting paper on CryoSat 2 and measurement of sea-ice thickness:
https://www.researchgate.net/publication/320929563_Estimating_Arctic_sea_ice_thickness_and_volume_using_CryoSat-2_radar_altimeter_data
Check Figure 8 “Mean Sea Level Anomaly” and compare with the claimed precision for sea-level measurements. Some rather considerable difference eh? Note that the scale is in meters, not millimeters. But then there is no political need to measure ice thickness in terms of tenths of millimeters.
ACO – “Don, they were adjusted.”
Indeed they are, but the (bizarre) CU adjustment for GIA is only about 12% – .roughly 0.33 mm per year. Even if one unadjusts it, the resulting (probably) eustatic sea level seems too high compared to tide gauges.
Yes ERS had lower numbers. There is, or used to be, a reassessment of the ERS missions on the internet somewhere. I’ve lost track of it. It came up with a sea level rise of — as I recall — 2.0 mm/yr with a fairly large uncertainty of +- 2.0mm/yr primarily from uncertainty about ionospheric delay. Later satellites use multifrequency RAs that SHOULD have substantially less ionospheric delay uncertainty.
tty — thanks. I found the paper, but my browser is finding it to be somewhat indigestable. Looks interesting, I’ll look at it later, in a different browser if necessary.
I hate to get all nitpicky, but GPS corrections to tide gauges ignore the local gravity.
You need to correct gauges to some hypothetical local isopotential surface, not the distance from the center of the earth. For example, if your entire continent moves upwards 10 mm, the isopotential surface (the level of water in your basin) will shift upwards by some fraction of that, depending on a lot of variables. But if you have a landfill tidegauge that’s sinking, independent of your continent, then the change is actually relative to the local isopotential surface of the average water level.
It may be that this correction turns out to be too small to worry about. I don’t have time to look myself. Have people been looking at this correction? I’ve never seen anyone mention it.
“I hate to get all nitpicky, but GPS corrections to tide gauges ignore the local gravity.”
Only of importance if the gravity field changes, which it does to slowly to matter in nearly all cases. It might be of some slight importance in some very special cases, e. g. if a big new dam is built nearby or if a large glacier changes size quickly or there is a very large volcanic eruption.
However, a 25% localerror in gridded monthly estimates of Arctic sea ice thick-ness derived from CryoSat-2 observations corresponds toan uncertainty of 45 cm for a typical thickness of 1.8 m.This uncertainty is consistent with the spread of differencesrelative to independent estimates acquired from airborneand ocean-based platforms, of 34–66 cm (Section 6.2).6. Results and discussion6.1. Arctic sea ice thickness resultsUsing Baseline-C CryoSat-2 data, we are able to producemonthly sea ice thickness estimates for seven complete sea-sons of sea ice growth (October–April) from 2010–2017,except for one month in October 2010. The thickness dataare output on to a 5 km square Polar Stereographic grid(Section 5.1). We do not run the sea ice processor in themonths of May–September as melt ponds make it difficultto discriminate between radar returns from leads and fromsea ice floes (Section 4.2). Sea ice thickness maps for autumn(October/November) 2016 (Fig. 14a) and spring (March/April) 2017 (Fig. 14b) show that the thickest ice is concen-trated around the coast north of Greenland and EllesmereIsland, and extends into the central Arctic as the growthseason progresses. Over the CryoSat-2 period, the averageautumn sea ice thickness in the Northern Hemisphere was1.28 ± 0.13 m, increasing to 1.94 ± 0.09 m in spring.6.2. Evaluation of Arctic sea ice thicknessTo evaluate the accuracy of our CryoSat-2 sea ice thick-ness estimates, we have previously compared our Baseline-B results to independent estimates of sea ice thickness anddraft acquired from airborne and ocean-based platforms.We used 772,090 estimates of sea ice thicknesses derivedfrom NASA Operation IceBridge (OIB) airborne radarand laser altimeter measurements (Kurtz et al., 2013), 430estimates of sea ice plus snow thickness derived by Haaset al. from ESA CryoSat-2 Validation Experiment (Cryo-VEx) airborne laser altimeter and electromagnetic (EM)sounding measurements (Haas et al., 2009), and 80 millionestimates of sea ice draft derived from upward lookingsonar (ULS) measurements as part of the Beaufort GyreExploration Program (BGEP) based at the Woods HoleOceanographic Institution (http://www.whoi.edu/beau-fortgyre). The OIB measurements were collected over theperiod 2011–2013 (L4 IDCSI4 product) and 2014 (quick-look product), the CryoVEx data over 2010–2012, andthe BGEP data over 2010–2013. Both the OIB and Cryo-VEx measurements were only collected during spring butthey survey a variety of sea ice thickness and type(Fig. 15a and b, respectively), and the OIB data cover a sig-nificant fraction of the western Arctic. The BGEP observa-tions are available year round, but sample a restricteddistribution of ice as the moorings are fixed (Fig. 15c). LikeCryoSat-2 estimates of sea ice thickness, the OIB and Cryo-VEx estimates of sea ice thickness and sea ice plus snowthickness, respectively, are derived products. It is necessary16 R.L. Tilling et al. / Advances in Space Research xxx (2017) xxx–xxxPlease cite this article in press as: Tilling, R.L., et al. Estimating Ar
Estimating Arctic sea ice thickness and volume using CryoSat-2 radar altimeter data (PDF Download Available). Available from: https://www.researchgate.net/publication/320929563_Estimating_Arctic_sea_ice_thickness_and_volume_using_CryoSat-2_radar_altimeter_data [accessed Dec 31 2017].
After reading the above paragraph I have no confidence in any satellite measure of ice thickness measurements.
Given that the inner core responds to the transiting moon to cause the daily land tide, which in turn causes the sea tide, one would expect to see 1. and 2. answered.
Why wouldn’t satellites too, which operate within our geo-sphere? In other words, when everything is in motion due to lunar influence, what is measuring what? There is measuring, and there is just describing from another angle. GPS comes under lunar influence too.
Love the patio, we ‘inherited’ one with a selection of plants already in it. Thyme was the most frequent, but also Erigeron which looks like a small daisy and flowers all summer, as does a dwarf catmint which needs a Chelsea Chop in midsummer. The one problem is a purple leafed oxalis which is very invasive and needs more serious discouragement.
Willis,
just wondering about,;
Tides
1,500,000 earthquakes every year ( a million + under water )
Tsunamis
Cyclonic storms
Tornado’s
Volcanoes
Temperature (Ice ? )
El nino
etc.,
and as the earth is covered by 2/3 water ( you can fly direct from London to Auckland,) 24 hour flight time and not pass over land and the talk about mm ?
What route would that be ?
Polar-Bering-Pacific-NZ
Smashing all the data together is one way of looking at the question, and this is as good a job as could be using that approach. Another approach is to look at just one high-quality record, where there is GPS to control the land subsidence variable (GIA).
My pick is Newlyn in SW UK (Cornwall). Where there has been a benchmark established at the tide gauge (purpose built granite station on granite bedrock) since 1915 and GPS since 20 years has shown the land is sinking at 0.7 +/- 0.2 mm/year (as well as moving away from America at about 20 mm/year). The tide gauge shows a linear rising sea level trend for 100 years of 1.8 +/-0.1 mm/year. Therefore sea level at Newlyn is rising at roughly 1.1 +/-0.3mm/year, at least for the last 20 years. Not really much to worry about.
http://www.tandfonline.com/doi/pdf/10.1080/01490419.2015.1121175
I would be interested if anyone knows a database of which tidal reference stations have co-located GPS to measure accurately the GIA.
Essentially all stations in Sweden have co-located GPS. The GIA is known to a high degree of accuracy:
https://www.lantmateriet.se/globalassets/kartor-och-geografisk-information/gps-och-matning/referenssystem/landhojning/presentation-av-nkg2016lu.pdf
“I would be interested if anyone knows a database of which tidal reference stations have co-located GPS to measure accurately the GIA.”
Check Rud Istvan’s (ristvan) post upthread. http://www.sonel.org is probably what you are looking for. (CAREFUL. that’s .org, not .com)
And keep in mind that “GIA” is computed from models of motion of mantel and core material of the Earth. At any given site, there can be “local” causes of subsidence or uplift that GIA doesn’t know about.
well, from my point of view…the question is what asumptions do you have to make to think you are able to get the global sea level from a set of tidal gauges??????
Just like loking at tree rings and assume it can measure ” temperatures”…
the numbers of conservatives hypothesis is huge…really huge… so huge that the only good answer is , at my opinion ,tides gauges can mesaure sea levl because i have got another way to measure sea level that gives a similar result.
The only “assumption” I need is that Tidal Gauges are where we live and how we will be affected.
sure tidal gauges are a very useful tool to measure local relative sea levels …
what about gloabl sea level? why do we accept so easily that tidal gauge simply can measure gloabl sea level..
Interesting article, thanks Willis.
Vertical measurement using GPS I have noticed in the past to be wildly inaccurate.
With my first GPS unit (Garmin 12) it would give wild reading like 100m altitude on a flat sea position at times.
On my newer boat mounted GPS I don’t find it displayed at all.
http://xcmag.com/news/gps-versus-barometric-altitude-the-definitive-answer/
You’re correct. The “vertical” (radial) component of GPS positions is, on average, substantially less accurate than the “horizontal” component. And without correction, even the horizontal component can easily be of by 16 meters (50 feet). The reasons for this are (probably) pretty well known. Basically, most individual GPS measurements are made against satellites low on the horizon and therefore don’t provide a lot of elevation information. However the experts in this stuff think that using differential GPS (broadcasts of recommended corrections from stations that constantly compare GPS derived positions with known positions) and observing over a long time span can measure even “vertical” position with high precision.
Great job about sea level acceleration and terassing.
Being a Swede I would ask about the banjo “Playing the Swedish banjo”
-but I could guess- and feels like it is not valid for all Swedes any more.
Mr Eschenbach, there is also the other affect not mentioned here which is created not by Tides but by winds.
There has been demonstrated a sort of “Slosh” affect where Sea Level is higher on one side of the “basin” than it is on the other due to prevailing winds..
https://www.ncas.ac.uk/en/climate-science-highlights/585-will-the-wind-impact-future-sea-level-change
http://www.nature.com/news/changing-winds-dampen-antarctic-sea-level-rise-1.14189
http://onlinelibrary.wiley.com/doi/10.1029/2010JC006492/abstract
Willis, did something happen to your spreadsheet when you saved it as a CSV file? This is what the file I got from your dropbox looks like:
	HELIGMAN	KOBBAKLINTAR	LEMSTROM	FOGLO / DEGERBY	PAGO PAGO

1807	NA	NA	NA	NA	NA

1807.083333	NA	NA	NA	NA	NA

1807.166667	NA	NA	NA	NA	NA

1807.25	NA	NA	NA	NA	NA

1807.333333	NA	NA	NA	NA	NA

1807.416667	NA	NA	NA	NA	NA
Where there is something besides “NA” in the cell, it looks like this:
	HELIGMAN	KOBBAKLINTAR	LEMSTROM	FOGLO / DEGERBY	PAGO PAGO

1886	NA	NA	NA	NA	NA

1886.083333	NA	NA	NA	NA	NA

1886.166667	NA	NA	NA	NA	NA

1886.25	NA	NA	NA	NA	NA

1886.333333	NA	7085	NA	NA	NA

1886.416667	NA	7163	NA	NA	NA
Should I format the cells somehow?
The file seems fine to me. Did you check “comma” as the way to line everything up? Once you get it, you can use Find and Replace to replace all the “NA”‘s with blanks. It took a bit of time but about 3 million or so replacements were made.
Thanks, Willis, for a very informative analysis, with interesting results.
Your patio looks great!, BTW.
A good example of the results of isostatic rebound is in the northern Ohio River Valley, from New Martinsville, WV, up to there the Ohio River turns south and forms the boundary of Ohio and West Virginia. This was shot from Grandview Park in Moundsville, WV, looking west over to the Rt. 7 road cut in Ohio. The bluffs are about 600′ above river level, and you can see that from the top of the bluffs, you’re looking across the ancient peneplain of the central Appalachian Plateau.
Don’t know what happened to my image. I’ll try just the straight URL instead of using the img tag.
http://s497.photobucket.com/user/jaschrumpf/media/ohio_valley_plain_isostatic_rebound.jpg.html
Didn’t notice the “html” stuck on the end there. One more try, from my own web site:

Very interesting article, Willis. I wish every single paper that made some ginormous conclusion based on a tiny statistical fluctuation that was published without a similar discussion of how the data might be confounding the question, were rejected flatly as being unfit-for-purpose. In climate science, Of course, Michael Mann and Bill Nye would not be happy about that.
If we presume that your graph represents the actual amount of water stored in all the ocean basins, there is a noticeable drop from about 1815 to 1850. Besides temperature, what other processes might help explain this drop? A few ideas:
– As the world warmed from the depths of the Little Ice Age (LIA), water levels SHOULD be rising as Greenland, Antarctic and alpine glaciers melt. But maybe with just a little extra warmth around the edges of Greenland and Antarctica this instead creates the opposite effect by increasing the amount of deposition on the two big ice sheets, removing water from the oceans for an extended period. I think it’s fairly clear that the ice levels of alpine glaciers is not part of this phenomenon, based on historical records.
– Human beings are busily populating all areas of the globe, building dams and reservoirs that hold water directly, and which funnel a certain amount of irrigation water onto fields, where the extra surface area of those fields and canals leads to a sort of humidity loop due to the extra evaporation from irrigated fields, which quasi-permanently removes that irrigation water from the oceans.
–
were rejected flatly as being unfit-for-purpose.
≠===========
strongly agree. make it a scientific standard. unless multiple methods agree, the mathematical result may well be spurious (false) by chance or subconscious bias.
this should be part of the discussion in every scientific paper. the experimental controls employed to prevent a false positive.
The drop 1815-1850 is not at all surprising. Glaciers everywhere expanded until 1850, then started retreating.
excellent work Willis. something that should be a scientific standard in all studies that rely on statistics or numerical methods. sensitivity analysis of the results.
what Willis has done is not simply show the acceleration in sea levels. what he has shown is how sensitive the result is to the method chosen.
all too often what passes for science are nothing more than “purple jelly beans cause cancer” type studies all dressed up in a wig and lipstick to hide what we are looking at is a pig.
I for one would very much like to see sensitivity analysis such as Willis has presented adopted as a formal requirement in scientific studies.
We have a HUGE problem in science with false positives. in large part because we have come to rely on peer review in place of replication to validate the science.
but peer review is no substitute for replication because it replaces observation with opinion.
by making sensitivity analysis a standard we are placing the onus on the author to provide some indication of how likely the results are to survive replication.
‘The main problem with these tide stations is that they measure the height of the sea surface versus the height of some object attached to the land … but the land isn’t sitting still. In most places around the planet the land surface is actually rising or falling’
Not the main problem. 70% of the earth is covered in ocean. The majority. We recognize ‘In most places around the planet the land surface is actually rising or falling,’ but we ignore it for the 70%.
No acceleration in SLR, via Dr. Roy Spencer:
http://www.drroyspencer.com/2017/08/an-inconvenient-deception-how-al-gore-distorts-climate-science-and-energy-policy/
Possibly Trois-Rivieres has been mentioned already. Throw it out. Its fresh water half way up the St Lawrence River. Its affected by seasons of rains and snows every year that the sea is not. It would be like a tide gage on the Mississippi at St Louis.
Good job (as usual), Willis. An interesting change that is evident in your data is an obvious change about 1850. I’ve seen this in other datasets too. Something profound happened to sea level about 1850 and thereafter. What caused this change? It happened near the beginning1850-1880 warm period, but we’ve been thru several periods of warming and cooling since then with not much change.
I wondered about that also Don. I suspect what happened is that the sea started to warm from LIA temperatures and the very uppermost layers started to expand. Over time, the warmth has worked downward? But I have neither data nor calculations to support that guess.
A useful summary of how geophysical signals are taken into account when using tide gauge data
http://www.psmsl.org/train_and_info/geo_signals/
Thank you for the hard work thank you for the hard work. It appears using stations can only afford local result. Other tools will need to be invented and
investigated. What about W. I. S. E. Data?
Help!
My problem is more basic. Somehow I’ve never been able to grasp how we derive millimeter estimates of sea level heights. Much less the second or third derivative of height. It appears our best guess is derived from using GPS to tie everything together.
Satellites fly in an equipotential gravity field independent of where we think the surface of the sea is so they represent a reasonably stable reference from which we might derive a sea level estimate… if we know where we are in relation to the GPS satellite. We use Kalman filtering to estimate the positions of the GPS satellites relative to land tracking stations that are subject to isostatic adjustment. We model the geoid in reference to the ITRF which itself has uncertainty, we use an ellipsoid model in conjunction with a geoid model. We derive a sea level height in relation to the GPS satellite constellation by measuring the distance to a constantly changing sea surface subject to tides, long period waves, and barometric pressure effects with a satellite radar altimeter which does not have the ability to measure millimeter accuracy. Then we define sea level using the ellipsoid and geoid models that differ in elevation by almost 200 mtrs around the globe.
I’d be more concerned about a few millimeters here and there if I understood how we manage to derive such high confidence accuracy and precision from what appears to be such a relatively coarse measurement process.
Bean Barrett
an hour ago
Bean, precision has to do with repeated estimates. If you measure the sea level every ten minutes or so for a year, say, and you average the measurements, you will know the average sea height to a very good precision.
As to the measurements, they are typically done in a “stilling well”. This is a vertical pipe connected to the ocean by a small hole, so it is not affected by the waves. These days the height of the water in the stilling well is measured acoustically.
Not sure if this answers your question, but it’s what we’ve got …
w.
Bean. I don’t think it works quite like you suggest, but your question is still a good one. As I understand it, the satellite position is obtained from DORIS which is a French system that works sort of like an inverse GPS. Signals come from fixed ground stations. The satellite uses the time delays and the signal doppler shift to compute its position.and velocity. Since, unlike GPS satellites, the ground stations don’t move, the position uncertainty is lower than with GPS. But there are still ionospheric and tropospheric delay uncertainties?
I don’t think “they” worry (much) about mapping, the geoid, et al. Except maybe to correct for tides and barometric pressure. But you probably don’t need high precision positions for those corrections.
I believe the RAs operate at a high pulse repetition frequency — maybe 3KHz? Given a 1km radar footprint, I can believe that they manage to pretty much cancel out wave height variations. But they still have ionospheric delays. They have multifrequency capability and some capability to compute delays from the time difference between the signals at different frequencies. Sounds good, but I don’t know the details.
Finally there’s the problem even without waves, the surface of the sea is anything but flat and the bumpiness is a function of longitude as well as of latitude. That probably means that you can’t simply average the latest measurement with the measurement made 100 seconds ago with the one made 200 seconds ago. You very likely can only compare measurements with those made at the same location in previous cycles. A cycle is ten days.
There may well be a good detailed description somewhere of how they do things. I haven’t seen it.
So, I like you, would like to know exactly how “they” come up with sub mm precision.
I’m new to posting here, so please forgive my ignorance. This is very interesting, but I have a couple of questions:
1. Am I correct that you “detrended” each station independently?
2. What is the difference between Douglas’ “adjust for PGR” and your “detrend?”
3. Could you show a “detrended+s.d. adjusted” view of the 24 Douglas stations using your methodology?
4. Could you show a graph of your 61 stations in all four states? (Raw, s.d. adjusted, detrended, detrended and s.d. adjusted?) This would help me understand the effects of each process…
5. Did you look for correlation in the “trends” of geographically adjacent stations? Does this support your method of “detrending” PGR?
TIA
Thanks, Mike. Ignorance is never a problem on my planet, because on my planet, the only stupid question is the one you don’t ask …
1. I detrended each station independently
2. I removed the trend from any source. Douglas removed (in theory) the trend from PGR.
3,4. I could, but … time. As in, so many analyses, so little time. IF I get around to it, I’ll certainly post up my results … it’s what I do.
5. No … but we know the GPS-measured movements are correlated over wide areas, viz:
Best New Years wishes, keep asking questions …
w.
I’m more interested in what the tide gages measure – the sea level relative to where I live – on the land.
A timely and interesting post – thanks.
Timely because last night on a BBC program I heard this
“Sea levels have risen 20cm in the last century and may rise 100cm in this century”
Leaving aside the usual caveats – it was jus the nonsensical argument that the levels might go up 5 Times the amount of the 20thC. And we are already 18% through this one!!!
Makes no kind of sense to me – before even looking at the maths !!!
And talking of sea level change…
Whatever happened to that project which looked at old masters paintings (of coastal areas) and comparing these to currrent day photographs?
Basic tide change: Let’s assume that the major force affecting tides is the combined gravitational force of the sun, earth and moon. These forces are in constant motion at each tidal gauge as the earth rotates, orbits the sun, and as the moon obits earth. The relative position of these bodies has to affect tide levels at any given time ; hourly, daily, monthly et cet. How are these factors calculated when comparing different tide level locations and measurements?
Good question, Joseph. Generally, what we do is use long-term tide measurements, fifty years or more. These are long enough that the tidal forces you mention above average out, leaving us with just the inherent rise or fall of the ocean.
w.
It’s even more complicated than you think. Tides are heavily affected by coastal topology. Wikipedia has a lengthy and, so far as I know, correct, article on tides https://en.wikipedia.org/wiki/Tide
I’d like to make an observation. Temperature readings used to be tied in to agriculture, and then became part of aeronautics. They were considered a fairly local phenomenon. So, too, were tidal readings, as part of shipping in a local area. None of these readings were meant for anything other than local conditions. Therefore, though both temperatures and tidal readings can be associated with other readings, in different locations, it should be done with great care. Each observer was probably following local protocol, because the reading was meant for the local area.
Of course, there are protocols for normalizing such data, as Mr. Eschenbach demonstrates. However, we should keep that little niggling thought in the back of our minds, that we are trying to stitch together a tapestry of pieces that don’t really fit very well. At some point, if these readings in different locations are going to be compared, there needs to be some consistency of doing the readings.
Willis, a well rehearsed and well written paper – as usual. Thank you.
Willis,great investigating work.Trois-Rivières shows that if anything is to be said about (relative) sea level (trend) all gauges in the proximity of rivers (and certainly three rivers) should be left out as river flooding and droughts will trouble the view on sea level readings, all the more if dams have been build in the observation period or islands created (like in Rotterdam the Netherlands where the Maasvlakte.was created in the sea at the estuary of the Rhine/Maas river system. As to your comment on land level changes: in the Netherlands the sinking level of the land is mainly through compression and dehydration of the (Holocene / organic) soil (may be more than 50 cm per 50 years e.g.in Flevoland).The tectonic rise and fall of the bedrock is only 1-3 cm per century.
Willis,
Like your patio! Many, many years ago I built one, a bit smaller, using soil cement for a base and el cheapo flat 1 inch cement pads. Also swept sand into the cracks…
Never heaved and stayed perfectly flat for many years.
Willis, I have been reading your nautical parables as well as your other mariner adventures for a few years now, as well as your climate research. I have only one explanation for people with your inherent skill-You are are a true Renaissance man, a Michelangelo re-incarnate if you will.
Thanks, cap. Growing up, Michelangelo was indeed one of my heroes, along with Jim Bridger, Thomas Edison, Nikolai Tesla, and George Washington Carver … your kind words are appreciated.
w.
Willis, one observation – if you would have used landscape cloth under the brick the weeds would be obvious. Plus, a diamond blade on an angle grinder would have made much nicer angle cuts.
less obvious
Thanks, Cap. I thought about putting down some kind of geotextile fabric … but then I realized I kinda wanted the plants growing up between. I may regret my choice … time will tell. The angle cuts were made with a brick wet saw. I thought about shaping the corners, but they’re concrete and not brick so they tended to crumble, so I let it go.
w.
“One of the oldest tide gauge benchmarks in the world is at Port Arthur in south-east Tasmania. When combined with historical tide gauge data (found in the London and Australian archives) and recent sea level observations, it shows that relative sea level has risen by 13.5 cm from 1841 to 2000.” [0.85mm/yr average for one and half centuries on ancient land that isn’t moving]
then-
“We have used a combination of historical tide-gauge data and satellite-altimeter data to estimate global averaged sea level change from 1880 to 2014. During this period, global-averaged sea level rose about 23 cm, with an average rate of rise of about 1.6 mm/yr over the 20th Century. The sea level record indicates a statistically significant increase in the rate of rise from 1880 to 2014”
hmmmm….add in all those PGR ones, etc
http://www.cmar.csiro.au/sealevel/sl_hist_few_hundred.html
and maybe we shouldn’t be talking about sea level but sea undulations?
Willis, thanks very much but still in the dark.
Still hard to believe a figure that purports to know sea level within tenths of a millimeter. How does the convoluted measuring system that is utilized somehow account for the uncertainty in the position of the earth’s center of mass, the uncertainty in the orbital position of each GPS satellite, the uncertainty in the elevation of the reference survey point for each tide gauge, the uncertainties in the chosen geoid and ellipsoid models, all ultimately measured with the relatively coarse radio frequency satellite altimeter? It would seem to the statistically uneducated that we have gone several bridges too far in deciding we know the average of all the averages and that the error budget is on the order of a few tenths of a millimeter. Perhaps the precision is high but what about the accuracy? How does a centimetric measuring tool develop millimetric accuracy in at best a reference frame that is shifting at approximately the same magnitude as the claimed sea level rise?
A very very long time ago I was privileged to watch the debate between the physicists and the engineers and mathematicians responsible for putting the GPS system together and the physics vs measurement vs Kalman filter camps that were trying to figure out GPS orbital parameters not only to high precision but to high accuracy. After witnessing camps of opposing PhD’s debate the issue and decide that they could not absolutely determine the satellite ephemeral error budgets and then resort to Kalman filtering to determine orbital ephemeris, I’m not convinced we know “where we are” well enough to measure global sea level to the present quoted precision, much less, accuracy.
Thanks for your articles. Very thought provoking and thanks for the answer.
Some goodpoints, Bean.
If we use do not use a “monument” to relate all our measurements, then we are quibbling. So we pick a point ( monument) and then compare/compute WRT the starting value of thatc “monument”.
So my analogy is like the 30 year sequence that the climate folks use for the baseline. I would prefer absolute vales from a “monument” we picked from long ago, and I can determne trends and such using the absolute numbers or any length of years or centuries or…
Our small outfit worked with GPS for weapon guidance and surveys. We could easily detect millimeter changes by using the carrier wave frequencies, so just figure we could resoulve a degree or two of phase of a 19 centimeter wavelength.
The biggie is to agree on a “monument” and use all the data from all the sensors using the “monument”.
Gums…
Great effort. Simple sailor’s question. Why do you use intervals of a calendar month instead of a lunar month so that each ‘monthly’ record contains just two cycles of spring-neap tides? Tides are complicated beasts. The pattern of tidal fall and rise will significantly affect the variation between monthly records. Should you perform your analysis based on stations with similar tidal patterns, or otherwise adjust individual stations?
In the particular case of Trois-Rivieres a glance at a map should tell you why it is anomalous. It is several hundred miles up the St Lawrence river at the top of a tidal funnel and at the junction of three river systems, one of which is the outflow from the Great Lakes to the ocean. http://www.psmsl.org/data/obtaining/stations/126.php
Tide gauges are in place for practical reasons like flood control and the business of navigation. I would think of more relevance to climate change are the volume and mass of the world’s oceans and whether they is increasing or decreasing on account of melting of ice on land, drainage of land or changes in density of sea-water. Are there any such studies of merit?
I see some comments here suggesting it is the researchers who are “the alarmists.”
“In other words, despite thirty years of alarmists telling us that the seas are going to start rising at some accelerating rate any day now … there is no sign of that predicted acceleration in any of these subsets of the detrended tide station records. Of course, this doesn’t prove anything, you can’t prove a negative. However, it joins all the other evidence out there showing no recent acceleration in sea level rise.”
You are right that you can’t prove a “negative.” Neither can you “prove” a positive. In the sense I think you are using the phrase, it applies to accepting/rejecting hypotheses using statistical tests, not using graphical means to assess data. One could argue that it’s not evidence if it’s not a well-done piece of research. I’m not saying it wasn’t a worthy effort, but it’s no small endeavor to ascertain whether there is an acceleration in the rise of sea level. I personally don’t think graphical analyses are the way to do it, when the acceleration we’re talking about is on the order of 0.1-0.2 mm/year and there’s a lot of noise in the data. It’s also a problem if the subset of tide level gauges are not carefully chosen. In the paper you talk about, Douglas uses five criteria for the choice of gauges (they aren’t “cherry-picked,” as one reader suggested).
“A review of trend models applied to sea level data with reference to the ‘acceleration-deceleration debate'”
http://onlinelibrary.wiley.com/doi/10.1002/2015JC010716/full
This paper lists 30 trend models. And the notice the word “debate” right there in the title. Whatever the “alarmists” say, it’s clear that scientists are not in agreement that it is already happening. Some say it is, some don’t, and it’s largely a matter of what protocol is used to come up with the assessment.
That said, even if it hasn’t happened yet doesn’t mean it won’t happen.
………………………………
Comment by a reader:
“A couple of alarmists come out with a study that claims to show accelerating sea level rise. It gets peer reviewed by several like-minded alarmists who, of course, give it their stamp of approval because it confirms their own assumptions. All of a sudden it is declared as “settled science” and anyone who challenges it is a denier. Thanks for your efforts to bring some balance and actual science to the debate.”
It really bothers me that the scientific community is being castigated by so many people. With some exceptions, it is the media and bloggers and nincompoops like Al Gore who are the alarmists. The vast majority of scientists have lots of integrity and are just doing their jobs, and that includes debating one another. If anyone wants to talk about scientists selling out, they need to include people those who’ve sold out to the fossil fuel industry..
Kristi, first, you say:
Sure I can. I can’t prove, for example, that there are no black swans. But proving that there are black swans is easy.
Next, I agree that often the worst alarmists are the media and the bloggers. However, things are not rosy among the scientists, either. You say:
While that is true in many scientific fields, climate science is rotten at the core. The leadership are alarmists, and will do anything to advance their cause. Not only that, but the “vast majority” of other climate scientists you refer to have done nothing in response to discourage such actions. On the contrary, they have cheered on those committing fraud on the public or just stayed mum … and as a result, such scientific malfeasance is widespread in the field. Here are just a few examples among many.
Peter Gleick committed mail fraud and forgery to advance his alarmist views, and cost his opponents a lot of funding. What happened? He was feted and congratulated.
Kevin Trenberth in a most underhanded move tried to reverse the null hypothesis … for which he paid no price at all. Instead, he gets scientific prizes … sick.
Michael Mann illegally destroyed documents under an FOIA Request, and advised others to do the same. Can you point out any negative blowback that he received for this?
Casper Amman lied and cheated to get the Jesus Paper accepted by the IPCC … no damage to his reputation. No blowback.
Phil Jones lied to my face and admitted evading FOIA requests. He would have been charged, but the Statute of Limitations had run out. Nothing happened, he’s still a luminary in the field … a proven liar of a luminary, but clearly, that makes no difference to your vast majority of climate scientists.
I could go on, but I’m sure you get the point. You are right about scientists in general, but you are very, very wrong about climate scientists. There are far, far too many climate scientists who are unwavering activists, victims of noble cause corruption, and outright fraudsters. And sadly, far too many of them are respected, honored, feted leaders in the climate science field … and as they say about such corruption, “A fish rots from the head down.” …
Finally, you say:
You really need to spend more time reading about the off-the-record actions of the many crooks and low-lifes that pass themselves off as “climate scientists”. The idea that just because someone used five criteria to select their subset, the idea that said subset therefore couldn’t be cherry-picked, speaks very well of your heart and says volumes about your own honesty …
… but it speaks very poorly of your ability to judge the actions of deliberate fraudsters. Me, I’ve been lied to by professionals, who were both professional climate scientists and professional liars … so to me, the claim that it was just pure chance that a tiny subset of all the tidal station records, a mere 1.5% of the total, contains a clear signal of acceleration? That claim doesn’t even begin to pass the laugh test.
Do I think it was “cherry picked”? I suspect he looked at a number of subsets, using a variety of criteria, and stopped when he found one that agreed with his preconceptions about acceleration. I would describe that as “confirmation bias” rather than “cherry picking” … but either way I don’t see his results as showing much about the question of acceleration.
Thanks for your comment, I appreciate your honesty and willingness to participate.
Best regards,
w.
Hi Willis, just happened upon your comment where you say:
“…..The leadership are alarmists, and will do anything to advance their cause.”
===================
Is this fact or opinion, does it include everyone, and can you back it up ?
The only reason I ask, is because I wouldn’t want to be painted with that paintbrush.
Thanks, u.k. This is fact, and of course it doesn’t include everyone. However, it is true of far too much of the leadership. James “Death Train” Hansen, doyen of the movement, was quite willing to get arrested to advance his cause—illegality meant nothing to him. And fish rot from the head down.
As to “can I back it up”, perhaps you should have read the rest of the comment you quoted. I went on to identify a number of specific individuals and their misdeeds. Not sure what more you might want, but I can assure you that’s by no means a comprehensive list …
Regards,
w.
Mr Wlilis, I regard your choice of topics and how well they are written about as a major factor in enhancing the intellectual quality of my life. Thank you for how well you do what you do.
Tom Bakewell
Tom, thanks for your kind words. It is responses like yours that encourage me to continue with my curious analyses and rewarding peregrinations through interesting lands …
w.
Nice, but how long do you suppose it will be before you’re just mowing the lawn? Well at least there’s always Roundup (“not likely to be carcinogenic to humans”).
Nice work Willis.
Once again, we see that we don’t have nearly enough quality data to draw definitive conclusions about climate change. Once again, I wonder why “climate scientists” are so concerned about tweaking their models and so completely disinterested in dramatically improving the quality and quantity of our basic data collection infrastructure?
Excellent analysis, as always! I just wish the journal editors weren’t so biased against allowing good work like yours from being published, just because they don’t fit the climate alarmism narrative.
Willis–
Thanks again for making the dataset accessible. You may already have noticed this, but the Famagusta site is an outlier, with all values in the 2500 mm range whereas none of the other 1500-odd sites had levels below 5500.
There’s something utterly peculiar about the residuals from regressional trend shown in virtually all of the figures here: they are overwhelmingly negative, almost totally so in the latest decades. Since the trend should minimize the variance of the residuals, that peculiarity suggests some fundamental inconsistency in their computation.
1sky1, thanks for your comment. Several things.
First, you have the data, check it against my results. Waving your hands and saying what things “should” do goes nowhere.
Second, here’s what I said above:
Do try to read and follow the head post, there’s a good fellow.
Third, it’s not at all clear what you are calling the “regressional trend”. Those graphs show the cumulative sums of simple averages of the first differences, along with a six-year Gaussian average shown in yellow … what “residuals” and what “regressional trend” are you talking about?
w.
Only the mathematically inept can baldly dismiss a clear reference to the well-established algebraic properties of residuals obtained by detrending any data series as handwaving. Those with a modicum of competence will recognize that minimization of the variance of residuals necessarily precludes them from being overwhelmingly of any one sign.
Averaged or not, cumulative sums of first differences of the detrended data series simply reconstruct those residuals obtained by subtracting the regressional (as opposed to nonlinear) trend from the original data.
When fundamental algebraic relationship are nowhere recognized as binding, a blind number-crunching exercise ensues with no basic check upon the validity, let alone the scientific value, of the numerical results produced. The notion that only computer results can decide these basic issues is laughable.
1sky1
a day ago
First, please dial back on the insults …
OK, fine … I misunderstood what you were referring to. Now that we have that clear, let’s go to your claim:
If you think I’ve done things wrong, I strongly suggest that you perform the calculations yourself and point out to us where I went wrong. I’ve done the work to provide the data in an easily accessible form. The least you could do is to actually perform the calculations before “suggesting” something is wrong. I may be wrong, been there before … but you “suggesting” that things are “peculiar” goes nowhere.
Regards,
w.
What patently goes nowhere is any hope for comprehension that the peculiarity in question has been noted ANALYTICALLY and is NOT resolved by calculations. It may be as simple a matter as the offset introduced by starting the cumulative sum at zero, instead of at the actual first value of the series. Or it may be that the greatly different time intervals over which the individual detrendings are done produce inconsistently based residuals, resulting in spuriously biased aggregate averages.
In any event, it’s up to the creator of the graphs–not critics–to explain the strange results and justify the absence of any scientific data vetting while claiming that linear detrending removes PGR in records that often look like this: http://www.psmsl.org/data/obtaining/rlr.monthly.plots/118_high.png.
So in other words, 1sky1, you seriously think that you get to stand way back, say my results look “strange”, and I’m supposed to jump to attention and do the research to show that they are not “strange”???
What planet are you living on? I don’t go on a snipe hunt like that for anyone.
I gave you the data in usable form. I’ve done my analysis. If you can SHOW, not claim but SHOW, that my analysis is wrong, I’m more than glad to take a look at where you say the problem is.
But some anonymous random internet popup like yourself, a person without the albodigas to even sign their own name to their own words, saying my results look “strange” to him/her/xir/it? That’s supposed to mean something to me?
Get real!
Sorry, that doesn’t make it “up to the creator of the graphs” to do anything but point and laugh.
w.
To the scientifically adept, the peculiarities that I described indeed mean something . As usual, confronted with technical issues apparently beyond his ken, Willis responds with naked ad hominems and attempts to transfer his responsibility for producing analytically credible results elsewhere. What a pitiful attempt to evade those issues!
[?? .mod]
1sky1
21 hours ago
1sky1, I can only repeat what I said before:
You have the data. If you truly think that “peculiarities that [you] described indeed mean something”, you are free to SHOW us that your intuition is valid. But nooo … you’d rather insult my intelligence and play word games instead of actually demonstrating what you are claiming.
People here see who is doing the work and who is whining about the work … come back when you have some real results of real analyses to report and I’m happy to discuss it. Saying that there are “peculiarities” and that the results look “strange” is just your pathetic attempt to get me to go off looking for snipe … sorry, not gonna happen.
w.
I did more than just SAY that there are “peculiarities” and that the results look “strange;” I SPECIFIED that:
My failure to insert proper initial brackets in “, /blockquote>” unintentionally caused all of the ensuing text to appear in italics.
Willis–
I wondered if the tidal station data was similar to the temperature data, where if I remember correctly about 1/3 of temperature stations are cooling. Since Dr. Douglas set one criterion as at least 60 years of data, I looked only at stations with 720 months total (N=234). There were 55 (20%) showing sea level declining.
Attached on Dropbox are the 234 stations with all data shown and a regression line for each station with the R^2.
https://www.dropbox.com/s/ejbpz3lmbbwtowo/tidal%20station%20regressions%20at%20least%20720%20months.docx?dl=0
This site has lots of graphs, data and information about sea level, including tide gauges, satellite trends, and vertical land movement trends.
University of Hawaii Sea Level Center: UHSLC
https://uhslc.soest.hawaii.edu
We have not heard the last of rising sea level claims.
Also, Judith Curry is planning a series on sea level rise.
Thanks, Totl, I’ll take a look at the site.
w.
Here’s a new one. We already know that tide gauge measurements need to be adjusted for the land rising or falling. Glacial rebound (GIA), plate tectonics, and all. Now we can add to that, the weight of all that sea level rise is making the seabed go down, so sea level rise is worse than we thought! At least according to this article:
Ocean Bottom Deformation Due To Present-Day Mass Redistribution and Its Impact on Sea Level Observations
http://onlinelibrary.wiley.com/doi/10.1002/2017GL075419/full
or
Melting ice is causing the ocean to sink, worrying new study reports
https://www.zmescience.com/science/oceanography/melting-ice-sea-rise-08012018/
For some perspective, according to the internet, Everest is growing 4 mm/year and Nanga Parbat is growing 7 mm/year. Others say Everest is growing 6.1 cm/year.
The top sediment layers at the Grand Canyon used to be below sea level and now they are thousands of feet above sea level.
Great work, as always, Willis.