From the AMERICAN STATISTICAL ASSOCIATION. You have to love the title of the publication “CHANCE”.
Special issue of Chance explores complexities of global climate change models that prove existence of climate change, project future events and impact on mortality, economy
ALEXANDRIA, Va. (Dec. 21, 2017) – Projecting the future of extreme weather events and their impact on human life, the environment and vulnerable ecosystems locally and across the globe remains a complex task in climate research–and one in which statisticians are increasingly playing key roles, particularly through the development of new models. The December issue of CHANCE examines complexities of intense, massive data collection and statistical analysis techniques in climate research and features new proposed statistical methodology that could be a “game changer” in understanding our climate system and in the attribution of extreme climatic events.
Changes in events related to atmospheric circulation, such as storms, cannot be characterized robustly due to their underlying chaotic nature. In contrast, changes in thermodynamic state variables, such as global temperature, can be relatively well characterized.
“Rather than trying to assess the probability of an extreme event occurring, a group of researchers suggest viewing the event as a given and assessing to which degree changes in the thermodynamic state (which we know has been influenced by climate change) altered the severity of the impact of the event,” notes Dorit Hammerling, section leader for statistics and data science at the Institute for Mathematics Applied to Geosciences, National Center for Atmospheric Research.
Climate models are complex numerical models based on physics that amount to hundreds of thousands, if not millions, of lines of computer code to model the Earth’s past, present and future. Statisticians can analyze these climate models along with direct observations to learn about the Earth’s climate.
“This new way of viewing the problem could be a game changer in the attribution of extreme events by providing a framework to quantify the portion of the damage that can be attributed to climate change–even for events that themselves cannot be directly attributed to climate change using traditional methods,” continues Hammerling.
Another promising approach involves combining physics, statistical modeling and computing to derive sound projections for the future of ice sheets. Considering that the Greenland and Antarctic ice sheets span more than 1.7 million and 14 million square kilometers, respectively, while containing 90% of the world’s freshwater ice supply, melting of ice shelves could be catastrophic for low-lying coastal areas.
Murali Haran, a professor in the department of statistics at Penn State University; Won Chang, an assistant professor in the department of mathematical sciences at the University of Cincinnati; Klaus Keller, a professor in the department of geosciences and director of sustainable climate risk management at Penn State University; Rob Nicholas, a research associate at the Earth and Environmental Systems Institute at Penn State University; and David Pollard, a senior scientist at the Earth and Environmental Systems Institute at Penn State University detail how parameters and initial values drive an ice sheet model, whose output describes the behavior of the ice sheet through time. Noise and biases are accounted for in the model that ultimately produces ice sheet data.
“Incorporating all of these uncertainties is daunting, largely because of the computational challenges involved,” and to an extent, “whatever we say about the behavior of ice sheets in the future is necessarily imperfect,” note the authors. “However, through such cutting-edge physics and multiple observation data sets that piece the information together in a principled manner, we have made progress.”
Specific articles in this special issue of CHANCE include the following:
- “The Role of Statistics in Climate Research” by Peter F. Craigmile, professor in the department of statistics at The Ohio State University
- “How We Know the Earth Is Warming” by Peter Guttorp, professor at the Norwegian Computing Center and professor emeritus in the department of statistics at the University of Washington
- “Instruments, Proxies, and Simulations: Exploring the Imperfect Measures of Climate” by Craigmile and Bo Li, associate professor in the department of statistics at the University of Illinois at Urbana-Champaign
- “Climate Model Intercomparison” by Mikyoung Jun, associate professor in the department of statistics at Texas A&M University
- “Climate Change Detection and Attribution: Letting Go of the Null?” by Hammerling
- “Quantifying the Risk of Extreme Events Under Climate Change” by Eric Gilleland, project scientist at the Research Applications Laboratory at the National Center for Atmospheric Research; Richard W. Katz, senior scientist at the Institute for Mathematics Applied to Geosciences at the National Center for Atmospheric Research; and Philippe Naveau, senior scientist at the Laboratoire des Sciences du Climat et de l’Environnement (LSCE) at the Centre National de la Recherche Scientifique
- “Statistics and the Future of the Antarctic Ice Sheet” by Haran, Chang, Keller, Nicholas, and Pollard
- “Ecological Impacts of Climate Change: The Importance of Temporal and Spatial Synchrony” by Christopher K. Wilke, Curators’ Distinguished Professor of Statistics at the University of Missouri
- “Projecting Health Impacts of Climate Change: Embracing an Uncertain Future” by Howard H. Chang, associate professor in the department of biostatistics and bioinformatics at Emory University; Stefanie Ebelt Sarnat, associate professor in the department of environmental health at Emory University; and Yang Liu, associate professor in the department of environmental health at Emory University.
###
“Climate models are complex numerical models based on physics”. Oh dear, they forgot about all the non-physics-based assumptions in the models.
And don’t forget the thousands of ’empirical’ floating point constants baked into the Fortran spaghetti code, few of which are documented or justified.
The suggestion to assume the events as given an then attribute increases in severity to AGW firstly assumes that the researchers know a priori what the strength of the event would have been in the absence of any climate change.
Seeing as this is completely unknowable, any further assertions to the effect on the unknowable is utter speculation. There is no control event from which to measure the difference.
It is really worse than the lack of a control event.
Firstly, they are framing a Bayesian analysis using words. But their word framing belies the circular argument construction of the analysis by what they put in the parentheses. They are assuming as true the very thing they are testing for.
Joel,
Correct. To all the other logical fallacies of the CACA sc@m, add begging the question.
Average enough numbers together, and you can get right down to the last drop of rain. Or so they say.
Wish statistics worked with my bank…
I recently read (here?) that the efficacy of GHG forcings was reduced by 30% in order for model hindcasts to more accurately track actual data and that those reductions were eliminated in forecasts.
Done mainly by changing the aerosol parameterization. Bjorn Stevens published a paper showing CMIP5 aerosol forcings were overstated by a factor >2. Nic Lewis then posted March 2015 at Climate Etc showing that using Stevens rather than AR5, the Lewis and Curry 2014 ECS of 1.65 was further lowered to 1.5.
Thanks, Rud.
I’ll check this tomorrow.
The missing “link” is a common occurrence outside the uncomfortably limited scientific logical domain or frame of reference.
Didn’t Mattel get in trouble for bringing out a Barbie that said “math is hard”?
Yes, so now that Barbie is doing the statistical analysis for climate models. Mattel’s way of apologizing to Barbie.
It’s also important to realize that Barbie gets it right more often than the consensus of ‘scientists’!
(and what does Ken have to say about all this?)…
‘Chance’ as applied to statistical stuff implies “multiple trials” of the exact same thing. You flip a coin a hundred times and the chance is that you will get 50 heads and 50 tails.
So the whole concept is meaningless when related to something (anything) that can only ever happen once; you don’t get multiple shots at it.
The only logical statement that you can make about something that can never happen twice, is that either it happens or it doesn’t, and you have no basis for choosing one over the other.
Statistics is all about trying to do something over and over again and seeing how often you get one result or any of some other results.
But any such computation is BS because you can never do the same experiment over again. You can try; but conditions have changed since you did the first experiment. If they haven’t changed, then of course nothing has happened, so you didn’t even do the experiment.
It should not be a surprise to anyone that the entire physical universe excepting statisticians, is quite unaware of statistics, and pays no heed to any of it.
You cannot compute the average of any data set until you have observed/measured/recorded every member of the set. So it is far to late to observe the average whatever at the time it happened.
OOoops; I almost forgot. The rules of statistical mathematics do not require that the average of any data set, actually be a valid member of that data set.
There is NO guarantee that the average of a set of integer numbers is itself an integer.
What nonsense, that something that is average may never actually occur, because it is not a valid member of the data set that chose it as the average.
Do climate scientists actually believe or even imagine, that one day they are going to trip over some piece of computer code, with all the right knobs to be able to predict some future climate condition ??
I find the whole idea laughable.
G
I think the odds of getting 50 heads and 50 tails from 100 flips is extremely small. The odds of getting a head on one flip is so much better.
“What nonsense, that something that is average may never actually occur, because it is not a valid member of the data set that chose it as the average.”
Reminds me of the line, “The average person has one boob, one ball, and 2 1/2 kids.”
rckkrgrd- the probability of EXACTLY 50 heads in 100 tosses is just about 8%.
It can be approximated by figuring that the standard deviation is the square root of Npq , in this case
the square root of 100 (tosses)* 1/2(heads)* 1/2(tails) = 5. for standard deviation
50 heads is between 49.5 heads and 50.5 heads. 50.5-50 = 0.5/sd of 5 gives 0.1 standard deviations plus or minus.
Go online to check a normal distribution table
+ 0.1 SD gives .53983
– 0.1 SD gives .46017
Subtract . .46017 from .53983 and you get almost 8% chance of between 49.5 and 50.5 heads in 100 tosses, which is the probability of a 50-50 split.
>>
Subtract . .46017 from .53983 and you get almost 8% chance of between 49.5 and 50.5 heads in 100 tosses, which is the probability of a 50-50 split.
<<
That’s an interesting method Alan. I would have to use the brute force method. The probability of getting exactly a 50-50 spit for 100 flips of a coin is (where
  ).
).
The numerator is difficult to calculate, but luckily the MS Windows calculator seems to handle it. The numerator evaluates to about 1.00891×10^29. The denominator is larger and is about 1.2677×10^30. Doing the division gives me 0.079589, which is what you got by a less computationally excessive method.
Jim
At least they used “cutting-edge” physics instead of just plain-old physics! sarc
Can we resurrected Steve McIntire—-he’ll eat this nitwit’s lunch.
Steve is still with us so no resurrection needed, thankfully.
And yes, he would make mincemeat of these fools in no time.
“I do not trust statistics i didn’t forge myself”
paq,
Made my day.
Andrew
@Bad Andrew;
Yes, I agree. Potential thread winner.
‘Statistics’ was invented to make astrology respectable.
Well you have to remember that as far as I am aware, ANY and EVERY statistical algorithm that has been published in any statistics text book, gives perfectly exact outputs for any valid data set to which that algorithm has been applied.
And I believe it is true that this applies to any finite data set of finite real numbers, Each of those numbers is just that; a number with an exact finite real value, so it cannot be applied to variables or functions or complex numbers.
Those algorithms work whether there is any connection between any of the numbers in the set; or not. So they could be simply the real numbers printed in a daily news paper, listed in the order they appear in print.
So the output result is all about the properties of the algorithm, and has no linkage to whatever properties (if any) that any member or subset of members of the set may or may not have.
I’ll leave it to the Origami wizards to prove that the value for the average of any large set of integers (say more than 100 integers) is most likely to not be any number in the set of integers used. Most likely meaning more than 50% of the time. Of course statistics gets a lot more complex than merely averaging numbers; but all of it is still about the manipulations, and not about the numbers themselves, which may even be discarded in favor of choosing the statistical output.
G
“such as global temperature”…..there’s that word again
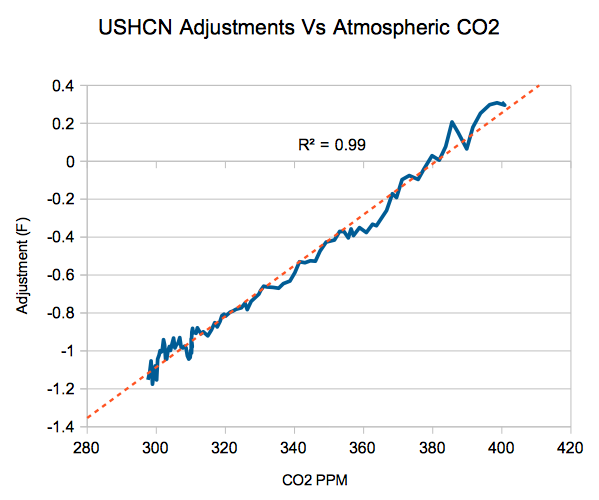
That is a great graph! Kind of shows the adjustments for what they are, fudge factors.
I remember someone saying that this graph shows that the adjustments are correct. 😉
Mosher dug himself a very deep hole with that tweet.
That graph is the gift that keeps on giving…. the smoking gun of rigged temperature adjustments… the turd that WILL NOT FLUSH lol!
Like the joke where this guy is walking through an alley and sees all these snowballs dead centre in the middle of chalk circles.
“Hey”, he says to the kid when he catches up, “you’ll be in the big leagues with that arm. What’s your secret?”
“Well”, shrugs the kid, “I throw the ball then I draw the circle…”
Could someone please try to debunk that graph? As I understand, that is a serious finding even when it is not about the spatial trend in the US. None of the aTTP guys seem to have approached the topic. To me it means the adjustments suck. I’ll keep that opinion until an aTTP shows I’m wrong 🙂
The Tony Heller graph cannot be debunked. It is simply USHCN adjusted final minus raw monthly plotted against delta CO2. All the data is publicly available
Easy to debunk the graph. USHCN covers a limited part of the globe, so it says nothing about AGW.
David,
It’s the best data set for any large part of land on earth.
And USHCN was replaced by nClimDiv in 2014..
Gabro, the CONUS which the USHCN covers represents 1.58% of the surface of the earth. That is not very large. Please keep in mind that the oceans are 70%
“so it says nothing about AGW.” …. but it says everything about USHCN…..don’t it David?
Typically when the correlation is > .95, there is a high probability that there is a causative agent at work. I for the life of me cannot imagine how the atmospheric concentration of CO2 can in any way affect the adjustment. Must be some kind of brand new physics.
Doesn’t say anything about USHCN Lattitude. Says about the same thing this say: http://statfail.com/2010/03/all-time-classic-pirates-vs-global-warming/
ok you got me…I was stupid enough to open that link
“I for the life of me cannot imagine how the atmospheric concentration of CO2 can in any way affect the adjustment”

It doesn’t. But pCO2 increases with time. And so do the adjustments, because a big part is TOBS. It tracks the documented way that volunteer observers shifted their times of observation from evening to morning observation.
But there is a component too which is due to defective calculation of the adjusted – raw by Tony Heller. He subtracts the average of 1218 adjusted stations (fro FILNET) from the average of the stations that reported raw readings, which could be less than 900. A different set of stations. And over the years, a greater fraction of the stations that didn’t report regularly were warm places. So the difference final-raw increased.
so you’re saying they adjusted the measured temps up in the cooler stations…to compensate for warmer stations dropping out?
..and all this time I thought it was the temp change
Nick Stokes, nope. USHCN is still very much alive if not well. NClimDiv replaced Drd964x in 2014 for the state by state reporting. And manufactured warming in most states where previously there had been none. i illustrated California, Michigan, and Maine in essay When Data Isn’t (plus the overall math for Conus) in ebook Blowing Smoke. AGW created soley by a software ‘upgrade’.
Ristvan, please do us all a favor and expand your horizons. Focusing on CONUS (i.e. AGW created soley (sic) by a software ‘upgrade’) make you look like a professional cherry picker. CONUS is only 1.58% of the surface of the Earth.
Lat,
“so you’re saying they adjusted the measured temps up in the cooler stations…to compensate for warmer stations dropping out”
No. I’m talking about the consequences of Tony Heller’s arithmetic. If you subtract the difference between one set of stations, and another different set of varying composition, then the difference will reflect the way the latter changes. No stations need get warmer or cooler, or be adjusted. If warmer stations tend preferentially to drop out, the raw average will decline, and that shows up in TH’s adjustment, reflecting changes not due to adjustment at all. The better way is to compute the adjustment difference based only on the same stations at any time. If 893 stations in one month reported raw readings, subtract their average from that of the adjusted readings for the same 893 stations. Or, more directly. average the differences. But TH doesn’t do that.
Rud,
“USHCN is still very much alive if not well”
See if you can find a USHCN national average published (calculated by NOAA) since 2014.
David Dirkse
December 21, 2017 at 12:33 pm
All the alleged “surface data sets” for the oceans and much of the land area of the planet are pure fiction.
The US (with Alaska and Hawaii) covers about six percent of the land area of the earth, from the tropics to the Arctic. No other real data set is even close in quality and coverage.
Nick,
Percentage of stations is a ratio which hides the fact that the number of reporting stations have fallen dramatically over the decades. Now more model infilling occurs, which always increasingly warms the present.
Gabro: “All the alleged “surface data sets” for the oceans and much of the land area of the planet are pure fiction.”
…
Got a citation for that assertion?
PS the US with 6% of the total land area of the surface of the earth, still is 0.06 * 0.30 = 0.018 …..a very small number…….remember, oceans comprise 70% of the planet’s surface.
” No other real data set is even close in quality and coverage.”
..
UAH & RSS have both better coverage and higher quality.
David,
Not an assertion. A fact. The supposed data for the polar regions are made up by taking readings from stations 1200 km away, then “adjusting them.
The ocean “data” aren’t even from the surface, as with land data, and again are fabricated from a meaningless hodgepodge of bucket, inlet and floating sensor inputs, all again adjusted.
It’s beyond meaningless and worse than worthless garbage, intended not for science but to further an agenda.
I assumed it was obvious that I was referring to “surface” data, not satellite observations of the lower troposphere. Sorry if I weren’t clear. But at least as obviously, the satellite data don’t go back as far as surface instrumental records.
PS: And where we actually do have good land surface data from polar regions, as at the South Pole, there is no warming.
It’s all made up by bogus infilling and adjusting from distant stations, themselves questionable.
Consensus “climate science” isn’t science but politics.
“Not an assertion. A fact. ”
…
I asked for a citation. Your opinion is worthless.
“Consensus “climate science” isn’t science but politics.”……..trying to change the subject adds nothing to your argument.
TH has also shown that the trend is basically the same for morning and evening stations in the USA.
In other words, the TOBS adjustment is a load of AGW assumption driven BS.
“Now more model infilling occurs”
Again, USHCN, which was starting to have station dropout issues, has been replaced by nClimDiv, with many more stations.
But what is the quality of that surface station data, Nick.
Last time I asked you, you basically said you didn’t know and you DIDN’T CARE.
Nick Stokes
How does your account of the Heller graph manage to get a correlation coefficient of 0.99?
Geoff
Geoff,
“How does your account of the Heller graph manage to get a correlation coefficient of 0.99?”
I don’t know. How does your account of it get that. Do you think the scientists of USHCN were polishing their adjustments behind the curtain to get the corelation with CO2 perfect?
Because one aspect of his graph with its insinuations is, why? Why would a data manipulator actually try to make adjustments correlate with CO2. It makes no sense. The alleged malfeasance would be directed to making the adjusted value correlate with CO2. That would involve ironing out the discrepancies. And there is no reason to think the discrepancies would be correlated with CO2.
The reality of course is that he is using faulty methods. Anything can happen.
Nick> “Why would a data manipulator actually try to make adjustments correlate with CO2.”
Just when you think you’ve heard it all….Nick tops himself
Other then the usual hand waving and twisting….Not a one of you have produced a graph, any figures, nada…..disputing Tony’s work
Interesting discussion, but none of the usual suspects actually answered why the adjustment appears in perfect correlation with CO2. Nick was nearest of telling it is an accident of linearities. I don’t buy that. It would be too convenient.
Some pointed out this is not global, but US, which is important but was not the question.
Some pointed out it is outdated, which is basically a red herring from the CCCP.
Nick does the most elaborate work here: ‘If warmer stations tend preferentially to drop out, the raw average will decline, and that shows up in TH’s adjustment, reflecting changes not due to adjustment at all.’
If.
If little adjusted, i.e. ‘naturally warmed’ stations drop out, (why did they accidentally do so) the average adjustment increases. True. But how do you end up having the amount of adjustment correlated with CO2?
The reason why I am suspicious is that there are not many people capable of selecting and dropping out stations. I don’t particlarly trust these people after climategate showed that funding and group thinking can make people decieving if not grafting and tricking.
I am fairly certain that chart is nonsense, but I’m happy to be proved wrong if you can provide the data.
Mosh says it’s 100% correct…..and even justifies the adjustments by showing the adjustments are correct…and he’s BEST you know
TG, the data youncan get yourselt. Delta CO2 is just the Keeling curve or what NOAA asserts pre Keeling, available online. Adjustments are just the present historical NOAA record of monthly USHCN final (adjusted) minus raw. Both USHCN monthly series are available on line via NOAA. And, Heller’s blog has direct hot links to both sources if you cannot find them from my directions. Reproduce the thing yourself. I just provided you the data references. As said, the chart is reproducible and irrefutable.
“Both USHCN monthly series are available on line via NOAA.”
You can get individual stations on line. But where do you find the overall average that is shown in the plot?
“But where do you find the overall average that is shown in the plot?”
…on Heller’s blog…He’s posted all of it….he’s very open about it
“on Heller’s blog”
I was querying Rud’s “via NOAA”
math and code….it’s all on Heller’s blog
“math and code….it’s all on Heller’s blog”
Ah, but you see, Tony Heller isn’t a REAL climate scientist, so no matter how impeccable his code and incontestable his data, it is cannot ever be REAL climate science, so compared to the work of REAL climate scientists such as Stokes, Mosher, Zeke, Gavin and their ilk, it’s obviously entirely worthless and can be dismissed out of hand, just like Svensmark’s theories.
With such studies, there is enough evidence of academic malpractice to defund those charlatans.
Given that global warming is a religion, it would be better to say “DEFROCK those charlatans”.
Unfortunately academic malpractice appears to be a prerequisite for funding.
Yes, it does. Defunding or Defrocking is nearly impossible when the whole study is based on the swamp and the lies therein. The corruption is deep. Removing may result in the death of the science/religion. It is a bigger challenge than AGW ever could be.
Clearly the quote should have been
Yes climate science has truely become a religion.
Well, I suppose if they are trying to understand how climate change happens, fair enough, so long as they don’t try to suggest that humans and/or CO2 have much to do with it.
But why do they need models to “prove existence of climate change”? Just ask any Geologist.
Strange I thought we stopped attribution of bad things in whole or part to random deities way back in human history. Clearly not so what do you want next the “golden bull statue” and the orgy on the mountain?
Where’s the orgy??
This is the old language trick of the left. They define the ‘climate change’ as a dangerous anthropogenic greenhouse gas driven global warming, and then they notice climate has changed, ergo, GHGs are a danger.
There is no need for attribution is this game, but they’ll do it anyway and ‘show’ that humans cause some climate change (daggdgw). Show in their models, that is. The warming we have for real appears not that dangerous, IMHO. And voila, I’m a denier since WE ARE GONNA DIE!!!!!!!!
(which we know has been influenced by climate change)—circular reasoning at its finest. Use the premise to prove the conclusion to prove the premise to prove…… Yes, we are ALL GONNA DIE!!!!!!!
Turtles all the way down….
They’re kind of late to the money-grabbing climate scam but it looks like they’re giving it the old college try.
Um, when is the uptick in observed weather extreme’s going to take hold? Because by all metrics, nothing is happening except for a decrease. From tropical cyclones to tornadoes, drought.
Aha! That’s where the “new proposed statistical methodology” comes in. The uptick (oops, had to correct an entirely unintentional typo, there) will occur as soon as the methodology creates it. In actuality, the uptick won’t happen until greengrocers’ apostrophes stop appearing here.
To validate a model, I suggest that its results for the previous many decades of weather, climate, atmospheric gases, etc. would be consistent with the observed data. Is that too much to ask?
past performance is no indication of future performance.
recreating the past when the past was used for model training is a trivial problem mathematically. it is curve fitting.
what is important is how well the model predicts data that neither the model or the model builders have seen. everything else is subject to bias unless there was very careful double blind controls used throughout the process. something that in itself is very difficult to achieve.
The problem is that the models are tuned to match the past.
models are tuned to match the past.
=======
because our records are imperfect the models have been tuned in large part to match what the model builders BELIEVE to be true. models that fail to match this belief are changed until they do.
and just as importantly and very commonly in computer programming, models that accidentally match what the model builders believe to be true are not changed. complex models ABSOLUTELY have undiscovered bugs (errors) in the code. these affect the results and are very very hard to find when they make the output of the model look better than they actually are.
for example 40+ years ago one of my first clients asked me to reinstate a bug in their financial statements because after the bug was corrected they found they had been doing much worse for the past couple of years than the computer had been telling them. I was not at all popular with the client for having found the bug even though I had been involved in its development. it was a definite case of shoot the messenger.
typo. I was not involved in the development of the bug.
“The problem is that the models are tuned to match the past.”
And the past is tuned to match the models…
When they have computer model that can predict the future state value of a chaotic process then I will listen. Until then they are just rolling knuckle bones or spreading entrails.
computer model that can predict the future state value of a chaotic process
=======
already exists. the ocean tides are chaotic. we are unable to predict them from first principles even though the physics is well understood.
yet we can predict the ocean tides to a very high degree of accuracy for many years in the future by using an ancient technique. Astrology. yes the much maligned science of astrology does a much better job of predicting the ocean tides than can be achieved from first principles using physics, mathematics, and the fastest computer models in the world.
I think you mean “astronomy” not astrology. A bit of a difference…one is chaotic (and false) the other is not.
But, the tides are not chaotic. Given the exact same inputs the results will be predictable. Chaotic events can begin with identical inputs but achieve different results.
Rocketscientist
I disagree with your definition of ‘chaotic’. Chaotic does not mean ‘random’. A chaotic system is hard to predict, not unpredictable. Given the exact same inputs a chaotic system produces the same result every time.
If there is an element of random behaviour of random input, then the result may never be predictable. Given the exact same inputs, such a system might produce a different result every time, whether it is chaotic or not.
Crispin
A chaotic system is predictable only to the extent of the precision on the initial conditions. In practice this means it is unpredictable after some time for any precision.
Edward Lorenz discovered ” chaos in a simple system of three partial differential equations. Almost all partial differential equations can’t be “solved” mathematically but have to be estimated using numerical(computerized) methods. Lorenz discovered that for narrow ranges of the variables the equations would produce fixed results after multiple recalculations- they were deterministic. With most values the results went to infinity after a few iterations. If the values were changed slightly, such as rounding from 6 to three digits, the results went to infinity. Lorenz’s discovery, which gave its name to Lorenz attractors, showed that even detailed atmospheric modeling cannot, in general, make precise long-term weather predictions. He summarized the theory as:
Chaos: When the present determines the future, but the approximate present does not approximately determine the future.
Since all climate models are essentially coarse-grained, huge weather models they simply cannot approximate the future behavior of the climate. Each run will produce A prediction of future climate, but multiple runs or multiple models do not draw “random” samples from a bowl. Averaging outputs is essentially averaging by drawing from different bowls so the results don’t apply to even the simplest statistical test such as standard deviation. It’s as silly as averaging the results of lottery numbers and expecting to find useful information about the next drawing.
That’s just it. Martingale is alive, and our money and our freedom are being wagered on the climate scam, using it.
You don’t need the state, you need the attractor.
I prefer to think of it as numerical self abuse, or mathematical onanism.
Amazing. They keep coming up with new and improved ways of lying.
Considering that at least half the people in the USA have zero understanding of math, this could be a very effective if repeated often enough.
The notion of the statistics of climate models is itself a nonsequiter. Where was ASA when Mann messed up PCA? Where was ASA when Dessler claimed to have proven positive cloud feedback when his r^2 was 0.02! Now to pretend they can make a contribution to modeled future extreme weather…the warmunists are truly self destructing now.
Hey, they probably still think that the average of a multi model ensemble has some scientific worth.
In desperation, a drowning man with an anchor tied to his feet will drag down everyone and everything around him in hopes of salvation that won’t come.
Here is where in The Institute of Mathematical Statistics and their Issue in “The Annals of Applied Statistics” with a series of some 14 articles entitled
“A statistical analysis of multiple temperature proxies: Are reconstructions of surface temperatures over the last 1000 years reliable?” or variations thereon. The different articles were authored by such as Gavin A. Schmidt, Michael E. Mann, Eugene R. Wahl, Stephen McIntyre, Ross McKitrick, etc.
https://projecteuclid.org/euclid.aoas/1300715166#toc
Having read all the discussions, I found it a pretty damning critique of Mann’s work.
It would seem that this effort has pretty well gone unknown. More is the pity, as it was one of the places where one of the journals did an actual critique with equal input from qualified sceptics.
CMS Very interesting set of publications. Thanks.
I picked up a book when sorting for a Rotary Club book sale and the title is The Weather Makers written by Tim Flannery 🙁 an Australian activist so called scientist ) published in 2005
.What a lot of tosh that he wrote trying to scare the readers into believing that his view was the only one acceptable , and we see these activist so called scientists pushing the same line..
Twelve years on not one of his predictions has happened. .
The main problem with many scientists is that their starting point is : climate change is real and is happening and it will have serious consequences for mankind ;
Scientists should be skeptical and should not accept theories without absolute proof .
The only proof is that CO2 levels are increasing and the global temperature is increasing so that’s the proof.
The CO2 increase on its own will not make a large difference to the global temperature
.The theory rely s on positive feed backs and these feed backs have not been observed starting with the tropical hot spot .
Scientists believe in their computer models but these models are not fit for purpose .This means that they have put in the wrong parameters and untill the models can hind cast accurately they are useless and it is quite obvious that they are Junk science .
“Twelve years on not one of his predictions has happened. ”
I was in high school back in the 80s, and books like “The Fate of the Earth” “Entropy” were required reading. We even had to watch “The Day After”, i.e., the one with the nuclear winter, NOT “The Day After Tomorrow”, i.e., the one with (apparently) the even scarier climate change…
Yes, we were all gonna die, terribly, probably by the somehow magical number of 2000. Starvation, ecological nightmares, zombies. I’m only slightly making that last one up.
Yeah, not a good track record looking back from 2017, is it?
Last year I was purging some old magazines and came across a typical one-off from 1999. Full of stuff that was going to happen “soon”.
Yeah, not a good track record (repeat as needed).
We need to tie back things like tenure and funding to correct projections and predictions. THAT might tighten the actual science up a bit.
Some authors “detail how parameters and initial values drive an ice sheet model, whose output describes the behavior of the ice sheet through time. Noise and biases are accounted for in the model that ultimately produces ice sheet data.” Millions of lines of computer code, “adjusted” data for parameters and initial values, an incomplete understanding of the processes that drive climate, statistical distributions that evolve unpredictably over time, a chaotic system, and new discoveries such as volcanoes under ice sheets… what could possibly go wrong with their statistical attributions?
The ASA article reads, “…hundreds of thousands, if not millions, of lines of computer code…,” as if more lines of code is an indicator of better code and/or a better program. Neither is necessarily so, and both are often worse. The sentence is an IT equivalent of the 97% consensus appeal to authority.
Coaxing information out of noise; or is that torturing.
The signal they’re searching for is ~.2C/decade or .000055C/day, where the dirunal natural variation, the noise, ranges between 4C and 56.7C, without allowing for humidity, pressure, and altitude effects. At the same time, there is both daily and seasonal lag in those signals, relative to the primary forcing*. Is it any wonder that this “science” is compared to voodoo? http://www.bishop-hill.net/blog/2013/6/19/here-come-de-heap-big-warmy.html
* For warmists, I should explain that the primary forcing is sunlight. CO2 is a secondary farcing.
“farcing”??
Sometimes there is truth in error. 😉
I think water vapour and ozone come before CO2 in terms of ‘influence’.
Statisticians continue to miss the point. The range of error of any estimate will always be so large that the best decision based on a cost-benefit analysis would be to do nothing. Actions to take for out-of control global warming would be opposite to those for an approaching ice age. Statisticians are searching for an answer at the end of a mobius strip.
Tom,
Ncely put. Now do open a Christmas Klein bottle or three. Geoff.
O/T: Q: “Why did the chicken cross the Mobius Strip?” A: “To get to the other, umm, er…”
Anthony:
“changes in thermodynamic state variables, such as global temperature, can be relatively well characterized”.
“– assessing to which degree changes in the thermodynamic state (which we know has been influenced by climate change) — ”
While the ASA may know statistics, it is ignorant of chemical physics. Our planet does not have a “thermodynamic state” of any kind because all of the variables at all points in time and space that might be proposed to identify such a state are out of equilibrium with each others and changing continuously. The radiation field and the kinetic fields are always inconsistent. The chemical state mostly due to water is often not even noted yet fully a third of all atmospheric heat is moved by H2O. This is the absurdity of the “global temperature” which is at best a statistic, but which itself has not been identified even as stationary in the statistical sense so arguably does not even qualify as a decent statistic of a physical process, much less a state variable. It is one thing to be dealing with stationary thermodynamic states, and quite another to be dealing with non-stationary weather chaos that averages to climate. It would be well if the ASA did a more comprehensive job of distinguishing with what it is dealing.
Here is what troubles me about this:
“… researchers suggest viewing the event as a given and assessing to which degree changes in the thermodynamic state (which we know has been influenced by climate change) altered the severity of the impact of the event…”
The next step will be publish some method to put an actual number on it. Once that is in the “peer reviewed” literature, it won’t be long before the media and politicians are out there telling us that a specific percent of damage caused by some storm was due to “climate change”. Then they have a dollar amount on it and well, use your imagination.
They don’t use the phrase, but this appears to be a Bayesian analysis they are using.
Problem formulation in words:
– Given an event,
– assess the degree of a state variable change which,
– altered the impact, which “we we know has been influenced by our state variable delta.
I find it mind boggling that PhD in stats thinks that is a proper formulation of a Bayesian question. It will always return a True answer if formulated that way.
Given that they must know this, then one can only conclude they are dishonest and intellectually compromised by a need for hypothesis confirmation.
PseudoBaysian. Bayes theorem is ‘just math’, and its valid uses are legion. Wrote it up as an extended example in the recognition chapter of The Arts of Truth. Used the famous breast cancer mammogram example worked through two ways: verbal logic like for a jury, and Bayes theorem math. Of course, they are equivalent.
More like ‘Malthusian’…..
Wxo,
Already happening here in Australia, with a climate researcher named Karoly, who sits on several advisory bodies to governments, stating matters like there is a 393.6% probability that climate change made this storm more intense.
And people in droves, believe this type of fiction.
Poor fella, my country. Geoff.
It’s another masterful demonstration of the use of words to dance around mathematical and physical uncertainties, and pretend that what was previously intractable somehow becomes tractable if only you wilfully abuse the English language to describe it differently.
The question still remains: “Does it work?”, and the answer remains “No”, or, “Ask me again in fifty years.”
Hmm, it looks like many of the authors work directly for Michael Mann, unless I am mistaken about the Penn contingent. That gives me loads of confidence into the correctness of their statistical acumen.
Plus many. Neat observation.
Some thirty or so years ago, I have the opportunity to ask a PhD Statistics co-worker … “What is the ‘dream job’ for statistics PhDs ?” The answer … “The Tobacco Institute”.
So, every statistics story I read is tainted by the answer.
Wow, did anyone else notice this?
Talk about assuming as fact that which you are testing to see if it is true.
That kind of assuming the Bayesian analysis will always return a true result.
And how about the language used?
“Altered the severity of the impact”
How about just…”altered the impact”?
My old mentor would have thrown me out of his office if I’d come in with a draft paper with that kind of language.
the statistics is to math what astrology is to astronomy
the basic premise is that ignorance can be quantified.
and we know ignorance is infinite.
liberal application on a daily basis makes any superstition into a comfortable routine, but they are trying to make it fashionable too…lol
Indeed. Just like bitcoin technical analysis.
That glaciers contain 90% of the worlds fresh water is true but trivialy so as 0% our fresh water comes from there. And even if Greenland and Antarctica were to completely melt, it wouldnt change how much fresh water we have to use.
True. Ice sheets melt into oceans. Some fun math courtesy USGS from Gaia’s Limits water chapter. Earth is ~97% saltwater and 3% fresh. Of fresh, 69% is icecaps which melt intomthemsurrounding seas so are useless fresh water, 30% is groundwater, and ~1% is surface water including non-icecap glaciers. Of surface water, ~87% is lakes and glaciers, and 13% is swamps and rivers. So adding groundwater to surface waters of all types, annual precipitation provides us with about 2% of the planets water as fresh water. All non-marine terrestrial life lives on thin yet remarkably robust margins.
Some cities around the world however get their water from melting mountain glaciers, such as Seattle, WA, Portland, OR and Santiago de Chile.
Hogwash
http://www.seattle.gov/util/MyServices/Water/index.htm
https://www.portlandoregon.gov/water/29784
The Himalayan glacial melt waters are the headwaters for India’s great rivers. Which was all the hype over the false claims in AR4 when it declared they would be gone by 2033.
The moonbat claimed that once the glaciers were melted, the rivers would dry up. He imputed that all the volume of flow came from glaciers that did not have a source, they were the source.
An ignorant public was convinced by this, apparently. A surprising number of people think if the glaciers are gone it will stop raining and the rivers will stop flowing.
CO2 is the miracle gas.
In some areas e. g. the Andes and to some extent the Rockies glacier meltwater is important because it comes in the otherwise dry summer season and therefore evens out river flow. In India/Himalaya most of the rain comes in the summer monsoon and the winters are dry, so the effect of glaciers is really quite insignificant.
The great rivers of the Indian sub-continent, SE Asia and China are fed by snow and rain falling from the sky. In their upper reaches most of these rivers take the form of glaciers. In every tributary valley the point where the frozen river melts may fluctuate up or down the valley.
The frozen rivers flow very slowly (compared to liquid rivers) and attenuate the flow. In this way they act like reservoirs.
But sooner or later, the water falling out of the sky will end up flowing down a river.
(Sorry for pointing out the blindingly obvious)
“thermodynamic state variables, such as global temperature” That’s not a thermodynamic state variable.
The very first block quote in the article raised an eyebrow in me — the part that stated, ““Rather than trying to assess the probability of an extreme event occurring, a group of researchers suggest viewing the event as a given and assessing to which degree changes in the thermodynamic state (which we know has been influenced by climate change) altered the severity of the impact of the event, …”
“View the event as a given” ? — what does this mean ? — “given” when ?, where ?, how ? — how does one decide that an event is “given” ? Maybe I need to read the publication, but the wording just seems strangely circular on the surface.
translation:
the null hypothesis is that ‘your fault!’ and it only remains to assess the fees for damages.
I have to dwell on this for a bit more — a phrase at a time:
Rather than trying to assess the probability of an extreme event occurring , …
TRANSLATION: To hell with determining whether or not an event will, IN FACT, occur. Just wave our wands, abracadabra, and there it is, because we experts deem it so as a stipulation of our methodology.
… a group of researchers suggest viewing the event as a given
TRANSLATION: Researchers assume the truth of that which they are trying to prove true, which saves a lot of time, and if phrased properly by experts, will go right over the heads of most people as a totally ridiculous statement, because experts don’t make ridiculous statements.
… and assessing to which degree changes in the thermodynamic state (which we know has been influenced by climate change) …
TRANSLATION: You are NOT allowed to question whether or not we DO, IN FACT, know that changes in the thermodynamic state have been influenced by climate change — we DO, damn it, because we are the experts in this field saying so. You just have to take our word for it here and ignore any questions anybody might have about this. Oh, and we love impressing you with our technical vocabulary too, with the phrase, “thermodynamic state”, even though we are totally, bat-shit confused about what thermodynamic laws actually say.
… altered the severity of the impact of the event …
TRANSLATION: Blah, blah, bullshit, bullshit, blah, blah.
I love how a dash of “cutting edge” and “principled” sexes up the old pig wearing lipstick.
Wow, the State Penn… err … Penn State has pulled out all stops! I guess when you are the Chair of the Sustainable Human Gas Attenuating Center for Saving the World, you now know you will be walking into that Good Night, but not without kicking up a big fuss. I call this stage of the climate play ‘the chicken with head cut off leaping and bounding’ last act.
This is a general problem with fake mathematical approaches. Given unjustified assumptions, the outcomes are certain. This is classic: “viewing the event as a given and assessing to which degree changes in the thermodynamic state (which we know has been influenced by climate change) altered the severity of the impact.”
Once you buy that initial sack of offal–“which we KNOW has been influenced by climate change”–you have bought in to the occult and sold your scientific soul. Only alt science knows such things.
The proper way to assess thermodynamic states is their probability of existence. Period. Take it up with Herr Boltzmann.
Two things which caused warning bells to ring straight away ‘Penn State and Models Show’
I went back to writing to Santa at that stage.
With regard to any facts, the West is in a crisis. We have far too many people promoting the most absurd conspiracy theories and leaders claiming valid news is false news while believing ‘facts’ which have little basis in reality. It is the downside of social media, and probably one of the biggest threats to good governance we have ever faced. It’s why I follow this page, even though I believe most of the mainstream climate science is probably correct, this page challenges those assumptions; and occasionally shows my assumptions were in fact incorrect. Far too many people have given up hearing both sides of any debate, and we are all the poorer for it.
Incorporating all of these uncertainties is daunting, partly because we not even sure of their extent or nature. But ‘models ‘ make life so much easier as all we have to do is change some numbers and to get the result we ‘need’ and if we make the predictions for long enough in the future there is no chance or us being asked why we got it so wrong , so its gravy all the way.
This is a real scientific gem too:
“melting of ice shelves could be catastrophic for low-lying coastal areas”
Since ice-shelves are already floating their melting or not has no effect on sea-level. Archimedes anyone?
“…..Rather than trying to assess the probability of an extreme event occurring, a group of researchers suggest viewing the event as a given…..”
Wow that should work well on the stockmarket, at the races and the Casino.
There were two stalwarts I thought were safe from the carp some of these guys dish up.
1/ Statistical analysis in the sense that the models and data do not stand up to rigorous scrutiny and,
2/ The ice cores that show us nothing is new.
Now both are under siege.
This is going to be a long battle!
Some potential future titles:
> “Pearson R-squared as Silly and Incorrect Reasoning” by Michael E Mann, Director of the Penn State ESSC
> “Modern Centering in Principle Component Annalysis” by Michael E Mann, Director of the Penn State ESSC
> “Drawing Conclusions from Trivially Small Data Samples” by Stephan Lewandowsky, School of Psychology and Cabot Institute at University of Bristol
> “Ascertaining and Quantifying Conflicting Conspiracy Theories with No Data Points” by Stephan Lewandowsky, School of Psychology and Cabot Institute at University of Bristol