Last week I hinted at this upcoming paper, which was embargoed until this morning. I noted then something Dr. Roy Spencer said in his book about clouds: The Great Global Warming Blunder: How Mother Nature Fooled the World’s Top Climate Scientists and how this new paper could be the “holy grail” of climate science, if it is true.
“The most obvious way for warming to be caused naturally is for small, natural fluctuations in the circulation patterns of the atmosphere and ocean to result in a 1% or 2% decrease in global cloud cover. Clouds are the Earth’s sunshade, and if cloud cover changes for any reason, you have global warming — or global cooling.”
Today, we have news of something that modulates cloud cover in a new paper by Henrik Svensmark in Nature Communications.
PRESS RELEASE: DTU Space at the Technical University of Denmark
A breakthrough in the understanding of how cosmic rays from supernovae can influence Earth´s cloud cover and thereby climate is published today in the journal Nature Communications. The study reveals how atmospheric ions, produced by the energetic cosmic rays raining down through the atmosphere, helps the growth and formation of cloud condensation nuclei – the seeds necessary for forming clouds in the atmosphere. When the ionization in the atmosphere changes, the number of cloud condensation nuclei changes affecting the properties of clouds. More cloud condensation nuclei mean more clouds and a colder climate, and vice versa. Since clouds are essential for the amount of Solar energy reaching the surface of Earth the implications can be significant for our understanding of why climate has varied in the past and also for a future climate changes.

atmosphere and produces a cascade of secondary particles who ionize molecules when traveling through the air. One 100 GeV proton hits every square meter at the top of the atmosphere every second.
Cloud condensation nuclei can be formed by the growth of small molecular clusters called aerosols. It has until now been assumed that additional small aerosols would not grow and become cloud condensation nuclei, since no mechanism was known to achieve this. The new results reveal, both theoretically and experimentally, how interactions between ions and aerosols can accelerate the growth by adding material to the small aerosols and thereby help them survive to become cloud condensation nuclei. It gives a physical foundation to the large body of empirical evidence showing that Solar activity plays a role in variations in Earth’s climate. For example, the Medieval Warm Period around year 1000 AD and the cold period in the Little Ice Age 1300-1900 AD both fits with changes in Solar activity.
“Finally we have the last piece of the puzzle explaining how particles from space affect climate on Earth. It gives an understanding of how changes caused by Solar activity or by super nova activity can change climate.”
says Henrik Svensmark, from DTU Space at the Technical University of Denmark, lead author of the study. Co- authors are senior researcher Martin Bødker Enghoff (DTU Space), Professor Nir Shaviv (Hebrew University of Jerusalem), and Jacob Svensmark, (University of Copenhagen).
The new study
The fundamental new idea in the study is to include a contribution to growth of aerosols by the mass of the ions. Although the ions are not the most numerous constituents in the atmosphere the electro-magnetic interactions between ions and aerosols compensate for the scarcity and make fusion between ions and aerosols much more likely. Even at low ionization levels about 5% of the growth rate of aerosols is due to ions. In the case of a nearby super nova the effect can be more than 50% of the growth rate, which will have an impact on the clouds and the Earth’s temperature.
To achieve the results a theoretical description of the interactions between ions and aerosols was formulated along with an expression for the growth rate of the aerosols. The ideas were then tested experimentally in a large cloud chamber. Due to experimental constraints caused by the presence of chamber walls, the change in growth rate that had to be measured was of the order 1%, which poses a high demand on stability during the experiments, and experiments were repeated up to 100 times in order to obtain a good signal relative to unwanted fluctuations. Data was taken over a period of 2 years with total 3100 hours of data sampling. The results of the experiments agreed with the theoretical predictions.
The hypothesis in a nutshell
- Cosmic rays, high-energy particles raining down from exploded stars, knock electrons out of air molecules. This produces ions, that is, positive and negative molecules in the atmosphere.
- The ions help aerosols – clusters of mainly sulphuric acid and water molecules – to form and become stable against evaporation. This process is called nucleation. The small aerosols need to grow nearly a million times in mass in order to have an effect on clouds.
- The second role of ions is that they accelerate the growth of the small aerosols into cloud condensation nuclei – seeds on which liquid water droplets form to make clouds. The more ions the more aerosols become cloud condensation nuclei. It is this second property of ions which is the new result published in Nature Communications.
- Low clouds made with liquid water droplets cool the Earth’s surface.
- Variations in the Sun’s magnetic activity alter the influx of cosmic rays to the Earth.
- When the Sun is lazy, magnetically speaking, there are more cosmic rays and more low clouds, and the world is cooler.
- When the Sun is active fewer cosmic rays reach the Earth and, with fewer low clouds, the world warms up.
- The implications of the study suggests that the mechanism can have affected:
- The climate changes observed during the 20th century
- The coolings and warmings of around 2°C that have occurred repeatedly over the past 10,000 years, as the Sun’s activity and the cosmic ray influx have varied.
- The much larger variations of up to 10°C occurring as the Sun and Earth travel through the Galaxy visiting regions with varying numbers of exploding stars.
The authors
- Dr. Henrik Svensmark, Danish National Space Institute, in the Technical University of Denmark (DTU).
- Senior Resercher Martin Andres Bødker Enghoff, Danish National Space Institute, in the Technical University of Denmark (DTU).
- Professor Nir Shaviv, Physics Institute, Hebrew University of Jerusalem.
- Ph.D. student Jacob Svensmark, Dark Cosmology Center, University of Copenhagen.
Full journal reference
H. Svensmark, M.B. Enghoff, N. Shaviv and J. Svensmark, Increased ionization supports growth of aerosols into cloud condensation nuclei, Nature Communications DOI: 10.1038/s41467-017-02082-2
The paper is here https://www.nature.com/articles/s41467-017-02082-2
Abstract:
Increased ionization supports growth of aerosols into cloud condensation nuclei
H. Svensmark 1, M.B. Enghoff 1, N.J. Shaviv2 & J. Svensmark1,3
Ions produced by cosmic rays have been thought to influence aerosols and clouds. In this study, the effect of ionization on the growth of aerosols into cloud condensation nuclei is investigated theoretically and experimentally. We show that the mass-flux of small ions can constitute an important addition to the growth caused by condensation of neutral molecules. Under present atmospheric conditions the growth rate from ions can constitute several percent of the neutral growth rate. We performed experimental studies which quantify the effect of ions on the growth of aerosols between nucleation and sizes >20 nm and find good agreement with theory. Ion-induced condensation should be of importance not just in Earth’s present day atmosphere for the growth of aerosols into cloud condensation nuclei under pristine marine conditions, but also under elevated atmospheric ionization caused by increased supernova activity.
From the discussion section of the paper:
This suggests that there are vast regions where conditions are such that the proposed mechanism could be important, i.e., where aerosols are nucleated in Inter-Tropical Convergence Zone and moved to regions where relative large variations ionization can be found. Here the aerosols could grow faster under the influence of ion condensation, and the perturbed growth rate will influence the survivability of the aerosols and thereby the resulting CCN density. Finally the aerosols are brought down and entrained into the marine boundary layer, where clouds properties are sensitive to the CCN density2.
Although the above is on its own speculative, there are observations to further support the idea. On rare occasions the Sun ejects solar plasma (coronal mass ejections) that may pass Earth, with the effect that the cosmic ray flux decreases suddenly and stays low for a week or two. Such events, with a significant reduction in the cosmic rays flux, are called Forbush decreases, and can be used to test the link between cosmic ray ionization and clouds. A recent comprehensive study identified the strongest Forbush decreases, ranked them according to strength, and discussed some of the controversies that have surrounded this subject.
Atmospheric data consisted of three independent cloud satellite data sets and one data set for aerosols. A clear response to the five strongest Forbush decreases was seen in both aerosols and all low cloud data. The global average response time from the change in ionization to the change in clouds was ~7 days, consistent with the above growth rate of ~0.4 nm h−1. The five strongest Forbush decreases (with ionization changes comparable to those observed over a solar cycle) exhibited inferred aerosol changes and cloud micro-physics changes of the order ~2%7. The range of ion production in the atmosphere varies between 2 and 35 ions pairs s−1 cm−337 and from Fig. 1b it can be inferred from that a 20% variation in the ion production can impact the growth rate in the range 1–4% (under the pristine conditions). It is suggested that such changes in the growth rate can explain the ~2% changes in clouds and aerosol change observed during Forbush decreases.
It should be stressed that there is not just one effect of CCN on clouds, but that the impact will depend on regional differences and cloud types. In regions with a relative high number of CCN the presented effect will be small, in addition the effect on convective clouds and on ice clouds is expected to be negligible. Additional CCNs can even result in fewer clouds. Since the ion condensation effect is largest for low SA concentrations and aerosol densities, the impact is believed to be largest in marine stratus clouds.
Further reading:
COSMIC RAYS, CLOUDS AND CLIMATE
Henrik Svensmark – DOI: 10.1051/epn/2015204
National Space Institute – Technical University of Denmark – Elektrovej, Bygning 328, 2800 Kgs – Lyngby, Denmark
The most profound questions with the most surprising answers are often the simplest to ask. One is: Why is the climate always changing? Historical and archaeological evidence of global warming and cooling that occurred long before the Industrial Revolution, require natural explanations.
Link to the PDF: SvensmarkEPN_46-2-2_2015
From that article:

Further Reading:

Scientists agree that the earth has become hotter over the last century. But on the causes, despite what looks to the public mind like a consensus, there are dissenting voices. Based on Henrik Svensmark’s research at the Danish National Space Center, this book outlines a brilliant and daring new theory that has already provoked fresh thinking on global warming. As prize-winning science writer Nigel Calder and Svensmark himself explain, an interplay of the sun and cosmic rays – sub-atomic particles from exploded stars – seem to have more effect on the climate than man-made carbon dioxide. For anyone interested in the real science behind our climate, this book is a must-read.
COUNTERPOINT:
I asked prominent solar physicist Dr. Leif Svalgaard his opinion on the paper (and sent him the advance full copy). He had this to say:
Think about this:
TSI over a solar cycle causes a variation of 0.05-0.10 degrees C. If GCRs as per Svensmark has 5-7 times the effect of TSI, that would translate to a temperature variation of 0.35-0.50 C over a cycle, which is simply not observed, hence the paper can be dismissed out of hand.
The battle over this paper will soon be waged in press and peer-review.
I’m reminded of the good Dr. Svalgaard when he wrote this:
https://wattsupwiththat.com/2009/11/01/spot-the-science-error/
Getting a bit ahead of yourself aren’t you? I recall when you said years ago Henrik Svensmark’s work was so bad it would never be published.
How would you like your crow served this time?
Jeez, dude, chill out. There’s no need for nasty personal attacks.
w.
Are you referring to DR or Svalgaard?
The term “dismissed out of hand” is a nasty personal attack.
Still on the beach W?
“If GCRs as per Svensmark has 5-7 times the effect of TSI, that would translate to a temperature variation of 0.35-0.50 C over a cycle, which is simply not observed, hence the paper can be dismissed out of hand.”
How is that a personal attack?
Willis,
I’m all for peace and goodwill too, but you’ve been guilty of nasty personal attacks yourself. And Dr, Svalgaard’s “out of hand dismissal” is arrogant.
ScottM Asks how is that a personal attack.
In common English parlance when a person dismisses someone or something “out of hand” it is the equivalent of saying, you or this is not worthy of my time or thought. Example, wattsupwiththat is quoted, so the true believer states “oh, that came from there so we can dismiss it out of hand”. Or “he’s a D word so we can dismiss that out of hand”
Defintion “•without taking time to think”
Out of hand is often used in a derogatory way. But, he was speaking to the paper not person.
Now to be fair, he did give a reason, to which I could reply Dr. Isvalgaard’s reply can be rejected out of hand since he did not factor in other feed backs and chaotic effects. Which frankly sounds kind of insulting because I dismiss him and make assumptions with a statement like that.
I would prefer to instead ask, Dr. Isvalgaard you have a good point about no temperature signal that can be found that matches the solar cycle to the degree implied in the paper. Do you think the chaotic nature of climate could drown out any “temperature” signal that should be a result of this? I put temperature in quotes because the sun outputs energy and not “temperature”; temperature being neither a form nor a measurement of energy.
To that question I hope he replies because I do like to hear both sides.
good point about no temperature signal that can be found that matches the solar cycle to the degree implied in the paper.
People have been looking for that for centuries and no such effect has been reported. Without going to far into the literature suffice it to refer to Willis’ attempts right here on WUWT.
If an effect of the magnitude touted by Shaviv [and repeated by Svensmark] would exist, there would be no debate.
Referring to someone’s work as needing to be dismissed out of hand is pretty nasty.
What fraction of cosmic rays are 100 GEV ?? Why was that number used for the CR energy ??
I’m sure that both solar charged particles and GCRs can do the Cloud Chamber thing, which after all has been practically demonstrated in the lab.
But does that mean that is a significant effect.
For me, THE cloud effect is simply : Less clouds over the oceans; more ocean water evaporation. More ocean water evaporation; more clouds, and less solar spectrum photons reaching the oceans to be converted to deep ocean heat.
G
What fraction of cosmic rays are 100 GEV ?? Why was that number used for the CR energy ??
Almost none. The solar cycle modulation is of GCRs with energy less than 15 GeV [and is only strong for much lower energies].
The sequencing of DNA independently confirmed the theory of evolution that was originally developed from phenotype and geological evidence. DNA sequencing in fact it modified some of the details, which is a clear signal of confirmation, just like Einstein refined Newton.
Nobody has done something similar with climate. In fact the climate prognosticators (I hesitate to call it science) are constantly either being falsified or are “not even wrong”.
Stop comparing the theory of evolution to the hypothesis of CAGW.
Peter
Mr. Eschenbach,
Do you consider the following a persona attack:
“Half of the American public believes the Earth and the Universe is only 6000 years old.”
– Leif Svalgaard September 11, 2009 at 5:20 am
https://wattsupwiththat.com/2009/09/10/svensmark-global-warming-stopped-and-a-cooling-is-beginning-enjoy-global-warming-while-it-lasts/
(I have a lot of respect for Leif but don’t care for these kind of broad brush ‘scientific’ generalizations from him).
Now, Mr. Kramer, what do you think the age is?
Perhaps you like this failed prediction [from your link] better:
“In fact global warming has stopped and a cooling is beginning. No climate model has predicted a cooling of the Earth – quite the contrary. And this means that the projections of future climate are unreliable,” writes Henrik Svensmark [in 2009]”.
Leif Svalgaard’s contributions to this blog exceeds DR’s.
+100
Take it easy, folks. In a complex system(do we know how many “forcings” and interactions between them that are affecting the climate?) any physical measure we take has a complex series of events behind it. Variations in periodicity can affect or even contribute to others. Think Moire patterns with 10,000 different fabrics coming from 100,000 looms overlapping at every angle from 0-90deg. All sorts of interference patterns can emerge that appear to be semi-regular patterns. Galactic Cosmic Rays certainly have enough energy to have significant effects on the atmosphere, and probably even the sun(we know even less about the sun than we do about the earth). The background noise is the result of all those unkown interactions.
Philo makes an important point. This is another case of lab results obtained under controlled conditions that cannot be observed in the climate system (i.e., the real world that we live in). This has always been a major obstacle for science and the scientific method. Scientists make assumptions all of the time that “beg the question.” An example is the theory of inertia. The theory says that an object at rest or one in motion continues to stay at rest or in motion unless affected by other forces. This may or may not be true.
No one has ever observed an object that is not subject to other forces. Not to mention that “at rest” is itself an artificial concept. How do you determine if something is at rest? So the theory of inertia is just a label for an assumed property of matter that cannot be proven. In addition, if it is true, the theory provides no answer to the question of what keeps an object at rest or in motion. Arguing that the property of inertia keeps an object at rest or in motion is not an explanation of why that is the case. Only one of many major limitations of science.
“Leif Svalgaard’s contributions to this blog exceeds DR’s.”
So what? Dr Svalgaard makes valuable contributions but the ONLY system for evaluating competing hypotheses is the Scientific Method. The Scientific Method cares not a whit about the number of blog posts anyone contributes to. The only metric is the ability of a hypothesis to match observed and predicted reality.
Your approach is not only wrong, it is anti-scientific. We judge everything based on observed reality alone.
Dr Svensmark and Shaviv are no fools. Through Forbush Decrease events we do know the effect cosmic rays have on water vapor, and we know that changes in water vapor concentration is the dominant effect on climate (even the major effect of the UN IPCC AGW hypothesis is based on this).
I believe Dr Svalgaard is making a serious error in dismissing the paper out of hand without apparently even reading it. This shows that Dr Svalgaard follows Scott Adams’ observation of our species, “We are all irrational all the time”. The illusion is that we are rational, and those that feel the most rational are in the greatest denial (as a PhD in physic it was hard for me to accept this truth, but it does fit all the data).
Let us heard the comments once we’ve all read the Svensmark et al. paper. And let us stop using anti-scientific criteria such as “blog post number density” as a substitute metric for competence in a specific topic.
without apparently even reading it
how do you reach that [wrong] conclusion?
Moa – The Scientific Method does not care what is true (or false) only in what is useful for making predictions (or getting grant money for research). If predictions cannot be made to be verified or if the predictions that can be made are falsified, then the proposed theory is useless and will be abandoned (except in the case of AGW).
Moa,
“Scott Adams’ observation of our species, “We are all irrational all the time”.”
Except Scott Adams, in the moment he made that “observation” ? . . ?
(And you, when you rationalized it? ; )
I shudder to think smart folks are reduced to taking such hyperbolic self-contradictory declarations seriously . . (which I feel is only mostly true, most of the time ; )
It seems obvious to me that THE basic cloud feedback is simply that more clouds, reduces solar spectrum radiation from reaching the deep oceans and converted to heat; and less clouds means more surface solar spectrum insolation, and more evaporation which eventually becomes more clouds.
This paper talks about a tweak in the more water vapor becoming more clouds, which would have to be a minor effect. Any dust or even microbes can nucleate water droplets, as can charged particles, but the availability of atmospheric water molecules is what is being modulated.
See: “How much more rain will global Warming Bring ?” Wentz et al I believe SCIENCE July 13th 2007. Well you googlers can look it up.
I think any papers reporting real effects (if demonstrable) is interesting but I don’t think this paper is any Rosetta Stone.
G
S.R.I.
“If predictions cannot be made to be verified or if the predictions that can be made are falsified, then the proposed theory is useless and will be abandoned (except in the case of AGW).”
And the case of Evolution (the grand origins story kind, not mere evolution in the “natural selection” sense), I submit . . Which, I believe, paved the way for “the debate is over” style unquestionable bully science we are now being subjected to with the CAGW.
The paper purports to provide evidence of an effect which clinches the deal over chaotic climate scatter.
I believe Dr S. simply pointed out that NO data of that magnitude has ever been obtained , ie no change of that size whether chaotic or not. So an explanation for observations that have never been made.
Seems to qualify for early exit from contention to me, so I wouldn’t classify Leif’s “out of hand” as derogatory.
I’m not disinterested in the possible effects of external high energy charged particles whether solar or GCMs. But I still think that the major feedback is the modulation of the amount of water vapor in the atmosphere itself, rather than in the secondary process of converting that vapor into cloud droplets.
The cosmic rays can’t make clouds out of non-existing atmospheric water vapor.
Wentz et al provided data on the evaporation rate, the atmospheric water rate, and the precipitation rates, data which the GCMs don’t match.
The Svensmark tweak has no effect on either evaporation rates or atmospheric water content, only on eventual precipitation rates, which ultimately have to match evaporation rates.
G
JohnKnight – Evolution is misunderstood and misrepresented as a proof that there is no cause and effect involved in the origin and development of life on earth. Nothing could be further from the truth. Science can neither confirm nor deny the truth that God is responsible for everything we see, as well as everything that exists that we do not see. Only metaphysics can do that.
S.R.I.,
“Science can neither confirm nor deny … Only metaphysics can do that.”
Not sure about that only . . but another Only springs to mind ; )
My point is basically a logical one; If one theory can be “synthetically” elevated to an unquestionable truth status, another could have been as well.
Svalgaard’s comments make this website better.
He appears to be an old-school skeptical scientist
that I wish we had more of.
I looked him up, and found an excellent paper from 2015,
that I highly recommend as the best climate paper I read in 2017
(I’m always a few years behind!)
I did not see any copyright notices on the paper,
so here are some quotes:
He discusses:
“Climate Variables and Models
As far as we know there are the following parameters or variables influencing our climate on time scales less than a million years (thus excluding the slow evolution of the Sun):
1) Earth orbital and orientation variations
2) Changes in ocean circulation, ENSO and others
3) Solar Irradiance and activity
4) Volcanic aerosol emissions
5) Greenhouse gas emissions
6) Land use (cities, logging, crops, grazing…)
7) Regional differences
8) Stochastic variations of a complex, non-linear system
9) Diverse unpredictable catastrophes”
The only fault I find with the nine item list
is that I think “Measurement Error and Bias”
which is discussed in the paper,
should have been the number (10),
… ‘everyone’ knows you’re supposed
to have a Top Ten, not nine!
All the infilling, and repeated “adjustments”,
by scientists who predicted a lot of warming,
and want to see their predictions come true,
and they are in charge of the temperature “actuals”,
and global average compilations,
which I see as a conflict of interest,
which could, at the least,
lead to confirmation bias,
and at the most, to climate “science” fraud.
(My own opinion, based on how bad the
government bureaucrat science is,
is that there IS deliberate fraud
to show more global warming,
than has actually happened.)
Their goobermint bureaucrat “scientist” salaries,
depend on them NOT understanding climate change,
because they HAVE to blame humans and CO2,
if they want to keep their jobs,
and that causes their fake (junk) science,
of wild guess confuser models,
making wrong average temperature predictions,
for 30 years … so far !
… and here is about two-thirds
of Svalgaard’s conclusion:
“Global Warming, or Climate Change, or Climate Disruption, just to mention some of the (increasingly scary) monikers that are being deployed these days have become a divisive political issue, seemingly divorced from scientific discourse. If it were not for the high- jacking of the subject by politicians, environmental pressure groups, and plain wishful eco-thinking, one would conclude from the present overview that Climate Science is a vigorous field with healthy debate and exciting interdisciplinary facets rather than a moribund body of ‘Settled Science’ without prospects for further progress,”
If the Svalgaard paper is too complicated for you,
my free climate change blog,
which includes ‘climate politics’,
may interest you:
http://www.elOnionBloggle.Blogspot.com
At least there is a 10-11 years up/downswing in the temperature of about 0.25 °C.
http://www.woodfortrees.org/graph/uah6/plot/uah6/mean:37
Of course, the temperature swing is not parallel to the sunspots ors Total Solar Irradiation, but we have learned in the article, that ionisation depends on the magnectic field of the sun.
As Dr David Evans explained, there could be a delay of about 10-14 years between TSI and Force X, possibly the magnetic field.
Plus, there are other signals in the temperature graph, as ENSO and Vulcanoes.
Leif will be linking and quoting himself all over the place on this one.
Thank you Dr. S.
I know that some really fancy GCRs have been observed, at totally astronomical energies. I remember from 60 or so years ago a photograph of a GCR track in a stack of photographic plates, that seemed like it was almost a foot thick, that some courageous team of individuals, had laboriously studied to identify (if they could) each and every daughter and grand-daughter tracklet, as to its particle species, and its energy, which they then totaled up to some huge energy in the 10^22 to 10^24 eV total proto-particle energy.
I used to joke that that giga-giga track was a half inch bolt that fell off some spaceship passing by earth, at near light speed.
I have always felt that local (earth and sun) magnetic fields could influence lower energy charged particles mostly from the sun, and steer them towards some more polar final destinations, but that a lot of GCRs were just too energetic to be budged much by local magnetic fields, but I wouldn’t have picked 100GeV for a typical GCR.
As I recall, such GCR photographic plate stacks were (are ??) exposed while in controlled electric and magnetic fields, so that individual tracklets could curve here and there depending on the charge and velocity of that particular particle that left it. Of course sometimes an intermediate particle is uncharged, and the track just vanishes, to be recommenced at some other place, which might be hard to identify.
Those plate surveyors must have (had) some enormous patience.
G
Extremely high-energy cosmic rays exist but may not come from our galaxy and are extremely rare so play no role in regulating the climate.
Indeed very promising (and provoking) about the possible missing link of climate change: Climate change is more related to the sun and sub-atomic particles from exploded stars, i.e. cosmic rays, than to greenhouse gases/CO2. Seems like new empirical evidence (plasma data/sun explosions 2016) is in strong support of Svensmark theory.
A short history of GCR’s and their influence on weather and climate.
http://www.populartechnology.net/2009/10/peer-reviewed-papers-supporting.html#Cosmic
Thank you Henrik Svensmark for your decades of dedication to your work and to Nir Shaviv for his supportive papers written years ago that opened the door further letting the light in.
This can be very important in periods of La Niña. Then the clouds reach from the north to the south. This can increase the albedo of the Earth.
https://pl.sat24.com/pl/wd/world
http://sol.spacenvironment.net/nairas/Dose_Rates.html
Judging by the sea temperature drop in the south, it can be assumed that low clouds are important in cooling the sea surface.
http://www.ospo.noaa.gov/data/sst/anomaly/2017/anomnight.12.18.2017.gif
Why only low clouds ?? Seems like ANY cloud passing in front of the sun reduces solar spectrum radiation at the surface, and hence reduces ocean evaporation, as well as deep ocean solar energy storage (as heat).
Any tine I see the adjective ” low ” with reference to clouds, I have visions of people claiming that high clouds heat the surface, and the higher the clouds the greater the surface heating (by those clouds).
Ergo it’s those stratospheric noctilucent clouds that are responsible for global warming.
Well I think that’s baloney.
G
Because there is high pressure in the south-east Pacific.
https://earth.nullschool.net/#2017/12/19/2100Z/wind/surface/level/overlay=mean_sea_level_pressure/orthographic=-96.26,-17.71,596
I beieve it is that Low clouds (cumulus, cumulonimbus) tend to be thicker and shortwave IR blocking (IR can’t get in) while High Clouds (Cirrus, cirrostratus, cirrocumulus) tend to be thinner, allowing shortwave IR to enter but blocking longwave IR from leaving and reflecting it back to the surface
Why only low clouds ??
Because not even Svensmark himself could find any correlation with the other types of cloud.
So cumulonimbus are low clouds ??
I never would have guessed that.
It still gets instantly cooler with those thinner clouds in front of the sun, and those thinner wispy clouds are just full of holes that LWIR can get out of.
It’s the blockage of incoming that reduces the surface energy (or not).
And the low thick clouds (those thunderheads) also do a good job of reflecting LWIR, so why doesn’t it get warmer.
Well they don’t actually reflect it; they absorb it, and then they re-radiate it isotropically, so about half of it is directed outwards; not inwards.
G
https://youtu.be/qbtdqmcz8hY
George E, as always interesting comments on clouds and their affect at the surface, particularly with regard to ocean absorption of SWR.
Regarding Leaf S comment…”TSI over a solar cycle causes a variation of 0.05-0.10 degrees C. If GCRs as per Svensmark has 5-7 times the effect of TSI, that would translate to a temperature variation of 0.35-0.50 C over a cycle, which is simply not observed, hence the paper can be dismissed out of hand.”
A couple of criticisms; the . 05 to .10 degree variation is not a scientific statement or observation. It is only a calculation of the total solar energy input difference over the earth’s area. This is a description of only one aspect of the input amount and it ignores the WL flux of that input, and where on earth that input is absorbed, atmosphere, ocean depths, and land.
If one takes raw input alone one can say that a huge increase of 90 watts per square meter cools the planet every SH summer. ( As this annual increase in solar isolation annually results in a cooler atmosphere)
Both statements ignore the residence time and absorption location of the input flux. ( Is the energy reflecting before the surface, thereby leaving almost instantly, or entering the oceans for up to a thousand years where a change in flux can accumulate for up to a thousand years)
Due to the same factors, and many other causes of climate change, one would not expect the slightly larger change in this paper to be instantly recorded in GAT. ( As the much larger annual flux produces a negative correlation in GAT)
The next step is to show how variations in the density of the local interstellar cloud (LIC) could produce variations in the density of terrestrial cloud condensation nuclei.(CCN)
The ionized solar wind interacts directly with the interstellar neutrals which flow into the heliosphere. Richardson, et al 2008. Determining the LIC H density from the solar wind slowdown
What would be conclusive would be to determine that the LIC has structure, wavelike or otherwise, and that structure is consistent with variations in density of cloud condensation nuclei.
Nir Shaviv might be willing to assess the prospects of linking the LIC to terrestrial CCNs.
I have the highest regard for Svensmark, and I wish him well. But is he right? Perhaps, but time will tell. But his theory is far better than AGW, which may not have made a single prediction that came true, despite the billions squandered on it. And if he is right, and the future climate proves he is right, then, if there is any justice in the world, he will receive the Nobel prize. I would love to see that day!
Anthony:
“Today, we news of something that….”
I suspect there’s a missing word.
Chris
Fixed. That’s what I get for writing after midnight. 😉
“…if there is any justice in the world, he will receive the Nobel prize.”
A real Nobel Prize, not the one that comes in a Crackerjack box.
Andy, I thought you may appreciate my comment here… https://wattsupwiththat.com/2017/12/19/new-svensmark-paper-the-missing-link-between-cosmic-rays-clouds-and-climate-on-earth/comment-page-1/#comment-2697816
“that would translate to a temperature variation of 0.35-0.50 C over a cycle”
Only if 70% of the Earth’s surface wasn’t water, with a HUGE buffering effect.
It seems to me that Svalgaard is being a bit sulky here. He cannot have it both ways.
If the “official” climate view is that the known effect (allegedly) of CO2 is a 1.2°C increase for doubling the concentration but that this can be increased to 3,4,or even 5° by various forcings that have been calculated but not, as yet, observed there is no reason why cosmic radiation should not work to affect the atmosphere in ways we are not yet sure of.
To dismiss cosmic ray hypotheses out of hand while accepting the (increasingly questionable?) hypotheses surrounding CO2 as near-gospel doesn’t seem very scientific. At least not to this layman. We know clouds are still a puzzle. Svensmark may have found one of the missing pieces. We should surely welcome this research even if it turns out to be wrong.
To dismiss cosmic ray hypotheses out of hand while accepting the (increasingly questionable?) hypotheses surrounding CO2 as near-gospel doesn’t seem very scientific.
Who said that I do that? Get your facts straight before putting foot in mouth.
You apparently don’t know much about Dr. Svalgaard’s scientifically informed views on climate change.
What Lancifer said.
Newminster – December 19, 2017 at 7:52 am
Newminster, are you having a “bad hair” day, ….. had too many Vodka martinis before breakfast ……. or just simply forgot what news forum or blog you were “posting” to?
I honestly don’t believe there is anyone posting their opinions in this conversation that your above two (2) comments would apply to.
HA, iffen Vodka martinis was the culprit, ……. then it is possible that you were responding to your own thoughts and beliefs.
Clouds are only a puzzle if you believe that more clouds will warm the surface. The meteorology text books teach that the higher the clouds, the more they heat the surface; so I guess we blame it on the noctilucents.
But as only one experimenter, I can personally assert that in all of my years of observations, I have NEVER EVER had ANY cloud, at ANY height pass between me and the sun, and have the Temperature (in the shadow zone) GO UP.
It ALWAYS gets colder in the shadow zone, no matter how low or high the cloud is.
So more clouds do not mean more global warming.
BUT ! it is true that when clouds start to form in the sky towards the end of a hot muggy day, those clouds do tend to form at a higher altitude, because the dew point altitude moves up when the surface is hotter. But the cause was the HOT day before hand; which causes both the high cloud, and the warmer night; but that warmer night will still be colder than it was during the day.
It does NOT heat up at night because clouds formed in late afternoon or after sundown; it WILL cool down after sunset, no matter how high those clouds are.
G
In my many lonely all night vigils at my Central Florida plant nursery back in the 1984-1006 years, I had the experience of high clouds raising the temperature by several degrees within minutes.
During radiational cooling events, which are/were the bane of growing, on a commercial scale, tropical plants outside of the tropics, when the sky was clear and the winds at the surface were very light, the temperature will drop to the dew point, particularly in a what is known as a cold pocket which, as it turns out, the area south of Brooksville Florida happens to be.
On these nights, if the dew point was below freezing, or even near that level (the dew point can drop when fog and frost form, plus air can become supersaturated) I was up all night, and there were hundreds of such nights in those years…many every year, from October until April it could happen.
Anyway…that is the backstory.
The relevant point is that I observed directly on many occasions that is and when a streak of cirrostratus or cirrus would materialize over us, riding the jet stream from southwest to northeast, the two to three degree per hour or more drop in temp would not just stop, but the temp would suddenly (and I mean in like a minute or two) jump back upward.
Sometimes it was a short respite, and the high clouds would blow on by, or the streak would move too far north or south, but many other times it would save a whole bunch of money and hassle, although with the limited access to data we had back in those days, I just had to keep an eye out. But at least I could sit inside and just check every ten minutes of so.
Sitting outside all night and turning on irrigation lines and synchronizing a hundred times and zones valves is no fun at all. But it sure beat having our plants die or get damaged.
High clouds (and I suppose low ones too) will not just keep the temp from dropping at night, it will raise it back up when all else remains the same.
I had/have no way to tell exactly where the energy was coming from, I just know what happens when high clouds streak overhead and you are watching the thermometers closely.
Sorry about the typos, but you get the idea.
That date spread should read 1984 to 1996.
menicholas – December 19, 2017 at 10:15 pm
Menicholas, I am sure that what you describe above ……. is pretty much exactly what you thought and truly believed you were observing, …….. but sorry bout that, ….. because that was not what was happening even though it appeared to you that it was.
Menicholas, along with your “trusty” thermometer, …. you should have also kept handy an anemometer ….. and a “wet finger” …… so that you could determine the “wind speed” and the “direction” from which it was blowing.
“YUP”, the blowing in of that “warm air” that your thermometer was detecting.
Nature abhors a vacuum. A rising air column in one locale will create a partial vacuum at the surface (low pressure) and the near-surface air from adjacent locales will rush in (wind) to fill the “void”.
“Menicholas, I am sure that what you describe above ……. is pretty much exactly what you thought and truly believed you were observing, …….. but sorry bout that, ….. because that was not what was happening even though it appeared to you that it was.”
Not only did he believe it … but it also very likely happened.
“High clouds will not just keep the temp from dropping at night, it will raise it back up when all else remains the same.”
I spent countless hous on duty as a meteorologist with the UKMO observing that very thing.
High ice-cloud does indeed raise a surface temp. However it needs to interrupt the steady-state of a temperature flux in order for the temp to rise, otherwise it will just reduce it’s rate of cooling to space.
In my case I talk of road temperatures. In that case the ground depth temps can and often are, higher than the radiating surface. So the flux (warm below>cool above) will raise the temp of the surface when an increase of back-radiated LWIR slows it’s cooling. And Ci cloud does. Sorry it just does. UKMO algorithms have it as a variable in the prediction of overnight RST’s…. because it does.
In Mencholas case also, then there was also a heat flux that flowed (warm to cold) up from the below the surface (and I’m assuming because of the location the, Delta T into the ground was substantial).
Toneb – December 20, 2017 at 7:51 am
Toneb, the lack of good reading comprehension skills causes lots of disagreements and problems on news forums and blogs, especially if the subject is of a scientific nature.
So I implore you Toneb, …….. re-read what Menicholas posted ….. and interpret it as specifically stated, to wit:
Toneb, … high clouds, especially at nighttime, do not contain sufficient thermal energy to be radiating part of it toward the earth, ….. to a concentrated locale (a small patch of ground at a Central Florida plant nursery), ….. to increase the near-surface air temperature 0.001 degree F, let alone several degrees F.
HA, ….. so, high clouds streaking overhead, …… HUH?
Which tells me there is a “wind” that is blowing the air around and those clouds are just going along for the ride.
Toneb, please re-read george e. smith’s above post.
When talking about the influence of clouds there is an implied assumption that we are talking about a stationary column of the atmosphere, into which solar radiant energy is admitted from time to time, and from which LWIR and other band EM radiations emerge.
There is NO heat flow into or out of such a column (from adjacent columns).
So the appearance of clouds in a column means they either formed in that column or they moved in from some adjacent column.
So any heat content of the cloud itself that may enter a column, is of course removed from the adjacent column, so there is no change in net heat in the atmosphere as a consequence of the cloud movement.
So when clouds form in a column, presumably at say no more than 10km altitude (low clouds) any outgoing LWIR from the surface is intercepted by the cloud within about 33.3 microseconds after leaving the emitting (hot) surface , and any reflected component, would be received back on the surface within another 33.3 micro-seconds. But water droplets and ice crystals (in clouds) are very strong absorbers of LWIR radiation so most of the surface emission that reaches the cloud is in fact absorbed in just a few microns of water thickness. It is subsequently re-radiated isotropically and at a near BB Temperature equal to the cloud water Temperature, and no more than half of it is directed (diffusely) back towards the surface.
So there is no way that the return to earth of some outbound LWIR radiant energy can replace the amount of surface emission LWIR radiation that was the source of the cloud return.
So there is no way that cloud returned LWIR radiant energy can stop the exit of such radiation, so it cannot stop the inexorably drop in Temperature over night.
It will cool down after sunset, and it will be colder in the next morning.
Any observed Temperature rise after sunset, can only be due to the import of heat energy from neighboring air columns, and such heat energy cannot be in both places at the same time, so if it enters our column it must have left some other coumn, so there can be no net heating of the surface by the movement of such clouds, no matter what their altitude.
The gulf stream warms northern coastal Europe, by convecting excess heat from the tropics, and if it should be short circuited by fresh water from land melt, that heat will remain in the tropics. And the higher the temperatures in the tropics the faster they cool the earth surface.
G
Thanks, George e., …….. and a “happy” start of Winter 2017 to you.
And don’t be fergettin, …. the Southern Hemisphere ocean waters are getting even warmer and warmer after the Winter solstice …… and their outgassing of CO2 is still accumulating in the atmosphere.
Re George e smith: “But as only one experimenter, I can personally assert that in all of my years of observations, I have NEVER EVER had ANY cloud, at ANY height pass between me and the sun . . .”
As another experimenter I can personally assert that (due to circumstances beyond my control) I have stood outside all through a clear Winter night and watched a basin of water freeze over. Then, between 4am and 5am some clouds came over and the ice melted. (The latitude was 52.3N.)
True!
I have observed similarly that clouds make a change of a few degrees C on minimum T here on a winter night. So, essentially, it is or must be because of clouds being made of GH gas.
Merry Christmas!
“Only if 70% of the Earth’s surface wasn’t water, with a HUGE buffering effect.”
Exactly.
The oceans have 1,000 times more stored heat than the atmosphere. Heat that went into the oceans last century may still be coming out today.
When the temperature of a key area of the tropical Pacific ocean goes up, it warms up the entire global atmosphere………..an example of how powerful this effect is from heat belching out of the oceans.
The main source for ocean heating is solar radiation. Can an increase in cosmic rays result in a big enough increase in clouds to cut solar radiation to make a significant difference in the amount of heat going into the oceans? It’s plausible.
What we would not likely see is some immediate, easy to measure thermal response in the atmosphere that is in phase with the change in cloudiness.
The oceans are constantly moving, mixing, circulating. Warm blobs pops up with no explanation. El Nino’s and La Nina’s emerge from pockets of warm/cool with no long term predictability.
We have longer term/decadal oscillations PDO, AMO, for instance that repeat with unique temperature profiles in certain parts of the oceans but since the sun is providing the ocean with most of its heat, what solar cycle do these correlate to?
So one would also not expect to see the increase in GCR’s from the recently weak sun(only the previous cycle was significantly weaker than the previous ones) and the increase in clouds/reduction in solar radiation, if that was the response to just jump out with an obvious short term finger print that provides the smoking gun metric.
If this effect is significant, it should takes decades to gradually reverse the net heat gains of the ocean from last century to heat losses this century.
How many decades? Probably not a high number but certainly more than 1, possibly as few as 2 but thats a wild guess……………even if this effect is significant.
If we are accumulating heat from greenhouse gas warming at the same time and can’t separate this effect from the theoretical effects of GCR’s, nobody can say the warming slow down was caused by the increasing GCR’s or not………..or whether some of last century’s warming was in part from less GCR’s.
The above discussion is not from somebody that “wants to believe” in the GCR theory. It’s just factual statements regarding the physics of the oceans/atmosphere and knowing enough to know that those who claim they know the GCR theory is invalid because they don’t see the smoking gun……….can’t possibly know………even if it was Albert Einstein making that statement.
who claim they know the GCR theory is invalid because they don’t see the smoking gun
The issue is to what degree the GCR hypothesis explains the climate change we actually observe today. If the effect is hidden [no smoking gun] and may not show up for decades, centuries, or more, it is less relevant to the current climate debate.
If the effect is hidden [no smoking gun] and may not show up for decades, centuries, or more, it is less relevant to the current climate debate.”
This is a good point. As a “lukewarmer” I don’t want to sound like I’m defending a belief is something that might not be there.
However, the effect(if there is one) would not be showing up now from the “slightly” weaker cycles late last century as the difference could just have been less of a contribution towards heating(if there was one).
It’s only with the last cycle that GCR’s plunged enough to make more of a difference(if there is one).
I would guess that if global warming continues at the current rate during this next cycle, then its clear any GCR effect from the previously weak cycle is, like you stated, less relevant to the current climate debate.
We do know that global warming accelerated in the 1980’s/90’s, then slowed down for almost 20 years. What caused this?
We heard that all the extra heat was being stored in the deep oceans. Actually, this is consistent with my position on the oceans having 99.9% of the heat stored in the ocean/atmosphere system.
Maybe this also means we don’t have to worry as much about the atmosphere warming up from increasing CO2 if the oceans, with 1,000 times more heat capacity can gobble it up.
Even measuring an increase/decrease in clouds from GCR’s is not a clear indicator. Warmer oceans increase water vapor……….another greenhouse gas and a warmer ocean with a warmer atmosphere effects cloud cover……….and how that effects global temps depends on the latitude and height of the clouds, for low clouds(high latitude=warming, low latitude=cooling).
One would think that we could see some sort of change in global cloud cover over the course of a solar cycle that repeats in tandem with higher and lower amounts of GCR’s.
Some regions are effected more than others and this correlates with latitude when it comes to greenhouse gas warming. The same is true with changes in regional cloud cover with global warming and the same might be true with the effects of GCR’s on regional cloud cover………..if there is much of an effect.
So looking at “global” cloud cover changes for the evidence of an effect of GCR’s is a good place to search and a good reason to be skeptical of how powerful the effect might be………but still not conclusive evidence.
It’s only with the last cycle that GCR’s plunged enough to make more of a difference(
First of all you have it backwards. Low solar activity means higher GCRs, so no ‘plunge’.
Second, the cosmic ray intensity varies just like [albeit inverted] the sunspot number and the last cycle is not all that special. Here is a ‘best guess’ at the GCR intensity over the past 300 years:
Slides 54-56 of http://www.leif.org/research/Observations-polar-magnetic-fields-and-Cycle-25-prediction.pdf
“It’s only with the last cycle that GCR’s plunged enough to make more of a difference(
First of all you have it backwards. Low solar activity means higher GCRs, so no ‘plunge’.”
Whoops, of course I know this. Sorry for the slip…..was thinking sunspots when that got typed. Thanks for the correction.
“Second, the cosmic ray intensity varies just like [albeit inverted] the sunspot number and the last cycle is not all that special. Here is a ‘best guess’ at the GCR intensity over the past 300 years”
Thanks for the link. I am very surprised that your interpretation is that the last cycle in not all that special.
I look at charts and graphs all day(commodity/futures) and think the last solar cycle does clearly stand out as having the least amount of sunspots and the most GCR’s in a century. The current one looks to follow the same path(but you are the expert).
Maybe by not being special you mean out of the last 300 years but then, most of the global warming has occurred in the last century.
200 and 300 years ago, we also had a cooler planet.
I agree with you, that this last(weak) cycle is similar(not special) compared to weak solar cycles from 100, 200 and 300 years ago. Just looking at your graphs and others, it appears that weak solar cycles occur every 100 years or so.
Do you agree with this?
In the big scheme of things the current cycle is not all that special, and there does seem to be a quasi-cycle of about 100 years. I don’t think that is a ‘real’ cycle in the sense that it has its own special driving force [and memory reside inside the sun or in the position of the planets]. Instead it is probably just a random occurrence [like getting three heads in a row when tossing a coin].
At least, there is a 0.2°C swing in the temperature record, with about the leng of a solar cycle, but not parallel with it.
Forgot the graph:
http://www.woodfortrees.org/graph/uah6/plot/uah6/mean:37
Thanks for sharing so much Dr. Isvalgaard.
I also see your point on the weak solar cycles occurring around every century going back the last several hundred years “possibly” being just random variation with no dependent variable or driving force.
That’s where your expertise comes in handy. We all look for recognizable patterns in data measuring things around us to use for predictive value.
I trade commodities for a living. Just about every trader uses price charts and graphs to interpret trends and patterns, especially repeating type patterns…….to try to predict where the price is going next.
Sometimes patterns repeat and/or predictions are full filled because thousands of humans looking at the same charts and graphs all see the same thing and have the same expectations and act the same way…………a self full filling prophesy.
The sun (and things in the physical world) doesn’t care what we see in a graph because of a unusual statistical anomaly that shows up independent of a cause.
I will give your response/explanation about the weak solar cycles every 100 years recently more weight than anything else.
That was my first thought as well when reading that bit. Imo, the oceans are primary in that which comprises climate shifts. After that is cyclic solar behavior, cyclical lunar effects in relation to the ocean, and surface winds.
Well I was going to start staying up all night to see if I could experience the Menicholas sudden jumps up in Temperature when a cloud passed in front of the (well forget the sun), so what did it pass in front of and then move away so the Temperature went up and then down when the cloud moved away from in front of whatever it was that it was in front of.
I of course omitted from my descriptions of my experience, the effect of actual warm air movements into or out of a region; ie convective flow of heat. I was limiting myself to observations where only EM radiation could be involved, such as if I was inside a microbe proof tent out in the middle of a Antarctic glacier measuring CO2 in the ice.
Now after one of those red hot and humid days, when it gets close to sunset, and the actual air temperature does start to go down, in late afternoon-early evening, even before the sun sets, I have found that the road out in front of my house has already cooled down to almost body temperature, whereas I couldn’t touch it two hours earlier.
So the air temperature starts to go down, and for some reason, that seems to cause the relative humidity to go up, so that even though the air temperature is lower that it was in mid afternoon, the relative humidity is now decidedly higher so it is even more muggy now than it was earlier, but the temperature as measured by a thermometer reading the air, and not the radiation, is still going down. Of course if the relative humidity is going up at the surface and stopping me from perspiring to cool myself, the altitude dependent lapse rate is causing the air higher up to be even cooler than where I am, so the relative humidity up there is even higher than where I am.
Eventually there will be some height where the lapse rate has brought the Temperature down to the dew point, and the relative humidity will be 100%.
At that point, a 100 GeV proton will come along and turn the whole area into a big cloud, that is ready to start raining.
Well eventually, down where I am, the Temperature will also eventually drop to the dew point at my altitude, and it will start depositing dew on any available cool surface, even the blades of grass in my front lawn, so that by tomorrow morning, the lawn will be all wet, and when I go outside to do my morning pre-sunrise calisthenics, I will be bloody cold, as my 37 deg. C body temperature comes into contact with that cold 100% relative humidity air, which sucks 590 calories per gram of heat out of my skin to warm the saturated air by re-evaporating some of that proto dew.
All of that changes, the instant the sun appears over those valley hills around me, and I get hit instantaneously by 0.7 to 1.5 micron photons from the sun, which the salt water inside me soaks up immediately and eliminates the 100% humidity chill I was experiencing up till then.
And it’s not any 240W/m^2 candle that is hitting me, not is it the 1,000 W/m^2 it will soon become, because the sun’s zenith distance may be 70 degrees so it would be circa 300 W/m^2, but eventually much higher. So instead of the temperature heading for 255K or even to 288K, the sun is trying to bring it up to about sqrt(2) or 1.4 times that which is over 400K.
Luckily for all of us, including me, the sun will go down again before it ever gets close to 400 kelvin, and it starts to cool off for another interesting evening.
G
I live approximately 100 miles inland from the Pacific Ocean. Last night around 7 pm temps were sitting around 38 F according to local weather.That was 8 degrees warmer than the previous 2 nights at the same hour. Looking at radar showed why. Clouds had moved in off of the ocean. Last nights low was 32 F as compared to 28 F the night before and 25 F prior to that.
Andy, you may wish to see my comment here. https://wattsupwiththat.com/2017/12/19/new-svensmark-paper-the-missing-link-between-cosmic-rays-clouds-and-climate-on-earth/comment-page-1/#comment-2697816
Yes. Furthermore, there’s something else being forgotten – the Sun’s activity modulates the amount of incoming GCRs that enter the Earth’s atmosphere, but the AMOUNT OF such incoming GCRs is not a “constant,” so the “modulation” will not necessarily be seen as a direct temperature effect, and/or may not be in the expected amount.
For example, if the Sun’s magnetic activity increases and the incoming GCR flux (i.e., outside the Earth’s atmosphere) *also* increases at the same time, the net effect on the Earth’s cloud cover may be unchanged, or even increased as opposed to reduced; if the Sun’s magnetic activity decreases and the incoming GCR flux also decreases at the same time, the net effect on the Earth’s cloud cover may be unchanged, or even decreased as opposed to increased. So the effect can be masked (by the amount of GCR flux available to be “affected” by the Sun’s magnetic activity) as well as “time-shifted” by the oceans.
Combine those two things with all other climate influences, which we have most certainly not identified, observed, measured, etc. over any meaningful time period, and dismissing GCR as a climate factor out of hand by pointing to a missing, instant temperature effect is a bit premature.
As skeptics have always said, what matters most is what the IPCC and GIGO modelers ignore, ie clouds.
The best they can do is “parameterize” clouds, ie assign a fudge factor which they pick out of thin air, all the better to support their erroneous assumption that CO2 matters more than solar activity. Same as they base their models on unphysical assumptions about feedback effects, not in evidence.
Consensus climate science is a thoroughly corrupt fr@ud from start to finish, including not just the worse than worthless models but the cooked book “data sets”. The charlatans who have intentionally perpetrated this criminal c0nspiracy, costing the world tens of millions of lives and tens of trillions in treasure, should be behind bars for the rest of their miserable existences.
Agreed. a their argument essentially boils down to “we can’t otherwise explain the (recent) warming, so it must be CO2 (since we’ve got a theory about THAT).” Pure rubbish/argument based on ignorance, and ignores inconvenient portions of the Earth’s climate history where high (and increasing) CO2 levels could not prevent the climate from plummeting into a full-blown glaciation. Paleoclimate data shows that CO2 level has nothing to do with the Earth’s temperature on geologic time scales (no correlation, and with significant episodes of REVERSE correlation), and on shorter time scales, that temperature drives the CO2 level – NOT the other way around.
Well they are chipping away that “history” just like the Temps, the Ice and the Sea Levels.
Now they are saying the Ice Core Samples are corrupted by Bacteria, se the latest post on here.
They will re-write histroy as many times as it takes to make their story hold water.
Ugh. The “Ministry of Truth” lives.
The battle over this paper will soon be waged in press and peer-review.
Cook is already at it , claiming this ‘proves ‘ the main claim of climate ‘deniers ‘ is all lies .
What ever else he gets for Christmas , he going to need lots of fresh straw to make up all he has used in creating industrial levels of straw dummy arguments over this paper.
Variations in the Sun’s magnetic activity alter the influx of cosmic rays to the Earth.
Thanks for the report. It makes sense to me in a way that it also make sense to me to believe that the trails left by aeroplanes can send radiation back to space and might not be so innocent as we think.
Let us also not again confuse the issue here of high solar activity (i.e. high SSN) and the sun’s magnetic activity. High SSN corresponds with low solar polar magnetic field strengths when looking at the absolute values of that parameter, i.e. [….] (always positive)
http://oi63.tinypic.com/2ef6xvo.jpg
From my own data set I have been able to correlate the solar polar magnetic field strength with that of incoming heat; the proxy I used for that is maximum temperature. I found similar results when I used minimum temperature as the proxy. In this respect I cannot fault the report.
There is a 43 or 43.5 year period of declining solar polar magnetic field strengths followed by a 43 or 43.5 year period inclining solar polar magnetic field strength. I am not sure of the writers of the report have already picked up on that as well.
So weaker solar activity makes for more clouds and drives surface cooling. That’s one hell of a positive feedback, I don’t believe it for one moment.
Exactly. The flaw in the logic is assumption that the elements are positive or negative Feedbacks. This is chaos, they can be BOTH. Until you make a model where Feedbacks are sign neutral, GIGO.
Feedback? Cause and effect you mean?
For feedback you have to be at the IPCC, which needs large positive (!) feedback to create their alarming warming.
Yogi,
Not a feedback effect, but a cause and effect. What this result adds is the effect of GCR-induced ions on aerosol growth.
That increasing aerosols and CCNs enhances cloudiness and albedo is not in doubt. It has not only been achieved experimentally in the lab but directly observed in nature, in this case with drones:
Simultaneous observations of aerosol–cloud–albedo interactions with three stacked unmanned aerial vehicles
https://www.ncbi.nlm.nih.gov/pmc/articles/PMC2396670/
Abstract
Aerosol impacts on climate change are still poorly understood, in part, because the few observations and methods for detecting their effects are not well established. For the first time, the enhancement in cloud albedo is directly measured on a cloud-by-cloud basis and linked to increasing aerosol concentrations by using multiple autonomous unmanned aerial vehicles to simultaneously observe the cloud microphysics, vertical aerosol distribution, and associated solar radiative fluxes. In the presence of long-range transport of dust and anthropogenic pollution, the trade cumuli have higher droplet concentrations and are on average brighter. Our observations suggest a higher sensitivity of radiative forcing by trade cumuli to increases in cloud droplet concentrations than previously reported owing to a constrained droplet radius such that increases in droplet concentrations also increase cloud liquid water content. This aerosol-cloud forcing efficiency is as much as −60 W m−2 per 100% percent cloud fraction for a doubling of droplet concentrations and associated increase of liquid water content. Finally, we develop a strategy for detecting aerosol–cloud interactions based on a nondimensional scaling analysis that relates the contribution of single clouds to albedo measurements and illustrates the significance of characterizing cloud morphology in resolving radiometric measurements. This study demonstrates that aerosol–cloud–albedo interactions can be directly observed by simultaneous observations below, in, and above the clouds.
For this to be a feedback, the clouds would need to drive the sun cooler – so clearly this is NOT a feedback.
Feedback is based on result, not on cause. So this IS feedback.
A directly amplified effect then. But with weaker solar we see a warmer AMO, that’s a powerful negative feedback, which isn’t being driven by changes in cloud cover.
Yogi Bear – December 19, 2017 at 3:26 am
Shur nuff, ….. Yogi Bear, ….. that is what the hypothesis claims, …… but not EXACTLY the way you stated it.
What you should have stated, …. to disagree with, ….. was that “a weaker solar activity PERMITS more clouds to form which in turn drives surface cooling”.
And the way that is theorized to work is:
1. as the magnetic activity of the sun decreases, the influx of Galactic Cosmic Rays (GCR’s) into the earth’s atmosphere increases;
2. the influx of cosmic rays, which are high-energy particles from exploded stars, knock electrons out of air molecules, thus producing ions, which are positive and negative molecules in the atmosphere;
3. the role of ions in the atmosphere accelerate the growth of the small aerosols into cloud condensation nuclei – seeds on which liquid water droplets form to make clouds;
4. and the more cloud cover there is, ….. the lesser solar irradiance striking the surface there is, ….. and the more condensation (rain & snow) there is, …… with the result being the cooler the earth becomes.
But solar magnetic activity has weakened since the mid 1990’s in the same time frame that tropical cloud has reduced. That’s a negative feedback.
http://www.climate4you.com/images/HadCRUT3%20and%20TropicalCloudCoverISCCP.gif
Yogi Bear – December 19, 2017 at 1:13 pm
YUP, but the “tropical cloud cover” they were tracking/measuring resided totally within the bounds of
latitude 15N to 15S of the Equator as denoted on your cited graph.
And that inclusively cited 30 degrees of the earth’s surface is not a very large area compared to the total surface area of the earth ……. as you can surely see via this factual graphic.
YB, cloud cover over the remaining 150 degrees of the earth’s surface can prevent a lot of “warming”, or conversely, can permit a lot of “cooling”.
History records horrendous rain events, tremendous flooding events and ten-of-thousands of human deaths in northern Europe, due to said flooding during the years of the LIA.
Read the section titled ….. Frequency of Storms at this site, to wit:
http://www2.sunysuffolk.edu/mandias/lia/little_ice_age.html
Or additional warming.
http://www.climate4you.com/images/CloudCoverTotalObservationsSince1983.gif
More sunshine hours since 1995 means less cloud cover.
YUP, and conversely, ……. less sunshine hours usually means more cloud cover.
Well obviously, but the reverse has happened since solar weakened.
This paper needs to be thoroughly peer reviewed and then the theory rigorously tested. Unlike the AGW crowd, we want the theories we support to be critically tested.
You can read the full set of peer reviews, responses by the author, and further exchanges by looking at Supplemental Information. As opposed to the rapid (and useless) responses by some posters here, the reviews are knowledgeable, detailed, focused, and objective, and the responses were to the point. The process resulted in a better paper,
Apropos comment.
I have asked various physicists on the problems/various success rates of cloud seeding strategies for supposedly similar conditions if they ever took into account varying cosmic ray levels. It was never mentioned in CSIRO reports on Cloud Seeding; has anyone seen such a reference? If not a study matching cosmic ray flux with tens of thousands of Cloud Seeding Ops/experiments world wide should throw up some clues.
Also, what about field experiments conducted at both poles? What do they show? Since the South Pole has the galactic centre in constant view and the North Pole never has it in view, there should surely be a difference in the cosmic ray flux being funnelled down the Earth’s magnetic field at each pole. The South Pole would receive a greater flux because a much greater proportion of the galactic mass is in permanently in view.
It would then follow that there should be a greater production of aerosols over the South Pole at all times, regardless of the underlying ups and downs in solar activity (but see caveat in the last two paragraphs, below). In other words, both North and South Pole would experience ups and downs in aerosol production, in step with solar activity, but the South Pole production rate would always be higher.
This may also apply to N Hemisphere/ S hemisphere differences but I’m focussing on the poles because of the magnetic funnelling aspect and I know NASA sends up balloons to measure the cosmic ray flux over Antarctica.
The galactic centre, as defined by Sagittarius A* is at Declination -29 so the latitude line of 29° south rotates under it and all areas above 61°N are in the galactic centre shadow (but not in the shadow of the whole disc extended beyond and either side of the galactic centre). There should still be a significant difference though.
https://en.m.wikipedia.org/wiki/Sagittarius_A*
But I’ve never heard of such a difference in cosmic ray flux at the poles. Moreover, if there is no disparity between nucleation/ aerosol formation between the poles (with or without an active sun) it may cast doubt on the theory.
But Antarctica is a highly elevated land mass and the Arctic Ocean is a variable-coverage ice sheet at sea level. So the atmospheric dynamics are different to start with, eg vertical pressure profile, precipitation. Antarctica is especially dry and windless at its centre, hence hosting a remote telescope that monitors the galactic centre- it’s the clearest place in the world for astronomical observations (see Ridge A on Wiki).
Perhaps such atmospheric differences would smudge any disparity signal due to a lack of available water vapour. Also, Earth’s axial tilt means the South Pole is titled towards the sun in December (along with 6% enhanced TSI due to perihelion passage) and the North Pole gets its sunward tilt in June. That might introduce the potential for an annual smudging of the sweeping action of the sun’s magnetic field and confounding any hypothesised polar flux difference.
You answered your own question, no water = no clouds.
The south pole figures exists thanks to icecube, lets show an interesting calibration of the observatory
http://icecube.wisc.edu/icecube/news/img/news_attachment.file.9dc4334f53b09087.6d6f6f6e5f736861646f775f3735302e706e67.png
paper
http://icecube.wisc.edu/news/view/131
That is the moon shadow moving across the detector blocking the cosmic rays measured and produces a 6 sigma variation 🙂
If you want one from tibet ARGO-YBJ also has the same calibration
http://inspirehep.net/record/918980/files/figs_icrc0226_fig02.png
Leif Svalgaard’s argument is certainly relevant, but not decisive. If the observed temperature changes are smaller than would be expected from Svensmark’s theory, then it is possible that another, as yet unknown effect that occurs downstream of or in parallel to it could partially cancel Svensmark’s mechanism.
Svensmark’s mechanism is believed to be “strongest in tropical marine stratus clouds” according to the above article. That would mean the mechanism is strongest at preventing short wave energy absorption by the ocean, not the atmosphere so, much of the effect would be smoothed and lagged on the atmospheric temperature over land where most data on temperatures are compiled. The temperature changes in the ocean would be far harder to pick up and assess. It’s still, the oceans at the heat and my homework.
More then that… https://wattsupwiththat.com/2017/12/19/new-svensmark-paper-the-missing-link-between-cosmic-rays-clouds-and-climate-on-earth/comment-page-1/#comment-2697816
Thank you, Dr. Svensmark and Prof. Shaviv, for your great efforts
This study will be the final nail in the coffin for AGW.
Nobel prize material.
Really? How many studies discussed on this site were the ‘final nail’? 🙂
IPCC scientists pooh-poohed natural variation in climate as insignificant until the most recent report. Sceptics had been presenting the variety of notable variations without much appreciation until the terrible “Pause” in temperatures (also a “discovery” of sceptics) of two decades during which time CO2 rose 35% could only be explained by natural variation that easily overwhelmed CO2 effect. The CO2 mechanism would, perforce, therefore be proved to be weaker than thought. This battleground wasn’t going to be surrendered by warming proponents too graciously.
They already had had to cede ground on the possibility of multiple celsius degrees of warming per century and switched strategies to bemoan the terrible effects of 1.5C increase when it was as clear that nothing more than this was even possible after all.
The big crunch would be a return to a lengthening Pause or decline after the 2016 El Nino (another of the nat variations) which would further erode the possible contribution of CO2 as a game changer: click on this graphic for the status of ENSO and reflect on the heating effect FROM the El Nino 2016 and what a protracted La Nina could do to temperatures ahead!
http://www.bom.gov.au/climate/enso/monitoring/nino3_4.png
So, how is that peace prize working for you? Gore is discredited, Pauchari too. In the mean time Mann, who faked winning it, lost it completely. Thanks for the reminder. Svensmark will be laughing last.
I seem to remember an article postulating that most outdoor paintings made during the Maunder Minimum had dark clouds as a background.
There was also an article on this site about how clouds didn’t exist until after the Industrial Revolution because Medieval paintings didn’t have clouds in the sky.
Woods Hole needs to be defunded….
http://www.capecodtimes.com/news/20171218/nonprofit-group-pushes-to-keep-falmouth-turbines-spinning
This fella Woodwell is one of the first major BS artists….
https://www.theclimatetimesus.org/essays/dr-george-woodwell-climate-science-pioneer-woods-hole-research-center
“Woods Hole” need to be differentiated. There are three “Woods Hole” entities. There is the village of Woods Hole, MA. There is the fairly well-respected, mainstream* “Woods Hole Oceanographic Institution.” And there is the relatively new “Woods Hole Research Center,” often confused with the latter, which I suspect was the objective, to ride on the reputation of WHOI. WHRC may be privately funded; I’m unsure to what extent.
* I believe they may have sipped the KoolAid, but not gargled it, as does WHRC.
I don’t really understand the claimed importance of this new paper. I too saw an embargoed copy, and I came to the same conclusion as Dr. Leif. Here was my comment when I read it a couple of days ago.
They say it MIGHT cause an effect, viz:
That’s the best they’ve got? It may be relevant? Interesting, but …
I have the same problem with this paper as with a whole host of other studies—where’s the beef? IF this were actually a significant factor in climate we would see ~11-year cycles in something—tropical clouds, the marine layer, rainfall levels … but they don’t point to anything like that.
I did an analysis a while back to see if sunspot-related phenomena had any effect on clouds over the US. I found nothing. Doesn’t mean there isn’t something, just means it’s not visible in the US cloud data.
So, the search continues. Me, I’m not much on theory, I’m a data man. Many a beautiful theory has wrecked on the reef of observations. If you think that cosmic rays are having an effect on some given dataset, post up a link to the dataset, I’m happy to take a look.
But so far … bupkis …
w.
[quote] IF this were actually a significant factor in climate we would see ~11-year cycles in something—tropical clouds, the marine layer, rainfall levels … but they don’t point to anything like that. [/quote] We normally have a big ice-skating event during the solar dips in the Netherlands.
https://imgur.com/XYIkmEa
Hah! Been there, done that! During my Fulbright year at T U Delft, ’62-’63, gang from the Lab skated to a canal-side tavern to tip a few. Great fun! Returned by car.
We do see closely coupled solar activity and water level in at least one body of water: Lake Victoria in East Africa. See this WUWT piece: https://wattsupwiththat.com/2017/07/03/closely-coupled-solar-activity-and-sea-level/
I went looking for the solar cycle effect causing this in the stations around Lake Victoria, and like Mr Essenbach in his fruitless search of cloud cover in the US, couldn’t find it. But the phenomenon exists. And it is big. Bigger than big, stronger than strong. And given that it works at Lake Victoria it is probably everywhere to at least some extent, just masked by local variability.
Especially, as you said: “If we take out the period of non-correlation…”.
Self-Styled Data Man,
Why are you so averse to data?
You refuse even to read any of the hundreds if not thousands of papers by real scientists finding the effects on lower atmospheric and oceanic phenomena of solar cycles, which have been well established over the past two hundred years of observations.
Here are dozens of references from Russian and Western scientists and the citations of their studies, reviewed in “Solar activity and cosmic rays: Influence on cloudiness and processes in the lower atmosphere (in memory and on the 75th anniversary of M.I. Pudovkin)”:
https://link.springer.com/article/10.1134/S0016793209020017
You can’t learn all that has been discovered about the effects of solar activity on climate if you’re afraid to do even the most elementary literature search. You can assert there is no evidence all you want, but don’t expect anyone to credit your claims until you actually educate yourself, since you never studied atmospheric physics or any other relevant discipline formally in school.
Easy, Gabro, taking the field of study may not be a good suggestion these days!
Gary,
Basic physics, chemistry, geology, biology, oceanography,even meteorology, are still valid in most schools, despite CACA infection.
Are you really looking for a proof in literature, not in measured data?
I agree. As to observations of GAT over short periods, well this is my basic response to Leif S simple objection…
https://wattsupwiththat.com/2017/12/19/new-svensmark-paper-the-missing-link-between-cosmic-rays-clouds-and-climate-on-earth/comment-page-1/#comment-2697816
Curious George
December 19, 2017 at 11:02 am
Apparently you are unaware that the term “scientific literature” refers to the whole body of scientific papers on a subject or discipline. I hope that you are kidding.
Willis,
I remember your work in searching for Solar Cycles, in fact you inspired me to set about on my own quest. So I took the RSS binary satellite data and ran a spectral analysis on longitude bands from 1978 to Mid November 2017 and the Solar Cycles clearly show up in certain latitudes in the Lower Stratosphere and much to my surprise show up in the Lower Troposphere (with the exception of Cycle 21). One could argue that 38 years (456 Samples) of data lacks enough samples to localize a 10+ year cycle, but I feel pretty comfortable with the dataset. I have used far less samples in Spectral Decomposition applications to help people find lots of oil and gas.
https://climate817.wordpress.com/2017/12/19/solar-cycle-signals-in-the-stratosphere/
People get sampling wrong all the time at low frequencies and limited window lengths, because it is not covered well in the literature.
You do not have 456 samples. You have 38/10 = 3.8 samples. Not statistically significant. You typically need 5 samples to resolve anything (especially nearby cycles), partly due to the the low frequency corollary of Nyquist (you can’t make a perfect window filter).
Window length matters. A LOT.
I’ll be interested in solar variations versus various latitude temperatures when we have 55 years of satellite date (2034), if I’m still around. If I can make it to 5 times the PDO (5*70 = 350, or Year 2329 AD), I’ll be interested to see the various multi-decadal oscillations and how they interact.
How’s that longevity research going? I bet if we put trillions into that, instead of climate crap, we could actually collect enough data to know something about the climate.
Somehow, Dr. Spencer needs to be made semi-immortal.
Peter
Peter,
A piece of a low frequency sign wave still has a correlation coefficient that stands out above the noise. There is plenty of data, I can make any synthetic dataset with an embedded low frequency component in it and under sample it and the spectral features will still exist. 38 years of data sampled every month is more than enough data to see an 11 year cycle, as my data clearly shows, I think you need a refresher course.
Peter,
The problem with all data is that there is always some disruptive natural cycle, for instance the Stratosphere lacks the interference of ENSO cycles, but still has massive interference from El Chichon and Pinatubo which happen to be around a decade apart. Which will make any correlation with any amount of data be suspicious. The surface data has so much ENSO related interference as well as volcanic episodes that I doubt any amount of data will ever allow an accurate determination of any solar induced perturbations. You may be right, it is a pointless endeavor that’s energy would be better served attempting to solve other problems.
Solar cycles have been found in data over thousands of years, if not longer.
Really? I missed the part in your article where you did a Monte Carlo simulation to actually establish the noise floor for the 9-13 year period.
Here’s an article that goes into detail about how to determine whether a natural signal rises about the noise floor. They definitively show that in certain SST latitudes the El Nino cycle is statistically significant.
Said El Nino signal, I note, is missing in the Stratosphere data. I’m curious as to why.
http://paos.colorado.edu/research/wavelets/bams_79_01_0061.pdf
You’ll note the lower the frequency the higher the noise floor.
I also note your wrote custom code, and didn’t release it.
The classic frequency analysis mistake (second only to “never start a land war in Asia”) is to forget to window your data. (right Willis? 🙂 I can’t determine whether you did so. If you did not then the signal levels are so low that they are probably masked by the ringing from the resulting beginning-end discontinuity that you get when you don’t window your data.
Furthermore, you’ve got about 3000 grid squares. 180 in each vertical column. Your data set is so small that a large part of the signals you see are just random variation. With 3000 grid squares auto-correlated data is going to give you a lot of patterns that look significant but in fact are just random.
It would help to have a mechanistic description of why some latitudes are strongly correlated with the solar cycle and some are not correlated at all. Why’s that?
Peter
Yes, we all know you are a “data man” , Willis. And we like for that. Well the data here show that so much unknown business is going on on the atomic level in gases (and perhaps also in fluids?), with the varying influx of cosmic rays and the consequent huge variation in ionisation levels.. That to me is the most interesting part of this paper. It reminds me of Leeuwenhoek’s discovery in the 17th century : here was something nobody had ever known about before. This added a dimension to science which revolutionised it. Are we now on the threshold of some similar revolution?
Even as a kid in the late 70’s I knew that the solar cycle had a significant effect on Earths atmosphere.
“An unexpected rise in the number of CMEs and other radiation slamming into Earth heated our atmosphere so much that it expanded. This increased the drag on Skylab and began to pull it out of orbit faster than Nasa had reckoned.”
https://www.theguardian.com/science/across-the-universe/2013/may/13/skylab-40th-anniversary-space-debris
Willis–
The 11-year cycle (of brightness) has been observed on Uranus and Neptune and attributed in part to induced ion-enabled nucleation due to increased cosmic rays at low solar activity.
https://phys.org/news/2017-12-sun-remote-planet-uranus-brightness.html
The evidence is very weak. Here are the actual data:
http://www.leif.org/research/Uranus-Brightness-Solar-Cycle.png
Cosmic rays cancelled or reinforced by semi-millennial solar cycles (TSI) are geophysically episodic, short-term oscillations, marginally germane to 102-kiloyear (KY) Pleistocene glaciations, climate cycles interspersed with 10 – 15 KY interstadial remissions.
Astrophysical factors aside, long-term plate tectonic continental dispositions rule: Since the Cretaceous/Tertiary (K/T) Boundary some 65 million years ago, Earth’s mountain-chain Oligocene orogenies have linked North and South American landmasses to wall off Eastern from Western Hemispheric atmospheric-oceanic circulation patterns.
Self-evidently, this process has produced periodic Pleistocene ice-times due to persist another 15 – 35+ million years before Wegener’s “continental drift” opens global channels once again. The fact that this phenomenon has not occurred since pre-Cambrian eras near 1,000-million years ago appears indicative.
+100 . Geographic, topographic, tectonic and orbital mechanics
There have been other ice ages of various lengths during the Phanerozoic Eon, such as the relatively brief Ordovician/Silurian and long Carboniferous/Permian ice houses.
..TSI over a solar cycle causes a variation of 0.05-0.10 degrees C. If GCRs as per Svensmark has 5-7 times the effect of TSI, that would translate to a temperature variation of 0.35-0.50 C over a cycle, which is simply not observed, hence the paper can be dismissed out of hand….
Dr. Leif Svalgaard
Modelled climate sensitivities of 2 or more due to CO2 would translate to a temperature increase of 0.2 – 0.3 C per decade, which is simply not observed, hence the models can be dismissed out of hand…
Dodgy Geezer
Ouch!
It does raise the issue of the different levels of ‘proof’ (falsification). An unobserved ‘green house gas’ effect – is believed to the level of expenditure of trillions of dollars; yet Svensmark’s hypothesis is held to a totally different level of ‘proof’.
One could almost be persuaded that the expenditure already made and to come makes the falsification more difficult to accept.
My thought, exactly. I still find GCR’s more compelling and logical than CO2, at explaining aspects of global climate change. If climate change was actually science, we would either dismiss both GCR’s and CO2 out of hand, or admit we are clueless and keep looking everywhere for answers. Either way, it is abundantly clear that CO2 is not, and never has been, the primary driver of climate change.
Actually, a sensitivity of 2 K per doubling, with a doubling every 140 years (based on current rate of increase), gives a response of .14 K per decade. We are seeing a *transient* response of about that magnitude; the equilibrium sensitivity would have to be higher. So a sensitivity of 2 K is likely to be on the low side.
That assumes that the only thing that impacts temperature is CO2. An assumption that has been proven faulty.
Secondly, to get that high an increase you have to end with the most recent El Nino.
Dodgy science at best.
Response to CO2 is logarithmic. All potential temperature is just about done, meaning that another doubling will only produce 1/2 the effect.
Glenn yancey December 19, 2017 at 2:41 pm
Response to CO2 is logarithmic. All potential temperature is just about done, meaning that another doubling will only produce 1/2 the effect.
That assumes CO2 concentration rising linearly – its rising exponentially.
You assume infinite carbon based fuel resources.
We do not have enough carbon based fuel to get us much past 1000ppm, assuming no negative feedback (such as plant growth or other carbon fixation).
So basically, only 1.5 doubling left.
Peter
“tony mcleod
December 19, 2017 at 4:20 pm
That assumes CO2 concentration rising linearly – its rising exponentially.”
An increase of 2 ppm per year during the last 20 years is linearely:
http://woodfortrees.org/graph/esrl-co2/plot/esrl-co2/last:240/trend/offset:-10
Peter Sable December 19, 2017 at 9:02 pm
That depends on whether or not you class “Methane Hydrates” as Fossil Fuel.
Read “Chill” by Peter Taylor (an environmentalist) – more than half of the supposedly observed warming can be traced to solar influences alone, according to his references (as of 2009). Since that would be only *known* solar influences (and I sincerely doubt we have adequately studied the complete influence of the Sun directly and indirectly, on our climate), and since the “data” is such utter crap, the remainder can probably be attributed to a combination of (1) unknown/unquantified natural influences and (2) data errors and/or manipulation, leaving *nothing* to “attribute,” without any empirical evidence in support, to CO2 levels.
“That assumes CO2 concentration rising linearly – its rising exponentially.”
In which case it is very unlikely that it is anthropogenic emissions that are the cause of that exponential rise.
Global Carbon Emissions Are Rising Again after 3 Flat Years
https://www.scientificamerican.com/article/global-carbon-emissions-are-rising-again-after-3-flat-years/
I’d agree with that 100%. And paleoclimate records showing NO correlation between CO2 and temperature on geologic time scales, and which include episodes of REVERSE correlation, also tell us that the models, and the theory that higher CO2 levels will necessarily lead to higher temperatures to be similarly dismissed out of hand.
If we want to pile on, the ice core data consistently show CO2 FOLLOWS temperature, up AND down, not the other way around – and for those who buy into the BS explanation delivered with a straight face by the Eco-Fascists (i.e., that AFTER the ~800 year time lag is “made up,” that CO2 “contributes” to the warming), there is (a) no increase in the rate of warming shown after the lag has been “made up” and both temperature AND CO2 are rising, and (even if one could argue that the scale of the graph can’t show enough detail to “see” the “contribution”) furthermore temperature starts FALLING (1) when CO2 is at its HIGHEST level, and (2) WHILE CO2 LEVELS CONTINUE TO RISE, which shows with complete clarity that CO2 level is MEANINGLESS to the Earth’s temperature, and CAGW (and for that matter, ANY AGW) can be dismissed out of hand.
As I like to say, “Observation TRUMPS theory.” ;-D
+1000
LETS TALK ABOUT THE SUN AND HOW IT MIGHT CHANGE THE CLIMATE
Areas of importance which are neglected in large part are the solar wind speed ,the global electrical circuit, and galactic cosmic rays . Actually they are all tied to one another.
When the solar wind decreases the intensities of galactic cosmic rays (GCR)that are allowed to enter the atmosphere will increase and this this in turn intensifies the global electrical circuit.
It has been shown through actual data on a short term basis (days) through the monitoring of Forbush decreases and SEP events which stands for solar particle events both of which originate from the sun , that the electrical circuit decreases following a Forbush decrease which is a lessening of galactic cosmic rays ,while it increases following an SEP event.
This has big implications for solar /climate relationships on a longer term basis because it has been shown through these day to day events that when a FORBUSH DECREASE take place the global electrical circuit decreases which results in a decrease in global cloud coverage and cyclonic systems weakening while the opposite follows an SEP event.
This then can be applied to what happens to global cloud coverage and cyclonic systems over a long term basis when the sun enters a prolonged solar minimum period of activity which lowers the solar wind allowing more GALACTIC COSMIC RAYS to enter the earth’s atmosphere which increases the strength of the global electrical circuit which has been shown on a short term basis(through actual data ) to increase cloud coverage and strengthen cyclonic systems.
CRITERIA NEEDED
350km/sec or lower is needed for the solar wind speed in order to get GCR counts high enough( at least 6500 units) which then will impact the global electrical circuit through strengthening it on a long term basis which then would promote greater global cloud coverage and strengthen cyclonic systems. Higher albedo for sure /and perhaps more precipitation.
In the meantime EUV(100 units or less) /UV light is on the decrease which will effect the atmospheric circulation(more meridional) and sea surface temperatures respectively.
All this is going to lead to global cooling.
Getting back to the solar wind and it’s effects upon the climate these two values are needed in my opinion which are again a solar wind speed sustained over months of less then 350km/sec and a resultant AP index over months of 5 or lower.
Solar irradiance will not be a major player in the changing of the climate it may drop by .15% which would only contribute a .1c to maybe .2c to global cooling.
AS OF NOW GCR COUNTS HAVE BEEN ABOVE 6500 UNITS FOR A FEW MONTHS AND LOOK TO BE INCREASING. READING TODAY 6650 UNITS, AND THE SOLAR WIND HAS FINALLY STARTED TO COME DOWN RIGHT NOW AT 300KM/SEC ALONG WITH THE AP INDEX.
Will this persist and become more common place as we move forward? I say yes and this should in turn effect the climate by cooling it.
Salvatore, as you know, you were put on permanent moderation before because your discussions with Dr. Svalgaard went “over the top” violating blog commenting policy. I’m allowing this comment here, but be on your very best behavior. Otherwise you’ll be in the bit bucket again.
Thanks I am going to be on my very best behavior. Merry Christmas!
Their analysis does not explain the observed reduction in stratospheric ozone above the poles when the sun is active and the more zonal jet stream tracks at such times.
The change in global cloudiness is more likely a result of changes in the waviness of the jets rather than any changes in condensation nuclei. There seems to be no shortage of such nuclei in any event.
Accordingly, this is a more comprehensive proposition:
http://joannenova.com.au/2015/01/is-the-sun-driving-ozone-and-changing-the-climate/
So with a weak Sun when the Hadley cells are weakest in their convection the tropopause (the top of convective movement) rises? This seems counter-intuitive. Similarly, with a strong sun with very active Hadley cells the tropopause falling seems counter-intuitive.
The phrase ‘allowing the tropopause up’ in the referenced post on joanneova.com needs some explanation. Is the effect of increase in ozone that you postulate to increase the temperature of the stratosphere thus changing the lapse rate and therefore inhibiting convection and vice versa with less ozone? Perhaps you should use the lapse rate change as the explanation for the change in tropopause as that would provide the mechanism.
Stephen Wilde
December 19, 2017 at 4:37 am
http://www.cpc.ncep.noaa.gov/products/stratosphere/strat_a_f/gif_files/gfs_toz_nh_f00.png
Check out this picture of the Ozone over the Arctic. My thoughts are that thick Ozone creates a high pressure area, and thin Ozone a low pressure area. High pressure area cold descending, low pressure area warmth rising. What do you think?
Ian,
The referenced post refers primarily to the regions above the poles and not the Hadley Cells.
More ozone in the stratosphere when the sun is less active causes a warmer stratosphere which pushes the tropopause down:
“a cold stratosphere will be associated with a high tropopause (low tropopause pressure), and a warm stratosphere will correspond to a low tropopause (high tropopause pressure).”
from here:
http://journals.ametsoc.org/doi/pdf/10.1175/1520-0442%282001%29014%3C3117%3ATTITPR%3E2.0.CO%3B2
To get the jets to move more towards the equator and so increase global cloudiness one needs a lower tropopause above the poles which occurs when the sun is less active.
Jerome,
You need to distinguish between the convection in the tropopause and convection in the stratosphere. The latter is what affects tropopause heights over the poles. You can have warmer air in the stratosphere pushing the tropopause down but you could have either high or low pressure cells in the troposphere beneath it.
Let’s look at the southern Ozone hole, just two months after the hole peaked.
Oops, it is now higher than every else in the southern hemisphere. In 2 months, it went from scary “hole” to huge “excess”??? Its called making something big out of nothing or out of the normal seasonal cycles.
http://www.cpc.ncep.noaa.gov/products/stratosphere/strat_a_f/gif_files/gfs_toz_sh_f00.png
And the Arctic now has absolutely record ozone levels when it is supposed to be weakened like the south is just not as much. Its called … Fake News or something like that.
Very high pressure can be December 24 in western Canada.
https://earth.nullschool.net/#2017/12/24/0000Z/wind/surface/level/overlay=mean_sea_level_pressure/orthographic=-101.05,53.19,684/loc=-120.711,51.265
Stephan,
You have been stating this for many years now. I find this very intriguing. Decreasing the horizontal/meridional temperature gradient from the greatest warming occurring in the higher latitudes does effect/weaken the polar jet stream(s).
Greenhouse gas warming, by itself could explain this effect………..or, there could be other natural factors that play a role.
How does the greenhouse gas in the stratosphere work?
Well, there was this crazy paper (EOS 2015 Kalifarska), which for all its other faults, came up with the interesting idea that galactic cosmic radiation creates ozone…plausible to me. Ozone is a much overlooked greenhouse gas. Go to Modtran tropical. Zero out stratospheric ozone. Upward flux at 70km increases 3.45 W/m2. Next, zero out tropical surface ozone as well. You gain another 2.13.
Of course, ozone does not completely go away when the cosmic rays wane.

But if you are looking for an effect of cosmic radiation, and clouds aren’t working for you…
Any theory that includes Einstein’s Relativity and helps explain the current Ice Age and it’s cycles is simply a very cool theory (pun intended).
One surmises that even after the next glaciation occurs, the pop media solar folks will dismiss it as not being relevant to global warming caused by humans.
It seems to me the study reported here (and do use the link direct to the research) completely undermines this.
https://www.theguardian.com/environment/climate-consensus-97-per-cent/2017/dec/18/scientists-have-beaten-down-the-best-climate-denial-argument
Griff,
Your link refers to more than one study. You must not have bothered to read Nuccitelli’s drivel, for which I can’t blame you.
Please explain how analyses of climate models can possibly “undermine” actual observations and experiments. Thanks.
“Please explain how analyses of climate models can possibly “undermine” actual observations and experiments.”
————————
Thanks for the prod, but we all know that will never happen. Griff’s job is to throw out drivel and step away, never to engage, while a storm of lucid responses destroys his talking points.
More Guardian non-science, Grifter?
What a silly little fool you are.
Now go and apologise to Dr. Crockford for maliciously attempting to damage her professional standing.
Hmm, I got binned (and still being moderated) for way less than this and was assured “impugning” was not going to be tolerated.
Seems its really just about my point of view afterall.
No, it’s about the way you deliver it, choice of words, and manners. And, no, I’m not interested in arguing about it. Your comments will be approved if they meet comment policy.
So grantologists are now claiming they can model what everyone agrees we cannot model. Sounds like settled science to me!
Griff, I read that article . “Clouds amplify global warming”. I go hot under the collar. So I went outside and waited for a cloud to go over, it helped me cool down…..
I agree with Leif on this one, but for different reasons. Svensmark’s hypothesis doesn’t make sense.
Without making any assumptions, if he is correct then the amount of GCR that arrives to Earth is a big factor in climate change. Probably the most important factor outside Milankovitch orbital cycles. The evidence available does not support this. The Sun is only responsible for about 10-20% of the GCR variability. The amount of GCR that arrives to Earth is determined PRIMARILY by the geomagnetic field that is responsible for about 80-90% of GCR variability on a multi-millennial scale. If Svensmark is correct then the climate on Earth is determined by the geomagnetic field, and geomagnetic field variations don’t look at all like climate variations. They actually go in the opposite direction required by the hypothesis.

The green trend is due to Earth’s geomagnetic variations. Only the very minor wiggles are due to solar wind magnetic variations.
I have posted this in numerous occasions, and so far nobody has showed me why this should not be the case. Therefore I am highly skeptical of Svenmark’s hypothesis. For it to be correct the condensing nuclei would need to discriminate between GCR variation due to solar variability versus Earth geomagnetic variability.
Javier,
Had I seen your prior comments, I would have responded.
IMO it should be obvious that solar activity effects geomagnetism as well as GCR flux directly.
Here’s a good 2010 Review of Geophysics study on the topic, by Gray, et al.:
SOLAR INFLUENCES ON CLIMATE
Abstract
[1] Understanding the influence of solar variability on the Earth’s climate requires knowledge of solar variability, solar-terrestrial interactions, and the mechanisms determining the response of the Earth’s climate system. We provide a summary of our current understanding in each of these three areas. Observations and mechanisms for the Sun’s variability are described, including solar irradiance variations on both decadal and centennial time scales and their relation to galactic cosmic rays. Corresponding observations of variations of the Earth’s climate on associated time scales are described, including variations in ozone, temperatures, winds, clouds, precipitation, and regional modes of variability such as the monsoons and the North Atlantic Oscillation. A discussion of the available solar and climate proxies is provided. Mechanisms proposed to explain these climate observations are described, including the effects of variations in solar irradiance and of charged particles. Finally, the contributions of solar variations to recent observations of global climate change are discussed.
http://onlinelibrary.wiley.com/doi/10.1029/2009RG000282/full
[6] Going back farther in time, various other proxy solar information is available [Beer et al., 2006], as shown in Figure 2. The aa index is a measure of geomagnetic disturbance. It correlates well with both the neutron count rate and the irradiance and also shows good correspondence with the incidence of aurorae, as recorded by observers at middle magnetic latitudes [Pulkkinen et al., 2001]. Higher solar irradiance, lower cosmic ray fluxes, greater geomagnetic activity, and higher incidence of lower-latitude aurorae all occur when solar activity is greater. Cosmogenic isotopes such as 10Be are spallation products of GCRs impacting on atmospheric oxygen, nitrogen, and argon. The time series of 10Be abundance stored in reservoirs such as ice sheets and ocean sediments and of 14C from tree trunks show the 11 year cycle of the sunspot number. This makes sense physically since high sunspot numbers correspond to a strong solar magnetic field, which is the source of the field in the heliosphere that (by virtue of both its strength and its structure) shields the Earth from GCRs. However, geomagnetic activity, low-latitude aurorae, and cosmogenic isotopes all show additional variations that are not reflected by sunspot numbers. The reason for this is that at all minima of the solar cycle the sunspot number R returns close to zero, but the other indicators show that this does not mean the Sun returns to the same base level condition. As a result, there are drifts in solar activity on time scales of decades to centuries that, although reflected in the sunspot numbers at maxima of the solar cycle, are hardly seen in Smin sunspot numbers.
Sorry. Meant “affects”.
The reason for this is that at all minima of the solar cycle the sunspot number R returns close to zero, but the other indicators show that this does not mean the Sun returns to the same base level condition.
But it does. E.g. Slides 85, 90 of http://www.leif.org/research/Observations-polar-magnetic-fields-and-Cycle-25-prediction.pdf or http://www.leif.org/research/EUV-Magnetic-Field.pdf
Gabro,
I have read the Gray et al., 2010 review and many other articles, and I am convinced on an important role of solar variability on climate change, just not through the effect of GCR on cloud formation.
This hypothesis has a similar problem to the CO₂ hypothesis. Throughout the Holocene, since the Climatic Optimum, the planet has been cooling. Over the same time, the Δ¹⁴C has been decreasing. Less ¹⁴C production means less GCR reaching the Earth, and according to Svensmark, less nucleation, less clouds and warming. The opposite to the observation. The LIA had a much lower Δ¹⁴C than the Holocene Climatic Optimum. Only when you consider the changes in Δ¹⁴C associated to solar variability there is a good correlation with climate.
To me it is the Sun, but not through GCR. This obviously doesn’t mean they don’t have any effect, just not a major one.
Javier,
There are lots of studies like this from “The Holocene” journal, showing high correlation between colder climate with rapidly increasing 14C and 10Be ratios.
http://journals.sagepub.com/doi/abs/10.1191/0959683604hl688rp
Changes in solar activity and Holocene climatic shifts derived from 14C wiggle-match dated peat deposits
Dmitri Mauquoy, Bas van Geel, Maarten Blaauw, …
First Published January 1, 2004 Research Article
Abstract
Closely spaced sequences of accelerator mass spectrometer (AMS) 14C dates of peat deposits display century-scale wiggles which can be fitted to the radiocarbon calibration curve. By wiggle-matching such sequences, high-precision calendar age chronologies can be generated which show that changes in mire surface wetness during the Bronze Age/Iron Age transition (c. 850 cal. BC) and the ‘Little Ice Age’ (Wolf, Spörer, Maunder and Dalton Minima) occurred during periods of suddenly increasing atmospheric concentration of 14C. Replicate evidence from peat-based proxy climate indicators in northwest Europe suggest these changes in climate may have been driven by temporary declines of solar activity. Carbon-accumulation rates of two raised peat bogs in the UK and Denmark record low values during the ‘Little Ice Age’ which reflects reduced primary productivity of the peat-forming vegetation during these periods of climatic deterioration.
Gabro, the cosmogenic isotope production rate inverse correlation with solar activity and climate conditions says nothing about whether GCRs are involved or not. Other possible mechanisms have better observational support.
All you are doing is building a case for a solar role on climate change, not GCRs.
Okay, then. Cosmic rays are posited to have an influence on cloud formation and –> precipitation levels.
At this point, the Sun is/has been dimming and shows reduced activity levels since its solar minimum in 2006.
However, this was left out of the proposal: the Earth’s magnetic field is weakening (prior to a magnetic pole swap), which allows space/cosmic radiation to erode or otherwise affect the atmosphere. Since there has not been a magnetic pole swap since the last one +/-780,000 years ago, we mere humans don’t know what will happen then. Will we have more volcanic activity? More long-term cold/ice age-style weather? The end of the world? That one didn’t happen last time, but geese and other migratory species may become confused.
Ergo, since this paper’s author proposes that cosmic rays affect precipitation, I’m left with that question: can we expect more rain, hail and snow? And why didn’t he take that into account?
No, what goes up must come down, and precipitation requires evaporation. Cooler temperatures reduce evaporation, and so does reduced wind speeds.
“Cooler temps reduce evaporation” – maybe, maybe not so much. 11/27/2017: 30F, humidity: 88%; 12/1/2017 – 28F; humidity: 88%; 12/3/2017 – 29F; humidity: 92%; 12/9/17: 29F; humidity 92%; 12/12/17: 18F; 62% humidity; 12/14/17 – 19F; 80% humidity; 12/18/17: 40F; 96% humidity.
Some of those readings were during high wind speeds, too.
Precipitation in any area depends on where the moisture load is picked up and what volume was dumped before it reaches a specific area.
And besides that, I’m more interested in how much more UV radiation is going to reach the surface and increase rates of solar-related diseases like skin cancer – stuff like that.
I think the author of the paper means well, but his focus is far too narrow.
Quiet sun means less UV. But still, no more than 15 min on pale skin without sunblock.
As more precipitation is bound up as snow and ice in poleward latitudes, then lower latitudes experience drought. Consider the epochs of extreme glaciation.
But, we may see a change in intensity of events, depending on how stable the wintertime polar vortex is. Time will tell.
Yes. I’m interested in how much effect this will have on wind speeds over populated areas, but I’m not referring to tornadoes. I’m interested in things like direct straight-line winds called derechos, because they ignore geography (and I live on a hill), and other such damaging winds, some of which come right off Lake Michigan. A good reference would be the February 2, 2011 blizzard which shut down Chicago’s northbound Lake Shore Drive during rush hour, and further north where I am left motorists stranded in snow drifting up to the window of their cars. Two people froze to death because of this blizzard’s snow volume and the wind that caused the drifting.
These events seem to be increasing in number, and the volume of snow and/or rain along with them. That’s my real concern, not whether clouds are seeded by cosmic radiation. We really do need to be prepared for these kinds of events instead of just being astonished when they happen. They seem to be happening more and more often, as you’ve indicated, pochas94.
It’s the Sun stupid.
I’d like to see some discussion of space charge. If cloud condensation nuclei have a negative charge they will repel each other and resist raining out. But make the space charge negative and the repulsion is reduced. Tropical thunderstorm activity produces a negative space charge. A teleconnection? This would confound the data but not remove the Svensmark effect. The other thing is lag times, which Dr Svalgaard does not consider. With the oceans involved in the dynamics of climate, it may appear that a single solar cycle does not have an effect although several consecutive cycles will make their effect apparent.
Think about this:
Nobody knows how to model clouds. So Dr. Leif Svalgaard’s opinion on the paper can be dismissed out of hand.
So, this is a very measurable theory. Don’t we have satellites that measure Earth’s albedo? If the theory is true, we should be able to see the albedo go up as sunspots go down. Show me the data.
“Think about this:
TSI over a solar cycle causes a variation of 0.05-0.10 degrees C. If GCRs as per Svensmark has 5-7 times the effect of TSI, that would translate to a temperature variation of 0.35-0.50 C over a cycle, which is simply not observed, hence the paper can be dismissed out of hand.”
GCRs are not only dependent on the cycle though, are they. Unlike TSI, GCRs are dependent on their sources.
So based on that, no it should not be dismissed out of hand, and a poor counterpoint to boot
The topic is also a good reminder of why climate models will probably always be wrong. Clouds form from air that is super-saturated with water vapor. I.e. it is severely out of equilibrium, with no way of consistently predicting when, if ever, it will return to an equilibrium state. A climate model that cannot predict when water will condense is not much use.
Yeahbut… if I want to know whether it will rain on Thursday, I read the weather forecast.
…from weather systems that have already formed.
and climate models have to concern themselves with radiation to space that takes place from (super)saturated air above the tropopause. There are lot of unknowns in the formation of cirrus clouds. Some have suggested they may partly be due to methane oxidation in the stratosphere.
The link has been pretty obvious to anyone with an open mind a even a bit of knowledge of the science for years even decades.
What is appalling is that something so simple has taken such a long time. And that has clearly resulted from the Climate mafia blocking Svensmark and each and every turn. So well done Svensmark for having the time and patience to get this through.
But I don’t. And like the solar link, it is pretty obvious to me that the 1970-2000 warming was regional and directly linked to the reduction in aerosol/cloud forming pollution. Link: http://scottishsceptic.co.uk/2017/04/09/the-cause-of-1970-2000-warming/
So well done Svensmark – it’s superb work, but what I mostly admire is to have the shear dogged determination to have finally got this through the Climate stazi.
I’m sure there is some movement today in the EU and other nations like Canada on how they are going to tax cosmic rays…
+1
Especially those cosmic rays that can be attributed to the U.S. portion of the stratosphere
CRVAT tax
IMO: Toss the make-up of the atmosphere, ocean temps, TSI, cosmic rays, plate tectonics, precession, orbital mechanics, volcanoes, solar storms, abundance of flora, and a few unknowns into a pot, stir well, and the resulting climate/weather will have a poor correlation to any individual component.
We should see the cloud cover in satellite images if we look over a long enough period ? This should correlate to sunspots ?
Are supporters and detractors talking past each other? The time scale on the graph from the paper is in millions of years, evidence against is in decades.
Yes, the graph from the paper.A good place to start.
OK, correlation is not causation.
But causation cannot be involved unless there is correlation, as is shown in the graph from the paper.
Physical experiment is used to show nidus formation in the atmosphere.
My thoughts of the paper’s intent and finding.
The ‘butterfly’ Galactic Cosmic radiation from suprnovae points the direction of climate change, as a car is steered from the driver’s wheel. The car engine, like the heat engine of the earth’s atmosphere, modifies the energy.
The time scale of the GCR is greater than the satellite record.
See https://www.thegwpf.com/cosmic-ray-cloud-climate-link-found/
Nevertheless, Svensmark is right, let us not forget that the surface of the earth consists of 70 per cent of oceans, which serve as a buffer against such minor temperature fluctuations over an 11-year cycle. You could also say, just when it starts to cool down minimally, the sun turns up again. The situation is different in longer periods of time when the cosmic rays become stronger both in the minimum and in the maximum of the solar cycle. Let us just think of the different ups and downs of the warm and cold periods of the past millennia. It is clear that in cold weather the sun was weak, even though modern naysayers blame volcanic activity. Although their climatic impact took little longer than 3-4 years. But maybe it’s different too. It could also be that volcanic events in shallow solar times interact with the solar dysfunction and can increase cloud coverage for a longer period of time.
Tell that to Svensmark. I think he missed the memo. He claims an immediate effect on clouds [which would also make sense physically if there is any effect at all]:
http://www.leif.org/research/Svensmark-Low-Clouds-GCRs.png
(from http://www.leif.org/EOS/0005072-Svensmark-GCR-Climate.pdf)
Unfortunately [as for all spurious correlations] the effect didn’t hold up when more data became available:
http://www.leif.org/research/Cloud-Cover-GCR-Disconnect.png
In addition, solar activity has been decreasing the past half-century [cosmic ray intensity increasing according to Svensmark et al. with more clouds and cooling as result] while temperatures have been rising. So, the evidence is against the GCR-Cloud-Temp idea.
“while temperatures have been rising”…
well…….but there’s a fly in the soup
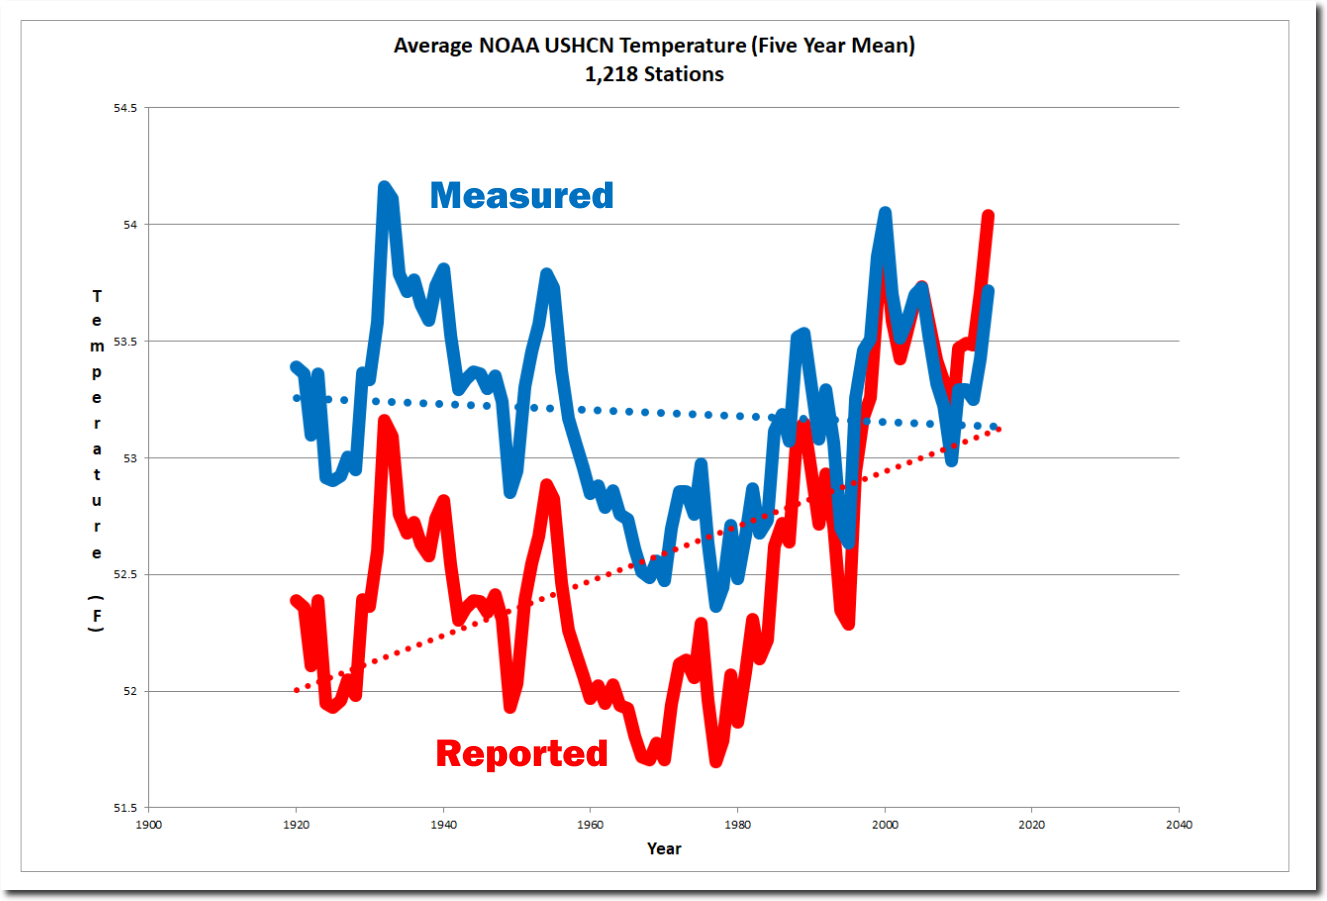
In other words, it’s the integral of sunspot activity that matters more than the current value or the trend. The past 50 years have seen the highest activity in the historical record, despite being on a downtrend.
Dr Svalgaard is more than a little disingenuous by saying that solar activity has been in decline for the past 50 years. Cycles 21, 22 and 23 were all strong cycles. Much higher than the average over the last few thousand years.
hat solar activity has been in decline for the past 50 years
Look and learn:
http://www.leif.org/research/Bias-Confirmed.png
solar activity has been decreasing the past half-century….
exactly like the unadjusted temps…
Latitude December 20, 2017 at 6:34 am
Also note that the 50 year fall is from the highest peak on that graph following 50 years of even steeper climb. Which is basically a repeat of the 1700s and 1800s, except their climbs were even steeper.
Like our climate that Solar activity is never “stable”, it is up and down like a YoYo.
“solar activity has been decreasing the past half-century….
exactly like the unadjusted temps…”
Really?
http://2.bp.blogspot.com/-T65Ti_Kr_I4/Vp-ygKu_7XI/AAAAAAAADWU/PZrDckqeavY/s1600/Untitled.png
NOAA is a pack of lies. Even its unadjusted “data” are bogus.
Al governments lie. Almost all the time.
Gabro, I agree, that graph is NOT unadjusted, in fact it is not even the normal adjusted, it has the latest full set of adjustments.
!997/8 was warmer than any temperature since in the original NOAA data and it can still be found.
The 1998 anomaly at todays baseline would be at least 3.94C
What needs to be appreciated is that the effects on climate, of a change in cloud cover, are likely to be highly non-linear. Only a small proportion is likely to result in direct change in temperature. As I understand it, a substantial proportion of the sun’s radiation hitting the earth is absorbed deep within the oceans. Thus, if cloud cover is reduced a portion of the excess radiation will result in a direct increase in atmospheric temperature. However, a substantial portion of the excess energy will be absorbed deep within the oceans. Given the extremely high thermal mass of the oceans and the very long time constants for heat transfer processes within the oceans, this excess energy is unlikely to be transferred to the atmosphere for a period of years, if not decades. Could this be the mechanism behind the multi-decadal variation in ENSO that appears to be the most significant driver of atmospheric temperatures.
I am a simple man. (Ask anyone.) If ocean cycles have periods of ~60 years, why doesn’t it follow that energy that entered it 60 years ago (at the height of the modern sunspot maximum, 1958) is only now being released to the atmosphere, or perhaps that it has been released in a continuous manner over that time period, where temperature gradients between ocean and atmosphere are the greatest?
Nice post, maybe one mystery less, but I cannot agree with Dr. Roy Spencer that Mother Nature makes fool of the world’s top climate scientists. They make fools of themselves. Instead of observations, measurements and good scientific instinct they follow a political agenda. I wonder why they don’t realize it.
CCNs or CO2s? Clearly both have an effect. Both are merely catalysts for larger atmospheric changes through various feedback mechanisms. CO2 has the advantage of being attributable to man which seems to be a very attractive feature since it gets government and lots of funding involved. CCNs have the advantage of explaining how come climate change seems to have been around long before man came along and started spewing CO2. I think we’ve narrowed it down to the main two contenders. Let the games begin! CO2 advocates, explain how CO2 caused climate change without man around, especially for those times before man during which the CO2 was at 7000ppm. CCN advocates, explain the feedbacks that blow the cosmic ray effect up into an atmosphere mover. Peacemakers, combine the two into a believable theory.
Rather than worry about the secondary effects on climate, why don’t we focus on using this work to understand clouds. Then, whenever we can accurately measure climate globally and have an understanding of the latency involved with each driver or buffer, we evaluate the role of GCR driven cloud formation in climate.
This will be interesting. As has been noted, models don’t do clouds very well, and Svensmark’s theory is about the effect on clouds. As types of clouds have differing effects, this should be a bear to sort out.
Clouds and cloud formation follow chaos theory, not politics.
I’ve always felt this to be true. If global warming is a concern, I believe we already have the technology to increase cloud cover, and what a simple solution that would be.
Just as long as nobody tries it at the wrong time.
A good time to use it would be on any politician making a speech promoting Global BS Warming as a political message. A highly localized rainfall duping about 10 gallons of water on a Greenbean politician (e.g., Brown of CA) at just the right moment would be an enormous kindness to the rest of us on Mother Nature’s part.
If the climate wars were not on going this problem would have been solved decades ago.
It is a fact that planetary temperature changes cyclically and the cyclical change in the earth’s climate correlates with solar changes.
http://wattsupwiththat.files.wordpress.com/2012/09/davis-and-taylor-wuwt-submission.pdf
This is one of more than a hundred papers that not there is correlation of past climate change with solar changes.
http://ruby.fgcu.edu/courses/twimberley/EnviroPhilo/PersistentSolarInfluence.pdf
There is a 99.5% correlation of GCR level to planetary cloud cover 1974 to 1994.
Mechanism where Changes in Solar Activity Affects Planetary Cloud Cover
1) Galactic Cosmic Rays (GCR)
Increases in the sun’s large scale magnetic field and increases in the solar wind speed reduces the magnitude of GCR that strike the earth’s atmosphere. Satellite data shows that there is 99.5% correlation of GCR level and low level cloud cover 1974 to 1993.
2) Increase in the Global Electric Circuit
Starting around 1993, GCR and low level cloud cover no longer correlate. (There is a linear reduction in cloud cover.) The linear reduction in cloud cover correlates in time with an increase in high latitude solar coronal holes which cause high speed solar winds. The high speed solar winds cause a potential difference between earth and the ionosphere. The increase in potential difference removes cloud forming ions from the atmosphere through the process “electro scavenging”. Satellite data (See attached link to Palle’s paper) that confirms that there has been a reduction in cloud cover over the oceans (There is a lack of cloud forming ions over the oceans. There are more ions over the continents due to natural radioactivity of the continental crust that is not shielded from the atmosphere by water.)
http://bbso.njit.edu/Research/EarthShine/literature/Palle_etal_2004_ASR.pdf
Analysis of the change in the earth’s albedo determined the change in albedo caused warming of 7.5 watts/m^2 as compared to the IPCC calculated warming due to CO2 of 2.5 watts/m^2.
“There is a 99.5% correlation of GCR level to planetary cloud cover 1974 to 1994.”
From: http://www.leif.org/EOS/swsc120049-GCR-Clouds.pdf
“Despite over 35 years of constant satellite-based measurements of cloud, reliable evidence of a long-hypothesized link between changes in solar activity and Earth’s cloud cover remains elusive. This work examines evidence of a cosmic ray cloud link from a range of sources, including satellite-based cloud measurements and long-term ground-based climatological measurements. The
satellite-based studies can be divided into two categories: (1) monthly to decadal timescale analysis and (2) daily timescale epoch superpositional (composite) analysis. The latter analyses frequently focus on sudden high-magnitude reductions in the cosmic ray flux known as Forbush Decrease events. At present, two long-term independent global satellite cloud datasets are available (ISCCPand MODIS). Although the differences between them are considerable, neither shows evidence of a solar-cloud link at either long or short timesca es. Furthermore, reports of observed correlations between solar activity and cloud over the 1983–1995 period are attributed to the chance agreement between solar changes and artificially induced cloud trends. It is possible that the satellite cloud datasets and analysis methods may simply be too insensitive to detect a small solar signal. Evidence from ground-based studies suggests that some weak but statistically significant cosmic ray-cloud relationships may exist at regional scales, involving mechanisms related to the global electric circuit. However, a poor understanding of these mechanisms and their effects on cloud makes the net impacts of such links uncertain. Regardless of this, it is clear that there is no robust evidence of a widespread link between the cosmic ray flux and clouds.”
You are confusing a fight that goes on for ever which is boring with a scientific discussion.
Are you interested in science?
There are cycles of warming and cooling in the paleoclimatic record, which are called Dansgaard-Oeschger (D-O) cycles.
The past warming and cooling cycles must have a cause.
The 1470 year warming and cooling cycle (sometimes with abrupt cooling) is observed in both hemispheres which rules out earth causes as internal forcing mechanisms for the earth are chaotic, not periodic and in addition cannot cause the observed change in planetary temperature.
As each D-O cycle correlates with a solar cycle changes the question is not if the solar magnetic cycle changes caused the past observed D-O cycles but rather how. The 20th century warming matches the pattern of warming that was observed in other D-O cycles.
The sun is causing the changes.
http://www.climate4you.com/images/GISP2%20TemperatureSince10700%20BP%20with%20CO2%20from%20EPICA%20DomeC.gif
http://www.agu.org/pubs/crossref/2003/2003GL017115.shtml
“Are you interested in science?”
What a bizarre comment.
I posted links to some.
Oh, and yet again the deceptive “Alley” graph is posted here The that ends in 1855 and therefore does not include modern warming.
https://wattsupwiththat.com/2013/04/13/crowdsourcing-the-wuwt-paleoclimate-reference-page-disputed-graphs-alley-2000/
So, are you interested in science?
This paper virtually confirms my working hypothesis as published recently in Energy & Environment and which has been discussed for some years on several WUWT threads.
The coming cooling: usefully accurate climate forecasting for policy makers.
Dr. Norman J. Page Email: norpag@att.net
DOI: 10.1177/0958305X16686488
Energy& Environment
0(0) 1–18
(C )The Author(s) 2017
Reprints and permissions:
sagepub.co.uk/journalsPermissions.nav
DOI: 10.1177/0958305X16686488
journals.sagepub.com/home/eae
ABSTRACT
This paper argues that the methods used by the establishment climate science community are not fit for purpose and that a new forecasting paradigm should be adopted. Earth’s climate is the result of resonances and beats between various quasi-cyclic processes of varying wavelengths. It is not possible to forecast the future unless we have a good understanding of where the earth is in time in relation to the current phases of those different interacting natural quasi periodicities. Evidence is presented specifying the timing and amplitude of the natural 60+/- year and, more importantly, 1,000 year periodicities (observed emergent behaviors) that are so obvious in the temperature record. Data related to the solar climate driver is discussed and the solar cycle 22 low in the neutron count (high solar activity) in 1991 is identified as a solar activity millennial peak and correlated with the millennial peak -inversion point – in the UAH temperature trend in about 2003. The cyclic trends are projected forward and predict a probable general temperature decline in the coming decades and centuries. Estimates of the timing and amplitude of the coming cooling are made. If the real climate outcomes follow a trend which approaches the near term forecasts of this working hypothesis, the divergence between the IPCC forecasts and those projected by this paper will be so large by 2021 as to make the current, supposedly actionable, level of confidence in the IPCC forecasts untenable.
For an earlier discussion with supporting data and discussion see
https://wattsupwiththat.com/2017/12/11/study-finds-a-solar-amplification-mechanism-by-which-solar-activity-cosmic-rays-control-climate/#comment-2692016
Here is a neat example Fig11 from
Fig.11 Tropical cloud cover and global air temperature (29)
The global millennial temperature rising trend seen in Fig11 (29) from 1984 to the peak and trend inversion point in the Hadcrut3 data at 2003/4 is the inverse correlative of the Tropical Cloud Cover fall from 1984 to the Millennial trend change at 2002. The lags in these trends from the solar activity peak at 1991-Fig 10 – are 12 and 11 years respectively. These correlations suggest possible teleconnections between the GCR flux, clouds and global temperatures.
That’s weaker solar causing a reduction in tropical cloud cover with very little lag.
The counterpoint is all I needed to read.
This is great science. Now we just need to include the oceans in the variable mix to complete the picture.
High ice dominated Ci/Cc clouds warm the Earth overall while water dominated low clouds cool.
So where do these GCR’s exert most influence, if any?
http://www.iac.es/galeria/epalle/reprints/Palle_JASTP_2002.pdf
“Several authors have suggested that a link exists between the flux of galactic cosmic rays (GCR) and cloudiness. Here we review the evidence for such a connection from studies of cloud factors using both satellite and ground-based data. In particular, we search for evidence for the low cloud decrease predicted by the rising levels of solar activity and the low cloud-cosmic ray flux correlation indicated by satellite data. Sunshine and synoptic cloud records both indicate that the global total cloud cover has increased during the past century. This increase in total cloud cover argues against a dominating role by solar activity (via GCR) over cloud formation on centennial time scales. Either the predicted low cloud decrease has not occurred or the medium-high level cloud has increased to a greater extent than low cloud has decreased.
As there is no accurate long term data available on low cloud behaviour during the last century, we are not able to totally dismiss the link between GCR and cloudiness, but we list a number of arguments for and against the proposed cosmic ray-cloud connection.”
This study …..
https://link.springer.com/chapter/10.1007/978-94-007-4348-9_5
Says:
“Atmospheric ions produced through solar-modulated galactic cosmic rays can promote both the nucleation and the growth of aerosols. The potential impact on the cloud cover is subject of current debates. The CAWSES project SAGACITY (SAtellite and model studies of GAlactic cosmic rays and Clouds modulated by solar activITY) focuses on the statistical analysis of this link, using MIPAS-E satellite data. The extinction data, the cloud occurrence frequency, and the cloud index data from MIPAS-E are correlated with the data from the Climax neutron monitor. A superposed epoch analysis of 6 selected Forbush decrease events yields several weak but statistically significant correlations with an excess of positive cloud-GCR correlations. The impact of a 15 % increase in the Climax neutron monitor data is estimated to result in a small decrease in cloud index (corresponding to an increase in cloud opacity) which is most pronounced at 9 km altitude (−9 % to +0.5 %).”
So which is it? Preferentially high or low cloud formation (if any) or perhaps both making for a zero sum.
Toneb See 7:43 AM post above.
In discussions of GCR and cloud formation, I always interject the fact that Charles T. R. Wilson late 19th-early 20th Century won the Nobel Prize for his “Cloud Chamber” in which you can see the track of sub Atomic particles created by collision of GCR with atmospheric molecules as a streak of tiny clouds that condensed along the track.
I mention this for two reasons. First, because I never see attribution to Wilson for the very idea used by Svensmark. Second, without this information, the mechanism seems odd, contrived and fanciful to the lay sceptical reader. The assurance that this mechanism is real and observable and has resulted in the discovery of several subatomic particles generating more Nobel prizes for other scientists during the 20th C, would add more support to Svensmark’s theory. It may turn out that the effect is not strong, but the reader will at least find himself giving credence to the phenomenon. H.S. is unlikely to read this comment but a friend should advise him to heed it.
Back in 1959, Edward Ney suggested that variations in cosmic rays, which are charged particles mostly originating outside the solar system, could affect our weather
So it is not even Svensmark’s idea.
I am not making a judgement about who is right or wrong, but the tone of your endless comments on this is of a very personal nature.
You must separate what you perceive as the ‘tone’ from the information content of the comments.
Grow up.
Yes, and the Vikings discovered America, not Columbus. No wait evidence has surfaced that it was the Romans, no Chinese, no Egyptians…….
As I recall, it was his fascination with the cloud chamber that sparked Svensmark’s leap into the interaction between cosmic radiation and Earth’s atmosphere. This man has spent years running laborious experiments on a shoe-string budget, with help from like-minded scientists. He has been subjected to a lot of ridicule, public abuse and derision yet his work has been confirmed by the boffins at CERN. Svensmark’s dogged determination is right up there with the likes of Microsoft and Apple, both of which started in humble garages. This man is a scientist in the applied sense …
AGAIN talking about clouds when cosmic rays can only produce haze.
To state the obvious, which somehow does not seem to get stated all that often, there is more than one effect from our favorite local variable star. The lower magnetic activity is in conjunction with the lower tsi. Both of these tend to increase the global albedo which is a positive feedback situation to increase the global albedo. Cosmic rays have their role and I suspect it is not minor. But just measuring cosmic rays over time with C14, etc. and saying that they are the only reason thing were warmer or cooler misses a lot of what is going on. The C14 proxy is a proxy for more than one process.
Omitted variables is a common problem in modeling and prediction for both sides of the argument….
http://www.climate4you.com/images/NOAA%20SST-NorthAtlantic%20GlobalMonthlyTempSince1979%20With37monthRunningAverage.gif
Omitted variables is a common problem
What you omitted here was the sunspot cycle [and hence also the GCR cycle]. Adding it shows that there is no correlation between the solar cycle and the North Atlantic SST anomaly:
http://www.leif.org/research/SST-SN-since-1979.png
If the oceans are a storage system then one would not expect a correlation in a zero lag relationship.
If the oceans are a storage system then one would not expect a correlation in a zero lag relationship.
Yet Svensmark claims there is no lag. So he must not think that the oceans are a storage system.
Nowing of the presence and Effects of ENSO, the AMO, PDO and now the Southern Ocean Oscillations why would you expect direct correlation when it not the only thing going on?
Surely it would just be another factor?
Maybe a supercomputer can untangle all of these variables. As long as it is not used for bias confirmation as at present.
Maybe a supercomputer can untangle all of these variables. As long as it is not used for bias confirmation as at present.
No, a supercomputer is the wrong tool. There really is a limited data set, so even Machine Learing (ML) is useless.
All supercomputers for climate “science” allow you to do is make wild extrapolations that nobody can understand or prove are valid. c.f. climate models.
As Willis has shown, a decent workstation with ‘R’ is sufficient. You get good analysis and can actually understand how it works.
For limited problem types with massive data available ML can do some amazing things, but they still suffer from the property of “why” does a particular set of neural net weights work. We just know they work, not why.
And any model with large number of variables, neural net or not, suffers from the same problem.
Peter
You know, one day, I’m going to wake up and read here how shock waves (with highly numbers of GCRs) from supernovae like the Crab Nebula, were responsible for dramatic cooling events like the Little Ice Age. I’d love to read a treatment of that.
See my comment below.
I have not read all the above information carefully, but my impression is that this is NOT new news. I was aware of the proposed cloud seeding effect of cosmic rays, years and years ago. Why is this being touted as “new” now?
I don’t see where Svensmark’s observations conclude that maximum effect must occur, Even if so, I do not agree that the observations can be dismissed out of hand. There is some climate effect of cosmic rays on and from cloud formation just as there is some effect of human activity on and from CO2 formation. Clearly not as much as their potential based on observation and due to a vast number of other primary, secondary and tertiary effects.
Clouds represent Important questions of climate requiring detailed answers. There seem to be a few answers here. One more question for example: What is the temporal relation of climate, clouds, cosmic rays and other factors? We’re not getting a strong causal signal from CO2, which is all the reason needed for scientific rejection “out of hand” of measures proposed to control the climate.
Even if so, I do not agree that the observations can be dismissed out of hand
What can be so dismissed is the claim that the GCR-hypothesis is the major driver of climate. There are lots of little things that feed in to that equation.
“Cosmic rays, high-energy particles raining down from exploded stars”
Isn’t even this assumption (concerning the source of cosmic rays) coming under question these days? As so often happens, the more we discover, the more we discover how little we know. Nature is a bitch who doesnt give up her secrets easily 🙂
@L Svalgaard :
“a temperature variation of 0.35-0.50 C over a cycle, which is simply not observed,”
Agreed but there is an assumption here that the relationship with clouds is linear & more or less instantaneous. We know there will be lags in the system due to the heat capacity of the oceans and we know the system in immensely complicated so I don’t think there is any reason to expect that it would be linear or instantaneous . Given the complexity of the system, I would expect a convolutional response would be more likely than a linear response, ie :
(change in cloud cover)*(Ocean Impulse response)*(Atmospheric Impulse response)*(impulse response) = Total System Response.
Multiple convolutions = extremely complex , non linear & lagged system response
Agreed but there is an assumption here that the relationship with clouds is linear & more or less instantaneous

Apart from the fact that Svensmark does not think there is a lag, even if there were, there should still be a cyclic effect [lagged by whatever] and thus a signal in the power spectrum at the frequency of the solar cycle, and there isn’t. But there may be more direct evidence of no lag:
Assuming instantaneous response is simply unphysical.
I’m sure Svensmark would like to know. Tell him.
It is disturbing that so many who should know better apparently fail to realize that the effect of a forcing (a measure of power) must be integrated over time for comparison with temperature (a measure of energy). The difference in curve shape between a Wattmeter and a Watt hour meter does not mean that the two are unrelated. The time-integral, which is mandated by the relation between mathematics and the physical world, is too-often misidentified as a lag’
It is disturbing that so many who should know better apparently fail to realize that the effect of a forcing (a measure of power) must be integrated over time for comparison with temperature (a measure of energy).
The important point is over how long the integration must proceed. If that is left unspecified the procedure amounts to no more than curve-fitting with the ‘window’size a free parameter without any physical underpinning. In addition, since the power input is always positive, what must be integrated is the deviations from a suitable ‘mean’, which now becomes yet another free parameter. If the actual mean value over the window is used, the integral is always identically equal to zero. Adding in further effects [e.g. assumed ocean variations] provides yet another free parameter, and so on. The whole thing just boils down to numerology which is always fun, but should not be basis for serious action.
Integration is done from a start point up to each of all following times to generate a trajectory of integrals as a function of time (in Leif’s terms, all ‘window sizes’ are used). Of course the integral is of the deviation from a ‘suitable mean’. Because the values deviate above and below the ‘suitable mean’ the trajectory of the integrals also goes up and down. The assertion that the integral is “always identically equal to zero” indicates a failure to grasp the method.
First approximation of a ‘suitable mean’ is obtained by optimizing the fit of a candidate equation to the trajectory of all average global temperatures deemed to be reasonably accurate (IMO since 1895). The optimization is done by adjusting the contribution coefficients of each of the contributing factors. This results in an equation which can calculate average global temperature (AGT) back to the depths of the LIA. Adjusting the ‘suitable mean’ up results in a higher estimate of LIA temperature and adjusting it lower results in a lower estimate of LIA. The ‘suitable mean’ is selected which results, after maximizing R^2, in the best estimate of LIA. Thus ‘suitable mean’ is not a “free parameter” at all.
The only ‘curve matching’ is the approximation of the net effect of ocean surface temperature cycles. Approximation is necessary because no one (to my knowledge) has yet determined a physical basis for them (I suspect resonance with planet synodic cycles).
Equation (1) at http://globalclimatedrivers2.blogspot.com combines the above with the influence of the rising (8% since 1960) water vapor (the only significant ghg) to obtain a 98+% match with measured AGT since before 1900.
First approximation of a ‘suitable mean’ is obtained by optimizing the fit of a candidate equation to the trajectory of all average global temperatures deemed to be reasonably accurate
As I said: pure curve-fitting. No physics or understanding.
“with four parameters I can fit an elephant, with five I can make him wiggle his trunk”
+1
But you are trying to get this across to people who will not consider such lags.
Complicated and that sums up the basis for relegation of the ocean cycles to constant effects and the sun to minuscule effects for purposes of moving on with models of the IPCC crew. This allowed for policy to run ahead of the science based on a handful of assumptions made for convenience.
Apparently not everyone can recognize the physics . . . or understand.
Please, authors, do not assume that everybody knows what your acronyms stand for.
TSI — I know, this might seem obvious, but it’s very annoying to have even a moment’s doubt to try to figure out what it means. Think of the readers at all levels. Thanks.
“Total Solar Irradiance”, I suppose.
“Too Stupid to Intuit” ? — on my part? (^_^) … still a parenthetic clarification would be appreciated … TSI (Total Solar Irradiance)
Robert Kernodle
TSI = Total Solar Irradiation. Average of the sun’s total output measured in space at the average radius of the earth’s orbit.
TOA = Top Of Atmosphere. Actual total measured solar radiation in space at the earth’s actual distance from the sun on that specific day of the year.
The solar community assures us that the the sun’s average output – the TSI value – has not changed recently. However, the recorded (measured and published) TSI value have consistently been going down since in-space measurements began early in the satellite era.
However, if “published TSI values” were used in the first Global Circulation Models (GCM 3d “climate” models) at 1376 watts/m62, and recently TSI published solar energy values at the average earth orbit are ACTUALLY now only 1362 watts/m^2, why are the Global Circulation models providing the same results (output is the same 3 watts/m^2 forcing for CO2 levels now as when Hansen began publicizing them in 1987-88); when a large change in TSI (as input the entire model) have changed by more than 10 watts/m^2 ?
Intriguing. I read the article and I would need far more evidence to support the hypothesis. Are there any hard, verifiable data connecting cosmic ray showers over the last 150 years and an increase/decrease in aerosols during that period?
I think Leif and Willis have the better of this debate with Henrik Svensmark. The reason is a historical event commencing 4 July 1054 and recorded in Chinese, Japanese, and Arab writings at the time. SN 1054 exploded and now comprises the Crab Nebula. This supernova was so bright it could be seen in daytime for 11 days, and at night for over two years. SN 1054 produced massive doses of GCR on Earth during that period through mid 1056. It is only 6500 light years from our solar system and would have overwhelmed any solar system GCR shielding mechanisms.
There is a lot of written history for those years for Europe and the Arab world. For example, the east-west schism of the Catholic Church was in 1054 (Rome/Byzantium) and the Seljuk Turks captured Bahgdad in 1055. Nowhere have I been able to find any contemporaneous historical references to sudden cooling from extremely cloudy skies as would have been required by the Svensmark hypothesis. It seems Nature herself falsified it via ‘experiment’.
A second reason to be doubtful is that there are many CCN sourcesthat do not rely on the posited SO2/ion mechanism. Over land, soot from forest fires, dust, terpenes from coniferous forests, isoprenes from deciduous and tropical forests. At sea, sea salt spray and dimethylsulfide from phytoplankton. Svensmark has not parsed his mechanism by all the other CCN sources, so even if his mechanism is right, it is potentially CCN rounding error as Leif has indirectly pointed out.
Rud,
Neither the supernova in AD 1006 nor AD 1054 was not large enough to leave traces in the 14C record. Hence, there is no reason to expect a climatic response from whatever high speed protons or other cosmic radiation they might have emitted. SN 1054 was just too far away to have any discernible effect.
My comment noted that SN 1054 was ‘only’ 6500 light years away. That is very close. Milky Way galaxy has an estimated 100000 ly diameter.
A reference to the lack of 14C associated with those supernovae.
https://www.nature.com/news/mysterious-radiation-burst-recorded-in-tree-rings-1.10768
Gabro, TY. 14C generation something I had not thought about. Did some research. GCR come in a wide range of energies from about 10^3eV to at least 10^26eV. The higher the energy, the fewer there are—of course. Svensmark calculates from 100GeV (10^14 if I have converted hismunits correctly), which is medium in the GCR energy range. Tried but could find a paper discussing the minimum GCR energy to produce the thermal neutron necessary for 14C synthesis from 14N. Did learn that NASA has evidence suggesting most high energy GCR originate in the vicinity of the massive black holes near the galaxy center rather than in supernovas. Somethin about slingshot acceleration plus relative abundance. Also the anomalous 774-775 14C spike,in Japanese temple cedar wood is thought black hole related as there is no record of an associated supernova. Idea in oayman’s speak is we got hit by the slingshot.That is pretty well accepted in the GCR/14C literature I read this PM. So, one explanation formyourmobservation is supernova GCR don’t produce much 14C but should clouds per Svensmark mchanism, based on relative GCR energeties. Perhaps you know the 10^x eV minimum for 14C and could further enlighten us here.
My second reason for doubt that Svensmark has identified a main climate effect remains true. When you smell a pine forest or see the Great Smokies ‘smoke’, you are smelling and seeing natural terpene and isoprene CCNs. Ditto smelling sea air (salt and dimethylsulfide CCNs).
Rud,
The AD 774 spike has been associated with Solar Energetic Particles, not the galactic center black hole.
But, yes, most cosmic rays affecting climate do originate from the galactic center, not from supernovae in our vicinity.
A GeV is 10^9 electron volts, ie a billion, so 100 GeV is 10^11. A TeV is 10^12 evs, ie a trillion. Supernovae explosions can accelerate charged particles to energies beyond 100 TeV (10^14 evs). But energy isn’t the only consideration in determining the climatic effects of cosmic rays. We are bathed in GCRs from the galactic center, while a SN explosion is a point source of particles, subject to dispersion over distance, hence only a small portion might actually hit earth. That’s why 6500 lys is actually far away from the stand point of 14C generation, however close it might seem in cosmic terms.
Of course there are abundant sources of biological and other sources of CCNs. However, those are largely confined to the lower troposphere. GCRs affect the whole atmosphere. And, given any climatic beginning state, the natural rate of CCN production is more or less constant, so that additional GCR-generated CCNs will have an affect. When the climate changes, so does the rate of biological CCN production, in a feedback effect.
Speaking of natural experiments, both solar magnetic flux and EM radiation power are correlated with terrestrial climate, as shown by the chilliness of grand solar minima.
I should perhaps add that during the 11th century solar magnetic flux was high, so cosmic rays were deflected at a higher rate than during, say, the Maunder Minimum of the 17th century.
The main point is however that too few charged particles reached earth from SN 1054 to show up in the 14C record, let alone have an observable climatic effect.
Atmospheric effects of the AD 774 SEP event, depending upon season of its occurrence:
Atmospheric impacts of the strongest known solar particle storm of 775 AD
https://www.ncbi.nlm.nih.gov/pmc/articles/PMC5368659/
Abstract
Sporadic solar energetic particle (SEP) events affect the Earth’s atmosphere and environment, in particular leading to depletion of the protective ozone layer in the Earth’s atmosphere, and pose potential technological and even life hazards. The greatest SEP storm known for the last 11 millennia (the Holocene) occurred in 774–775 AD, serving as a likely worst-case scenario being 40–50 times stronger than any directly observed one. Here we present a systematic analysis of the impact such an extreme event can have on the Earth’s atmosphere. Using state-of-the-art cosmic ray cascade and chemistry-climate models, we successfully reproduce the observed variability of cosmogenic isotope 10Be, around 775 AD, in four ice cores from Greenland and Antarctica, thereby validating the models in the assessment of this event. We add to prior conclusions that any nitrate deposition signal from SEP events remains too weak to be detected in ice cores by showing that, even for such an extreme solar storm and sub-annual data resolution, the nitrate deposition signal is indistinguishable from the seasonal cycle. We show that such a severe event is able to perturb the polar stratosphere for at least one year, leading to regional changes in the surface temperature during northern hemisphere winters.
Svalgaard has a burr up his posterior for Svensmark…..always has.
Willis, man, you aren’t a god. Get over yourself.
Let’s guess. Both of you spent a grand total of 15 minutes vigorously reading the paper and the accompanying references.
How about both of you spend the next 15 years of your lives doing research, experiments, combing through the data and stop being armchair nothings. Let’s see your equations.
Dr. Roy Spencer was critical and skeptical of Dr. Svensmark. In 2011 he changed his mind based on his own observational evidence. Maybe he has reversed his position by now.
http://www.drroyspencer.com/2011/05/indirect-solar-forcing-of-climate-by-galactic-cosmic-rays-an-observational-estimate/
While I have been skeptical of Svensmark’s cosmic ray theory up until now, it looks like the evidence is becoming too strong for me to ignore. The following results will surely be controversial, and the reader should remember that what follows is not peer reviewed, and is only a preliminary estimate.
I’ve made calculations based upon satellite observations of how the global radiative energy balance has varied over the last 10 years (between Solar Max and Solar Min) as a result of variations in cosmic ray activity. The results suggest that the total (direct + indirect) solar forcing is at least 3.5 times stronger than that due to changing solar irradiance alone.
If this is anywhere close to being correct, it supports the claim that the sun has a much larger potential role (and therefore humans a smaller role) in climate change than what the “scientific consensus” states.
I’ve made calculations
Ah, yet another know-it-all peddling his stuff.
As far as I remember my interest in sun-weather-climate relations go back to 1973 as we reported in Science Magazine:
J. M. Wilcox, P. H. Scherrer, L. Svalgaard, W. 0. Roberts, R. H. Olson, Science 180, 185, (1973)
“I’ve made calculations
Ah, yet another know-it-all peddling his stuff.
As far as I remember my interest in sun-weather-climate relations go back to 1973 as we reported in Science Magazine”
I was still in high school back then Dr. Svalgaard and appreciate you generously sharing with us your views in your area of expertise and 4+ decades of research.
However, it’s impossible for you to know what you think that you do about the effect of GCR’s(I have been an operational meteorologist since 1982 and can tell you clearly why you and I can’t possibly know with any degree of confidence).
Sorry to repost this from earlier but it’s more appropriate here:
“The oceans have 1,000 times more stored heat than the atmosphere. Heat that went into the oceans last century may still be coming out today.
When the temperature of a key area of the tropical Pacific ocean goes up, it warms up the entire global atmosphere………..an example of how powerful this effect is from heat belching out of the oceans.
The main source for ocean heating is solar radiation. Can an increase in cosmic rays result in a big enough increase in clouds to cut solar radiation to make a significant difference in the amount of heat going into the oceans? It’s plausible.
What we would not likely see is some immediate, easy to measure thermal response in the atmosphere that is in phase with the change in cloudiness.
The oceans are constantly moving, mixing, circulating. Warm blobs pops up with no explanation. El Nino’s and La Nina’s emerge from pockets of warm/cool with no long term predictability.
We have longer term/decadal oscillations PDO, AMO, for instance that repeat with unique temperature profiles in certain parts of the oceans but since the sun is providing the ocean with most of its heat, what solar cycle do these correlate to?
So one would also not expect to see the increase in GCR’s from the recently weak sun(only the previous cycle was significantly weaker than the previous ones) and the increase in clouds/reduction in solar radiation, if that was the response to just jump out with an obvious short term finger print that provides the smoking gun metric.
If this effect is significant, it should takes decades to gradually reverse the net heat gains of the ocean from last century to heat losses this century.
How many decades? Probably not a high number but certainly more than 1, possibly as few as 2 but thats a wild guess……………even if this effect is significant.
If we are accumulating heat from greenhouse gas warming at the same time and can’t separate this effect from the theoretical effects of GCR’s, nobody can say the warming slow down was caused by the increasing GCR’s or not………..or whether some of last century’s warming was in part from less GCR’s.
The above discussion is not from somebody that “wants to believe” in the GCR theory. It’s just factual statements regarding the physics of the oceans/atmosphere and knowing enough to know that those who claim they know the GCR theory is invalid because they don’t see the smoking gun……….can’t possibly know………even if it was Albert Einstein making that statement.”
We are conditioned to seeing/needing scientific proof to support our beliefs. Lack of proof, often means NOT believing…………….and in the majority of cases, this turns out to be correct.
However, I believe that its a lack of understanding of the massive heat reservoir, our oceans and how heat is stored, released and circulated/mixed that is misleading many into thinking a significant increase/decrease in heating from the change in GCR’s CAN’T be happening because they can’t see it……….based on their conditioning to needing to see the solid empirical evidence.
I also know enough about cloud physics and aerosols to go with knowing that we would likely not be able to trace the increased or decreased heat going into the oceans, that “could be” significant.
Not IS significant but COULD BE significant and still not show up within a short term, 1 very weak solar cycle time frame.
The vast oceans take a very long time to warm and cool(or, possibly not warm as fast as before if one of the heat contributing factors becomes less). They have 99.9% of all the stored heat on this planet. Global atmospheric temperatures go up and down in sync with ocean temperatures(look at what an El Nino does). UV solar radiation provides all the heat that is stored in the oceans.
The main source for ocean heating is solar radiation. Can an increase in cosmic rays result in a big enough increase in clouds to cut solar radiation to make a significant difference in the amount of heat going into the oceans? It’s plausible.
You miss the point. It is Svensmark et al. that claim they finally have a breakthrough to explain everything; in particular that the observed global warming is almost solely caused by their GCR theory. If you read their papers you will find that they do not invoke any lag at all. Observations show that there is no lag in the good correlation between cloud cover [caused by whatever] and temperatures. More clouds = higher albedo = less sunllight = cooling. The Svensmark et al. claimed factor of GCRs being 5-7 times more efficient than TSI in regulating temperatures is simply not observed. In my book, if you make a firm quantitative prediction and it does not pan out, your theory is falsified. Some people here invoked unknown effects that somehow mask the effect of GCRs. I find that to be special pleading that must be dismissed out of hand.
“They have 99.9% of all the stored heat on this planet.” The part of the planet that include the atmosphere and oceans.
“I have been an operational meteorologist since 1982”
Mike:
I was from 1974 to 2006 (UKMO).
Good to meet you.
Don’t you think that the lack of correlation between both OHC and GMT on any timescale we can see with decent data just isn’t there?
Which is Leif’s main point I think.
Given the small “dimming” tendency of our Sun this last ~50 years would we be seeing data like this, were that the case? …..


Less “Sun” more GCR’s > more (low?) clouds > cooling
Unless it’s more (high?) clouds > warming of course.
DR December 19, 2017 at 8:37 am
“How about both of you spend the next 15 years of your lives doing research, experiments, combing through the data and stop being armchair nothings”
I believe you owe Dr Svalgaard a very sincere apology. That is, of course, if you take your own advice and do some research about him instead of being an armchair nothing yourself.
“Why is the climate always changing?”
Let’s bring in Joe Dirt’s dad for the answer.
“Hey, how exactly is a rainbow made? How exactly does the sun set? How exactly does the posi-trac rear end on a Plymouth work? It just does.”
I would have liked to see in the paper some conversion to more familiar units. Their Figure 1 compares Forbush decrease with liquid water cloud fraction and Aangstroem exponent.
I suspect what most laymen would like to know is: what does this translate to as a change in Watts/m2?
Can anyone out there help me with this?
My layman’s reading of this paper is that like AGW, the physics of cosmic ray/CCN are correct but the effect is dominated by much larger effects and the signal is lost in the noise.
PS If I was going to show a connection to temperature, I would have taken the next logical step and shown how the effect on CCN translated to a change in incoming watts/m2 of radiation. That this step is missing raises a red flag for me. Comparing million year resolution wasn’t compelling.
Roy Spencer, who studies clouds,said this:
============================================================================
But What Else Could Cause Clouds to Change, Besides Temperature?
Any “expert” who asks such a naive question obviously has little training in meteorology. Unfortunately, this is indeed the case for many climate scientists.
Cloud formation is influenced by countless processes…the presence of cloud condensation nuclei, the temperature lapse rate and temperature inversions, wind shear, the presence of fronts, changes in ocean upwelling, to name a few.
The climate system is a non-linear dynamical system, and it is constantly changing. Chaos is not just a short term phenomenon affecting weather. I think that long-time scale quasi-chaotic changes in ocean circulation, like that associated with the Pacific Decadal Oscillation, are capable of causing climate change. The great climate shift of 1977 is evidence of that.
Even the IPCC and the climate modelers know that the huge reflective regions of marine stratocumulus over the eastern ocean basins have a dramatic effect on climate, and so any changes in upwelling of cool water in these regions can then indirectly cause global warming or cooling.
Of course, there is also the Svensmark et al. theory of cosmic ray indirect forcing cloud cover, and I suspect there are effects on cloud formation we have not even discovered yet.
Just because we do not understand these things well enough to put them in a climate model does not mean they don’t exist.
==========================================================================
P.S. What physics of AGW is correct?
The time-integral of sunspot number anomalies is an excellent proxy for Svensmark’s findings and also the direct effect of TSI change. Combined with an approximation of ocean surface temperature cycles and the increase of atmospheric water vapor (8% since 1960) results in a 98+% match with measured average global temperatures since before 1900.
Forget theory and experiments, how about direct observations of total cloud cover changes with the solar magnetic field.
Also, wouldn’t clouds tend to decrease daytime temperatures but increase nighttime temperatures, essentially moderating temperatures overall? Venus is blanketed with clouds, and certainly isn’t cooler than it should be for its distance to the sun, but it does have extremely low latitudinal and diurnal temperature variance.
I think the missing climate link is estimates for thermal convection and retention of heat within the atmosphere from gravity.
This.
It is plain to see that it is Water that controls the “Stability” of our Surface and Atmosphere.
Compare the Tropics to the Deserts to the Moon.
The less Moisture the wider the Diurnal Swing.
Dr. Svalgaard, which cycle, over what time frame? It would seem to me that the oceans have a long time constant that would smooth out any signal as short as 11-12 years. Also everyone seems to think that GCRs are constant, I’ve never seen any data backing that up.
Dr. Svalgaard, which cycle, over what time frame? It would seem to me that the oceans have a long time constant that would smooth out any signal as short as 11-12 years.

It is up to people who make positive claims to specify the ‘which’ and the ‘what’
Also everyone seems to think that GCRs are constant, I’ve never seen any data backing that up.
The GCR flux outside the solar system is very constant on time scales we care about. Inside the system the low-energy particles modulated by solar activity. https://en.wikipedia.org/wiki/Cosmic_ray
That graph alone destroys the CO2 control knob theory, there is nowhere that sort of relationship with Temps & Co2.
So what? Most people seem to see the issue as a choice. If you don’t believe the CO2 knob, you’ll latch on to whatever other straws that are waving in the wind, regardless of their validity.
.
It looks to my eye to demolish the notion that there is a great lag between clouds and temps. Nothing to do with CO2.
Tropical cloud cover goes down…..temps go up
….Tropical cloud cover flattens out…..temps flatten out
…what’s not to like?
and there’s record snow in Alaska, Russia, and Europe
Reading the responses of some of the ‘regulars’ on here about this, it is increasingly clear to me that the ‘great CO2 swindle’ has created another group of people dependent on the continuation of this rubbish. There are the CO2 nuts with all their modelling etc; and then there are the pseudo sceptics, the luke-warmers, who don’t really want alternative explanations , This second group regularly posts here.
Personally I have no doubt that temperatures are highly correlated to cloud cover which in turn are highly correlated to the sun’s behaviour. Svensmark has produced a great piece of real expermental science, it appears to describe part of this process. Now its up to others to positively take this forward to find the rest of the process.
Jim says “Personally I have no doubt that temperatures are highly correlated to cloud cover which in turn are highly correlated to the sun’s behaviour.”
In spite of your lack of doubt, and in spite of Svensmark’s interesting experiments, uncontroversial observational evidence reveals that this effect is very small and while perhaps true, is being swamped by other effects. If it was a large effect, then we would see the sunspot cycle affect ocean SSTs. As has been shown previously on WUWT, there is no correlation no matter how compelling the idea may be. Dr Shaviv’s claim only holds when you ignore all the SST data that does not correlate!
The uncertainties around AGW are how strong of an effect is it and what are the negative and positive feedbacks. It is surprising that so many posters here that rightfully criticise the CAGW crowd for unsupported claims of the strength of the AGW effect, are so quick to make the same mistake themselves.

Dave
‘The uncertainties around AGW are how strong of an effect is it and what are the negative and positive feedbacks’
I think you demonstrate exactly what I was referring to as a ‘luke-warmer’. There are no uncertainties about AGW, its a load of unsubstantiated rubbish.
Proof AGW theory & IPCC are wrong has been hiding in plain sight. Demonstrated by ‘notch’ in TOA radiation measurements, energy absorbed at low altitude by CO2 molecules is immediately redirected to water vapor molecules. CO2 has no significant effect on climate.
Leif attributes the calculation to Svensmark? Even though Svensmark clearly states:
“[2]. In 2008 Shaviv quantified the solar climate link. Using the oceans as a calorimeter the solar forcing over the (~11 year) solar cycle was estimated to be in the range 1.0 -1.5 W/m2. This value is 5-7 times larger than the forcing from solar irradiance alone, and points to an amplification mechanism, that may well involve clouds [3].”
And he used words like “estimates” and “may”. Later the paper uses empirical evidence and experiments.
Leif’s attitude causes me to often dismiss his remarks out of hand.
“Think about this:
TSI over a solar cycle causes a variation of 0.05-0.10 degrees C. If GCRs as per Svensmark has 5-7 times the effect of TSI, that would translate to a temperature variation of 0.35-0.50 C over a cycle, which is simply not observed, hence the paper can be dismissed out of hand.”
I would not expect there to be a direct instant correlation, as again, we know that a change in energy balance is not able to be seen easily by looking at radiation in the same time period. The energy can be stored and go where you cannot see it… deep oceans for example. It could take years, decades to show up and it does not show up where you can see where it came from on short time scales. Look at CO2 and temperature… the correlation is in many time scales.
How does this compare/contrast to CERN CLOUD experiment results from almost 2 years ago. To me I’m seeing only agreement.
The CERN results in a nutshell:
– In the pre-industrial age there was a shortage of cloud droplet precursors so GCRs had a significant impact.
– In the industrial age, pollution provides the cloud droplet precursors and GCRs have minimal impact.
The CERN results also conform with the fact that there is no correlation between sun cycles are cloud cover in the satellite age.
See my comment above. In the preindustrial age there were still vast CCN sources unrelated to the GCR mechanism. That is still true today. The humid summer ‘smoke’ of the Great Smokey Mountains in SE US is isoprene CCN induced ‘fog’
lvslagaard wrote
“The issue is to what degree the GCR hypothesis explains the climate change we actually observe today. If the effect is hidden [no smoking gun] and may not show up for decades, centuries, or more, it is less relevant to the current climate debate.”
Not so. It is exactly relevant to the debate. The crux of the debate is:
“Is anthropogenic activity the dominant source of dangerous global warming or not ?”
If it turns out that the climate is dominated by energy stored in the oceans and the rate of energy accumulation is controlled by the mechanisms explained by Svensmark and Shaviv then this changes the debate entirely.
If the warming is dangerous and humans are the dominant cause then de-industrialization and the UN plans to remove sovereignty from all nations become marginally less evil and insane.
However, if the warming is not dangerous or humans are not the dominant factor in the warming then the Left will be acting on falsehood (not for the first time, mind you) and will be the most evil people in the history of the planet (nudging out even Caliph Abd Al Malik’s confected mythology called “Islam” in Arabic – if you think Islam came from “Mohammed” you don’t know any of the real archeology of the region).
Not so. It is exactly relevant to the debate. The crux of the debate is:
“Is anthropogenic activity the dominant source of dangerous global warming or not ?”
That is the POLITICAL debate, not the SCIENCE debate.
Not sure what you mean by “that is the POLITICAL debate, not the Science debate.” Politics is very much part of the debate – a very large part.
So what is the Science debate?
So what is the Science debate?
The science debate has to do with the evidence for changes in the relevant parameters [such as TSI, GCR flux, EUV flux, Solar Magnetic Field, Sunspot Number, etc] and with what their effect on the Earth’s environment might be. This especially with respect to the long-term variation of the parameters. The last decade has seen significant progress in this field http://www.leif.org/research/IAGA-2017-1227-Solar-Activity.pdf
Here in Tucson, the University of Arizona is SOOO invested in studying GCRs and their atmospheric physics. As you can see here, their lab on top of 9,100′ high Mt Lemmon.
http://i65.tinypic.com/9ibhw3.jpg
close-up of door reads (if you zoom in)
The University of Arizona
Institute of Atmospheric Physics
High Altitude Cosmic Ray Laboratory
(phone number)
http://i67.tinypic.com/2aaagl0.jpg
… and yes that is tree growing around that white water tank.
http://i65.tinypic.com/5vaz9s.jpg
Note the hole in the garage door for animals.
The UA went All-In on the climate hustle and gave-up on studying real atmospheric physics 25 years ago. Follow the money. Blame Vice President Al Gore.
The diversion of real science by corrupt consensus CACA and squandered trillions would merely be a crying shame were it not for the megadeaths inflicted by this criminal cult, which makes it an outrage.
here is the Google Maps location of this derelict GCR laboratory:
https://www.google.com/maps/place/32°26'30.0“N+110°46’56.2″W/@32.4416571,-110.7828132
try this one:
https://goo.gl/maps/E8GrfqLExuT2
Ionization rises most in high latitudes. Therefore, it can increase the albedo of the Earth, especially in the conditions of La Niña.
http://tropic.ssec.wisc.edu/real-time/mtpw2/product.php?color_type=tpw_nrl_colors&prod=global2×pan=24hrs&anim=html5
I assume that Roy Spencer will read this post and comments. I re-read his book in preparation for this post, as suggested by Anthony. The book was based upon satellite readings from 2000 to 2008. I assume that you have done the same analysis on satellite readings up to 2017 – is this right, Dr Roy? If so, do they continue to support your conclusions in the book?
Leif says…
TSI over a solar cycle causes a variation of 0.05-0.10 degrees C.
Really?
So Leif claims he can detect a variation in the GLOBAL temperature to an accuracy of FIVE ONE HUNDREDTHS of a Degree?!!!
It would be challenging to measure the temperature of a black object in a vacuum to that degree of accuracy.
I’m fed up with so called ‘scientists’ claiming they can measure or detect things which are patently unmeasurable… and then taking up snotty superior positions.
About ten years ago a dust storm moved from the deserts of central Australia moved east and covered most of NSW, that’s an area of 800,000 sq K.
I also have a distinct memory of hundreds of oil wells burning in Kuwait for several months pouring billions of cubic meters of smoke into the atmosphere.
Or what about the particles from the current crop of of California wildfires?
Or even the thousands of vapour trails left by aircraft daily?
It seems to me that quite often these so called ‘scientists’ prefer to focus on arcane and obscure micro mechanisms whilst ignoring the ‘bleeding obvious’.
Possibly because there’s no research funding available to look into things that an ordinary person can see for themselves.
So Leif claims he can detect a variation in the GLOBAL temperature to an accuracy of FIVE ONE HUNDREDTHS of a Degree?!!!
Absolutely not. From basic physics we calculate that the solar cycle variation of TSI will result in a variation of temperature of 0.05-0.10 C. This is in the noise level and has barely been observed, if at all [some people claim to see up to 0.2 C, but this is not generally accepted].
You don’t need cosmic rays to increase cloudiness. Cirrus clouds don’t cool, however, they warm.
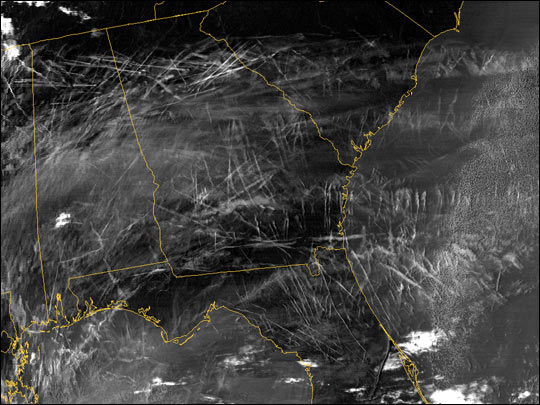
https://earthobservatory.nasa.gov/IOTD/view.php?id=4435
As always, Dr. Svalgaard pretends that unless the impact on temperature happens immediately, then it doesn’t exist.
He ignores the thermal mass of the system as well as other confounding factors.
Dr. Svalgaard hasn’t ignored anything. He already eroded a fjord through your musings, up thread, here:
https://wattsupwiththat.com/2017/12/19/new-svensmark-paper-the-missing-link-between-cosmic-rays-clouds-and-climate-on-earth/#comment-2697175
Not only that, but nearly the sum total of mankind’s knowledge and speculations about the Sun can be found on the research pages at his website. Read up. Then, you won’t feel so bad for having made such a remark.
Being an expert on the sun makes one an expert on how the sun affects the earth?
I’ve already read Dr. Svalgaard’s response and I stick by my statement.
Being an expert on the sun makes one an expert on how the sun affects the earth?
Being an expert on the sun and solar-terrestrial relations [including weather and climate] does give one a certain grasp on how the sun affects the earth.
You might enjoy http://www.leif.org/EOS/1976NASA-1973-Sun-Weather.pdf and
http://www.leif.org/EOS/Sun-Weather-Climate.pdf
“We are especially indebted to Dr. Ray Wexler, Dr. John M. Wilcox, Dr. S. J. Bauer, and Dr. Leif Svalgaard for reading several complete drafts and revisions and offering constructive criticism. Others who read complete drafts and contributed helpful comments include Dr. George C. Reid, Dr. James Barcus, Dr. Rudolf Penn-
dorf, Dr. Kaichi Maeda, Dr. Eldon Ferguson, and Dr. A. Ebel.”
At least my peers in this field recognize my expertise. After reading the above you may too.
To learn more look at the last reference on pages:
Svalgaard, L., 42, 77, 78, 79, 193, 198, 199, 200, 205; with Heath, 29; with Wilcox, 5, 193, 201, 202, 215, 266
Wow. Experiments as well as theory. It sounds just like science for a change.
Lots of Backfire Effect going on here today, by a lot of folks. Which is good, because we get to see the differences of opinion, and knowledge, on the subject matter at hand. Plus, there are a lot of very smart people here today, which makes it even more interesting. Excellent Post!, and superb reading. We all learn more today than we knew yesterday. Science progresses one day at a time.
Now I don’t know what to think with regards to these cosmic rays, and I sure am not anything close to being as remotely smart as a lot of these folks are. There is definitely something to this, but is it an overwhelming force? Is it a new holy grail of climate science that overwrites everything else? I don’t think so…on the face of it, but what do I know? It seems to me we should be be able to test the hypothesis in the near term by measuring earth’s albedo regarding any change of 1%-2% cloud cover on Earth. But we may have to wait decades to measure any difference in oceanic/atmospheric cooling/heating because it will take time (and perhaps several solar cycles) to manifest itself in the thermal inertia of the heat sink for the good Earth, which are the oceans.
My conjecture still stands that the September 2017 local maxima in solar activity (31 August – 10 September 2017) was a Forbusch-type Event but with high EUV from the sun and solar protons. A big downward dip in the neutron count also occurred as a result of that enhanced solar activity. Dr Spencer has already commented on the usual divergence of his UAH TLT from the surface record temperature data sets. The surface temp data sets are governed by SST, which this event was too short in duration to alter the OHC to be seen in the data, especially diven the developing La Nina in the Pacific. This La Nina also is anomalous for being “delayed”. Was this delay in La Nina due to that solar event?
This conjecture further posits that it was the increased ozone production in the stratosphere in the late Northern Hemisphere summer resulted in a 2 month spike in Troposphere and lower Stratosphere temps. Also the increased cloud nucleation (enhanced solar protons) would have helped Atlantic Basin hurricanes form precipitation, enhancing their strength through elevated convective heat release.
“….Svensmark has 5-7 times the effect of TSI, that would translate to a temperature variation of 0.35-0.50 C over a cycle”
I would have to read the paper to see if Svensmark actually makes the claim Leif asserts above, but even if he does, the claimed effect on CCN would be primarily above the oceans. Hence it would change ocean heat content and not necessarily be reflected in global surface temperature in the short term.
Again! Many who should know better apparently fail to realize that [to determine] the effect of a forcing (a measure of power such as TSI) [its anomaly] must be integrated over time for comparison with temperature [which when divided by effective thermal capacitance] is a measure of energy.
No, not really. Consider the time frame of one year [or even one day]. The total energy of TSI integrated over that year is just TSI*(seconds in one year) Joule. Thus the ‘conversion’ factor between power and energy is just a constant, meaning that we can use TSI as a measure of energy [apart from a constant factor] of the system. Similarly, temperature is just [apart from a constant conversion factor] a measure of the average energy of the molecules involved. This does not depend on the number of molecules so is not a measure of the total energy of the whole shebang. So, in practice, it is perfectly legit to compare TSI and Temps.
I wonder if this failure to grasp simple engineering/physics is shared by the climate science community.
“I wonder if this failure to grasp simple engineering/physics is shared by the climate science community.”
I don’t wonder at all.
I’m utterly certain that it is, and I have been for decades.
We can thank our lucky stars that is highly unlikely that any responsible individual would ever put most of them in charge of a mission critical engineering project such as designing a supermarket trolley as they would fail dismally.
Leif: I get what you are saying.
So I will posit this question to perhaps end the integrative argument. What if, (hypothetically) the average TSI dropped by 0.1% across the spectrum. In other words, a 0.1% phase-shift drop forever. What would the theoretical longterm effect on temperature equilibrium be?
It is profoundly wrong to say “TSI as a measure of energy”. TSI is a measure of power.
How much temperature change results from TSI anomaly for a second? How does temperature fluctuate over a year, or ten years, as TSI fluctuates over that time span?
Watt is power. Watt hour is energy. Watt hour is the time-integral of Watt. TSI anomaly is power measured in Watts/m^2. Temperature change times effective thermal capacitance is energy, measured in Watt hr/m^2. Comparing power to energy is not meaningful.
Dan Wrote: [It is profoundly wrong to say “TSI as a measure of energy”. ]
If you are referring to what Leif actually wrote “The total energy of TSI integrated over that year” He is perfectly correct. Power integrated of time is energy.
Saying “Power integrated of time is energy.” is, of course, correct. But he did not stop there. He added “Thus the ‘conversion’ factor between power and energy is just a constant”. This is misleading at best. It will give the energy change (temperature change if divide energy change by effective thermal capacitance) at a single point in time if you use average TSI anomaly. To get the temperature trajectory vs time for comparison with measured trajectory the time integral up to each point on the trajectory must be used.
It is mathematically incorrect to compare TSI anomaly trajectory with temperature change trajectory.
To get the temperature trajectory vs time for comparison with measured trajectory the time integral up to each point on the trajectory must be used.
I showed you that this is not the case.
And BTW your statement doesn’t make much sense as written. Perhaps you can improve on it.
Dan: I certainly agree with you. An integrator needs to capture the power over time adding up all the slices in order to provide the energy. Saying something that variers is a constant is just plane false. Especially when we are looking for extremeley tiny changes….
“The Stefan–Boltzmann law describes the power radiated from a black body in terms of its temperature. Specifically, the Stefan–Boltzmann law states that the total energy radiated per unit surface area of a black body across all wavelengths per unit time (also known as the black-body radiant emittance or radiant exitance), {\displaystyle j^{\star }} j^{\star}, is directly proportional to the fourth power of the black body’s thermodynamic temperature T”.
The SB-law shows that power is directly given by temperature. No integration over time needed.
Yes, Leif. Power “per unit time” matters, and the SB law gets it correctly. I know you know that is true.
So a measure of power is also a measure of temperature.
Only if all of the parameters are met, and at a single defined point in time -or- a sum of all of the points in a time span. Yes, then your statement is precise and correct in my opinion.
a sum of all of the points in a time span
Make that time span one year as is often done [yearly average TSI, yearly average Temps]…
Leif, you’re talking about power as if it’s energy again. You cannot precisely calculate the temperature of earth based on TSI unless you know what the earth is absorbing or reflecting. So no, power does not equal energy except in a hypothetical world which is not this planet.
You cannot precisely calculate the temperature of earth based on TSI unless you know what the earth is absorbing or reflecting.
But we do know that. It is called the albedo and is about 0.3. And we don’t even need that if we want to calculate how much the temperature will change for a given change of TSI.
Leif wrote: “But we do know that. It is called the albedo and is about 0.3. And we don’t even need that if we want to calculate how much the temperature will change for a given change of TSI.”
It’s about 3? On average? Really… it’s not ever 0.25 or 0.35 and for how long and when? Rhetorical question. Does the earth ever look mostly white with clouds to the sun and does that affect albedo?
You’re taking some average and guessing it’s constant. And it is not. It is not constant… and we do not know it’s 0.3 constantly. That’s why people are studying this phenomenon. You over simplifying that you know the earth receives a constant average albedo because that is true plus of minus some error band which is larger than the tiny fractions of a degree K we are all trying to figure out.
It’s like saying we know that changing solar spectral radiation has no affect on albedo… just because we know. That is also an untrue over simplification that attempts to end the scientific debate.
Mario
My experience is that TSI is not a good proxy for anything, really, because it is measured TOA and no material really can withstand what happens TOA for too long.
T max is a good proxy for whatever heat is coming through the atmosphere.
T min is a good proxy to prove that there is no man made warming [from adding CO2 & others] as presumably we should see chaos developing with the minimum T if there were any AGW.
It’s about 3? On average? Really
No, it is about 0.3, not 3.
And we measure it with satellites and by observations of the Earthshine on the Moon.
But, as I said, knowledge of the albedo is not needed to compute the change in temperature caused by a change of TSI.
Why does albedo have nothing to do with temperature received?
If TSI [radiation received, S] increases, the temperature [T] increases too, regardless of the albedo [a]. The physics behind that is the Stefan-Boltzmann law: (1-a) S = k T^4. Now differentiate [getting a small increase of S]: (1-a) dS = 4k T^3 dT. Then (1-a) dS/((1-a) S) = 4 k T^3 dT/(k T^4) or dS/S = 4 dT/T, or dT/T = (dS/S)/4.
Both (1-a) and k cancel out. So dS/S of 0.1% = 0.001 [typical value for solar cycle variation] means a dT/T of 0.00025, or dT = 0.00025 T. T is 288 K, so dT becomes 0.00025 * 288 = 0.072 K, regardless of the albedo a.
This is circular reasoning. You cannot know how much energy the earth is receiving…
We know how much it is radiating to space [given by its temperature] so that is also what it must be getting from the sun. So, yes, we do know [we also have satellites that measure that].
yup… makes sense. energy out is measured… energy in is deduced…
Leif, let me try a different tack. Of course you are correct about the effect of TSI anomaly on AGT change for say 1895 if you use the average TSI anomaly for 1895. But what about 1896? We know TSI is not constant. The average TSI 1895-1896 is required. And for 1897 the average 1895-1897 is required and so on.
The same energy change 1895-1897 is obtained using the time-integral of TSI anomaly 1895-1897 (with increments of one year because that is the frequency of reported data) and in general, the energy change 1895-X is obtained using the time-integral of TSI anomaly 1895-X to construct the trajectory of energy change vs time. TSI is not available that far back so SSN anomaly, known to be a proxy for TSI anomaly, is used. Because SSN is also a proxy for Svensmark’s work, the time-integral of SSN anomaly is accounting for both.
Of course you are correct about the effect of TSI anomaly on AGT change for say 1895 if you use the average TSI anomaly for 1895. But what about 1896? We know TSI is not constant. The average TSI 1895-1896 is required. And for 1897 the average 1895-1897 is required and so on.
For 1896 you use the average TSI [not anomaly] for 1896. For 1897 you use the average TSI for 1897, etc.
The main reason is that what came in in 1895 was by 1896 radiated away [because the Earth radiates according to the temperature it has no matter how high or low that is], and what was received in 1896 was radiated away during 1896 [like what was received yesterday was mostly radiated away last night – the slight imbalance in each hemisphere being equalized after a year as the seasons run their course (not to speak about the fact that whatever imbalance there is is further counteracted by the other hemisphere)], and so on. That is how it works. Anything else is just [invalid] curve-fitting.
Leif, Doing the complete calculation for each year, like you described, would also work except you have not accounted for net average SST oscillation or the effect of increasing water vapor and energy out was not measured in 1896. As you described at 12/23 11:51 PM the outgoing energy matches the incoming energy over a long time period. That is what establishes, as a first approximation, the average value for SSN as a proxy. This average value is the base from which anomalies are with respect to. The anomalies account for the part of earth temperature change caused by solar change.
This and other knowledge results in Eq (1) in my blog/analysis. Next comes the process you ridicule which is adjusting coefficients to achieve the best match to known average global temperatures. The 98+% match with measured since 1895 and a credible trend back to the depths of the LIA demonstrates that the right stuff is being accounted for.
The big uncertainty is what is going to be the eventual effect of the rising water vapor. It is currently rising about twice as fast as it should be based on temperature increase and is countering the global cooling that would otherwise be occurring. WV must eventually stop rising. It will eventually be countered by rising cloud cover.
As you described at 12/23 11:51 PM the outgoing energy matches the incoming energy over a long time period.
Not al all. Over perhaps a year, but no longer. The Earth radiates all the time.
Leif, You say something that everyone who passed high school science knows “The Earth radiates all the time.” But include in the same post something that is not only bogus, it contradicts something you said earlier. How do you now explain that earth average global temperature, as measured using proxies, has been within a degree or so of the average for the last 8000 years?
Because the sun shines all the time, too
“TSI over a solar cycle causes a variation of 0.05-0.10 degrees C. If GCRs as per Svensmark has 5-7 times the effect of TSI, that would translate to a temperature variation of 0.35-0.50 C over a cycle, which is simply not observed, hence the paper can be dismissed out of hand.”
I have a ton of respect for Dr Svalgaard, but, (isn’t there always a ‘but’?), I’m not sure this should be dismissed ‘out of hand’. I think Dr Svalbaard’s statement would be true if there was a uniform effect, which the paper specifically states that there is not, “It should be stressed that there is not just one effect of CCN on clouds, but that the impact will depend on regional differences and cloud types. “In regions with a relative high number of CCN the presented effect will be small, in addition the effect on convective clouds and on ice clouds is expected to be negligible. Additional CCNs can even result in fewer clouds. “
I’m not sure this should be dismissed ‘out of hand’.
What is to be dismissed is the claim that their ‘breakthrough’ settles the matter of climate change and that the GCRs are the major, chief, dominant, only [?] driver of climate.
If there is any effect, it is tiny, buried in the noise, dependent on time and location [and thus not the global overwhelming effect claimed].
One could say the same about C02.
That one notion is wrong does not mean that any other one is right.
Perhaps they are both wrong.
My thoughts, exactly.
Sorry, just to clarify, my reply was to Jim.
Leif,
My thought as well.
the effect on convective clouds and on ice clouds is expected to be negligible
Most clouds in the tropics where most of solar heating takes place [and where our climate is mostly controlled] are convective clouds [thunderstorms]…
A further comment would be that there isn’t ‘one forcing to rule them all’. The earth’s ocean-atmosphere system is an exceedingly complex, open, non-linear, coupled chaotic system and I doubt that there is ‘one forcing’ that controls the direction of temperature. To attempt to posit one is a Don Quioteesque effort.
My opinion on Dr. Leif Svalgaard’s comment: What he says would be true if response is instantaneous, in my opinion, but Earth as a rather huge thermal “flywheel” in its oceans. This likely moderates / damps that normal cyclical behavior. I believe it is possible that what is required to cause a significant change in climate is a reduction of the solar magnetic field for a period of time longer than a single cycle. Then the climate would reach a new equilibrium at a lower temperature but it would take more than one half cycle to do so.
“Think about this:
TSI over a solar cycle causes a variation of 0.05-0.10 degrees C. If GCRs as per Svensmark has 5-7 times the effect of TSI, that would translate to a temperature variation of 0.35-0.50 C over a cycle, which is simply not observed, hence the paper can be dismissed out of hand.“.
OK, I have thought about it. It’s tosh. The IPCC express doubts about whether clouds warm or cool – on balance they think maybe they cool. So to expect big results in a very few years is ridiculous, and from a scientist who presumably would like to be taken seriously, it is very disappointing. Instead of ‘dismissing out of hand, wouldn’t it have been better to consider the possibility that the major effect is via the oceans and that results are therefore not instantaneous.
crospatch and others have already made similar points.
The IPCC express doubts about whether clouds warm or cool – on balance they think maybe they cool. So to expect big results in a very few years is ridiculous
Tell that the Svensmark et al. They are the ones who claim their ‘breakthrough’ explains everything.
It’s not Svensmark I should speak to, it’s the IPCC. Clouds do cool the ocean. The IPCC is obsessed with surface temperature.
And the push back by the popular press partisans has already begun…
https://gizmodo.com/no-supernovae-arent-changing-earths-climate-1821439511
The tangled galactic magnetic field scrambles the cosmic rays to obliterate where they come from.
Here is what a map of the Galaxy looks like in cosmic rays:
So CR flux ain’t squat and Tony Phillips wastes his time?
If you say so…
Well, at least I know for sure that was an answer from the real Doc S.
Leif,
Cosmic Rays and gamma rays almost certainly have common sources in our galaxy.
The difference is that we can see where the gamma rays are coming from as they are not deflected by the tangled galactic magnetic fields as are the cosmic rays [which are not rays, BTW].
I get your point, we can’t see any sources. Predicting that our star system will traverse areas of higher background CR is just speculation.
… and it’s not just galactic magnetic fields that scramble the GCR vectors, but b/c GCR’s are mass particles in addition to moving at < c, gravity fields move them around too, further defocusing/blurring their sources.
I should say (to keep Albert and Isaac happy), gravity moves GCR protons around more so than photons. As their interactions with space-time curvature.
GCRs are atomic nuclei from which all of the surrounding electrons have been stripped away during their high-speed passage through the galaxy. They are particle showers, If I am correct, like driving through a rainstorm. These particles should be well-dispersed in the galaxy after bouncing about in electromagnetic chaos. I can easily visualize that. I would think that for us to recieve particle concentrations above the background level there would have to have been a nearby supernova recently detected.
Leif, could one say that the cosmic rain is steady, but when the sun is active the windshield wipers of the heliosphere are on high and vicey versey?
One could say that. The intensity of GCRs depends on three things:
1) the strength of the [currently decreasing] geomagnetic field. This determines the very long term variation [century time scale].
2) the ‘warp angle’ of the Heliospheric Current Sheet: when flat [small warp angle] GCrs have easy access to the inner solar system. At solar maximum the Current Sheet extends all the way to the poles and that makes access to the inner solar system more difficult Slides 51-56 of http://www.leif.org/research/Observations-polar-magnetic-fields-and-Cycle-25-prediction.pdf
3) within each cycle the number of sunspots regulates the number of solar storms which also hinder the access.
Thanks and have a wonderful holiday, you really are a good teacher. At least for this dumb old dog.
As Willis once said: “the only dumb questions are those that are not asked”
Pop Piasa
There is a very accessible on-line tutorial from the University of New Hampshire covering GCR, interstellar medium, heliopause, heliosphere and other good stuff related to your questions here: –
http://www-ssg.sr.unh.edu/ism/intro.html
See also the Wiki article on the Heliosphere here: –
https://en.wikipedia.org/wiki/Heliosphere
What I find most interesting is how recent much of our knowledge is and how surprising were the discoveries from the Voyager probes as they transitioned from our solar system into interstellar space.
“…the impact is believed to be largest in marine stratus clouds.”
It may not be as much about quantity as location. Day clouds over water inhibit the heating of the surface layer. They also locally increase winds when intermittent. I associate broken stratus clouds with cool and gusty conditions. Great on a hot summer day (when you can get it). If key areas of the oceans were to be shaded long enough, might the usual ENSO piling up of warm water (during La Nina) be morphed into a piling up of “not so warm” water? What happens then when El Nino comes around? Less effects on weather?
Are we seeing the heat stored decades past in the oceans (when the heliosphere was dense enough to damp the GCR flux) now being released in the upper latitudes?
Could this released ocean heat be evaporating more water into the high-latitude weather mix and causing more snow to fall?
Could this snow making cloud cover and humidity be the reason that winter temperatures run above normal lately in some polar regions? Why are the summer temperatures still normal?
The theory of a Forbush decrease has been proven by direct observation in the field.
What field observations directly link increasing (or decreasing) CO2 to the change of temperatures that have occured since the dawn of industry?
Svensmark et al. only claim an order-of magnitude larger effect upon temperature than TSI–an effect not necessarily coherent with the solar cycle. Hence, this irrelevant objection can be dismissed out of hand.
“Svensmark et al. only claim an order-of magnitude larger effect upon temperature than TSI–an effect not necessarily coherent with the solar cycle. Hence, this irrelevant objection can be dismissed out of hand.”
“Only”
AFAIK an order-of-magnitude is 10x
And Leif points out ….
“It is Svensmark et al. that claim they finally have a breakthrough to explain everything; in particular that the observed global warming is almost solely caused by their GCR theory. If you read their papers you will find that they do not invoke any lag at all.
But observations show it is “coherent with the SC” – but anti-correlated….
http://scienceofcycles.com/wp-content/uploads/2017/11/cosmic-ray-particles-versus-sunspots.gif.png
Hence your “this irrelevant objection can be dismissed out of hand.”
Can be dismissed out of hand.
As their figure plainly shows, the claim that Svensmark et al make is a strong linear relationship between GCR and temperature variations at time scales of millions of years. While the idea of an order-of-magnitude amplifying mechanism arose from Shaviv’s oceanic calorimetry over decadal time-scales, the shown anti-correlation with sunspot cycles is far removed from the core issue
I always thought this was the best explanation for the warming, and it explains why the oceans are warming.
Climate change causing clouds to rise higher in the sky and move towards poles
The trend was predicted by climate models and is likely to continue – unless there are major volcanic eruptions
http://www.independent.co.uk/environment/climate-change-clouds-higher-sky-towards-poles-greenhouse-gases-global-warming-volcanoes-a7131216.html
If the “official” climate view is that the known effect (allegedly) of CO2 is a 1.2°C increase for doubling the its concentration but that this can be increased to 3, 4, or even 5° by (imaginary, unproven) forcing that has been calculated (using heavily manipulated data that has been tortured until it provides the desired result) then cosmic radiation should also have a forcing effect that can be calculated by the same methodology.
To dismiss cosmic ray hypotheses out of hand while accepting the (increasingly questionable?) hypotheses surrounding CO2 as near-gospel doesn’t seem very scientific. At least not to this layman. We know clouds are a puzzle. The remarks above in this thread prove there is no firm consensus on how clouds impact our climate. Svensmark may have found one of the missing pieces. We should surely welcome this research which in theory should be repeatable by other scientists.
The graph looks very interesting, shows plausible correlation (but not necessarily causation), and is worth further verification (or rejection). At least this area of inquiry lends itself to the application of the scientific method. That would be a novel and welcome change in the study of climate change.
To dismiss cosmic ray hypotheses out of hand while accepting the (increasingly questionable?) hypotheses surrounding CO2 as near-gospel doesn’t seem very scientific.
Who says that? I don’t. Why do you attack a straw man like this? Perhaps some thought into the matter would help you.
If the “official” climate view is that the known effect (allegedly) of CO2 is a 1.2°C increase for doubling the its concentration but that this can be increased to 3, 4, or even 5° by (imaginary, unproven) forcing that has been calculated (using heavily manipulated data that has been tortured until it provides the desired result) then cosmic radiation should also have a forcing effect that can be calculated by the same methodology.
(OK – the sarcasm light is on)
To dismiss cosmic ray hypotheses out of hand while accepting the (increasingly questionable?) hypotheses surrounding CO2 as near-gospel doesn’t seem very scientific. At least not to this layman. We know clouds are a puzzle. The remarks above in this thread prove there is no firm consensus on how clouds impact our climate. Svensmark may have found one of the missing pieces. We should surely welcome this research which in theory should be repeatable by other scientists.
The graph looks very interesting, shows plausible correlation (but not necessarily causation), and is worth further verification (or rejection). At least this area of inquiry lends itself to the application of the scientific method. That would be a novel and welcome change in the study of climate change.
God bless you, Leif. I hope you are keeping warm on your skis! If we can gen a few more clouds, then perhaps even more snow this winter (which has started early this year here in the northeast and I am guessing/forecasting it will be one of our harder winters). As an olde cross-country skier, my heart calls out to bring it on but cries out when we get to the shoveling! Merry Christmas to all!
T-Man
Leif. I hope you are keeping warm on your skis!
Out here in California the snow cover is really not very suitable for skiing…
Coordinates: 38°14′45″N 122°37′53″W
(he doesn’t believe in god either)…
Oh, yes. There is a god and she is absolutely evil…
Leif,
You are confused. God is good, be He a He or a She. And there is no such thing as evil only a lack of good.
Dream on…
If I am right I win and you lose. If you are right I lose nothing and you still lose as you did not at least have the “dream”.
You lose the dream, but so what, it is faux anyway.
lsvalgaard
As Bishop Blougram (in Robert Browning’s poem) observed, the only choices available are a life of faith diversified by doubt, or a life of doubt diversified by faith. Put another way, does one consider a chess board to be black, but painted white in places, or white, but painted black in places? According to Blougram the difference, which appears to be no difference, is a world of difference.
good for him, but it is like whether the glass is half-full or half-empty. Who cares? .
And perhaps we can get back to science instead of pointless posturing.
It’s the science which causes some of us to believe. Every time we punch through another frontier we find out that what we believed yesterday about our physical world was not quite right or sometimes completely wrong. It’s His sense of humor and encouragement to keep searching.
Caused me to remember 1572, Tycho Brahe, & the nova that became the Crab Nebula. I wonder what sort of impact that had?
This is an interesting discussion. Mostly what I get out of it though, is that all the smart guys still can’t explain what’s going on and why with any ability to predict…but at least this crowd does not march in lockstep in completely the wrong direction like the AGWers…
If feedbacks are generally negative for tsi, as they may well be for backradiation from co2, then the calculated warming of .07C from solar min to max doesn’t mean much. (if we haven’t seen .6C warming that can be attributed to a half way to doubling of co2, then we’re not going to see the calculated number of .07C for solar either) And yet observationally we actually do see .12C warming from solar min to solar max. Therefor, there would have to be a strong feedback mechanism that is unique to the sun (to amplify the lower than calculated solar warming). The premise that TSI over a solar cycle causes a variation of 0.05-0.10 degrees C may in reality be a false assumption (based on a calculation) to begin with. In this way, we can see how it is that the sun could cause an amount of warming that backradiation from co2 cannot…
Within 5~7 years, the Svensmark Effect will likely be confirmed by: falling global temperature trends, growing polar ice extents, increasing polar land-ice masses and the slowing down of Sea Level Rise, despite 1/3rd of all manmade CO2 emissions since 1750 being made over just the last 25+ years.
In 5~7 years, the disparity between CAGW’s global warming projections vs. reality will likely exceed 3+ standard deviations for 25+ years, which should be sufficient duration and disparity to make the CAGW hypothesis laughable.
I expect the blowback against Leftists who wasted $trillions on this CAGW ho@x for 40 years will be profound.
We’ll likely know in 5~7 years if the Svensmark Effect is a viable hypothesis.
“Truth is the daughter of time”. ~Sir Francis Bacon
Well, as a geologist, I’m used to look at past events…. According to the French historian Emmanuel Leroi Ladurie, in his 2005 book “Canicules et glacieres – Histoire humaine et comparée du climat”, during the Maunder Minimum (ther’s a whole chapter of the book devoted to it), astronomic observatories in Europe could only work 1 night every 3 nights (33% of time), because the sky was too cloudy over Europe…
Just my two cents, of course…
Is this paper saying that if the cosmic rays that hit the earth increase by x then on average cloud cover will increase proportionally to x, on the same day ? Meaning no lag.
If so then over a long time period we should be able to see the signal, though I’m not sure how long the period needs to be. We are assuming the cosmic ray effects are independent of other cloud cover effects.
Much if the discussion here is missing the bigger picture. The argument seems stuck on individual trees and misses the forest.
Let’s just step back and think clearly.
1) The Sun (and our distance/orientation) MUST be the biggest factor influencing global temperature (if there even is such a vague non physical concept as global temperature)
2) The cloud cover or Albedo MUST be the second biggest factor (obvious if you ever were outside on a mostly sunny day when a cloud shaded you)
3) All other factors are minor or local. One can assume that atmospheric composition simply doesnt change very much. Water cycles and convection are huge factors but given our planet is covered by two-thirds ocean it is obvious that whatever water does it is a constant factor globally. Only a large meteor impact and/or massive volcanic activity can affect global temperatures and this is pretty much random,
Now bearing in mind the above, strong paleo-climate evidence suggests significant changes in global climate (snowball earth being the most extreme) – effects that do not appear to be related to orbital parameters. What most likely causes this MUST be either the Sun or Albedo. This is the blindingly obvious first place to look!!!! All the rest is 2nd order or 3rd order NOISE.
So while the Svensmark GCR Cloud theory may seem to currently be quite a stretch. Lets face it, this is really a great place to look!!!!! The compelling physics of the situation DEMAND that global effects be SUN or CLOUD cover (ALBEDO) related.
So STOP, take a step back, forget about grandstanding on your soap box and everyone just recognize that this GCR-CLOUD-SUN research is most definitely looking in the RIGHT place!! We should ALL (including Lief) be LAUDING these efforts even if it turbs out to be a dead end!!!!
You are forgetting the elephant in the room, the 70 % of the earth covered by water which stores and releases energy by mechanisms we still do not really understand. Snowball earth is thought by some to have occurred when plate movement cut off the ocean conveyor which takes warm water north and cold water south. Then of course, there is also undersea volcanism, of which we also have little knowledge (obsevations) which also add energy to the situation on an unknown schedule. The number of variables influencing climate is large and clouds and co2 are two of those but cannot, by themselves, be the final answer.
Agreed that the oceans play a significant role due to heat capacity. However, as far as I know the oceans have been around for billions of years and can simply be considered a constant modifier to whatever mechanism actually causes warming or cooling.
Oceans have not been a constant. Like everything else they change. As I noted, currents have changed due to plate movement, temperatures have changed due to cooling of the earth and changes in undersea volcanic activity and so on.
Climate change as measured in tenths of a degree has been small and has varied very little since the Earth has recovered from the Little Ice Age. Whatever models and theories put forward to tout climate change have about the same degree of predictive accuracy as the theory proposed by Svensmark. Both have minimal explanatory value.
I think threshold values are out there as far as cosmic ray increases and the resultant effects.
Those thresholds being an x number of cosmic rays and x time of duration of cosmic ray increases versus cloud coverage increase.
I think thresholds are out there for all prolonged solar effects, and this is why at times nothing dramatic to the climate happens because the thresholds are not reached.
So it is not only the prolonged low solar effects but how low and how long in duration they are which impacts the climate in a major way which makes solar/climate correlations obscure ,when those items are not extreme enough.
There has to be a level of low solar activity that effects the climate, the question is what is the level and is it reached?
I say yes and yes. Reached when the sun enters a prolonged solar minimum period of time following sub solar activity in general.
I think it is starting to happen now.
Overall sea surface temperatures now +.235c down from summer range of +.28c to +.38c
In a previous comment, Dave in Canmore says: “If it was a large effect, then we would see the sunspot cycle affect ocean SSTs. As has been shown previously on WUWT, there is no correlation no matter how compelling the idea may be. Dr Shaviv’s claim only holds when you ignore all the SST data that does not correlate.”
I believe that the inability to find a correlation lies more in the inability to extract information from the raw data, rather than the lack of the information within the data.
When characterizing forcing variables, I like to use the Exponentially Weighted Moving Average, EWMA, (see Wikipedia for its description). It is a common filter used for signal processing for process control, because it has three excellent characteristics:
. – It is computationally very efficient, with using only 3 pieces of data for a calculations
– It is a very effective tool for removing signal noise, to reveal the underlying trends.
– Past history decays away exponentially, much like a natural process, rather than being dropped, like with conventional averaging.
I have done this for both ENSO and Sunspot data, and got some very interesting results. I am unable to post the graphs, so I will describe them.
When I apply the EWMA to ENSO monthly data, using a weighting (λ) of 0.01 for the latest month, I get a graph that very closely resembles the global temperature trends of the last 60 years, in particular the generally increasing trend from approximately 1970 to 2000, followed by a pause.
When I apply the same method (EWMA 0.01) to the Sunspot Numbers, as a proxy for solar forcing, I get a similar graph, only about 30 years earlier. In this case there is a systematic rise in the EWMA of Sunspot numbers from approximately 1935 to approximately 1965, followed by a pause until approximately 1995. The EWMA of Sunspot numbers has since rolled over and is now in a declining trend.
In summary, by applying a simple statistical process control filter to the data, it is possible that their is a remarkable similarity between increased ENSO forcing and increasing global temperatures in the period since 1970, including the pause since 200, Likewise there is a remarkable similarity between between increase ENSO forcing and increased Solar forcing, approximately 3 decades earlier. The solar forcing also paused, after 1965, and is now declining.
These results suggest that the root cause of the increase in global temperatures that we have seen since 1970 may be the rather remarkable increase in solar forcing, as characterized by the Sunspot number, in the middle of the 20th century. As is well known, this increase in solar forcing has now reversed itself.
I would be happy to forward the graphs by e-mail to anyone who is interested. (dh.mtl.can@gmail.com)
Tmax is a good proxy for energy coming through the atmosphere.
Funny: cannot find the 11 year Schwabe cycle there, but I do see my 23 years Hale cycle
So far I have:
1)Tmean before 50 years ago is not reliable.
2) SSN before 100 years ago is not reliable.
3) there is no Schwabe cycle. The Hale cycle is clearly visible in the Tmax record.
My prediction for the future:
One more Hale cycle of cooling coming up now. Sharp drop in T coming up very soon. We are now where we were in 1930. Only 2 years away from the big dust bowl drought. 10 years away from the freezing 40’s.
That is going to cause some problems.
Yet, we have all these clowns here fiddling with their violins, completely clueless about climate change.
What a tragedy.
Seasons greetings all.
One thing that seems to be missing is that cloud albedo can apparently vary some based upon the nature of the particulates involved. Consequently, it’s not just the total coverage amount of clouds present. I seem to recall Lindzen’s Iris Effect research/theories looked into this.
Talk is just that, talk.
It seems from this passage that their results are experimentally verifiable.
.If it can be shown, It must be so.
Things that are true can be dismissed out-of-hand.
It happens all the time.
First Svensmark & Co should be congratulated for over 20 years of publishing papers about GCRs, replete with a very effective PR campaign, without ever having to or be expected to show much of any ongoing real-time evidence or predictions at all to support their theory about the relative influence of GCRs over time on real weather and climate indices wrt clouds and SST warming/cooling, and events such as ENSOs.
Have they made a single falsifiable prediction with their theory in 20 years? Can they? How will GCRs effect SSTs and the ENSO for example, next year. When is the next GCR ENSO and how and why will it occur? The same questions of CO2 theory are left unanswered too.
If only we all could get away with such regular handwaving, as warmists do, as those who mainly think the atmosphere controls climate change via GCRs and/or CO2.
This paper and conventional theory in general mis-attributes and misrepresents the real TSI influence as minor when it is everything. I see lots of people here having a definite opinion on TSI without showing me any sign of having done any research of their own on the subject, with many simply parroting Leif’s and the IPCC UN faulty view that TSI is the least important ‘forcing’. This conventional view is inverted.
The TSI solar cycle influence is responsible for SST warming and cooling. Clouds are primarily an effect of insolation ocean heating. High TSI or high insolation even under low TSI are responsible for tropical ocean evaporation that provides the majority of water vapor in the atmosphere. Without this tropically evaporated WV, no GCR ion nucleation happens.
What is necessary to put GCR theory in its true place in the order of solar influences is an understanding of TSI-insolation warming/cooling first, in order to understand that the TSI influence is not below 0.1C, but virtually the whole solar cycle temperature rise and fall. The conventional idea of the TSI influence is wrong.
Their theories aren’t operational nor can they provide daily weather insights in the way understanding TSI properly allows me (and yes, eventually you too) to do. Extreme event attribution becomes easy when you know how the always ongoing variable TSI influence is affecting SSTs and evaporation.
I’ll be back to clean this climate mess up in January after the 2017 data is in, with a full report on my research, my successful F10.7cm-TSI-SST forecasting, reveal the true TSI solar cycle influence, show how TSI causes extreme events, and to finally put GCR and GHG theories in their place as 2nd and 3rd order effects.
Bob
there are some of us who did do some research.
Most clearly emanating from a number of completely different angles of research by myself is a sine wave for incoming energy which has a wavelength of 86.5 years.
The curve is natural: top was in 1971-2, bottom was in 2013-4
It looks from history that there could have been hiccups at the turning points [increased minima /maxima?], but then again, the data that you have to rely on is just so ‘old’
.The quadrants are about 22 years on average – some variation has been observed.
if you are clever, you can use this info to predict the weather…

it works like a clock does it not?
Must be intelligent design.
Wishing you a blessed Christmas and a healthy New Yaer.
.
sorry
that should have been;
Wishing you all! a blessed Christmas and a healthy New Year.
I think as the low solar activity becomes more established the climatic effects solar does have on the climate will become more apparent.
The next few years starting from this point in time should be revealing.
Clouds modulate the heating effect of the sun by acting as a thermostatic sunshade. More warming produces evaporation and more clouds. Less warming and fewer clouds results in more solar radiation getting through. This mechanism creates stability. Solar radiation penetrates the oceans, but due to poor mixing, much of this energy can be retained at depth.
The sea surface temperature determines the temperature of the atmosphere with which it is in contact. It therefore acts as a buffer with regard to air temperatures.
Solar cycles occur because the surface of the fluid plasma does not keep up with the rotating solar core creating contortions in the magnetic field. Some papers claim that variations in cycles (i.e. periods of activity and inactivity) are related to the gravitational effects of different alignments of the more massive planets in our solar system.
If the solar plasma is subject to gravimetrically induced turbulence, then so should the oceans covering two thirds of our planet. Such turbulence may well include the phenomenon known as overturning whereby vertical mixing results in heat flows within the oceans.
This may explain why changes in solar activity appear to coincide with changes in climate.
Do you associate solar energy that has penetrated the ocean surface and retained at depth with the known ~60 year ocean cycles?
I’m not claiming anything yet in that level of detail. I’m simply saying that most of the heat is stored in the oceans. The gravitational effects of the larger planets that churn up the sun to produce maximum solar activity must surely affect our oceans too.The release of heat from overturning of the oceans would then coincide with high solar activity. Periods of low solar activity would coincide with a low level of heat release from the oceans due to low levels of overturning. This could explain the observed relationship between solar activity and our climate.
Today phys.org referenced a paper showing an 11-year cycle of brightness on Uranus. The authors attribute it partly to the likelihood of ion-induced nucleation due to increased galactic cosmic ray influence during low solar activity. They also reference an earlier paper showing the same effect on Neptune.
https://phys.org/news/2017-12-sun-remote-planet-uranus-brightness.html
actually, by looking at the position of Uranus and Saturn you can predict the solar polar magnetic field strength,
did you know that?
http://oi64.tinypic.com/5yxjyu.jpg
We can argue about the merits of Dr Svensmark’s work, but there is no doubt that ionized particles cause water molecules to condense into droplets, and thus clouds. For about a century, scientists have utilized cloud chambers to detect Cosmic Rays and other particles.
Supernovae are only one source of Cosmic Rays, and the rate of arrival of CRs at Earth depends on the strength of the Solar Wind, which itself varies with Solar activity cycles. Papers published around ten years ago linked Cosmic Rays, the Solar Wind and Solar cycles, and the Solar System’s transits in and out of the spiral arms of the galaxy. I drew together some of the source material here:
http://granitegrok.com/blog/2013/08/forecast-for-global-warmists-cloudy-with-a-chance-of-cosmic-rays
(Thanks also to American Thinker for some of the material used.)
Something comes to mind.
The Earth’s magnetic field “Flips” every 200,000 to 300,000 years on average.
This would obviously have an effect on the number of GCR’s entering the atmosphere.
Is this detectable in the record?
No.
https://phys.org/news/2012-10-extremely-reversal-geomagnetic-field-climate.html
http://www.leif.org/research/LaChamp-Event.png
From their paper http://www.sciencedirect.com/science/article/pii/S0012821X12003421 :
“No direct link between climate variability and geomagnetic field intensity [and thus GCRs] , as contemporaneously recorded in the Black Sea sediments is obvious from this study.”
It was a rhetorical question Leif…. in that I was sure there wasn’t.
I think the earth’s magnetic field ‘s role in the climate is not accounted for in an adequate manner.
The evidence is when the magnetic fields of the sun and earth are weak the result is cold.
This is the direction that seems to be occurring.
Comic ray counts now above 7000 and overall sea surface temperatures down to+.210c.
I expect overall sea surface temperatures to keep falling and be around 0 deviation by summer of 2018.
Opinions are so vastly different we will see.
Opinions are so vastly different
Opinions are not science.
Opinions are fake science.
Such as the 97%, used to bully non-believers.
cor – cosmic ray count 6726 . I had said over 7000 which was wrong.
Mmmm: Interesting that Svensmark et al to not cite a paper by Kulmala et al (below) – but do cite earlier papers by the same author. Svensmark et al. seems to ignore a number of recent papers that appear to contradict what they’re suggesting in this new paper.
https://www.atmos-chem-phys.net/10/1885/2010/acp-10-1885-2010.pdf
“Our analysis shows that none of
the quantities related to aerosol formation correlates with the
cosmic ray-induced ionisation intensity (CRII). We also examined
the contribution of ions to new particle formation on
the basis of novel ground-based and airborne observations.
A consistent result is that ion-induced formation contributes
typically significantly less than 10% to the number of new particles, which would explain the missing correlation between
CRII and aerosol formation. Our main conclusion is
that galactic cosmic rays appear to play a minor role for atmospheric
aerosol formation events, and so for the connected
aerosol-climate effects as well.”