From the INSTITUTE OF ATMOSPHERIC PHYSICS, CHINESE ACADEMY OF SCIENCES and the “obvious science” department comes this stunning revelation.
Arctic influences Eurasian weather and climate
Over the past decades the Arctic has lost 65% of its sea ice volume. The atmosphere above the Arctic has been rapidly warming and moistening at the same time.
What does this mean for the weather and climate of the densely populated Northern mid-latitudes? Dr. Tido Semmler started to perform idealized climate model experiments to answer this question when a record low Arctic sea ice extent occurred in 2007. At this stage he was working as a meteorologist at the Irish Weather Service Met Eireann in Dublin, Ireland.
Especially in winter the weather and climate of the Arctic influences the weather and climate of the Northern mid-latitudes, but not everywhere to the same extent. In a recently published study in Advances in Atmospheric Sciences , Semmler, now working at Alfred Wegener Institute at Helmholtz Centre for Polar and Marine Research in Germany, and his colleagues find the sea areas and the western coasts of the continents are relatively little affected. The strongest influence occurs over the continental regions, more over Eurasia than over North America. This means that even though the Arctic might be perceived as a remote and sparsely populated area, the changes there may be of relevance to the society in denser populated areas.

“Better Arctic observing systems can lead to better weather forecasts over the continental mid-latitude areas, especially in winter. ” says Semmler.
###
OK. Don’t worry about its.
How did New Zealand and Australia come to be in the Arctic; or at least the mid northern latitudes??
Some fancy plate tectonics.
G
Where do you see Oz and NZ on the MAP let alone in the mid-northern latitudes?? That MIGHT be Australia at the outermost ring, right about 11 o’clock.
Just inside the outer ring at about 4:30 with Australia hanging off the tip of North Island.
Don’t blame me….. Rand McNally has been making maps for a hundred years or more, so no excuse for using unreadable maps.
G
At 4:30 looks like Arabia to me.
@menicholas
Second the motion.
@george e. smith
I think you inverted water and land. The whole bottom of the circle from about 7 o’clock to 5 o’clock is the northern part of Africa.
D. J. Hawkins
December 7, 2017 at 4:02 pm
Agree totally.
‘North Island’ is the Oil Gulf.
Auto
I didn’t invert anything.
Both sides of the black line look the same to me.
Blame the map maker; not me.
G
@george e. smith
OK, I know who’s not going to be the navigator for my next road rally… 🙂
G: Are you on drugs or just drunk, because as hard as I look, I can’t see New Zealand nor Australia anywere on the map, just a normal polar centered map of the northern hemisphere.
The notion that Oz is co-latitudinal with North Africa is just nuts. What shows up at ~4:30 is the Persian Gulf and the northern section of the Arabian Sea, not the North Island of NZ. Beware of too much Christmas cheer in the early afternoon.
“Arctic influences Eurasian weather and climate,” gosh that is a stunning revelation. (What was that book? ‘Everything I need to know I learned in Kindergarten’ or something like that.)
You were born knowing everything. Life’s journey consists of unlearning stuff you knew for a fact
G
Hmm…could it be that the arctic is influencing Eurasian weather, or could it be more likely that another factor is influencing them both and that their interaction is also influencing both regions.
These fools seem to miss a whole segment of coincidental factors.
“climate model experiments”
Is a contradiction in terms. If it is running a model it is making calculations. Experiments involve measuring things in the real world.
In the post-truth world, models are reality and data is a mere inconvenience. This is one of the things in science which desperately needs fixing.
“Adjusted” data is less of an inconvenience. This is another thing in climate science that needs fixing.
As in the Hitch hikers guide to the galaxy I prepared this extra one earlier.
that one was very good. Models are reality and data is a mere inconvenience.
“Over the past decades the Arctic has lost 65% of its sea ice volume. The atmosphere above the Arctic has been rapidly warming and moistening at the same time.”
The loss of Arctic ice has more to do with warmer ocean water entering the Arctic and melting the sea ice from below, than the atmospheric warming melting the ice from above. More open water in the Arctic leads to a warmer atmosphere, but also to more annual heat loss to the sky. It is part of a longer term ocean cycle that is part of the Earth’s thermoregulation.
As far as I know the only measurements of sea-ice volume are from Cryosat and started in 2010. During that time there has been little change:
http://www.cpom.ucl.ac.uk/csopr/sidata/thk_ts_0.large.png
“Arctic influences the weather and climate of the Northern mid-latitudes,”..since they didn’t say…I’ll assume it’s colder
Weather is not affected by ice volume. It is by ice extent. And the Arctic has not lost any of its winter sea ice extent, nevermind 65%. Pure GIGO. A collage of confusions.
I noticed that too. Any suggestion of 65% has to be summer lows (Late August, early September), but the article sais the arctic influences Eurasia primarily in the winter. Seems like more junk ‘science’ to me.
it is the october number. so, yes, you are right. near the minimum
“It is by ice extent”
You’re right there. As Anthony says above its “obvious science”.
“Arctic has not lost any of its winter sea ice extent”
This is where you start going wrong. The extent loss is also obvious over the satellite period.
http://nsidc.org/arcticseaicenews/files/2017/12/asina_N_iqr_timeseries.png
You can quibble about it’s accuracy but the trend is unmistakable.
This appears to be a pretty good depiction of changes in ice volume. About to thirds of summer ice and one third of winter’s.
http://neven1.typepad.com/.a/6a0133f03a1e37970b01b8d2b2dd90970c-pi
Again I know a few will quibble, but despite that, obviousness is one of it’s prominent characteristics.
With very little multi-year ice left, the day the extent chickens come home to roost is fast approaching.
Loved this: “the changes there may be of relevance to the society in denser populated areas.”
As another blob of Arctic dangles down over Cleveland and a it’s balmy western counterpart surges up over Seattle.
“It is by ice extent”
You’re right there. As Anthony says above its “obvious science”.
“Arctic has not lost any of its winter sea ice extent”
This is where you start going wrong. The extent loss is also obvious over the satellite period.
http://nsidc.org/arcticseaicenews/files/2017/12/asina_N_iqr_timeseries.png
You can quibble about it’s accuracy but the trend is unmistakable.
My “quibble” is that your graph cuts off at about mid December . . tone tone . . but it does show enough to indicate extent variability is much greater in the warm season.
It is a misleading chart Tony, can you figure it out?
The trend is unmistakable – down in summer. Then up, Up, UP!
Sorry – I know I shouldn’t feed the troll.
#
Auto
Someone attempting to address your misapprehensions is not a troll. The trend is down in both summer and winter.
How can it be down in winter when there is no January, February, March or even April there? The largest extent in ice occurs a bit later than the peak in coldest Arctic winter temperatures.
The coldest period showing winter below 245 k is between (using the mean – blue line) 350 days to 80 days. This refers to 16th December until 21st March.

The difference between annual winter extent is less than 7% each year.
http://www.climate4you.com/images/IRAC%20JAXA%20ArcticSeaIceExtentSince20020601.gif
There is hardly any change in winter ice extent during this century with just a very slight decline, hardly noticeable since 2007.
Sorry – green line for below 245 k not blue. The blue line refers to the freezing point of water and in the chart below that, the mean Arctic ice extent.
That’s what caught my eye too. Lost 2/3 of it’s volume? No, only in summer. Not sure if that is most recent summers or 2007 and 2012?
The problem is probably an artifact of good data (from satellites) becoming available at a recent peak in ice coverage. The inadequate records from the 1930’s seem to indicate fairly low ice coverage, but the records are inadequate to make any hard conclusions.
The Arctic has lost 65% of it’s ice?
Got any documentation to back up that whopper?
Perhaps if your time line starts in winter and ends in summer.
http://psc.apl.uw.edu/research/projects/arctic-sea-ice-volume-anomaly/
“Sea Ice Volume is calculated using the Pan-Arctic Ice Ocean Modeling and Assimilation System (PIOMAS, Zhang and Rothrock, 2003) developed at APL/PSC.”
Ok, so from PIOMASS, 2017 was 65% below the 1979 volume for October. Before the ice has recovered from the Sept. minimum. Still significant, however.
Actual measurements don’t agree with PIOMAS:
http://www.cpom.ucl.ac.uk/csopr/seaice.html
Strange coincidence: on the very day and almost to the hour that the map above is issued on WUWT , showing no or negligible arctic influence on the British Isles winter weather, an arctic gale is bringing snow and subzero temperatures to Scotland and northern England to an extent not seen this early in winter for many years. Perhaps the science is not quite settled yet.
an arctic gale rejecting the theory of global warming and the models.
Mike..
lts not that early in the season for snow, just think back to 2010. Now that was a December to remember, the second coldest in the CET record since 1659.
taxed,
Agree – in Surrey [postal] London [admin] – we had snow lying throughout the month of December 2010.
Auto
There’s a lack of arctic ice? Somebody should tell that the all the arctic ice:
http://polarportal.dk/en/havisen-i-arktis/nbsp/sea-ice-extent
The Arctic Ocean ice (old, new, volume) did suffer a loss in 2007.**
Winds and active ocean surface caused ice to flow south and melt in warmer water.
Accumulation has occurred since then. To what extent, I’ll leave to others.
**Documentation was provided here at WUWT: https://wattsupwiththat.com/2009/04/13/watching-the-2007-historic-low-sea-ice-flow-out-of-the-arctic-sea/LINK April 13, 2009
Sorry. Going to my room now.
The only one of countless sea ice sites to actually show the amount of multi-year ice (russian):
http://www.aari.ru/resources/d0015/arctic/gif.ru/2017/20171205.gif
Red is multi-year ice.
yarp
https://realclimatescience.com/2017/12/arctics-sea-ice-volume-up-15-since-2007/
Where is Arctic sea ice NOW?
http://masie_web.apps.nsidc.org/pub/DATASETS/NOAA/G02186/latest/4km/masie_all_zoom_4km.png
They still have not learned how to read long cycles in the AMO. I guess they can paper over their mistakes with IMF money when the time comes. Paper Euros make good fuel along with wood pellets from America.
“They still have not learned how to read long cycles in the AMO. ”
If it’s the AMO, then why does the decline extend through the 70′ 80’s and into the 90’s when the AMO was negative?
http://osisaf.met.no/quicklooks/sie_graphs/nh/en/osisaf_nh_iceextent_seasonal.png
Maybe you should look at the unadjusted and not detrended data….
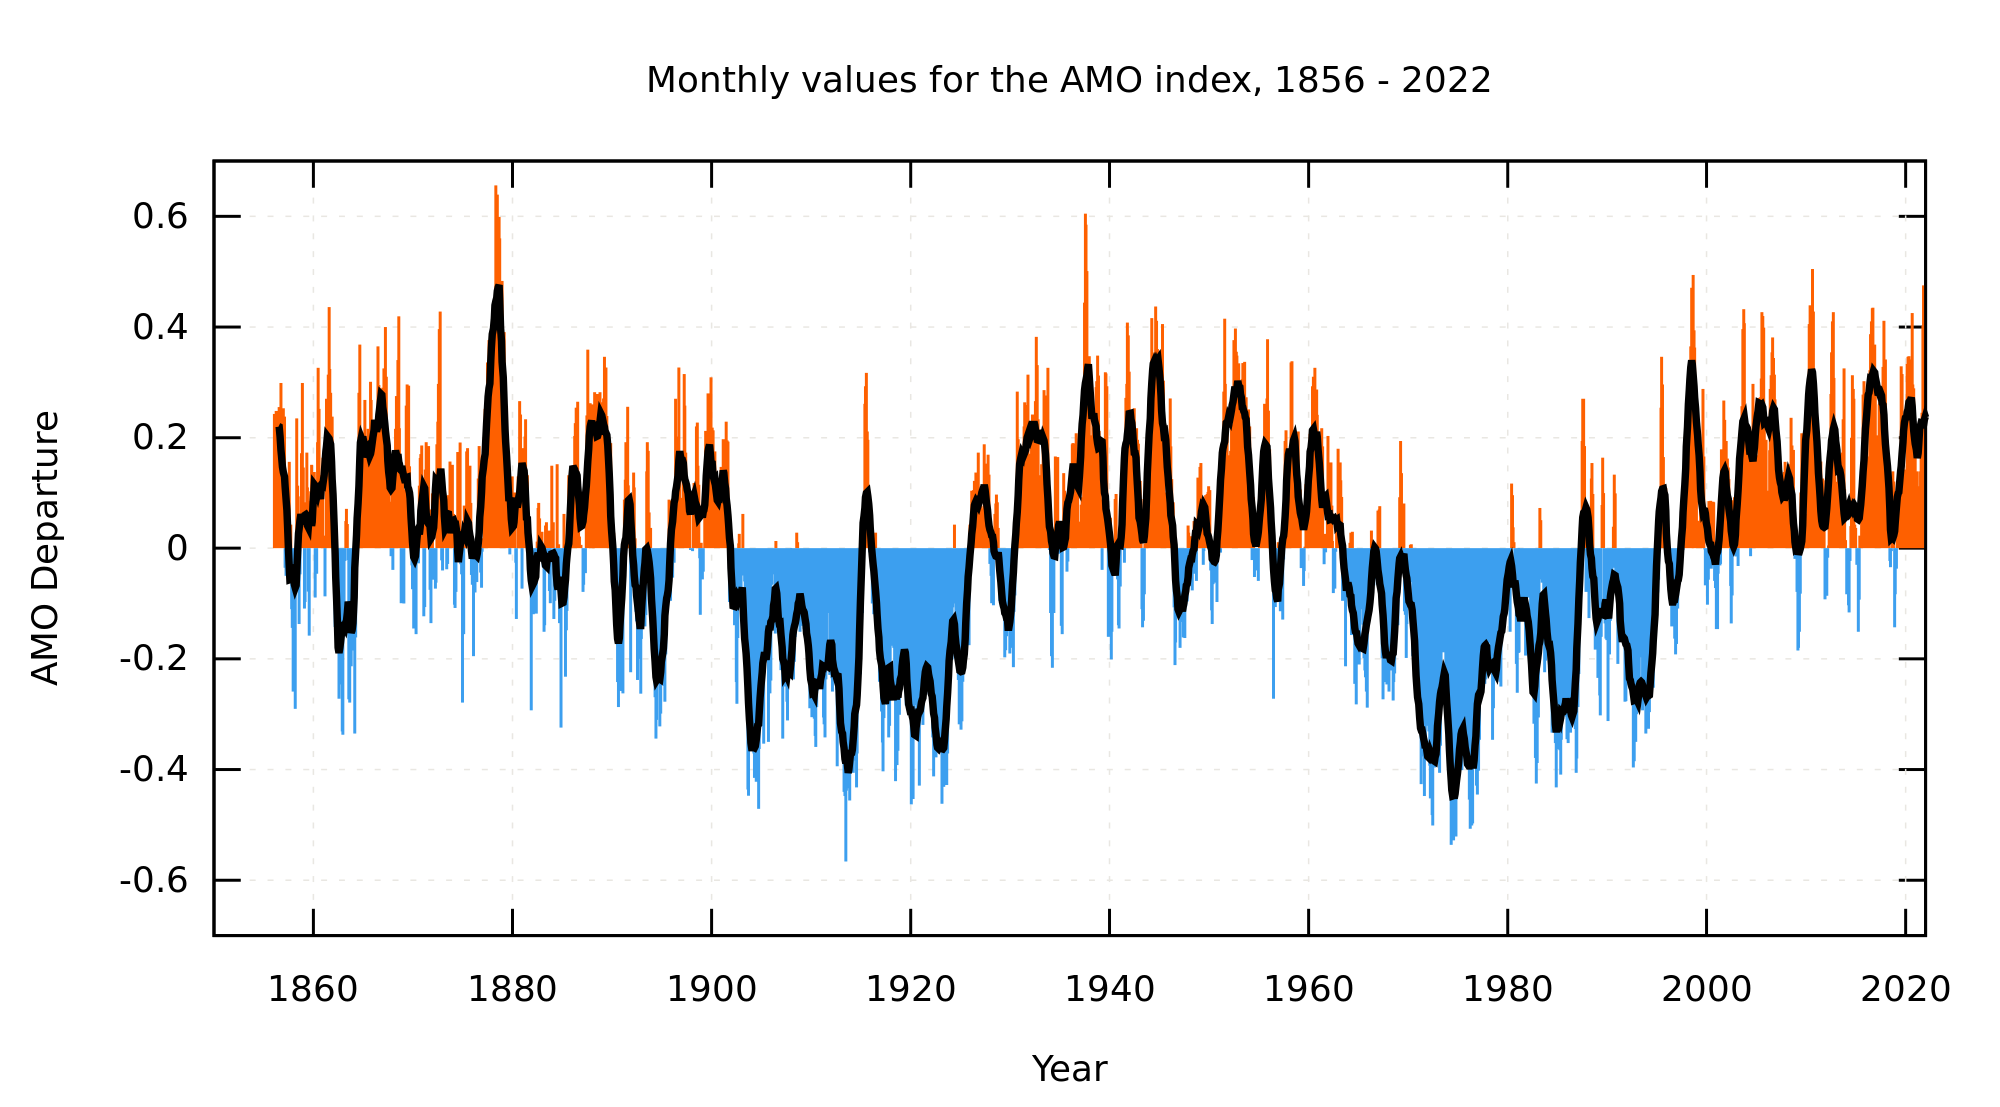
http://www.climate4you.com/images/AMO%20GlobalAnnualIndexSince1856%20With11yearRunningAverage.gif
http://www.climate4you.com/images/NOAA%20SST-NorthAtlantic%20GlobalMonthlyTempSince1979%20With37monthRunningAverage.gif
http://climate4you.com/
“If it’s the AMO, then why does the decline extend through the 70′ 80’s and into the 90’s when the AMO was negative?”
I’m not following you on this…..the decline is right in line with the AMO warming
Sorry can’t see a sig diff.
I still see below ave SST’s in the 80’s and early 90’s that’s not reflected in the seaice trend.
“I’m not following you on this…..the decline is right in line with the AMO warming”
Yes, but so is the decline there when SST’s were cold.
I assume if the AMO were the main cause of ice decline that it would have not been when the AMO was -ve.
Well, when you start measuring arctic sea ice in 1979…and compare it to the AMO…..it can only go one way
Start at the bottom of the AMO…when sea ice was highest….as the AMO warms up, sea ice decreases
The chart below shows the relationship between Arctic sea ice and the AMO clearly.
http://www.woodfortrees.org/plot/nsidc-seaice-n/from:1979/normalise/plot/esrl-amo/from:1979
1) When the AMO is often high, Arctic sea ice is low.
2) When the AMO is often low, Arctic sea ice is high.
There is no better relationship.
“Shock news: The Arctic influences Eurasian weather and climate”
Shock news: Eurasian weather and climate influences the Arctic.
From their map, the yellow area of “Arctic influence” seems to stop at the St. Lawrence River, and not include any of the Great Lakes states, while the yellow area seems to include all of France and Italy, and even parts of Morocco.
Anyone who has lived in Michigan, northern Indiana or Ohio, or western Pennsylvania or New York State knows that when a Polar Vortex comes in November, December, or January, they can get several feet of lake-effect snow, which could easily be considered an “Arctic influence” over the weather. Which is a much greater “Arctic influence” than they ever get in France or Italy, outside of the Alps.
It looks like whoever drew that map never lived near the Great Lakes.
Talking about Antarctic influence weather and climate in Eurasia, that would be a surprise, but the Arctic. What is new about, polar vortex ?!?
Rather then the Arctic changing the weather, maybe its the weather that’s changing the Arctic.
They say the Arctic air is warming and moistening. Well yes it would be if there were increasing amounts of warm moist air over the oceans been driven up into the Arctic. Which are been caused by waves in the jet stream and blocking patterns.
Just look at the current weather pattern in the NH at the moment. Where blocking over western N America is driving warm air from the eastern Pacific into the Arctic. Plus blocking over the Atlantic is helping to drive warm air from the Azores up towards the Arctic. So maybe its a increase in this type of weather patterning that’s warming the Arctic during the winter.
By jove, I think you’ve got it.
Taxed
The accepted understanding is that heat moves from the equator to the poles, and yet they can’t understand why the Arctic increases in temperature when the mid latitudes have greater heat release from the oceans.
The same applies to the Antarctic as the Arctic. Both poles record short term temperature rise pulses. These are directly attributable to mid latitude pulses.
I have been saying for some time, stop looking at the accuracy of local temperature data and arguing, look at what is being recorded. Where did the heat come from.
October 20, 2017
“Piers Corbyn, forecaster for WeatherAction, said the jet stream is showing signs of diving southwards allowing the polar vortex – a pool of freezing air over the Arctic – to sink across northern Europe.
He said winter is about to set in early with freezing conditions and even snow possible any time now.
He said: “We are expecting an early taste of winter this year, it is already starting to feel colder and we could see snow by the end of the month.
“This could affect large parts of the UK between now and Christmas, this is all part of an new era which we believe is going to lead to a mini ice age.
“The jet stream is behaving erratically and showing signs of diving southwards over the next few weeks allowing the Polar vortex to sink over Britain.
“Parts of this winter are shaping up to be particularly harsh.
“We can’t expect Britain, yet again, to dodge the cold blasts which over the past few years have only hit America.”
https://www.express.co.uk/news/weather/889046/UK-weather-latest-Storm-Caroline-map-track-BBC-weather-Met-Office
The polar vortex is weak.
http://www.cpc.ncep.noaa.gov/products/stratosphere/strat-trop/gif_files/time_pres_UGRD_MEAN_OND_NH_2017.png
http://www.cpc.ncep.noaa.gov/products/stratosphere/strat-trop/gif_files/time_pres_UGRD_ANOM_OND_NH_2017.png
I do not believe in the transport of warm air into the Arctic via Atmosphere as the sole cause of Arctic warming in winter, but the warmth and humidity in the Arctic is created by warmer water in place. Especially in times of El Ninos this phenomenon can be observed. More than half of the humidity and heat in the atmosphere above the northern North Atlantic comes from the Indo-Pacific Warming Pool and is brought into the Atlantic via swirls from the Agulhas Current, el Nino influences the Arctic from the other side across the North Pacific. Both have their starting point in the tropical Pacific and Indian Ocean. Changes in the ultraviolet solar radiation, where the sun shines unhindered and perpendicular to the sea, heat upper water layers stronger. This has implications for the Arctic and one should pay attention to this.
Warming moistening winter Arctic = snow and ice formation…(like Greenland Ice Mass increase) eeeeeeek!
Yes plus this report suggests much of this increased snowfall will also be falling over the land masses of N America and Russia.
Yes l also don’t believe its the sole cause, but certainly believe its one of the causes.
Because when this happens not only does it push air warm air into the Arctic. The winds also help to push warm water towards the Arctic as well. Plus also these winds blowing from the south help to push back the ice northwards and so stop it from extending.
Why would the volume of ice matter more than the extant? Should not extant be significantly more important?
Forecast of the stratospheric polar vortex.
https://earth.nullschool.net/#2017/12/12/1200Z/wind/isobaric/10hPa/orthographic=-75.43,66.47,298
Anyone have any info on why the Arctic temps are way above average in winter, but average or slightly below in summer?
Ocean currents.. AMO particularly.
Water is slightly warmer during the peak of the AMO, so affects winter temps (very dry so temps are easily affected)
….. but still too cold to affect summer temperatures.
Not sure we can say summer temps are down,
errors probably too large.
if we do go into a mini ice age there would have to be a reversal of the warming in the north pole, other words less warm water flowing under the ice melting it from below. We may be in a more wavey jet stream era but there is no sign of a mini ice age and a significant drop in temperatures yet.