High altitude instrumentation balloon measurements show an increase in cosmic rays since 2015
Since the spring of 2015, NASA’s Spaceweather.com and the students of Earth to Sky Calculus have been flying balloons to the stratosphere over California to measure cosmic rays. Soon after our monitoring program began, we quickly realized that radiation levels are increasing. Why? The main reason is the solar cycle. In recent years, sunspot counts have plummeted as the sun’s magnetic field weakens. This has allowed more cosmic rays from deep space to penetrate the solar system. As 2017 winds down, our latest measurements show the radiation increase continuing apace–with an interesting exception, circled in yellow:

In Sept. 2017, the quiet sun surprised space weather forecasters with a sudden outburst of explosive activity. On Sept. 3rd, a huge sunspot appeared. In the week that followed, it unleashed the strongest solar flare in more than a decade (X9-class), hurled a powerful CME toward Earth, and sparked a severe geomagnetic storm (G4-class) with Northern Lights appearing as far south as Arkansas. During the storm we quickened the pace of balloon launches and found radiation dropping to levels we hadn’t seen since 2015. The flurry of solar flares and CMEs actually pushed some cosmic rays away from Earth.
Interestingly, after the sun’s outburst, radiation levels in the stratosphere took more than 2 months to fully rebound. Now they are back on track, increasing steadily as the quiet sun resumes its progress toward Solar Minimum. The solar cycle is not expected to hit rock bottom until 2019 or 2020, so cosmic rays should continue to increase, significantly, in the months and years ahead. Stay tuned for updates as our balloons continue to fly.
Technical note: The radiation sensors onboard our helium balloons detect X-rays and gamma-rays in the energy range 10 keV to 20 MeV. These energies, which span the range of medical X-ray machines and airport security scanners, trace secondary cosmic rays, the spray of debris created when primary cosmic rays from deep space hit the top of Earth’s atmosphere.
The data points in the graph above correspond to the peak of the Reneger-Pfotzer maximum, which lies about 67,000 feet above central California. When cosmic rays crash into Earth’s atmosphere, they produce a spray of secondary particles that is most intense at the entrance to the stratosphere. Physicists Eric Reneger and Georg Pfotzer discovered the maximum using balloons in the 1930s and it is what we are measuring today.
Source: NASA’s spaceweather.com
1. No mention of Henrik Svensmark, Eigil Friis-Christensen, Jasper Kirkby, et al. Why am I not surprised?
2. Is that spaceweather link at the end correct?
There shouldn’t be any as those folks are not involved with the solar control of the GCR level.
Yes, how will this affect terrestrial weather, if at all.
http://www.euanmearns.com/wp-content/uploads/2014/01/GISP2_DO-10Be.png
There is rough correlation between cosmic radiation and global temperature. Rough because the production of cosmogenic isotopes is also influenced by climate and CO2 levels itself.
https://www.degruyter.com/downloadpdf/j/geochr.2014.41.issue-3/s13386-013-0161-2/s13386-013-0161-2.pdf
Solar activity has decreased the last 50 years and the Erth’s magnetic field has also decreased a bit. so the level of GCRs should have increased slightly, and it has:
http://neutronm.bartol.udel.edu/
On the other hand the climate has warmed, so GCRs do not seem to have the intended effect of cooling. So, to first order there is no effect.
GCRs at Thule
http://www.leif.org/research/GCR-Thule.png
It should, if Svensmark and others are correct, lead to greater cloudiness in the tropics by creation of abundant condensation nuclei.
This is exciting data.
lsvalgaard, here is the chart that I have for Cosmic rays since 1964. http://cosmicrays.oulu.fi/
I would paste the picture if I could figure out how.
[Done. For future reference, here’s the code to do it.

-w.]
Proves my point.
That depends on the integration time (lag time) of the system response.
on a separate note: The early Sept 2017 solar magnetic event is apparent in the annual Oulu count that averaging then smoothed out the short term dip in neutron count.
Could it be that it has a discernible effect but is only slight, detectable if no other influences present, but can be easily masked by other influences
“Solar activity has decreased the last 50 years and the Erth’s magnetic field has also decreased a bit. so the level of GCRs should have increased slightly, and it has:
http://neutronm.bartol.udel.edu/
On the other hand the climate has warmed, so GCRs do not seem to have the intended effect of cooling. So, to first order there is no effect.”
Is there any connection between decreasing solar activity…a slight increase in GCR’s…
…and a small warming?
If temperature were controlled only by GCRs and there was no thermal lag in the system, then your comments would be definitive.
Since neither condition is true …
lsvalgaard december 6 1:02pm
On the other hand the climate has warmed, so GCRs do not seem to have the intended effect of cooling.
Just because they don’t seem to have the intended cooling effect doesn’t mean that they don’t. Temps could be warmer than they otherwise would be without the cooling effect of increased cosmic rays. What is need is some sort of controlled experiment and, short of that, we don’t know what the effect (of GCRs) is on the climate…
Mother Nature has already performed a 50-year experiment with a negative result. And before that she performed the experiment for hundreds of years, but our data are of less quality for the earlier time.
The way they jiggle around with the temp…it could be cooling for all we know
Mother Nature most certainly has not performed a fifty-year controlled experiment. Anything could be driving the upward trend in temperature. GCRs could be influencing the temperature change without our having any way of knowing it. (without GCRs, temps could be warmer than they actually are)…
Among the many variables that go into the climate system, then only one we have some [limited] control of is the CO2 concentration. We have increased the COs concentration and as expected the climate jas warmend. Mother Nature has increased the GCR flux but contrary to expectations the climate has not cooled, so clearly the GCR flux did not have a sensible influence on our climate. that is all there is to that.
That is not all there is to that. Things could be causing greater warming than the cooling effect of GCRs can take away…
1. What Leif said
2. NASA still hasn’t implemented https on that site, so I changed it to http.
Thanks for the link! Cool stuff. Nice aurora pics as well.
“Solar activity has decreased the last 50 years and the Erth’s magnetic field has also decreased a bit. so the level of GCRs should have increased slightly, and it has”
The decadal trend from your graph clearly shows otherwise. Radiation was clearly in a strong down trending mode/line until the spike bottom in the early 1990’s put in the lows from cycle 22. This was only confirmed with higher lows at the same point in the next cycle in the the early 2000’s from cycle 23. Those cycle 23 lows, were still similar to the lows of cycle 21 but still lower than cycle 20(less than 50 years ago)……not higher.
It’s only been with cycle 24 that we have lows that are above previous cycle lows going back to the start of the period on your graph. Those higher lows were only set in the last 5 years.
I’m sure that you’re aware that the oceans have over 1,000 times more heat capacity as the atmosphere and they store heat for decades.
If Svensmark’s theory is correct, one would not expect any cooling until the oceans have burped out a significant amount of the excessive heat that was stored during previous cycles.
The process of more heat being stored vs more heat being lost in the oceans from a change in this metric, would take numerous years to reverse course or play out, like a ship turning at sea……..if there is to be any effect.
I am not making a case for Svensmark’s theory…….just explaining why it has not been tested yet based on the above realities.
The decadal trend from your graph clearly shows otherwise
No, it doesn’t. cycle 19 was one the highest and cycle 24 one of the lowest.
http://www.sidc.be/images/wnosuf.png
And a trend over a decade is not a climate trend. 30-60 years is more like it.
Read his book. Question is whether we will see increased clouds and a subsequent cooling?
Dr. Isvalgaard,
You must be focusing on just one thing, the spike higher in the international sunspot count from cycle 19. This does clearly represent the highest peak value on the graph………….for this metric.
One problem is that the data for the sunspot graph goes back 1 cycle farther than the data for GCR’s but we have data available from your graphs for both, starting with cycle 20, which my previous comments addressed. Take out cycle 19 and use only the data that measure sunspots and GCR’s and clearly the GCR’s did not bottom out until the early 90’s.
Even if we assume that cycle 19 had lower GCR’s without the data from the spike high in sunspots, this only means an absolute(isolated) high was obtained from that one cycle. Cycle’s 21 and 22 continued to have high sunspot numbers and low GCR’s………..even if they did not exceed the absolute value of cycle 19.
To be clear, on the graph of available data, we show that GCR’s during cycle 21 still dropped lower than cycle 20. Then 22 was lower yet than cycle 21(at that point, telling us that the trend was NOT higher yet). It wasn’t until cycle 23, that we have the potential change in trend, with a higher bottom than 21 and 22 but similar to 20.
Cycle 24 was the first one that clearly resulted in substantially more GCR’s during the entire period than previous ones that is part of a continuing trend into the next cycle, 25.
One could say that cycle 20 also did this(higher than 19) but it was immediately followed by 2 cycles with much lower GCR’s, then followed by a 3rd with similar lows in GCR’s.
Please tell me what is flawed with this analysis.
The GCR flux is highest at solar minimum so a narrow spike at sunspot maximum has only a minor effect. And although cycle 20 had only a medium maximum, the general trend from cycle 18 to now is downwards. An important parameter for cosmic ray modulation is the solar dipole moment [DM] at minimum. At http://hmi.stanford.edu/hminuggets/?p=2084 you can see the evolution of DM over time. Regardless of the sun, the GCR flux and Global Temps have varied opposite to the expectation if we follow the Svensmark hypothesis, so the direct evidence for it being valid simply is not there.
“The GCR flux is highest at solar minimum so a narrow spike at sunspot maximum has only a minor effect. And although cycle 20 had only a medium maximum, the general trend from cycle 18 to now is downwards. An important parameter for cosmic ray modulation is the solar dipole moment [DM] at minimum.”
Thanks for pointing out the flaw in using the narrow spike at maximum as an indicator.
Not using this specific (flawed) metric, makes my case less compelling/obvious. However, the fact remains that the last very weak cycle with follow up into the current one is completely different than any other 2 cycle period.
Since you dismiss GCR’s as having any effect, this won’t matter but if they did have an effect, especially if its small, one would not expect to see smallish changes in sunspots or cumulative GCR’s over the course of several cycles, like was the case thru cycle 23 to show up. Especially if the numbers are still high/low enough to balance or even continue a net contribution to heating the planet.
Since we can’t even measure this effect directly, how can one say that cycle 23 should have contributed X amount of increased condensation nuclei from the slight/modest increase in galactic cosmic rays vs cycle 22? Maybe this small change caused a balance that slowed global warming?
However, what we can say with certainty is that cycle 24 was clearly the weakest in a very long time and GCR’s the highest in a very long time. If there is an effect, it will become obvious soon……but soon means dialing in the lag from stored ocean heat leaving the oceans from previously stronger cycles.
It’s plausible that this lag could take an entire solar cycle or that it started 2 decades ago and is one reason that the global climate model projections have all been too warm(since they do not have equations to represent this dynamic).
That “missing heat” during the global warming slow down could just have been lacking heat from this factor.
Since we will obviously have 2 very weak cycles back to back, the effect is going to be greatly magnified……..even dialing in a lag of X years. If global temperatures continue to increase at the rate they did previously, THEN we will have the more compelling evidence to discard this theory as having a substantive effect on global temperatures.
Again, I am not a proponent of the theory(and looking for excuses/hope to hang on to it), just an objective operational meteorologist of 35 years that understands most of the dynamics/physics of the atmosphere/oceans.
Anybody that thinks they understand ALL the dynamics and that the (climate) science is/was settled 10 years ago, has strayed from the scientific method in favor of a rigid belief system.
Svensmark hasn’t received his Nobel Prize yet – that’s why. NASA scientists don’t read his papers – these are most likely forbidden reading at NASA.
“cosmic rays should continue to increase, significantly, in the months and years ahead.”
Expect a small increase in clouds reflecting incoming solar radiation and declining surface temps as oceans begin to slowly cool. And uptake more CO2 which in 3-4 years will look like we are stabilizing human CO2 emissions. The alarmists will say, “See, our plan is working, CO2 is stabilizing and the planet is responding by cooling down slightly.” And try and take all the credit for their insane policies.
E’2,
However, it appears that there is at least a temporary halt to the increase, in the graph supply by Anthony, Since about mid-August.
supplied!!! Damned autocorrect!
Earthling2 December 6, 2017 at 12:48 pm
Huh? As the oceans cool, tropical clouds decrease, not increase. It’s part of the planetary thermoregulatory system.
w.
True Willis, but I suppose the details depends on what hemisphere since there is much more ocean in the SH that generates clouds, in addition to the SH being a few million miles closer to the Sun it its summer due to our current annual orbit which has slightly more W/m2 for the SH in its summer. We do live on a bi-polar planet chalk full of details. But that wasn’t what I was talking about.
I was referring to the cloud condensation nuclei hypothesis that cosmic rays may influence due to a quieter less active Sun, which allows more intergalactic cosmic rays through the solar system and into Earths atmosphere. The hypothesis being that the cosmic rays create cloud condensation nuclei which create lower level clouds which reflect incoming solar insolation, thereby causing less heating to the Earth/oceans, and therefore net cooling for as long as the condition lasts. And then of course, would the low level clouds be a negative or positive feedback effect on outbound LWIR. I am not even sure mainstream science even accepts these ideas yet, so please feel free to tune me up. You do seem to have the gift to explain the complex to a 6 year old, so would be interesting to hear your views on this subject.
Earthling2, I’ve looked for evidence for Svensmark’s hypothesis everywhere, and found nothing. If it works it would work in synchrony with the sunspots, so I’ve looked for ~ 11-year cycles in everything you might imagine … no joy.
Here’s my analysis of the cloud cover data, I have lots more of other phenomena … enjoy.
w.
“When people are confronted with information that refutes their previously held beliefs, they respond by strengthening the belief rather than relinquishing it.” The Backfire effect.
Willis, very interesting post from Nov/14. I haven’t finished reading all the comments yet, but I did find a 11 year cycle and connection. But it is not on this planet. It is Uranus…it’s poles rotate at the same rate as the suns polarity reverses. Maybe a coincidence but I doubt it. Something is going on with 11/22 year solar cycles. It’s just…I haven’t found what I am looking for..yet.
I don’t know if cosmic ray nuclei holds any water. (pun intended) I first read about it the day I got my first computer in 1993, when I downloaded my first science article which was on this very subject by a Dr. Theodor Landscheidt, who said he could predict this stuff, and sounded like he did, or at least his paper sounded legit. This has held a fascination for me ever since. But now when I google whatever happened to that guy, Wiki says he was an astrologer.
So as I don’t slide into the Backfire Effect, I will henceforth not assume that this is a hypothesis that has stood any test yet. Time will sort it all out.
Earthling2, I corresponded with Ted Landscheidt. He was a charming correspondent … but I was unable to pin him down as to how his system actually worked. My final conclusion was that he’d made some lucky predictions, and that they had deceived him into thinking his system actually worked. At the end, I felt like although it wasn’t astrology, it was dang close …
Regards,
w.
It seems that as the solar cycle is waning, the price of bitcoins is rising.
Great job Tony. Keep them flying.
Higher level of cosmic rays should increase the cloudiness. Where is global cloudeness data since 2010?
https://isccp.giss.nasa.gov/climanal7.html
This data stops at 2010 unfortunately.
From 2000-2010 there appears to be a slight increase in upper level clouds and a decrease in lower level clouds.
climate4you.com has this data. Click on climate + clouds and find the charts.
climate4you.com has links to the original data, eg. link
Annoyingly, the data ends in 2011 or 2010, depending on which data set you look at.
So, repeating the question, where’s the data since 2010?
A question: Given that cosmic rays are measured using high altitude balloons, is it reasonable to conclude that any direct effect on clouds will be at high altitudes?
Caused by the Sun……surely not…..in a few days we will see a Study, or possibly many Studies which show support by 97% of Climate Scientists that say that this effect is caused by CO2.
If anyone is at all interested in COSMIC RAY theory …… then check out the work of Jasper Kirkby at CERN in Switzerland ……. Start with his old youtube lecture from 2009 and work on from there ………..
https://www.youtube.com/watch?v=6ygk98kEQfk&t=53s
Kirby’s presentation has a serious flaw: he compares temperatures with the GCR intensity CORRECTED for the change of the Earth’s magnetic field. This is wrong, as what the climate system sees is the ACTUAL uncorrected GCR flux, undermining his claims.
What? Did you mean “Sun’s,” rather than “Earth’s”?
No, Earth’s
This 7-day Sept 2017 solar CME/magnetic event was my previous conjecture on why RSS and UAH tropospheric temps diverged so much from the data sets.
errata: …the surface data sets.
Has Swensmark chimed on on this? Some of the work at CERN seemed to say that cosmic rays nucleate very small droplets that do not increase to cloud size…Anyway, some of us follow GCR for reason of climate amplifications and even Ozone hole development.
What timing. I had just visited Space Weather, and was coming back here to comment on the correlation between that spike from the Sun in September, and the jump in global temps which UAH shows for October and November. September global temps also continued to rise, but the big move was in October. Then a lesser upward move in global temps for November. Was all of that caused by the spike in solar energy in September?
And is the reason for such a large drop for the month of December also a consequence of that rapid burst of energy rapidly fading away over the period of the last 2 months?
goldminor says “Was all of that caused by the spike in solar energy in September?”
Atmosphere lags about 3 months from ocean temp swings. The drop from Oct to November mirrors the drop from July to Aug in the tropical Pacific.
http://www.cpc.ncep.noaa.gov/products/analysis_monitoring/enso_update/heat-last-year.gif
Looks like I was a month ahead of myself. November is the big drop, not Dec. I was surprised by the climbing global temps for Sept and October. I had expected cooling as it looked to me like the sst and ssta graphs were slowly cooling through those months.
Early September was an amazing time to look at the Sun. I caught this M3.8 flare erupting on 9/5 and made a time lapse:
http://www.pbase.com/dsnope/image/166146179/original
Here is the full disc view from that day showing all the activity:
http://www.pbase.com/dsnope/image/166146084/original
Then caught this beautiful, rare double-looped prominence as the same active region disappeared around the the limn:
http://www.pbase.com/dsnope/image/166182655/original
+10
+10
Beautiful work.
wow, fantastic images .
67,000/3.28 = 20.5 km. Molecules disappear at 32 km, NASA says ToA is 100 km – 62 miles. That is ludicrous thin.
You don’t happen to have a reference for that you could post? I need it for something wholly unrelated to climate.
The photon mean free path varies all over the place in the atmosphere if you look at this which is a detail on radiative transfer I suspect you are asking stuff around page 17-19
http://www.ifa.hawaii.edu/users/kud/teaching_12/3_Radiative_transfer.pdf
Even then be careful it’s not an all and none situation there is a probability matrix you have to calculate from top to bottom of atmosphere. I think you are asking the probability of a photon being absorbed in x, Nothing is as simple like in the imaginary world of classical physics.
The photon isn’t like a bullet it has uncertainty principle and particles that are resonant at the right frequency have are far effect than how many of the wrong sort of particles there are. Hence a thin film can reflect a thermal emission or it can pass right thru many kilometers of atmosphere what matters is the Quantum behaviour you need to dump all the classical physics mentality.
It probably easier to imagine it always as a standard RF wave you will fall into less holes than thinking of it as a particle.
Fun piece, but also keep in mind that, unlike sunspots, we have no extensive records of coronal holes and their effect on this planet’s weather/climate for any reasonable time period.
Could not an extended period of a (or a few) coronal hole(s) initiate a cooling period for this planet? The outpouring of charged particles from the are know to affect the polar stratosphere, causing some warming, and this impacts on the disposition of the polar vortex. The overall effect would be a loss of (in particular) Arctic ice but a general cooling of the surrounding Arctic region.
Oops typo (again!!!)
“The outpouring of charged particles from the are know to affect the polar stratosphere, causing some warming, and this impacts on the disposition of the polar vortex. The overall effect would be a loss of (in particular) Arctic ice but a general cooling of the surrounding Arctic region.”
to
The outpouring of charged particles from the sun are known to affect the polar stratosphere, causing some warming, and this impacts on the disposition of the polar vortex. The overall effect would be a loss of (in particular) Arctic ice but a general cooling of the surrounding Arctic region.
“Cosmic rays” come from the Sun’s pulsar core, not from interstellar space. Golden Hwaung and I published the experimental basis for this conclusion last year
The Voyagers show otherwise. e.g. https://arxiv.org/abs/1401.1070
I thought Oliver Manuel was banned?
Hey, let’s put our hands together for students who actually want to measure something, rather than just construct a computer model of what it ‘ought to be’…
Yeah, they did a good job. This is good science.
Another reason temperatures should be going the other way. Something quite significant must be over-powering the effects of cold: solar, AMO, & PDO cycles. It’s even reversed the trend of a cooling Holocene.
Any theories?
~graph courtesy of javier
High solar activity correlates with warming. Low solar activity correlates with cooling…
Solar activity in the 18th century was as high as in the 20th [and GCR flux about the same too], but the climate now [as per Javier’s plot] is much warmer than then. So again, no effect.
Straw man argument. (that’s not the correlation) High solar activity correlates with warming, low with cooling…
yet as the sun has quieted down the past 50 years, the Earth has warmed.
Perhaps you ascribe that to CO2 overwhelming the puny solar influence…
No… Solar activity has been high over the last fifty years, hence warming.
(that’s the correlation)…
lsvalgaard says:
“yet as the sun has quieted down the past 50 years, the Earth has warmed.”
Solar activity has increased from the early 1900’s in correlation with temperatures, solar activity has not “quieted down” the current solar cycle 24 has been weak compared to solar activity during the latter half of the 20th century.
The activity of cycles 23, 22 and 21 were still extremely high compared to solar activity during the first decades of the 20th century.
The downward trend in solar activity over the past 50 years has been small yet solar activity was still very high towards the end of solar cycle 23.
The argument you are making is a subjective one,
Another point, hasn’t there been a so called “pause” in temperatures?
Why suggest that the Earth has warmed as the activity of the last few solar cycles have decreased slightly.
The observational facts are; Solar activity has decreased slightly over the same period temperatures have levelled off.
The activity of cycles 23, 22 and 21 were still extremely high compared to solar activity during the first decades of the 20th century.
But not compared to solar activity in the last decades of the 18th century or the middle of the 19th. there has been no long-term trend since then.
lsvalgaard says:
“But not compared to solar activity in the last decades of the 18th century or the middle of the 19th. there has been no long-term trend since then.”
That’s an interesting observation as “man made global warming” has no long-term trend,
From the 1970’s, when temperatures cooled slightly, solar activity weakened slightly,
The latter half of the 20th century after the 1970’s has had very intense solar cycles, even knocking out part of an electrical grid during the 1990’s (not seen since the 1800’s).
The 1970’s have been used as a starting point in many of the arguments for man made global warming,
I understand that your solar activity forecasts are based on the timing of the suns polarity reversal, Where did you get the idea for that?
I have came to the same conclusion years ago myself (independently).
It seemed obvious that when the suns polarity reversal increased with speed toward the suns equator, Sunspot activity increased. And when the suns polarity reversal decreased with speed toward the suns equator, Sunspot activity decreased.
What are your thoughts about how a weak solar cycle occurs during a swarm of highly intense solar cycles? for example the 1970’s solar cycle 20.
I understand that your solar activity forecasts are based on the timing of the suns polarity reversal, Where did you get the idea for that?
http://www.leif.org/research/Cycle%2024%20Smallest%20100%20years.pdf and
http://www.leif.org/research/Using%20Dynamo%20Theory%20to%20Predict%20Solar%20Cycle%2021.pdf
and
http://www.leif.org/research/Observations-polar-magnetic-fields-and-Cycle-25-prediction.pdf
Tony, the AMO and PDO are are positive (warming) at this time. What are you smoking?
Is it possible that clouds cause a net warming? Certainly clouds reflect sunlight which produces a cooling effect. But clouds also radiate heat back to earth since clouds are warmer than deep space. That’s a warming effect. The cooling effect can only occur during the daytime, but the warming effect can occur during night or day. And the warming can occur anywhere on the planet. But cooling is unlikely in the polar regions because sunlight which gets past the clouds is probably reflected by snow and ice anyway. Likewise in the winter snow covered areas probably reflect sunlight as well as clouds do.
Further, Venus has dense cloud cover and a higher albedo than earth but is much much hotter. That higher temperature cannot be explained by the fact that Venus is closer to the sun.
David S December 6, 2017 at 4:40 pm
Good question. Fortunately, we can measure this from space. The answer is that the net of the two processes you describe, the shortwave and longwave effects, is cooling.
How much? From the CERES data we have this:
> getweightedmean(cre_sw)
[1] -47.12
> getweightedmean(cre_lw)
[1] 25.99
> getweightedmean(cre_net)
[1] -21.13
“cre” is the cloud radiative effect, “sw” is shortwave, meaning solar, “lw” is longwave, and “net” is … well … net. The negative net value shows that overall, clouds cool the surface by about 21 W/m2.
My function “getweightedmean” adjusts the CERES data, which is in 1°x1° gridcells, to account for the different sizes of the gridcells.
Regards,
w.
Willis, Thank you for your reply. I’m not sure I can buy into that yet without a better understanding of what is being measured. For example is the getweightedmean(cre_sw) from clouds only or from the surface of the earth as well? Also the LW info looks like they are measuring infra-red radiated into space not radiated back to earth. Do you have a link for the source so I can better understand it?
Respectfully
David S
Thanks, David S., good questions. The “cre” indicates that it’s just the clouds. As to the LW, they look at what is radiated to space and compare it to what is radiated from the earth … because what’s not going up must be going down.
The source is the raw CERES data, available here.
Regards,
w.
That’s neat Willis. Which data set are you using? Which tool to query it? Is there a manual somewhere for newbies? I can run various DoE air pollution models, but this looks like Greek.
That’s fine.
But…..why, when it is a cloudy night in the winter, does it not cool off as much as a clear night? That cooling off is an indication of heat loss on a clear night isn’t it? If a cloudy night is net heat loss, then all of the loss (and some) occurs above the clouds? isn’t the heat capacity from the clouds down much higher than what’s above? IOW how does it balance out and not contradict my earthly experience?
And the bizarre thing is that ipcc models actually need clouds to cause net warming to work. (Mike Jonas did a piece on this a couple years ago) Does anybody know how to say “what a mess” in latin?
It is only a mess if you insist that the climate should conform to what you want it to be.
?
I don’t understand why people have trouble that things are absolute even the greenhouse effect isn’t always positive you can make a greenhouse refrigerator just not with the conditions currently on Earth’s atmosphere.
Earlier this year with a bit of QM magic in metamaterials we have have a material you can apply to solid to pull off that trick
http://science.sciencemag.org/content/early/2017/02/08/science.aai7899
As of late this year you can now buy it but it isn’t cheap.
https://www.digitaltrends.com/home/plastic-film-may-replace-air-conditioners/
LdB December 6, 2017 at 10:04 pm
And as often is the case the news came out early here … I put up a post entitled “A Reverse Greenhouse Effect” back in February.
w.
Good catch Willis I wasn’t around back then.
‘The cooling effect can only occur during the daytime’, except when a blocking high is hanging over your head,
Brian B, I’ve inserted your picture above. Hey, we’re a full-service website.
w.
Sounds like it’s a great time to set up a cloud chamber and watch for high energy collisions!
A friend set up a video camera on his daughter’s cloud chamber and then just ran the video at high speed till he found collisions.
It is easy for some to try disorientate us on the effects of Solar radiation this solar cycle is very low compared to the average and the previous solar cycle was high compared to the average as regards sun spots, We know this because this cycle was predicted to be as high as the previous cycle and we have all the carry on from solar scientists about how low this solar cycle is. Why are we being told know by some solar scientists that black is white and up is down ,left is right etc. Could it be that they have bias against solar radiation affecting earths climate.
We know this because this cycle was predicted to be as high as the previous cycle
Actually not: http://www.leif.org/research/Cycle%2024%20Smallest%20100%20years.pdf
From my observation. Hathaway et al predicted an amplitude of around 140 for SS24. Well above the 10th harmonic line. It maxed out at about half of that and much closer to the 10th harmonic line. However his prediction of 50 for SS25 will go closer to that harmonic. We can’t really trust the temperature figures these days, so there is no point in trying to correlate. Apparently that 0.01% of man made CO2 is driving up the temperatures.
Hathaway has long ago agreed that his old prediction was wrong. He still has to see that his new one also is.
Why waste time on wrong predictions?
Fordi en tværmodig dansker prover at skjule at den kommentarer hvis hans svar er dirgeret ad faktist havde ret når han siger “We know…”, selvom den forkjerte forudsigelse blev senere updatert post faktum.
1. There has been no significant measurable increase in global warming for 18 years in spite of continued increases in CO2. This is counter to the theory behind global warming and counter to its predictions over the past many years. Temperature will in all probability resume its increase at some point, but this has nothing to do with CO2.
2. Global sea ice has increased during that period, counter to predictions by global warming protagonists that it would decrease.
3. We are presently in an interglacial period of an ice age and the climate has been warming, naturally, for about 16, 000 years, as it has before. Hopefully it will resume doing so as warm is much better than cold for life on our planet, as geology and archeology distinctly point out. CO2 has been much higher in past geologic periods and life flourished.
4. This warming releases CO2 from the oceans which vastly overwhelms any CO2 produced by man. Without this CO2, this would be a dead planet as CO2 is required for photosynthesis. No photosynthesis, no green plants, no oxygen, no nothing. CO2, most people do not realize, is only about .04% of our atmosphere.
5. Increases in cataclysmic weather events predicted by global warming proponents have not occurred, while CO2 has continued to increase.
6. Urban sprawl has swallowed up many surface temperature monitoring stations causing increased temperature measurements.
7. Temperature records have been adjusted by global warming proponents to reduce past temperatures and incease more recent temperatures to attempt to show increases.
8. The statistical models indicating continued warming are wrong in that they cite increases which have not occured and their coding is kept secret. Increases in temperature which are blasted over the various media are not significant within the tolerances of the the equipment being used and not scientifically statistically significant in many cases.
9. It is apparent that CO2 is not the driving force behind climate, since there is poor correlation between CO2 and temperature for the last 20 years and over geologic time periods. More likely the oceans on our 70% water covered world, which absorb heat energy from the sun (for which we have some data), and geothermal energy (for which we have virtually no data), and release it over long periods of time by poorly understood mechanisms that are possibly the real driving force behind climate. These mechanisms are, evidently, not quantified in the climate models. Could enso events be a clue? And yes correlation is not necessarily causation and I understand the weaknesses in many of the proxies used for geologic data.
10. Proponents of global warming are using the issue to gain political control, garner financial grants, gain political donations, gain votes, punish political enemies, reward friends and supporters and generally do not follow, nor possibly understand, scientific methods and statistical analysis. For many it is a method by which they can ” fit in ” with those to whom they wish to ingratiate themselves and feel good about ” saving the planet “
There has been no significant measurable increase in global warming for 18 years ?w=768&h=282
ENSO ànd nothing like the models have predicted in light of their co2 theory. And who’s talking about 4 to 6 miles up? Cherry picking?
Cherry picking?
By whom?
Throw a stone at a pack of wolves and the one who howls is the one you hit.
Not a valid argument. The one who throws the stone is clearly the bad guy…
I’ve never been accused of being a good guy. But I ain’t the one howlin.
But you are the one who deserted science for cheap personal japs
Dear Leif:
http://www.drroyspencer.com/latest-global-temperatures/
I would trust this chart which shows no statistical increase in 18 years. Not sure of the source of your temperature chart though it looks familiar.
Short term touche…..
http://www.climate4you.com/images/AMO%20GlobalAnnualIndexSince1856%20With11yearRunningAverage.gif
http://www.climate4you.com/images/NOAA%20SST-NorthAtlantic%20GlobalMonthlyTempSince1979%20With37monthRunningAverage.gif
I am cozying up to the term “pause denier”.
Totally agree. According to measurements the total amount of CO2 in the atmosphere is around 400 ppm of which they think, (but not sure) that our contribution is 100 ppm or 0.01%
Hypothesis: Solar Radiation Selects Cosmic Radiation And Kills It.
Conclusion: Selective Allowance Of Cosmic Radiation By Absence Of Solar Radiation.
Judgement: Fail.
Solar activity falls. ?oh=1a2104ad40d440cb203ab6670caab8bd&oe=5AD6B7C4
http://cosmicrays.oulu.fi/webform/monitor.gif
The forecast of the stratospheric polar vortex on December 10 is very unfavorable for North America.
Jet stream pulls arctic air south US.
http://virga.sfsu.edu/gif/17120700_jetstream_h24.gif
“Scientists blame sun for global warming” – BBC, Feb 13, 1998
Exhibit A:
================
The concentration of radiocarbon, 14C, in the atmosphere depends on its production rate by cosmic rays, and on the intensity of carbon exchange between the atmosphere and other reservoirs, for example the deep oceans. For the Holocene (the past approx 11,500 years), it has been shown that fluctuations in atmospheric radiocarbon concentrations have been caused mostly by variations in the solar magnetic field 1, 2, 3
http://www.nature.com/nature/journal/v403/n6772/full/403877a0.html
================
Exhibit B:
Exhibit C
================
Spotless Sun: Blankest Year of the Space Age
NASA – September 30, 2008
================
Exhibit D
================
Where’s global warming?
Jeff Jacoby, Boston Globe
March 8, 2009
[…]
The United States has shivered through an unusually severe winter, with snow falling in such unlikely destinations as New Orleans, Las Vegas, Alabama, and Georgia. On Dec. 25, every Canadian province woke up to a white Christmas, something that hadn’t happened in 37 years. Earlier this year, Europe was gripped by such a killing cold wave that trains were shut down in the French Riviera and chimpanzees in the Rome Zoo had to be plied with hot tea. Last week, satellite data showed three of the Great Lakes – Erie, Superior, and Huron – almost completely frozen over. In Washington, D.C., what was supposed to be a massive rally against global warming was upstaged by the heaviest snowfall of the season, which paralyzed the capital.
Meanwhile, the National Snow and Ice Data Center has acknowledged that due to a satellite sensor malfunction, it had been underestimating the extent of Arctic sea ice by 193,000 square miles – an area the size of Spain. In a new study, University of Wisconsin researchers Kyle Swanson and Anastasios Tsonis conclude that global warming could be going into a decades-long remission. The current global cooling “is nothing like anything we’ve seen since 1950,” Swanson told Discovery News. Yes, global cooling: 2008 was the coolest year of the past decade – global temperatures have not exceeded the record high measured in 1998, notwithstanding the carbon-dioxide that human beings continue to pump into the atmosphere.
================
Exhibit E:
================
Leif Svalgaard
November 14, 2014 at 8:02 am
What happened to the ‘pause’?
https://wattsupwiththat.com/2014/11/14/claim-warmest-oceans-ever-recorded/#comment-1788597
================
“He who controls the past controls the future.
He who controls the present controls the past.”
-George Orwell, 1984
Khwarizmi, a few things.
First, starting with a quote from the BBC marks you as a very credulous man. The BBC is one of the least dependable voices around regarding the climate.
Next, there are a variety of problems with the 12C proxy for solar variations.
Next, why would I ever trust someone who puts up graphs with no citation, link or provenance? It marks you as an amateur.
Finally, if your claim is that the sun roolz the climate, then why is there no sign of the ~11 year sunspot cycle in the records? I list below where I’ve looked without finding it … perhaps you’ll have better luck. I started out looking thinking it would be a piece of cake to find evidence of the sunspot cycles here on earth … not. I looked at clouds. I looked at sea levels. I looked at tides. I looked everywhere I could think of. Bupkis.
Now, if you think there is such evidence, then I’ll make you the same offer I make everyone. Please send me TWO links, one to the study that is the best evidence that you think exists, and one to the data used in the study. Remember I can’t analyze the study without the data. I’ll see if you can be the big winner.
Note that I’m not asking for a data dump of all the papers you can find. Most papers on sunspots are fatally flawed. I want the one paper you think is the strongest, and the data for that paper.
Serious offer. Where is your evidence?
I append my previous studies. I’d forgotten how many I’ve done, it’s a lot.
w.
Sunspots and Sea Level 2014-01-21
I came across a curious graph and claim today in a peer-reviewed scientific paper. Here’s the graph relating sunspots and the change in sea level: And here is the claim about the graph: Sea level change and solar activity A stronger effect related to solar cycles is seen in Fig.…
Riding A Mathemagical Solarcycle 2014-01-22
Among the papers in the Copernicus Special Issue of Pattern Recognition in Physics we find a paper from R. J. Salvador in which he says he has developed A mathematical model of the sunspot cycle for the past 1000 yr. Setting aside the difficulties of verification of sunspot numbers for…
Sunny Spots Along the Parana River 2014-01-25
In a comment on a recent post, I was pointed to a study making the following surprising claim: Here, we analyze the stream flow of one of the largest rivers in the world, the Parana ́ in southeastern South America. For the last century, we find a strong correlation with…
Usoskin Et Al. Discover A New Class of Sunspots 2014-02-22
There’s a new post up by Usoskin et al. entitled “Evidence for distinct modes of solar activity”. To their credit, they’ve archived their data, it’s available here. Figure 1 shows their reconstructed decadal averages of sunspot numbers for the last three thousand years, from their paper: Figure 1. The results…
Solar Periodicity 2014-04-10
I was pointed to a 2010 post by Dr. Roy Spencer over at his always interesting blog. In it, he says that he can show a relationship between total solar irradiance (TSI) and the HadCRUT3 global surface temperature anomalies. TSI is the strength of the sun’s energy at a specified distance…
Cosmic Rays, Sunspots, and Beryllium 2014-04-13
In investigations of the past history of cosmic rays, the deposition rates (flux rates) of the beryllium isotope 10Be are often used as a proxy for the amount of cosmic rays. This is because 10Be is produced, inter alia, by cosmic rays in the atmosphere. Being a congenitally inquisitive type…
The Tip of the Gleissberg 2014-05-17
A look at Gleissberg’s famous solar cycle reveals that it is constructed from some dubious signal analysis methods. This purported 80-year “Gleissberg cycle” in the sunspot numbers has excited much interest since Gleissberg’s original work. However, the claimed length of the cycle has varied widely.
The Effect of Gleissberg’s “Secular Smoothing” 2014-05-19
ABSTRACT: Slow Fourier Transform (SFT) periodograms reveal the strength of the cycles in the full sunspot dataset (n=314), in the sunspot cycle maxima data alone (n=28), and the sunspot cycle maxima after they have been “secularly smoothed” using the method of Gleissberg (n = 24). In all three datasets, there…
It’s The Evidence, Stupid! 2014-05-24
I hear a lot of folks give the following explanation for the vagaries of the climate, viz: It’s the sun, stupid. And in fact, when I first started looking at the climate I thought the very same thing. How could it not be the sun, I reasoned, since obviously that’s…
Sunspots and Sea Surface Temperature 2014-06-06
I thought I was done with sunspots … but as the well-known climate scientist Michael Corleone once remarked, “Just when I thought I was out … they pull me back in”. In this case Marcel Crok, the well-known Dutch climate writer, asked me if I’d seen the paper from Nir…
Maunder and Dalton Sunspot Minima 2014-06-23
In a recent interchange over at Joanne Nova’s always interesting blog, I’d said that the slow changes in the sun have little effect on temperature. Someone asked me, well, what about the cold temperatures during the Maunder and Dalton sunspot minima? And I thought … hey, what about them? I…
Changes in Total Solar Irradiance 2014-10-25
Total solar irradiance, also called “TSI”, is the total amount of energy coming from the sun at all frequencies. It is measured in watts per square metre (W/m2). Lots of folks claim that the small ~ 11-year variations in TSI are amplified by some unspecified mechanism, and thus these small changes in TSI make an…
Splicing Clouds 2014-11-01
So once again, I have donned my Don Quijote armor and continued my quest for a ~11-year sunspot-related solar signal in some surface weather dataset. My plan for the quest has been simple. It is based on the fact that all of the phenomena commonly credited with affecting the temperature,…
Volcanoes and Sunspots 2015-02-09
I keep reading how sunspots are supposed to affect volcanoes. In the comments to my last post, Tides, Earthquakes, and Volcanoes, someone approvingly quoted a volcano researcher who had looked at eleven eruptions of a particular type and stated: …. Nine of the 11 events occurred during the solar inactive phase…
Early Sunspots and Volcanoes 2015-02-10
Well, as often happens I started out in one direction and then I got sidetractored … I wanted to respond to Michele Casati’s claim in the comments of my last post. His claim was that if we include the Maunder Minimum in the 1600’s, it’s clear that volcanoes with a…
Sunspots and Norwegian Child Mortality 2015-03-07
In January there was a study published by The Royal Society entitled “Solar activity at birth predicted infant survival and women’s fertility in historical Norway”, available here. It claimed that in Norway in the 1700s and 1800s the solar activity at birth affected a child’s survival chances. As you might imagine, this…
The New Sunspot Data And Satellite Sea Levels 2015-08-13
[UPDATE:”Upon reading Dr. Shaviv’s reply to this post, I have withdrawn any mention of “deceptive” from this post. This term was over the top, as it ascribed motive to the authors. I have replaced the term with “misleading”. This is more accurate…
My Thanks Apologies And Reply To Dr Nir Shaviv 2015-08-17
Dr. Nir Shaviv has kindly replied in the comments to my previous post. There, he says: Nir Shaviv” August 15, 2015 at 2:51 pm There is very little truth about any of the points raised by Eschenbach in this article. In particular, his analysis excludes the fact that the o…
The Missing 11 Year Signal 2015-08-19
Dr. Nir Shaviv and others strongly believe that there is an ~ 11-year solar signal visible in the sea level height data. I don’t think such a signal is visible. So I decided to look for it another way, one I’d not seen used before. One of the more sensitive …
Is The Signal Detectable 2015-08-19
[UPDATE] In the comments, Nick Stokes pointed out that although I thought that Dr. Shaviv’s harmonic solar component was a 12.6 year sine wave with a standard deviation of 1.7 centimetres, it is actually a 12.6 year sine wave with a standard deviation of 1.7 millime…
23 New Papers 2015-09-22
Over at Pierre Gosselin’s site, NoTricksZone, he’s trumpeting the fact that there are a bunch of new papers showing a solar effect on the climate. The headline is Already 23 Papers Supporting Sun As Major Climate Factor In 2015 “Burgeoning Evidence No Longer Dismissible!…
Like I said … I’ve looked a lot of places, and in a lot of ways (cross-correlation, Fourier, CEEMD), and found nothing.
“Next, there are a variety of problems with the 12C proxy for solar variations.”
================
On the one occasion I asked you, a few years ago, to substantiate a similar claim, you tried to put the onus on me to disprove your ipse dixit assertion! Today you don’t even bother stating what any of those problems are, or providing any references to support your claim.
I already cited a paper that contradicts your opinion on the matter, but you ignored that citation for a cheap ad hominem attack on the credibility of BBC.
Here is the peer reviewed version again, with a slight change to the emphasis:
====
“..it has been shown that fluctuations in atmospheric radiocarbon concentrations have been caused mostly by variations in the solar magnetic field.” (op.cit., “Exhibit A”)
====
vs.:
===
“I’m no happier with the 14C data as a solar proxy either. Although there is an 11-year cycle visible in the 14C data, it only represents about 5% of the swing of the 14C data. This means that 95% of the wanderings of the 14C data occur for an unknown cause, with 5% of the variation due to solar variations “
– Willis, Nov 2014 (“splicing clouds”, WUWT)
===
Next, why would I ever trust someone who puts up graphs with no citation, link or provenance?
================
Why would anyone trust someone who makes claims about the C14 record that they are unwilling to substantiate?
page 2
https://pubs.usgs.gov/fs/fs-0095-00/fs-0095-00.pdf
Finally, if your claim is that the sun roolz the climate..
===================
If you claim is that the sun doesn’t “rool the climate” – to adopt your own mocking style (appeal to ridicule fallacy, btw) – try explaining the rapid and significant temperature drop that occurs during the a total solar eclipse.
You might want to watch one first:
http://rammb.cira.colostate.edu/ramsdis/online/loop.asp?data_folder=loop_of_the_day/goes-16/20170821000000&number_of_images_to_display=200&loop_speed_ms=100
Exhibit F:
==============
During the total solar eclipse on Dec. 9, 1834, the Gettysburg Republican Banner reported that in some places, the eclipse caused the temperature to drop by as much as 28 degrees Fahrenheit, from 78 degrees F to 50 degrees F (25 degrees Celsius to 10 degrees C). During a total solar eclipse on the Norwegian island of Svalbard in March 2015, temperatures dropped from 8 degrees F to minus 7 degrees F (minus 13 C to minus 21 degrees C).
https://www.space.com/37201-solar-eclipse-temperature-drop.html
==============
Exhibit G:
==============
The Moon’s shadow is cool, literally! When it swept by Lusaka, Zambia, on June 21st in 2001 the air temperature dropped nearly 15 degrees F. This graph shows a series of measurements made by NASA astronomer Mitzi Adams during the total solar eclipse using a Thermochron Temperature Logger.
[…]
A significant problem you may encounter is that making ambient air temperature measurements during a rapidly-changing phenomenon. During totality, the time from full daylight to darkness and back again is only about 2 – 3 minutes. This may be too quick a change for your thermometer to measure it!
https://eclipse2017.nasa.gov/temperature-change-during-totality
==============
@willis: You wrote:
“Finally, if your claim is that the sun roolz the climate, then why is there no sign of the ~11 year sunspot cycle in the records?”
The important factor here is whether there is an energy signal. Looking for a temperature signal does not necessarily tell you about energy, which is understandably harder to track. Change in temperature readings does not prove change in energy.
Finally, in a circuit, one can have a PWM signal at frequencies that do not resonate the variable you are looking for. There are things that damp and resist frequencies especially in nature. Think RLC circuits (Resistors, Inductors and Capacitors). So again, not seeing correlations does not prove the sun does not rule the climate.
Mario
So again, not seeing correlations does not prove the sun does not rule the climate.
But it proves that the effect is too small to measure..
Leif: I am not sure if you meant that as a sarcastic statement. To be clear, did you just imply; if you can find little correlation (in temperature), then there is little effect from the sun? Because I that statement is just plain false.
‘Global Warming’ is usually indicated by a ‘Global Temperature’. If there is no solar signal [above the noise] in Global Temperature, then there is no Global Warming dues to the Sun.
Leif: First, I am honored that you spend the time with me. Enough said.
Your response is correct the way you just re-stated it. It does not elevate the discussion other than to support Willis. I submit it does mean “the signal you are looking for is damped out”.
Factually, Climate does not equal temperature *period*. What if the sun instead increased humidity? You’d see no delta temperature. The humidity’s latent energy will be released under condensation. More humidity means more energy input stored which ends up changing our climate. But Willis would ague it does not because of temperature signal issues. So to your wit, a humid world at 20C has the same climate as a dry world at 20C because temperature defines climate.
When smart people like Willis argue this simplistically just to be right about something, trivial, I think it squelches good debate.
If this sounds snarky, I do not mean it to be. I appreciate your responses!
While your humidity argument may hold locally, it seems unlikely to hold globally, so global temperature is still the useful indicator of global warming. Generally, when you argue these things, NUMBERS are important. How much, exactly where, and when. Without numbers. there are no valid arguments.
You’re so good at debate… I was not making a claim that there is evidence of this or that. I am making a claim that the argument that Willis cannot find a signal, and that generally temperature is a good signal, is not conclusive. What we must consider is where the energy goes and the answer is that virtually all of the energy comes from the sun… which drives our climate. Understanding feedbacks and where the energy goes is crucial. So I think my claim is correct. Using only temperature is woefully short.
So what else would you suggest to use, if anything? If you cannot name something, there is no argument. If you suggest indicator X, then we can look for the solar cycle in the numbers that describe X. So what is X?
I suggest that climate scientists, who have all that training can understand that climate is more than temperature… which is only a proxy, that until recently was very poorly measured. Using data, with long time scales based on two data points a day… lacks. But if you are saying, it’s the best we have, then, it dilutes the certainty of those statements… “Can’t find the precisely 11 year signal” so it must not be there. I’d like to see absolute humidity (or maybe relative but they are not the same) combined with temperatures to give a better indication of heat. But temperature alone, as you agree, is not so conclusive.
virtually all of the energy comes from the sun
And that energy varies very little [some 0.1%] leading to a warming of some 0.05 C over the cycle. So, indeed the sun does control the climate, but very, very little. Basically too little to measure with any confidence.
Again, let’s agree to disagree here. Just because you cannot measure it, or do not have the time to consider all of the changes in the sun and how it affects the planet’s albedo, does not mean it is not there. We’ve been through this. The albedo affects how much energy we receive. Therefore, if we know that the sun’s spectrum varies by two orders of magnitude greater than TSI —-And it is well understood by some, how various frequencies of light affect albedo, we cannot dismiss their affect with certainty. Really, I am complaining that this stuff is hard, and therefore the subject matter is simplified to the point where conclusions are sometimes without merit.
es not mean it is not there
If we can’t measure it or can’t see it, it is for all practical purposes not there. If it is there but we can’t see it,we have no observational evidence of its existence, even if we fervently believe it must exist in spite of its no-show.
That’s is not true Leif.
If you are not considering water, then you would be wrong. Your statement is true, only, on a planet with no water. Latent heat of vaporization soaks up 500 times more energy to vaporize than other molecules raising their temperature a degree kelvin. So, no, not on planet earth.
Your argument seems to be, well it’s too hard to know, so we will settle and act as though it’s not present and just use temperature as a guide.
Regardless, if the temperature goes up more water vaporizes. So the temperature is still a measure of the amount of water vapor.
Or energy enters and the temperature readings do not change. If an area of the Antarctic increases 1 kelvin is that the same as the same amount of area anywhere in the tropics increasing 1C?
No, but in the global average there is a good relation between temperature and evaporation [clouds]. And if there were not and the solar signal would be in clouds we would see it. You keep saying that it is invisible and that shows that the effect is there. I would say, if we don’t see it anywhere, there is no effect that we need to worry about.
Leif: I have spiralled way down the rabbit hole.
I think you’re saying we should discern which one variable would show up at times where we expect it to show up. If it does not show up in places where we expect, then “it’s not there”. I would instead say, (“t could not be found”. So we settle. I understand.
With some much heat sloshing around, being stored and released on some many time and frequency scales (in and out of phase) I would not expect mother nature to always place a these signatures in our easy view.
All the way back to the start. One cannot “prove” something does not exist, because one can not find it, perhaps yet.
I was called a unicorn in work earlier this month. But it was in a different context, meant as a compliment.
The US National Academy of Sciences directs federal research funds to keep the public unaware that the Sun is the creator and sustainer of every atom, life and planet in the solar system:
http://www.spacedaily.com/news/iron-02b.html
Nonsense. does not direct MY research.
http://www.drroyspencer.com/wp-content/uploads/TSI-est-of-climate-sensitivity2.gif
But, the eleven year cycle is represented in the temperature data. i actually got this graph from one of willis’ posts. Here’s what dr roy had to say about it in the comment section of that post:
RWS 10/30/14 4:07pm
…the total temperature signal contained in the 11 year cycle is very small, so whatever signal we deduce could just be coincidental.
Afonzarelli: I like your posts. I want to be sure, that I do not suggest that there is no signal. But conversely the magnitude of the signal is not necessarily an indicator of the signal’s effect. The crucial question is where does the energy go. And we must not conflate temperature with heat. The earth’s system is so complex, that trying to tease out a “Temperature” signal all while conflating that temperature with Heat or energy balance perhaps futile.
Why does Chico, CA way up North get hotter in the summer time than places in the tropics? It’s not because the sun puts more energy into Chico. It has to do with water’s latent heat energy. High temperature does not necessarily mean higher energy.
Mario Lento December 7, 2017 at 3:17 pm Edit
First, if the solar energy is not going into temperature, where is it going?
Second, if all I looked for was a temperature signal, you might be right. But I looked for a cloud signal, a river flow signal, a lake level signal, a tree ring signal, a global temperature signal, an ocean temperature signal, an infant mortality signal, a volcanic signal … so, just where am I supposed to look for your “energy signal”?
As I said, if you have a study that you think shows such a sunspot-related signal in some surface dataset, send me two links, one to the study and one to the data it’s based on, and I’ll take a look at it.
And if not … why do you believe as you do?
I made the same offer to Al Gorithm above … no reply to date.
w.
Hi Willis. I do not know that there is a signal other than the obvious. Diurnal. And I was only speaking to the temperature signal. I think you know where else the energy can go other than to raise temperature. So I will not answer that unless you really don’t know.
Mario Lento December 7, 2017 at 6:14 pm
Mario, you claimed that there was some mysterious “energy signal”. I didn’t know where that could be found. You said it couldn’t be found in the temperature, viz:
So I asked, where is this curious “energy signal” to be found, since you think the energy is not going into temperature.
In response, you claim to be able to read my mind, and you proceed to tell me what you fantasize that I know … but you don’t answer either of the questions.
So I’ll ask again:
If the “energy signal” is not reflected in the temperature as you claim, then where does it go, and correspondingly, where should I look for your “energy signal”?
w.
Willis, I responded to your statement “First, if the solar energy is not going into temperature, where is it going?” So no, I did not need to read your mind to know that you were asking where the energy was going.
Do you want me to tell you? I cannot quantify it, but your question make portend if I cannot find it, then it’s not there. Energy goes into making steam, vaporizing water, warming oceans, warming rocks, photosynthesis, and 1000,0000 more things.
“Again, let’s agree to disagree here. Just because you cannot measure it, or do not have the time to consider all of the changes in the sun and how it affects the planet’s albedo, does not mean it is not there”
This is the unicorn argument.
people always ask me what I mean when I say that skeptics appeal to unicorns.
The above is a perfect example:
Mosher, as usual you are confused. I do not know what unicorn you think I believe. The context was to explain just the opposite of what you think. I made no claims that any theory or hypothesis were true. On the contrary, I made a factual claim that Temperature is not = to Climate, without considering the energy that is stored in moisture. And yes, that you cannot find a signal, does not prove that the thing you are looking for is not there. If you can’t understand this, I cannot help you.
Willis Eschenbach
December 7, 2017 at 5:04 pm
You have been shown hundreds of papers showing the solar cycle in every possible climatic phenomenon. Why do you keep d@nying their existence?
There are hundreds of papers showing that climate change is driven by CO2. Why do you continue to deny that? [or do you?]
The stratospheric polar vortex reflects solar activity. Forecast for Christmas.
Why not just measure it all the time in the international space station, for human health effect and safety if nothing else?
So the the AMO influence was caused by co2 from the past in order to make the direct causation line of co2 work now in a short term temp chart by Leif. Science by omission is not science. It’s an undergrad pitfall that needs guidance and correction by academic advisors.
.
My thinking is that if the sun’s polar magnetic field strengths goes lower, you will have more of the most energetic radiation being able to escape from the sun. Luckily, our atmosphere is protecting us by forming [more] ozone, HxOx and NxOx. In its turn, these substances then deflect [more] UV from earth so that less UV goes into the oceans.
Prepare for some global cooling coming up…..
If we get the same increase in minimum sea ice extent during this solar minimum as we got during and after the last solar minimum it is going to be difficult to claim that it is just a coincidence, the AMO is likely correlated to solar radiation.
The weak Sun is the creator and sustainer of every atom, life and planet in the solar system: https://arxiv.org/abs/1102.1499
No, cosmic rays from outside the solar system [and even an asteroid] regularly penetrate to the inner part of the System, e.g. to the Earth, where 30 cosmic rays hit your body very second.
Steven Mosher December 7, 2017 at 7:58 pm
Hey, Steven, good to see you. Are you ever going to answer my question about the sawtooth wave and the scalpel method? I’ve been asking for a couple of years now, over and over, with no answer, but hey, I’m a patient man, I’ll keep asking …
Because so far all I’ve gotten from you are unicorns … well, actually, not even that much …
w.
Touche’ Willis…
In reading my comments, Willis and Leif: I hope I was not snippy. You’re two brilliant people, and I’m always honored that you take the time to spar. My respect for you is high.
Can’t speak for Leif, but for me, your posts struck me as honest attempts to present your case, and honest questions. No problems for me.
Thanks,
w.
I appreciate your comment. Thank you Willis.
I second Willis. But again note that if an effect is invisible, I, at least, would not worry too much about it.
Leif: Agreed… Let the people who “worry much about it” find it. I just say, if they can find it, we learn something. I just am a skeptic, not a denier… so go find it… and I am willing to read their fodder.
JimG1 December 6, 2017 at 7:26 pm
9. It is apparent that CO2 is not the driving force behind climate, since there is poor correlation between CO2 and temperature for the last 20 years and over geologic time periods. More likely the oceans on our 70% water covered world, which absorb heat energy from the sun (for which we have some data), and geothermal energy (for which we have virtually no data), and release it over long periods of time by poorly understood mechanisms that are possibly the real driving force behind climate. These mechanisms are, evidently, not quantified in the climate models. Could enso events be a clue? And yes correlation is not necessarily causation and I understand the weaknesses in many of the proxies used for geologic data.
——————————————————-
Thanks for reminding us all of the real elephant in the room, that CO2 pushers seem to keep ignoring.
Maybe they are afraid of an expanding and contracting outer liquid core within the Earth. Or maybe they are afraid of the amount of CO2 emitted by the oceans because of volcanic eruptions.
There are those that are actively working on the Geothermal heating problem.
“Hillier & Watts (2007) surveyed 201,055 submarine volcanoes estimating that a total of 3,477,403 submarine volcanoes exist worldwide. According to the observations of Batiza (1982), we may infer that at least 4% of seamounts are active volcanoes. We can expect a higher percentage in the case of the count taken by Hillier & Watts (2007) because it includes smaller, younger seamounts; a higher proportion of which will be active. Nevertheless, in the spirit of caution and based on our minimum inference of 4% seamount activity from Batiza’s observations, I estimate 139,096 active submarine volcanoes worldwide. If we are to assume, in the absence of other emission figures for mid oceanic plate volcanoes, that Kilauea is a typical mid oceanic plate volcano with a typical mid oceanic emission of 870 KtCpa (Kerrick, 2001), then we might estimate a total submarine volcanogenic CO2 output of 121 GtCpa. Even if we assume, as Kerrick (2001) and Gerlach (1991) did, that we’ve only noticed the most significant outgassing and curb our estimate accordingly, we still have 24.2 GtCpa of submarine volcanic origin.”
http://principia-scientific.org/volcanic-carbon-dioxide.html/
By WILLIAM J. BROAD JAN. 12, 2016
“”Picture a volcano. Now imagine that its main vent extends in a line. Now imagine that this line is so long that it runs for more than 40,000 miles through the dark recesses of all the world’s oceans, girding the globe like the seams of a baseball.
Welcome to one of the planet’s most obscure but important features, known rather prosaically as the midocean ridges. Though long enough to circle the moon more than six times, they receive little notice because they lie hidden in pitch darkness.””
http://www.nytimes.com/2016/01/12/science/midocean-ridges-volcano-underwater.html?_r=0
“”A main question is to what extent the volcanism changes over time. The old idea was that the eruptions of oozing lava and related activity occurred at fairly steady rates. Now, studies hint at the existence of outbursts large enough to influence not only the character of the global sea but the planet’s temperature.
Experts believe the activity may carry major repercussions because the oceanic ridges account for some 70 percent of the planet’s volcanic eruptions. By definition, that makes them enormous sources of heat and exotic minerals as well as such everyday gases as carbon dioxide, which all volcanoes emit.””
The Correlation of Seismic Activity and Recent Global Warming
One geophysical variable that has been overlooked by both groups is geothermal flux. This study will show that increasing seismic activity for the globe’s high geothermal flux areas (HGFA), an indicator of increasing geothermal forcing, is highly correlated with average global temperatures from 1979 to 2015 (r = 0.785). By comparison, the correlation between carbon dioxide loading and global temperatures for the same period is lower (r = 0.739). Multiple regression indicates that HGFA seismicity is a significant predictor of global temperatures (P 0.1). A compelling case for geothermal forcing lies in the fact that 1) geothermal heat can trigger thermobaric convection and strengthen oceanic overturning, important mechanisms for transferring ocean heat to the overlying atmosphere, and 2) seismic activity is the leading indicator, while global temperature is the laggard.
https://www.omicsonline.org/open-access/the-correlation-of-seismic-activity-and-recent-global-warming-2157-7617-1000345.php?aid=72728
Could it be that the expansions and contractions within Earth’s liquid outer core are following the 100 year (50 yr. rising/50yr falling) solar cycle? P.S. Dr. S., don’t answer that, was just pondering out loud.lol
The mantle rotation pole position. A solar component
July–August 2017
Handled by Vincent Courtillot
“”…we uncover two more components, with smaller amplitude than the three first ones, but well identified, periodic with periods of 11 and 5.5 years, respectively, undoubtedly linked to solar activity. We interpret them tentatively as the result of an exchange of kinetic angular momentum between the atmosphere, in which a flow would be generated by solar activity, and the mantle. The order of magnitude of the required mean winds in the atmosphere computed in the frame of a schematic model is 1 ms−1, compatible with the observed values of the meridional mean circulation..”””
https://www.sciencedirect.com/science/article/pii/S1631071317300652
The Correlation of North Magnetic Dip Pole Motion and Seismic Activity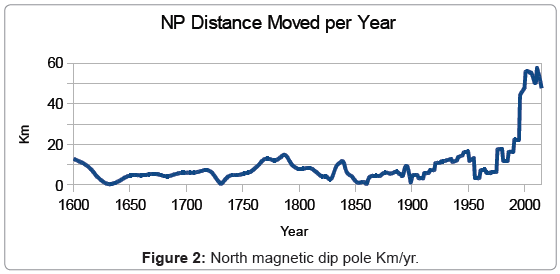
Williams B*
Retired, Gillette, Wyoming, United States
In the above image I don’t think that CO2 or GCR are what done that….
“We interpret them tentatively as the result of an exchange of
kinetic angular momentum between the atmosphere, in which a flow would be generated by solar activity,
and the mantle.”
Carla,
Thank you for the information. Since there are only two sources of energy on our home planet, solar and geothermal, it makes sense that they are intrinsic to the modulation of our climate. Given Leif’s often noted limits on the direct potential effects of solar, which I do not doubt, this does not obviate the potential for solar effects to be “stored and released” over time periods and by mechanisms which we are yet to understand. The obvious store house is the ocean. The geothermal is, of course, the other mostly unknown.
Regards,
JimG1
JimG1
true
if I had the time and the money,
I would really like to know the relationship of the position of earth’s inner core [as apparent from the position of earth’s magnetic north and south pole] and the W/m2 that comes from earth’s inside to the top.
Namely, my investigations showed no warming in the SH over the past 40 years, on average.
Almost all warming took place in the NH.
That should get some alarm bells ringing?
{if the warming is not global it cannot be the CO2 that is doing it!}
Earthling 2
Solar irradiation and the position of earth inner core (geothermal effects) both depend on solar cycles.
We have (years in brackets)
Schwabe (11), Hale (22), Gleissberg (87), Devries / Suess (210), Eddy (1000) and DeBRay (2400)
Like yourself, I also discovered a relationship between the position of Uranus and Saturn, shown here:
http://oi64.tinypic.com/5yxjyu.jpg
I am just not sure yet if the correlation is caused by the position of the planets [gravitationally ] forcing a change in the sun’s solar polar magnetic fields or if it is just the other way around.
don’t bother too much on SSN, rather look at the solar polar magnetic field strengths. Looking from 1972, note that you can draw a binomial from bottom to top (S)and from top to bottom (N) representing the average field strength. (Lowest point was 2014.)
HenryP: Good evening. I saw your post re: Uranus and Saturn that suggests cooling and warming. Do I understand correctly that the earth show have been cooling starting in 2008? The Satellite record shows that from 2008, we’ve warmed 1 degree kelvin. So perhaps I misunderstand. PS, I read your posts with great interest.
Hi Mario
According to me, on a sample of weather stations, balanced to zero latitude, I get that earth started cooling down around the change of the new millennium.
But it is not by much….
https://wattsupwiththat.com/2017/11/30/a-must-read-a-veneer-of-certainty-stoking-climate-alarm/comment-page-1/#comment-2685930
sorry@Earthling2
I forgot to add the relevant graph
http://www.leif.org/research/Solar-Polar-Fields-1966-now.png
The decision on 24 OCT 1945to unite nations and national Academies of Sciences in order to save the world from future nuclear wars after Huroshima and Nagasaki were destroyed on 6 & 9 AUG 1945, in fact destroyed the integrity of science worldwide and prevented understanding of the causes of climate variations. The so-called “Galactic Cosmic Rays” probably come directly from the Sun’s pulsar core, and were recorded as a gradient in cosmic ray exposures of meteorites at the birth of the solar system: iron meteorites > stone meteorites > carbonaceous chondrites
Just a very simple idea, but something I have been commenting on to LIA people for a while. There were 200 years of solar mins, an enhanced period then another min that brought us into the 1800s. If one wishes to opine that the solar activity of the sun is a primary driver, then think about this. The enhanced sunspot activity of the last 200 years may have contributed to the oceans warming and have some influence on the MOC. Where would 200 years of that be stored? Now what is the known effect of decreased radiation over the tropics. Take the extreme event, a volcano like Pinatubo. There was cooling, but then an el nino response and overall a general warm period in the tropical Pacific that ended with the Super Nino and the earths temps reaching a peak. My point. The oceans may have stored energy from the positive sunspot cycle. Decreased incoming radiation may lead to more warm ensos and the first response is warming. In addition, the warming we see is hugely disproportionate, mainly where it is driest and coldest since the increase in water vapor if you look at your mixing ratios will affect where temps are lowest first. A look at the DMI site reveal no summer warming, but winter warming in the arctic, I would venture to say that the warming between the arctic and antarctic circles is far less than warming north and south of it. This, in turn, would have to have an effect on MSLP patterns and the GWO. My guess is that the response is showing in the heavier early season snows in Siberia ( yes its warmer but not warm enough) and Greenland now. Interestingly enough, when I was 8 years old, my dad gave me a book , I believe the name was Why the Weather? that described that warming in the arctic would lead to more snow ( more water vapor, and though warmer, not warm enough so it would not snow,but instead snow more ) later springs and the reversal of the very pattern that was warming, Such things take decades and centuries. But my point is the first response of lower solar may be warming, due to the warmth that may be stored from the higher solar and the release and distribution into the atmosphere where it makes the biggest difference where its cold and dry. In the end, the antics of the ocean and WV, which may indeed have the sun as the conductor, far outweigh that of co2 though an underlying signal may be there, which given the way temperatures bounce up and down in response to the enso, may be no greater than noise Peace out
Joe Bastardi: Great explanation! It makes sense that the cold/dry air has less heat capacity, and so is most prone to warming. As well, heat being stored and released in longer time cycles due to the ocean cycles. The ring leader seems to be the sun, somehow. Latent Heat energy also stores heat so that in fact the stored energy does not raise the temperature of the higher state of the water, but in stead releases it when it condenses. So temperature alone does not tell the whole story.
but in stead releases it when it condenses
On the timescale of climate all that water vapor eventually condenses so the temperature will reflect that properly, making the temperature the one and only story.
Well, OK Leif. You are perfectly consistent and clear.
I am not suggesting that the water will never condense. It’s a question of when. I doubt that we can see a signal in neat 11 year cycles due to so many other confluencing factors.
Integrals with varying factors sometimes 2 and then varying them reveals some correlation. Yes – you can make an elephant’s tail wiggle with enough variables… but it does not take much to show an integral relationship to the sun and so called average earth temperature! But again, in nature which so complex there is no 1 secret factor that one can be used to see through the complexity.
In short there are difficult to predict volcano eruptions, varying ocean circulation, clouds and more clouds, a varying sun (both TSI and larger frequency deltas), changing vegetation albedo, atmospheric albedo including 03, earth’s position and orientation and more including cosmic rays. They (and many more) all have some effect… and unfortunately, they don’t all happen in 11 year cycles. As well our decent records do not all have the same quality over time.
I do not claim to be able to identify and then pretend to tell you that I “know” how to find the “unicorn” as Moser says it :). I do say that tracking ONLY the temperature “as an average”… and then making strong determinations that there is proof that the sun’s TSI did not do it, is woefully lacking. At least in convincing me the sun could not have played a role.
PS – I am a process and machine control engineer. I work mostly as a sales engineer, but still am active in controls projects and control design of many different processes. I am humbled with how much I know I do not know… I am further humbled by brilliant people such as you and Willis. There are things most brilliant people have not figured out yet. But I am hopeful!
the sun could not have played a role
The Sun does play a role to the tune of 0.07 degrees over the cycle.
“The Sun does play a role to the tune of 0.07 degrees over the cycle.” I take your word for it and have no doubt that based on TSI and a static albedo. There are other things I’ve mentioned, that certainly have an affect on albedo.
My Bearded dragon changes albedo based on radiation exposure.The same TSI calculation used to derive the 0.07 degrees would clearly give the wrong answer on the average temperature of my lizard.
I am not suggesting that the water will never condense. It’s a question of when.
The residence time of water vapor in the atmosphere is nine days….
Leif: “Residence time is 9 days” This statement is not in contradiction to my point. If the “humidity of the earth” changes, so does the resulting temperature given an energy input since energy takes a latent form. That is my point. A warmer earth is supposed to be more humid, thus resisting temperature increase.
What it mean is that whatever heat goes into humidity is released to the atmosphere in nine days. As simple as that.
Leif: “What it mean is that whatever heat goes into humidity is released to the atmosphere in nine days. As simple as that.”
That’s a good fact to keep in my pocket. Must be an average… as I know heat can be released much quicker than that.. like almost immediately. Right? Anyway, my point is not changed by this… which is a calculated number based on some average I assume. if ave humidity increases… that is due to more latent heat being trapped, this preventing temperature increase.
The 9 days is a global average. What it means is that whatever goes into latent heat is released in 9 days on average and therefore immediately [from a climate viewpoint] increases the temperature. The energy we get from the sun must be radiated away [at infrared wavelengths], i.e. at a higher temperature if the incoming solar energy increases.
Leif: Thank you. Makes sense. I think, if (on average) the humidity goes up, then the net amount of stored energy increases. It does not matter that it is released in 9 days, what matters is the more energy is being kept away from where it can increase temperature. As the earth cools, and humidity decreases, the latent heat will resist temperature drops.
But all that happens on time scales of days, so is irrelevant for the climate. The temperature is still the relevant parameter for the balance between incoming and outgoing [which are equal] energy. This is why ‘global warming’ is expressed as temperature changes.
Leif: you wrote “But all that happens on time scales of days, so is irrelevant for the climate. The temperature is still the relevant parameter for the balance between incoming and outgoing [which are equal] energy. This is why ‘global warming’ is expressed as temperature changes.
I submit that temperature is a function of energy but certainly not = energy, as you posited. You treat humidity as constant, whereas I state that it is not constant.
My argument is that a warming earth suggests humidity increases. Your statement does not consider where all of the heat is consumed by increases in humidity.
I define delta humidity as not constant. You’re correct only if your statement is that there is no increase in humidity, or again it’s constant.
Could it be that we are both technically correct given precision of our statements?
temperature is a function of energy but certainly not = energy
Temperature is a measure of the average internal kinetic energy of matter and also a [non-linear] measure of the radiant energy emitted by a body. So temperature is a measure of energy.
“So temperature is a measure of energy.”
No… you cannot tell how much energy is there without knowing the mass. So, no temperature is not measure of energy. Just tell me I am right!
The Stefan-Boltzman law https://en.wikipedia.org/wiki/Stefan%E2%80%93Boltzmann_law does not involve any mass.
“The Stefan–Boltzmann law states that the total energy radiated per unit surface area of a black body across all wavelengths per unit time (also known as the black-body radiant emittance or radiant exitance) is directly proportional to the fourth power of the black body’s thermodynamic temperature”.
The kinetic theory of gases https://en.wikipedia.org/wiki/Kinetic_theory_of_gases states
“The temperature of an ideal monatomic gas is proportional to the average kinetic energy of its atoms”.
Again no mass is involved. If two bodies have the same average kinetic energy of their atoms, the will have the same temperature no matter how large [i.e. how much mass] the bodies are.
So, you are not right.
Hoe long shall we continue this silly charade?
“So, you are not right. Hoe long shall we continue this silly charade?”
Leif: Saying the temperature of a body, tells you how much energy is emitted is NOT the same as saying how much energy is contained in the body, which also has some unknown mass. Those are two different things with completely different units.
You can not say, the temperature of something equal’s its energy. You change the words “it’s energy” to “emitted kinetic energy.” That’s a bait and switch argument.
You can say something about energy emitted… but that is not the same statement as energy contained.
Dry air at x temperature has less energy than moist air at x temperature. Are you saying that statement is incorrect?
You also need the mass to determine the total energy (not just kinetic but also potential energy)!
how much energy is contained in the body, which also has some unknown mass.
Since the mass of the atmosphere [and the oceans and the soil] is constant, the mass [which is known] doesn’t matter. The temperature is determined by the incoming energy flux from the Sun [ignoring the tiny (constant) flux from the interior of the Earth]. Whatever goes into latent heat is released as sensible heat in a few days, so global humidity is not important [and eventually depends on the temperature anyway].
Leif: You’re saying a completely different thing than I am saying.
You’re now stuck on “emitted black body energy” to win an argument. But you do not address my statement even closely. Yes of course temperature tells you energy “emitted”. But it tells you nothing about potential or stored energy.
A humid 30C degree area “emits” the same energy as a dry area air at 30C. The humid area contains significantly more energy! And so no, temperature certainly does not tell you how much energy the mass contains. It cannot.
Why is this is charade?
Finally, the point is, if the earth got generally more humid, your climate = temperature statement could not distinguish between the two earths. It assumes it does not matter. And it does matter. Your statement calls them = in terms of climate. That is a woefully incorrect conclusion.
True.. I agree with you, Mario.
Thank you HenryP and Leif:
Leif: I’m trying to keep consistent here. I trust my redirection is not snippy.
Leif, you assert that the moisture of the air is some static average so you can make your statement true. I submit that is a false assumption, which leads to the circular argument that temperature tells the [whole] story, which it does not.
On that basis, looking only at emitted radiation of earth [without knowing the state of its constituents] tells one nothing about the total energy of the earth or any body.
Dang – I am getting a free lesson from Leif and people like you… and so feel honored!
On that basis, looking only at emitted radiation of earth [without knowing the state of its constituents] tells one nothing about the total energy of the earth or any body.
Be careful. The total energy of any body of mass m is E = mc^2 + much much smaller kinetic and chemical energy + potential energy (e.g. depending on the body’s position relative to other bodies) .
What is important for the climate [e.g. for plants and their growing season] is the temperature. That is why we go to great lengths to measure it
Thank you Leif!
I as well think we need to measure temperature. Temperature is “one” of several vitally important metrics to climate. It cannot tell the whole story of climate, as we both agree. The daunting task of measuring the earth’s mass balance of energy is NOT what I’m concerned with vis a vis climate. It’s that thin layer from the surface to the sky in which we live that matters.
Small changes in moisture have dramatic effects on climate. Moisture level dynamic and absolutely not an average or constant. Rather, it swings wildly as climate changes. So assuming it’s constant just gets into circular arguments. I recall in engineering “assume a perfectly frictionless body” That works until friction matters… On Earth, moisture matters!
Small changes in moisture have dramatic effects on climate
But is driven by the temperature resulting from radiative balance. So the relevant parameter to plot and to consider is simply the temperature, which then is the whole story.
As should be obvious, the global humidity varies just like the temperature:
http://www.leif.org/research/Global-Humidity.png
from https://www.climate.gov/news-features/understanding-climate/2012-state-climate-humidity
Thank you again Leif… That’s why they pay you the big bucks (I hope)! Thank you for the lessons… which you’ve allowed me to painstakingly question. There’s a ton of latent heat in all that moisture, which should buffer any cooling that might or might not happen. You’re a patient man.
There’s a ton of latent heat in all that moisture, which should buffer any cooling that might or might not happen
No, there is not, as all that moisture condenses in 9 days. Perhaps you can see here that the temperature and the humidity go hand in hand and that there is no evidence for any extra heat buffering anything which would shift the temperature curve:
http://www.leif.org/research/Global-Humidity-and-Temps.png
This concludes the discussion.
You would agree though that the release of WV into the air and the resultant spreading out of it has more effect where minute increases in WV affect temperatures most, which its where its dry and cold leading to a disproportionate warming. We can directly watch enso SST and resultant warming ( or cooling as we see in the la nina after the lag ) but there is no such linkage to co2 that we can directly track except the cry its getting warmer so it must be co2. But why would you not track and pay attention what you can directly. So is it not the antics of the ocean and water vapor? As far as temps the one and only story, the tracking globally of mixing ratios has always been my argument ( actually Dr John Cahir from PSU) as the real canary in the coal mine as far as climate. Any cutting of the WV from its source and rapid turn arounds can occur, especially since its so warm. The fact is the nature of heat is the warmer it is, the harder it is to get warmer! But cut the source and down it will come. This is why a look at the arctic temperatures reveals that it is WV, as the summers are not warming north of 80 north ( because it takes more to do so when the mean temp is 275k) than when its 250K Its not that co2 has NO effect its that because of larger items around it, its very difficult to say its the climate control knob. Another hint is the fact the nightime lows are warming while daytime maxes for instance over the US have warmed less. One may argue that the range then is decreasing, leading to a more stable climate, especially since warming in the north decreases the zonal potential energy. BTW I am no fan of tranquil weather. Bad for business. If anyone in this discussion should be rooting on extremes, it would be me. Peace out
joe
there is no man made global warming, or its effect is so small that you cannot measure it.
see my reply to Mario.
What paper makes you think that man made warming does exist and what checks have you carried out that there is warming at all, and that it is global?
As a weather man with a great track record… I would say Joe can see through the maze and tell us with great depth of knowledge his opinions… and to me they hold water! Henry, I too think your work is fascinating… and I look forward to your ideas and conclusions to help us try to see through the maze!
Gabro December 9, 2017 at 10:33 am
Willis Eschenbach
Thanks, Gabro. First, I’ll make you the same offer I make everyone. Send me TWO links, one to the paper claiming the detection of solar sunspot-cycle related effects on surface datasets that you think is the strongest evidence for your case, and the second to the actual data used in that study. I’m more than happy to take a look at it.
Second, I don’t “deny” anything, that is a pathetic ad hominem attack that just makes you look like a pathetic noob. Sorry, but that is the reality of folks throwing around accusations of “denial”.
Finally, I’ve been accused of this before … and Leif Svalgaard just posted the best answer, viz:
I don’t make scientific decisions based on the number of papers making a claim. I base it on the quality and strength of the arguments on both sides of the question.
I await your best paper plus data … although if past performance is any guide, only about one of my detractors in fifty actually takes me up on the offer. Funny how that works.
w.
Willis,
It is pointless yet again to present you the facts, since you refuse to accept them.
You’re a true believer, not a scientist. You are impervious to reality.
Real scientists here have shown you hundreds of papers, of the highest quality, but no amount of objective reality will change your set mind. Your obstinate d@nial of reality makes you a zealot.
You’ve been repeatedly shown for years that the solar cycle is visible in temperature, rainfall, storms, tree rings, wind, air pressure, ozone, you name it. But you have your totally baseless beliefs and won’t be budged by any amount of reality.
But just to give readers who might be unfamiliar with your record of evasion, avoidance and inability to accept inconvenient truths, a good place to start would be your reaction to Dr. Reddy’s analysis of rainfall data from Fortaleza, Brazil.
In typical fashion, first you d@nied that there could possibly be a long enough record there to be valid. Clearly, you didn’t even bother to read his paper. When showed that the data went back to 1849, you then simply asserted without any statistical analysis that the good doctor’s 52-year cycle didn’t exist.
https://wattsupwiththat.com/2015/12/10/noise-assisted-data-analysis/
This Italian scientist did the work which you refused to do, for fear apparently of what you might find, and discovered that the data and Redddy’s analysis are indeed statistically significant.
The same MO you displayed for monsoons, tree rings, temperature and precipitation in every other paper from every continent and ocean.
Dee-nial is the right word.
http://www.climatemonitor.it/?p=39988
Forgot the Italian link. In Italian, but graphs make the point, even if you don’t read Italian.
Just as you have ignored, dissed and shined on all of Reddy’s other work:
Dr. S. Jeevananda Reddy
June 28, 2014 at 10:44 pm
I am one of the few working in the area of rainfall patterns over different parts of the globe. My first paper [published in 1977] relate to the dates of onset over Kerala Coast, an important event in monsoon rains. This showed a 52-year cycle. My second paper relates to Mahalapye in Botswana. The precipitation data presented a 60-year cycle — with sub-multiples, amplitude & phase angles; integrated — published in 1981. The Fortaleza precipitation data in Brazil presented a 52 year cycle — with sub-multiples, phase angles and amplitudes; integrated –. This was published in 1984. 1986 published the analysis of Durban in South Africa and Catuane in Mozambique. The precipitation data of Durban showed 66-year cycle and Catuane 54 years — sub-multiples, amplitude & phase angles integrated –. In the case of Ethiopian stations the analysis was published in 1990. They varied from 22 to 44 years cycles. Asmara in present Eritrea presented 22 year cycle, which is a sub-multiple seen in Durban precipitation. Indian rainfall — all-India southwest monsoon — data analysis was published in 1996 — the homogenized data series was available only in 1995 –. The all-India Southwest Monsoon rainfall presented 60-year cycle — completed two full cycles and started in 1987 the third cycle. This is different in Andhra Pradesh state rainfall that receives rainfall during the southwest and northeast monsoons and cyclonic activity presented 132 year cycle in annual precipitation. The southwest monsoon and northeast monsoon rainfall data presented 56 year cycle but in opposite direction. The cyclonic activity followed the northeast monsoon 56 year cycle pattern. The hurricanes & typhoons followed 60-year cycle of All-India Southwest monsoon but in follow opposite pattern. Global temperature followed the same pattern but similar to typhoons pattern.
In such scenario, average.rainfall pattern provides negative feedback. It is better to look at regional level pattern as they follow general circulation patterns in conjenction with natural in-built cyclic variations.
Dr. S. Jeevananda Reddy
He’s a scientist, and you’re not. You just try to play one on blogs.
And then of course there is Dr. Spencer’s takedown of you as a poseur. because you lack basic scientific education, you imagine that you’ve made real contributions instead of merely reinventing the wheel. With four sides.
http://www.drroyspencer.com/2013/10/citizen-scientist-willis-and-the-cloud-radiative-effect/
Naturally, on the two (?) occasions when you have attempted a real scientific paper, you left out the usual section on previous work along the same lines. Literature search just isn’t your bag.
So you fall back on your old standby defense of asking for just one paper, with which you then proceed to find some phony fault. You’re not interested in reality and can’t handle the truth.
Sad. Maybe if you had studied a STEM discipline at Sonoma State instead of psych, after your Section 8 discharge from the Army, you could have been a contender. But too late to make up for it now.
For “poseur”, please read “pumped-up poseur” who imagines himself a “polymath”, despite all objective evidence to the contrary. A science education would have served you better than a masseur’s license if your goal were to contribute to science.
Careful there Gabro, or you will get pummeled by him when he touts his MAJOR contribution. He had a “pal reviewed” comment published in Nature’s Communications Arising: https://www.nature.com/nature/for-authors/bca
Steve,
I know about his pathetic published comment out of which he tries to build a scientific reputation.
As I said. Sad.
Gabro December 9, 2017 at 1:54 pm Edit
Gabro, if you don’t want to put your theories to a test, there’s no need for all of that faffing about. Just come out and say that you do NOT want people to test your claims. No need to kill electrons needlessly writing all of your pathetic excuses.
Next, as to not accepting facts, I have two posts that clearly show what I actually do when I’m wrong. The first post was called “Wrong Again”, and the second was called “Wrong Again, Again”. So I have publicly demonstrated that when the facts change, I admit that I am wrong and I change my mind.
Can you say the same? Can you point me to where you’ve admitted publicly that you were 100% wrong? Or will this request go the way of my simply asking for your evidence?
Finally, I had a “Brief Communications Arising” in Nature. As you and Steve Heins obviously don’t know, a Brief Communications Arising is NOT a comment. It is a short piece, 500 words and one graphic.
In that piece I said that no, the decline in the fishery at Lake Tanganyika was not due to climate change. And despite taking lots of crap from jerks like you and your pal, guess what?
I was right. My piece has since been cited in two other scientific works that say the same thing.
So I have a piece in Nature that has garnered two citations (among the seventy or so scientific citations that my work has received.
Can you say the same?
So … is the taste of those sour grapes in your mouth worth it?
w.
Gabro December 9, 2017 at 2:19 pm Edit
Let’s start with the facts. I didn’t “deny” anything. That’s just you being a jerkwagon. What I said was:
Here’s a protip—if a man says “I don’t think”, he is not denying a damn thing. I didn’t think it existed. I was wrong. I admitted it, and I analyzed the data.
After your lie that I denied something, you then falsely claim that I “simply asserted without any statistical analysis that the good doctor’s 52-year cycle didn’t exist”. That is more of your ignorance. I reported on my statistical analysis, but I didn’t publish the results. If someone had asked, I’d have posted them … and now, after all this time, you’ve asked.
Well, lucky you. I still have the analysis, so I just ran it again. Here’s the periodogram of the data, a re-run of the analysis that I did at the time:
There simply is no 52-year signal visible in that Fourier-based view of the data. And THAT IS WHAT I REPORTED AT THE TIME.
Now, at that time I didn’t know about CEEMD, which is “Complete Ensemble Empirical Mode Decomposition”. So let me take another look at the Fortaleza data with CEEMD … hang on … OK, here we go. First, the periodogram of the intrinsic modes:
As we saw in the periodogram, there are no cycles that are anywhere near the annual cycle. All of the power is in the 6-month and one-year bands.
However, we can look and see if the tiny cycles have any power in the 52-year range.
Even when we magnify these tiniest of cycles, there is still no power in the 52-year region.
In other words … my claim at the time was correct.
So piss off with your nasty insinuations, my anonymous ankle-biter. I’m not interested in being accused of things I never did by people without the courage to sign their own name to their own words. The ball is in your court now. If you think the 52-year cycle is there, show us your analysis of the data.
And I can understand now why you are so unwilling to provide the strongest piece of evidence for your belief in sunspot cycles and other cycles …
w.
Willis,
You do not have a “piece” in Nature. You have a comment, to which the authors of the paper replied. That’s it.
As I said, you\re a pathetic wannabe, who imagines falsely that you’ve made a contribution. Dr. Spencer has correctly put you in your presumptuous place. But reality isn’t your bag.
As I said, why show you yet more dozens of papers on solar effects on climatic phenomena, when you steadfastly refuse even to read them, let alone analyze them?
The facts speak for themselves. You just can\t handle the truth, and apparently aren’t even interested in it.
Anyone who wants to can read your non-reply and weaseling in response to Dr. Reddy and in every other case. Anybody doing so will plainly see what a pumped up poseur you have the ignominy to be.
Willis says: ” a Brief Communications Arising is NOT a comment.”
…
However, the description posted by the journal Nature says: “Critical comments on recent Nature papers may, after peer review, be published online as Brief Communications Arising, usually alongside a reply from the criticized Nature authors.”
..
So Willis you are wrong.
….
You can read the description here: https://www.nature.com/nature/for-authors/bca
…
That’s where my quote comes from.
..
Note it says: ” Critical COMMENTS on recent……..”
Mario
I am not sure if global RH is decreasing, anyone here have a comment on that?
That would fit into my results showing that, ON AVERAGE, earth has already started cooling, since the start of the new millennium.
Also, in a cooling world one would expect less clouds and rain at the higher latitudes and more at the lower latitudes. I think, generally, just looking at the weather reports, on average, this is happening already.
That brings us of course back to the dust bowl drought 1932-1939 and the one before that happening in 1845 that wiped out a lot of the bison on the plains of north America.\
by my calculations the Gleissberg cycle is 87 years, not 88 years as reported by most, consisting of a sinewave with 43.5 years of warming followed by 43.5 years of cooling.
That means the next decade could bring a disaster to the bread basket of the world.
https://youtu.be/IRsPheErBj8
http://oi63.tinypic.com/2ef6xvo.jpg
Just for interest:
note this graph from Leif:
http://oi63.tinypic.com/2ef6xvo.jpg
Just so you don’t get confused with using the right terminology:
When sunspots are high, the solar polar magnetic field strengths are low.
Note that according to Leif’s latest graph, the solar magnetic field strengths have been increasing, since 2015 (when the cosmic ray measurements also began)
http://www.leif.org/research/Solar-Polar-Fields-1966-now.png
I would assume that there must be a correlation?