I was notified by a friend that Tamino is slagging Anthony and me over at his blog, where I was banned from commenting years ago because I pointed out some unwanted facts to him. Of course, Tamino is still free to comment here, we don’t censor the views we might disagree with—that’s science.
To begin with, attacking a man where he cannot reply is just scummy. But that’s no surprise, it is Tamino after all. He doesn’t even have the albondigas to sign his own name to his own words … so I expect nothing from him and am yet to be disappointed. As Churchill is reputed to have said of one of his opponents, “He’s a humble man … and he has much to be humble about”.
Tamino’s post is called Why I call Anthony Watts and Willis Eschenbach “denier”. Charming. Of course, Tamino knows that this term “denier” was picked because of its association to “Holocaust denier”, and that it is an objectionable, anti-scientific term designed to pluck at his reader’s heartstrings and avoid their intellect … but like I said. Pond scum.
He claims that Anthony and I are “deniers” because in a post about the USCRN, the US Climate Reference network, I pointed out a fact, which is that the US has not shown any statistically significant warming since the USCRN started.
Tamino starts by agreeing with me:
The estimated trend is upward, but its uncertainty is large because the time covered is so short. I estimate the warming rate at 10 ± 14 °F/century (95% confidence limits). Because the uncertainty is so large, we say that the claim the trend is upward fails to reach “statistical significance.”
But he goes further:
If this was the only data we had, we would know that the trend was highly uncertain; it could be as low as cooling at 4 °F/century, but it could be warming at a whopping 24 °F/century.
But we do have more data for the “lower 48” states of the U.S., from the National Climate Data Center, all the way from 1895 to the present.
He then proceeds to post up a graph comparing the NCDC data from 1975 to the USCRN data from 2005.

Regarding this graph, Tamino says:
This makes it abundantly clear that ignoring the trend from NCDC data, mentioning only the USCRN data, helps our understanding not at all. It only serves one purpose: to muddy the waters.
Look, folks, that is comparing apples to oranges. By that logic, we should be able to throw up the trend from say 1940 to 2017 and claim that that “helps our understanding” of the much shorter trends … sorry, but that simply doesn’t work. And why did he pick 1975 as his start date?
So … what’s next? Is Tamino going to tell us that the trend from 1850 can help our understanding of the current hiatus in warming? How about the trend since 1650? Hey, it’s been warming since 1900, and according to Tamino, that should disprove the general warming hiatus from 1945 to 1975 … but actually, it does nothing of the sort.
Here’s a protip for Tamino. If you want to compare trends, you need to compare them over the same time span. I’d do that for the NCDC data that Tamino used, as I suspect that there is no significant trend in that as well … but then like far too many folks masquerading as scientists, he didn’t post a link to his data as used.
And in any case, as I said in my previous post:
So … still no significant trend. Yes, the dataset is short, 13 years … but there are a number of 13-year periods in US temperature history which do have significant trends.
Facts are stubborn things, and I know Tamino doesn’t like it, but the facts are that the best data we have say there is no significant warming since 2005. Adding other data from 1975 onward doesn’t tell us anything further about the post-2005 trend.
Ah, well, I take comfort in knowing that when I start taking flak, it means I’m over the target.
I’m still in the Solomon Islands, for reasons I related in my first post from there, Feasting. My second and third posts from the islands, entitled Munny and Hauling Out, are up at my blog, Skating Under The Ice. So while Tamino is gnashing his teeth and pointing fingers and angrifying his blood and wailing “Deniers! Deniers!” at Anthony and me … well, me, I’m living the dream … you’re welcome to come along.
My thanks as always to Anthony for this amazing blog, where people are free to hold far-ranging discussions on scientific matters. The current mania for censoring speech that people happen to disagree with, from Tamino’s and Gavin Schmidt’s blogs, to the Democratic Party refusing to condemn Antifa’s violent censorship, to the college campuses all across the US, is a horrible and worrisome trend. I stand for free speech, this blog stands for free speech. Tamino and Gavin stand for censorship, which should tell you something about the quality of their science. Go figure …
My best wishes for everyone,
w.
Added: It is important (at least to me) to point out that “Tamino” is actually Mr. Grant Foster of Portland Maine. I don’t have a whole lot of respect for people who label other people with pejoratives such as “denier” while being too cowardly to put his/her name to such labeling – Anthony Watts
Thanks, Anthony. Also, there are some interesting links in the “Related Posts” just below.
Ah, Tamino…selects the name of a hero to be his online pseudonym, then selects “Open Mind” as the name of his blog when nobody with an open mind is allowed to post (without getting banned or censored, that is). I pity the fool.
A blog called ‘Open Mind’ that blocks comments is spectacularly Orwellian.
Its the man behind the Foster Grants—- its Grand Foster. (sarc)
extreme – this blog
blocks comments.
I used to put my comments in The Guardian. Some used to appear under the comments and some used to be withdrawn from the comments. Today, when I tried to put my comment, it says you have been removed from commenting. One sided act — whom they will serve???
Dr. S. Jeevananda Reddy
crackers345, the point is that a source branding themselves as “Open Mind” which then blocks any comment that doesn’t fit that ‘mind’ is, in reality, not open. Just the opposite.
Same for ScepticalScience (if I recall their name correctly). Not sceptical, not science.
They did not choose these deceptive names by accident. The people at the top of this propaganda pyramid are very clever. A more accurate name for Tamino’s blog would be Closed Mind or, even better, Settled Mind.
Perhaps Hive Mind
Or Jive Mind
Crackers,
That is very disingenuous of you, because, as you very well know, this blog has very clear rules as to what is allowed and what is not. These rules are in place to promote civil discussion and keep the trolls from becoming too disruptive. There is no arbitrary censorship. Your presence here is proof of that.
Or, considering how much traffic it gets, maybe just Never Mind.
This reaction to his blog is probably the most publicity he’s got for a long time.
Crackers you should have been banned just because you mount carriage return and line feed attacks on us with your I am a so bad typing meme.
Tamino.. the collaborator.
Extreme Hiatus,
Or, as Mark Twain said, “the settlings which they regard as brains”.
Anthony said:
“You’ll probably run it over to “Sou” aka Miriam O’Brien and whine about how terrible we are here. You’ve done it before.”
I have no idea who that is. And, I’ve done what before exactly?
Last year
https://tamino.wordpress.com/2016/09/20/misleading-trends-sea-level-version/
Tamino didn’t like my graph. When I tried to respond my posts simply didn’t appear. I guess that’s the way he bans people.
Indeed. It’s the method the Russians perfected, he just erases you from the photograph and nobody ever knows you were there. You see why I call him pond scum?
w.
Pond scum fits. A film of that on the pond’s surface blocks light/information and reduces the primary productivity/knowledge below it. It can cover, conceal and distort the appearance of objects with layers of green slime. Then it dies, sinks, rots and, in a fairy tale ending, turns into coal or oil.
that sounds more like a Borg to me: “We are open mind, lower your criticism and surrender your skeptical views you will be assimilated to our pond scam collective. Resistance is futile”
🙂
Willis said:
“Indeed. It’s the method the Russians perfected, he just erases you from the photograph and nobody ever knows you were there. You see why I call him pond scum?
w.”
Of course, invisible censorship like that would never happen here…
Philip Schaeffer December 5, 2017 at 4:33 pm
You appear to be making a serious accusation in a most underhanded, unpleasant, and passive-aggressive manner.
As far as I know, and I must qualify that by saying that I am NOT a moderator so I’m not privy to the innermost details, that does NOT happen here. I’ve snipped a couple of egregious comments here in years of posting, never for scientific reasons, and never comments directed at me personally. And I have always left the header, any innocuous parts of the message and a note saying both that their comment had been snipped and why it was snipped.
Yes, people have been banned for breaking the site policies. Crackers345 just got banned because he was just a sockpuppet for David Appell. And people get banned for outrageous behavior. If you saw the kind of stuff some people write, you wouldn’t want it within fifty miles of any civilized blog.
But as far as I know, nobody’s comments just get disappeared because we disagree with their scientific claims … as happens regularly at Tamino’s and Gavin Schmidt’s blogs.
So if you have evidence, time to put it out there …
w.
Willis says: ” I am NOT a moderator”
..
Then Willis says: ” I’ve snipped a couple of egregious comments”
…
I was under the impression that moderators do the “snipping?”
It’s true that Willis isn’t a part of our regular moderation staff, that said, the permissions level he has on WUWT is the same as any other author who can post stories autonomously, and that does allow for snipping comments too. So far, I have not seen him abuse that privilege by going outside of our moderation and commenting rules.
Willis said:
Well then, perhaps you can tell me what you think of my comment on the “Unbelievable: New $500 million Oroville dam spillway already has cracks” post, where Anthony rubbished the claims by the DWR that “With the inclusion of these design elements, the presence of hairline cracks was anticipated and is not expected to affect the integrity of the slabs,” DWR said.”
See if you can find it.
You can get away with a lot if the people you are hassling are on the approved list of targets, but the standard is much different if you criticize Anthony, or someone he holds in high esteem. Much easier to end up on permanent moderation that way.
Think about the way Monckton, or AndyG55 behave. Compare to Stokes. Hmm, I wonder which of those is on permanent moderation?
[Yes some of your comments don’t make it through moderation. There’s no record on any comment from you on the Oroville Dam thread, but then again I don’t approve every comment. But, 549 of them have been approved so far.
The ones that don’t get approved are often trying to pick a fight, or telling the authors, other commenters, or moderation staff that they need to do something that fits your particular world view…. like telling us we need to change the title, ban other people, retract the whole article, make apologies to people to who you think the criticisms levied in article are unfair, etc. Often you write as if you think you are the blog owner. Change your tune and tactics, and more of your comments will make it through because they actually contribute to the conversation, rather than trying to get moderators, authors, commenters, and the owner to do things the way you want them to be done. Your approach is often that of “concern trolling”. Get your own website if you want one to control.
If you limit your comments to discussing the material at hand, rather than mixing them with the “concern trolling” approach, you will likely have far less problems here. As you know, you are on permanent moderation now, because you’ve abused your commenting privileges in the past, and yet you persist with the concern trolling. You know your comments go straight to moderation, yet you get miffed if some of them don’t make it. This comment of yours is a perfect example. You’ll probably run it over to “Sou” aka Miriam O’Brien and whine about how terrible we are here. You’ve done it before.
Also, read the Policy page https://wattsupwiththat.com/about-wuwt/policy/ and note: “Like any establishment, we reserve the right to refuse service to anyone”. We are not required to carry your comments/operational pleadings just because you think we should, and you aren’t in any position to expect it. I’m not required to carry any of your comments at all, nor am I interested in a debate over this subject with you. Consider that before you waste time typing any response. If you want comments published here, stop the concern trolling, limit it to the subject matter, and we’ll see how it goes. Something tells me though you won’t be able to. -Anthony]
Anthony said:
“The ones that don’t get approved are often trying to pick a fight, or telling the authors, other commenters, or moderation staff that they need to do something that fits your particular world view…. like telling us we need to change the title, ban other people, retract the whole article, make apologies to people to who you think the criticisms levied in article are unfair, etc. Often you write as if you think you are the blog owner. Change your tune and tactics, and more of your comments will make it through because they actually contribute to the conversation, rather than trying to get moderators, authors, commenters, and the owner to do things the way you want them to be done. Your approach is often that of “concern trolling”. Get your own website if you want one to control.”
Like with the “Latest Excuse For The Global Warming Pause” discussion?
Where I attempted to post, pointing out that the headline, article, and statement from Worrall bear no resemblance to what the scientist in question actually said?
All I did was express my opinion. You don’t like someone saying that you are posting dishonest headlines and text, and that they should be corrected? OK, it’s your site and you can censor whatever you want….
So the article will still claim that a NASA scientist was making excuses for cooling, and that he claims there will be a plunge into a cool period, or an ice age if the volcano erupts. And my statement pointing out that this isn’t what the scientist in question actually said will remain censored.
But that’s OK, because I’m just a concern troll, and the headline and article are just fine. Nothing blatantly false there at all 🙂
I can’t make you do anything. I can only tell you what I think.
I don’t think you’re a bad guy. I just don’t think you are always consistent with what you consider acceptable. But that’s true of everyone, me included. We all got emotions.
Philip Schaeffer December 6, 2017 at 6:39 pm
Philip, I was going to answer that you should check with Anthony … but I see he’s done it himself. I now find that you are on permanent moderation for bad behavior … funny how you didn’t mention that. Instead, you’re trying to slide your bad behavior by me because I’m not a moderator. You figure you get a free pass with me … sorry, pal, Anthony guards the gates against sneaky creeps like you.
I also find out from Anthony’s post that you went off to complain to, of all people, Slandering Sue over at Hotwhopper. That woman is mentally ill … she spends a good chunk of her time over there slandering me and Anthony. She tells the most outrageous lies about me without turning a hair.
And you are enabling and supporting her? Man, you are one sick puppy, no wonder you are on permanent moderation and all of your posts get examined closely.
Well, enjoy this reply, it’s the last you’ll get from me. You support that bitch, you get nothing from me.
HOWEVER, and this is important … YOU ARE STILL FREE TO POST HERE IF YOU FOLLOW THE RULES. That is how far out of his way Anthony goes to make sure that people can post scientific thoughts and questions here. Me, I’d have kicked you under the bus … and then driven it over you … but then I’m just a reformed cowboy, so I suspect that would be the wrong move.
Anthony is more savvy about these things, so he lets you post. It is a measure of the quality of the man … something you obviously know nothing about.
So don’t bother whining any more about how you’ve been treated. You’ve been treated with much more respect than you deserve. However, your thoughts and ideas on scientific matters are still welcome … just don’t expect me to reply to them. You’ve burnt your bridges with me, you’re on your own.
w.
Willis said:
“but I see he’s done it himself. I now find that you are on permanent moderation for bad behavior”
So is Nick Stokes. Make of that what you will about how certain the link between bad behavior and being on permanent moderation is, and how consistently that judgement is applied.
As far as I can see I’m mostly on permanent moderation for not shutting up when Anthony declares an argument to be over.
[erroneous – Nick Stokes is NOT on permanent moderation, he has been on temporary moderation for some bouts of bad behaviour but not mow. If you don’t want to stop when a MOD or Anthony tells you to stop disrupting a thread then it is likely you will remain on permanent moderation. -MOD]
Willis said:
“I also find out from Anthony’s post that you went off to complain to, of all people, Slandering Sue over at Hotwhopper. That woman is mentally ill … she spends a good chunk of her time over there slandering me and Anthony. She tells the most outrageous lies about me without turning a hair.
And you are enabling and supporting her? Man, you are one sick puppy, no wonder you are on permanent moderation and all of your posts get examined closely.
Well, enjoy this reply, it’s the last you’ll get from me. You support that bitch, you get nothing from me.”
I have never communicated with, or had anything to do with, or talked about to anyone, whoever the hell Slandering Sue is.
Or, to put it Trump style “Nothing to do with Sue”
Except I’m telling the truth.
I can say with 95% confidence that I can hit either one of those “data” spreads in 10 +/- 14 throws of a regular competition dart from the standard pub distance.
Talk about pure numerical origami. That is supposed to be a learned statement about some scientific matter that is claimed to be extinction threatening.
By the way is there a Pamina in this fairey story ??
As I recall, Mozart’s Tamino is; well he is what he is, isn’t he ??
G
For my money Willis, Mr. Grant Foster is behaving somewhat more like Papageno.
Grant Foster, when pressed for data: “Tekkin’ the dug fer a walk, Pet.”
Honestly, I didn’t even know Tamino was still around. I haven’t heard of him or his worthless blog in any discussion of any topic of importance in quite a while…
Go after him Willis and Anthony, but don’t waste much on him. He’s a nothing.
actually Mozart’s Tamino is NOT the hero of Die Zauberfloete; the Prince is. Tamino is a scared, cowardly, bird catcher who lacks self-control.
Pretty much anyone using the term “denier” is admitting that they are engaging in political demonology, not science.
I’m a Denier. https://www.youtube.com/watch?v=Vx-t9k7epIk
Me Too!
I thought I was just a skeptic until I first heard that term used by a Nobel Laureate Professor of Microbiology to smear a Professor of Geology in a nationally televised, keynote speech. If that is how low such a senior scientist can go for ‘The Cause’ then it is tainted beyond recovery IMO.
I’m Spartacus! The original rebellious slave wasn’t much of a fan of ‘Tamino like’ organised control freakery either, I seem to remember. That would’ve been in the Roman warm period caused by all those turbo charged chariots his betters used to run around in, I presume?
Up here in Canada the term “denier” is now common fare on our taxpayer funded national broadcaster CBC. It is used freely in articles, article headlines and by so-called “news” presenters. It’s sad that they now consider meme regurgitation as journalism.
Indeed, it seems to be the whole country. In Ontario to be skeptical of the man-made global warming effects or potential effects is to be irrelevant. The job of convincing everyone is done….temperatures up, seas rising, ice melting, and increasing extreme weather…we must decarbonize society or suffer the consequences.
The voter support for the Green Energy Act (shutting down coal, refurbishing old nukes, buying into wind/solar power with costly conventional back up and then unloading the excess power to the spot market) is responsible for at least $100 billion added (and counting) to the provincial debt.
I no longer talk about it to anyone…nobody (it seems) has a clue.
Those who tried to sow doubt about the existence of “concentration camps” have buildt their case on the fact that some had been (re)buildt after the war – probably partly for propaganda – after they had been torn down for reason of hygiene. Of course, hardly any “Denier”-basher knows that.
That looks like an argument as strong as the one that alarmists have destroyed or hidden raw data and can therefore not be trusted at all.
Ah Willis, there is nothing so satisfying as a succinct and perspicacious reply. Data is so stubborn and trends are so difficult to fudge well. Enjoy your sojourn.
but willis didn’t provide
any data or calculations.
tamino always does.
sqrt(-1), 2^3, sum, pi.
And it was delicious!
There’s some math for ya.
when you have to resort to silliness……
That sure was sum pi
Silliness is all your passive-aggressive jabs deserve, really.
No, crackerse45, we don’t need to resort to silliness. We have you.
But Willis showed the calculations were on the wrong numbers. Did you not understand the point?
Doing calculations is very, very easy. It’s making sure you are using the right numbers in the first place that is hard.
He used Tamino’s own data to show that Tamino’s statement was stupid.
That is sufficient.
Pie are round, cornbread are squared.
E = Fb
If Tamino covered himself with coconut oil.
Then danced.
He would never have enough money to buy a doughnut.
Oops! I got his name wrong, Tamino.
Typo corrected … and for those not following the allusion to dancing, see my post “Munny” …
Thanks, Twobob.
w.
If Tamino covered himself with coconut oil.
Then danced.
OMG, that is a mental image that I could have done without.
“I estimate the warming rate at 10 ± 14 °F/century (95% confidence limits)”
And he calls this ‘settled’?
“And he calls this ‘settled’?”
No, he doesn’t. He says
“The estimated trend is upward, but its uncertainty is large because the time covered is so short.”
Nick,
The point is that all climate data, even the NCDC data, has far to much uncertainty, much of it swept under the rug. One of the aspects of the data that’s not as transparent as it should be is the ‘removal of bias’ that NOAA applies to the raw data. This only adds uncertainty. Homogenization also introduces additional uncertainty. The idea that these techniques reduce, rather than increase uncertainty is absurd beyond belief. All they do is add additional subjective bias. Even the idea that a linear trend represents how the climate has changed over time is an extreme bias in itself.
We have the 50% uncertainty in the sensitivity (0.8C +/- 0.4C per W/m^2) with at least as much additional uncertainty on the upper limit added by the RCP scenarios. Given that the laws of physics limit the sensitivity to about 0.3C per W/m^2 and even with all the uncertainty, the ‘consensus’ lower limit is still well above the upper limit prescribed by the physics, in what Universe is this ‘settled’?
But the quoted sentence is absolute gibberish. First, the use of the word “estimate” makes the whole statement meaningless. The trend over the limited period of time is what it is. You can attach uncertainty to it, but the uncertainty should relate to measurement error, not the length of the interval over which the trend was measured. There should be no estimating involved.
Second, whatever uncertainty exists over the issue of whether the trend, measured over a shirt interval, will continue into the future is not resolvable without the use of a functioning time machine.
Kurt,
“You can attach uncertainty to it, but the uncertainty should relate to measurement error, not the length of the interval over which the trend was measured.”
Suppose you’re starting a business, and would like to quantify whether things are improving. You look at the trend of a year’s monthly sales figures, which is all you have. The numbers jump around but the trend is up.
There is obviously uncertainty, and it isn’t due to measurement error. It’s due to the possibility that the rise might have been just the luck of the variations. That is what trend uncertainty measures.
Nick
So co2isnotevil’s question is still valid: “You call this ‘settled’ “?
If the science is settled (as we’ve all been told; no further questions from the great unwashed), why is it we still don’t appear to have the proper length of time covered?
What is the proper length of time and why do we think that “length of time” is appropriate? In fact, haven’t we been down this “proper length of time” road before? The length of the pause required to be “significant” has been increased significantly because the pause keeps outgrowing the “required length of time”…this has the distinct look of making it up on the fly.
I won’t even ask about climate sensitivity (it’s too unsettling).
“…There is obviously uncertainty, and it isn’t due to measurement error…”
Of course it’s not, because you’re talking sales, not temperature readings…
In other words, the data used is so insignificant that the conclusion is statistically unproven
The uncertainty, the error bars, are themselves jokes. Realistically, uncertainty is like Einstein’s light cones. It grows from the present moment both backwards and forwards. Yet we don’t even know what the uncertainty is for GMAT today.
“So co2isnotevil’s question is still valid: “You call this ‘settled’ “?”
No it isn’t. Who called what settled?
Nick,
Are you agreeing that the climate sensitivity claimed by the IPCC is not settled science?
It was this more than anything else that he based his estimation on.
CO2
“It was this more than anything else that he based his estimation on.”
Where do you get that from? Trend of CRN has nothing to do with climate sensitivity. You calculate std error of a trend direct from the time series data.
Nick:
“Suppose you’re starting a business, and would like to quantify whether things are improving. You look at the trend of a year’s monthly sales figures, which is all you have. The numbers jump around but the trend is up. There is obviously uncertainty . . . It’s due to the possibility that the rise might have been just the luck of the variations.”
My point is that you can’t put any kind of mathematical bounds on that kind of uncertainty. The population being sampled, and the sample from which a trend is calculated, necessarily cannot include future data. Since the population being sampled includes no future data (nor does it include any data prior to the sample for that matter) there is nothing to be gleaned from the sample outside the temporal boundaries of the sample points. The time period of the sample is completely irrelevant for trying to quantitatively assess uncertainty. That principle is the source of the “past performance is no guarantee of future success” caveat you hear on every sales pitch on future stock performance, no matter how successful the company involved, or over how long a period of time it’s been successful. (The number of samples taken from the sampled population is certainly relevant to uncertainty, but the temporal boundaries of the whole population being sampled is not).
The short and accurate answer to your presented business hypothetical is that sales improved over the one year interval, but nothing can be inferred from the sales data alone about what will occur in the future. And to be precise, your example should have assumed only a year’s worth of crude “estimates” of sales data where no one even knows for sure that sales improved at all because the business ledgers are so bad. Now on those facts, can you make any kind of logical case as to why it would matter if the sales data were measured over 1 year or 10 years? What about 100 years? If, in every one of those circumstances the estimated trend was less than the uncertainty, why would I have more confidence that things have truly improved over the 100-year hypothetical than in the 1 year hypothetical?
So Tamino’s “estimate” of “10 ± 14 °F/century (95% confidence limits)” based on a mere 12 years data is pure bluster. The “per century” metric is a joke because you can’t logically extrapolate a trend at all beyond his approximate decade of data, and his use of the word “estimate” suggests that he just made up the numbers. And since his “estimated” error is larger than his “estimated” trend, the very existence of a trend is a leap of faith.
So it’s not sellted?
Then why are we spending billions?
[Trashed. Duplicate post. -BNL]
Nick:
My point is that you can’t put any kind of mathematical bounds on that kind of uncertainty. The population being sampled, and the sample from which a trend is calculated, necessarily cannot include future data. Since the population being sampled includes no future data (nor does it include any data prior to the sample for that matter) there is nothing to be gleaned from the sample outside the temporal boundaries of the sample points. The time period of the sample is completely irrelevant for trying to quantitatively assess uncertainty. That principle is the source of the “past performance is no guarantee of future success” caveat you hear on every sales pitch on future stock performance, no matter how successful the company involved, or over how long a period of time it’s been successful. (The number of samples taken from the sampled population is certainly relevant to uncertainty, but the temporal boundaries of the whole population being sampled is not).
The short and accurate answer to your presented business hypothetical is that sales improved over the one year interval, but nothing can be inferred from the sales data alone about what will occur in the future. And to be precise, your example should have assumed only a year’s worth of crude “estimates” of sales data where no one even knows for sure that sales improved at all because the business ledgers are so bad. Now on those facts, can you make any kind of logical case as to why it would matter if the sales data were measured over 1 year or 10 years? What about 100 years? If, in every one of those circumstances the estimated trend was less than the uncertainty, why would I have more confidence that things have truly improved over the 100-year hypothetical than in the 1 year hypothetical?
So Tamino’s “estimate” of “10 ± 14 °F/century (95% confidence limits)” based on a mere 12 years data is pure bluster. The “per century” metric is a joke because you can’t logically extrapolate a trend at all beyond his approximate decade of data, and his use of the word “estimate” suggests that he just made up the numbers. And since his “estimated” error is larger than his “estimated” trend, the very existence of a trend is a leap of faith.
Speaking of dancing, here comes Nick.
Nick,
The magnitude of the estimated uncertainty seems to have arisen to be consistent with the uncertainty in the presumed sensitivity, although he never shows the work for how the uncertainty was estimated. Decreasing the uncertainty by analyzing a longer time sequence is invalid given the periodic nature of long term climate change. You need to average well over a million years of data in order for the major periodic influences to be averaged away. Clearly, confirmation bias resulted in choosing a method of calculating uncertainty that fit the narrative.
More to the point, it’s not the certainty of a short term trend that needs to be established, but the certainty that the presumed short term trend is a linear trend and not associated coincidentally with longer term periodic variability. Looking at the NCDC data, there’s no statistically significant linear trend evident. It increases up to about 1940, decrease until about 1980, increases until about 2010, flattens out and starts to decrease again. BTW, if the trend is started at 1940, it’s statistically close to being flat.
Kurt,
“the sample from which a trend is calculated, necessarily cannot include future data”
Indeed it doesn’t. What is expressed is the uncertainty of the trend to date, given variation shown during that period. It’s up to the user to decide about its applicability to the future.
“Now on those facts, can you make any kind of logical case as to why it would matter if the sales data were measured over 1 year or 10 years? What about 100 years?”
You measure over 1 year because that is the data you have. Suppose you have tried some innovation starting a year ago, and you are deciding whether to continue, or try something else. The trend would be the information you might use in that decision. It’s no use waiting 10 years for statistical significance. As often, you need to do the best you can with the information you have.
“Tamino’s “estimate” of “10 ± 14 °F/century (95% confidence limits)” based on a mere 12 years data is pure bluster”
It has exactly the same status as Willis’ estimate. He originated that idea of testing USCRN trend. Tamino just did exactly the same kind of arithmetic, to determine that the trend wasn’t statistically significant. The choice of whether to use /decade or /century units is just a choice of units, no extrapolation involved. If you say that you are running at 15 mph, that doesn’t mean that you are expecting to run 15 miles in the next hour. It is no different to saying that you are running 6.7 m/s, or 221,000 km/year.
“The choice of whether to use /decade or /century units is just a choice of units, no extrapolation involved. If you say that you are running at 15 mph, that doesn’t mean that you are expecting to run 15 miles in the next hour. It is no different to saying that you are running 6.7 m/s, or 221,000 km/year.”
You can only use /decade or /century units if the trend is exactly linear over the time unit. Consider a sine function, whose instantaneous trend follows a cosine and is far from linear. Can you extrapolate the relative linearity of a sine function between 0 and 0.1 radians to predict the behavior at 1 radian?
“Can you extrapolate the relative linearity of a sine function between 0 and 0.1 radians to predict the behavior at 1 radian?”
And would it make any difference if you had expressed that as
“Can you extrapolate the relative linearity of a sine function between 0 and 5.73 degreess to predict the behavior at 57.3 degrees?” ?
It’s just units. And the trend is just a measure that you can derive for any set of numbers. The first central moment. You’re fussing about what you might decide to do with it. That is different.
Nick,
You keep dancing around the obvious problem which is that the presumed linear trend has no predictive power over past or future behavior. And no, it wouldn’t make any difference if you used degrees or radians. Neither a change per unit radian or change per unit degree is a valid linear projection of the past or future behavior of a periodic effect.
Consider the average planet temperature change of about a +0.5 degree per month between April and June. Does this mean that the global yearly average is increasing by +6 degrees per year, +60 degrees per decade and +600 degrees per century?
co2isnotevil said:
“You can only use /decade or /century units if the trend is exactly linear over the time unit. ”
You must have real problems with the speedometer in your car.
co2isnotevil December 5, 2017 at 12:54 pm
“The choice of whether to use /decade or /century units is just a choice of units, no extrapolation involved. If you say that you are running at 15 mph, that doesn’t mean that you are expecting to run 15 miles in the next hour. It is no different to saying that you are running 6.7 m/s, or 221,000 km/year.”
You can only use /decade or /century units if the trend is exactly linear over the time unit. Consider a sine function, whose instantaneous trend follows a cosine and is far from linear. Can you extrapolate the relative linearity of a sine function between 0 and 0.1 radians to predict the behavior at 1 radian?
Really? My best time for the 400m was 46.7 sec, so my average speed was ~19mph, do you have a problem with that? My average velocity was of course 0mph.
Willis, I’ve enjoyed your posts over the years very much.
In arguing with friends and others about temperature trends I have pointed to the USCRN data as a good indicator that the Earth as a whole is not warming dramatically, considering the US comprises about 7% of Earth’s land surface area. Is this a reasonable argument?
No terrestrial data set is complete and consistent enough to establish low uncertainty trends over time periods of more than a couple of decades. Additionally, there’s far more uncertainty from data collected from many thousands of different instruments with many differing measuring methodologies. And of course, there’s the sticky point about when a linear trend should start.
Satellite data on the other hand is more consistent from an instrumental point of view, as the same instrument is measuring the entire field of view and in the case of polar satellites, the entire planet. Over the satellite record, data will have been accumulated by less than 2 dozen instruments. Unfortunately, the satellite record is no where near long enough to see the presumed increase thought to be due to CO2 emissions, much less its actual effect which is far lower.
The fact that low temperature records are still being broken planet wide is enough of an indication that the planet isn’t warming dramatically, moreover; it’s strong evidence that natural variability is still far larger than any presumed trend.
All satellite data sets show statistically significant warming since 1979. Assuming the data is accurate that’s pretty unambiguous evidence of warming. Of course, explaining the cause of this warming is a different question, but I don’t understand why you say there hasn’t been enough time to see warming due to CO2.
Bellman,
Because the natural variability swamps out the presumed change. From 1985 to the present, CO2 has risen from 345 ppm to 405 ppm or 17% of a doubling. If doubling is claimed to be 3C, 17% is only about 0.5C and well inside the year to year natural variability. Given the actual maximum sensitivity of 0.3C per W/m^2, corresponding to 1.1C per doubling, 17% is only about 0.18C and far from discernible as a linear trend.
CO2, the satellite data can have problems, too. Half of the correction from uah5.6 to uah6 was due to spurious warming over land post 2005. This was pointed out to Dr Spencer by two commenters at his blog. (Kristian and Phi) Were it not for them having alerted Spencer, he would have missed it. (who knows what other problems lurk within the satellite data that he’s unaware of)…
Yes, this is true and I’ve seen other issues with satellite data as well, but I’ve seen far more issues with terrestrial data sets.
The satellite data is intrinsically better and more likely to eventually be representative of reality while terrestrial data sets don’t have a chance.
co2isnotevil,
No it doesn’t. That’s what a statistically significant trend means. It means you can see a trend above the natural variability.
Bellman,
It’s an illusion that you think a statistically significant LINEAR trend exists in the data. That is, a trend that will continue indefinitely. At best, you might be able to say that we are on the rising edge of some periodic influence.
Year to year, the planets average temperature varies over about a 2C range and this variability is far from linear. You simply can’t discern a LINEAR 0.5C trend over 3 decades in a record with this much natural variability, much less the more likely linear trend of less than 0.2C over the same length of time.
Using the Skeptical Science Trend Calculator, UAH6 has a trend of 0.137 C / decade, with a confidence interval of 0.08. This means that UAH 6 shows temperatures rising by 0.44C since 1985, with a lower estimate of 0.18C.
So the data set showing the least amount of warming, still shows it is very likely that there has been at least as much warming as you expect from CO2.
Bellman,
But you can’t exclude the null hypothesis that we are more likely seeing the effect of being on the increasing side of a periodic influence which seems to have flattened out over the last decade or so (the last El Nino spike not withstanding).
A “statistically significant” trend has nothing to do with whether it is natural or not. The phrase merely means that within some confidence level, it is not caused by chance, i.e., it is not the result of random noise. A natural trend is not random, and can equally be the cause of a trend.
Mark T commented – “A natural trend is not random, and can equally be the cause of a trend.”
not if its trend
is not statistically
significant
co2isnotevil commented – “But you can’t exclude the null hypothesis that we are more likely seeing the effect of being on the increasing side of a periodic influence which seems to have flattened out over the last decade or so (the last El Nino spike not withstanding).”
science almost never excludes
the null hypothesis. yet you
rely on physical laws every
day when the null hypothesis
has not been disproven.
every part of the earth system
is warming – surface, lower
troposphere, ocean surface, ocean,
ice is melting, sea level is rising,
snow is melting.
with no natural causes in site.
Obeying physical laws while being consistent with past behavior IS the null hypothesis.
Whether the planet is warming or cooling (it must be doing one or the other) even the exaggerated trends you seem to accept are not inconsistent with the rate of change seen the longer term averages extracted from ice cores and the ‘consensus’ can’t explain those trends either.
evil – name me one time in
science where the
null hypothesis was
ever disproved. just one.
crackers,
Like all hypotheses, the null hypothesis can not be proven, but can only be disproved by falsification in which case, it must be modified and a new null hypothesis arises to replace it.
At one time, an Earth centric Universe was the null hypothesis because that fit casual observations within the framework of the known physics at the time, which to be sure was limited and biased by religious belief (much like CAGW). This hypothesis was clearly disproven.
The pedantic null hypothesis for the climate system is that there’s no relationship between incremental CO2 concentrations and surface temperatures. The laws of physics falsify this and the new null hypothesis becomes that there can be no relationship between CO2 concentrations and the surface temperature that violates the laws of physics. Those laws dictate a sensitivity limited to about 0.3C per W/m^2 of forcing. Feel free to try and falsify this using other laws of physics. Pointing out a trend, real or imagined, is insufficient as this doesn’t connect the magnitude of the presumed trend to CO2 emissions.
I would read the replies but that is far to many carriage return, line feeds to deal with.
Wonder if Tamino bans Crackers for “special needs” typing.
Nowhere did I suggest that the trend will continue indefinitely. We were only talking about what the current data is doing, not about forecasting beyond its range.
It does not vary by anything like 2C year to year. Even monthly figures
The statistics disagree. It is entirely possible to discern a trend as being statistically significant. This takes into account the amount of variability in the data and even corrects for autocorrelation.
If your argument is that the trend may not be linear, then that’s entirely possible, but the onus is on you to demonstrate that a non-linear fit is better. But a non-linear fit will still show a similar amount of warming.
“It does not vary by anything like 2C year year. Even monthly figures”
This is obscured by the multi-year averaging used for calculating monthly anomalies. I’m also not claiming a 2C change in 1 year is common (although that has happened), but that the single year to year differences are ordinarily about .25 to 0.5C in one direction or the other and a few year to year differences in the same direction are quite common. This is the reason why the starting points of presumed trends have such a large effect.
Any perceived trend is only linear if there are no periodic or quasi-periodic influences affecting it and the presumption is that increasing CO2 concentrations results in a linear trend. It’s not up to me to show that it is not linear, but up to you to prove that the linearity of the trend is statistically significant. This is quite different from claiming the trend itself is statistically significant.
The positive trend of a sine wave between 0 and .1 radians is statistically relevant, but far from statistically linear to the actual behavior. In other words, the trend between 0 and 0.1 radians has no predictive power relative to the expected value at 1 radian.
A non linear fit to yearly averages actually shows the current ‘trend’ to be doing down, but this is also not a linear trend.
co2isnotevil
I’m not arguing here what caused the warming, just trying to establish that warming has occurred. The null hypothesis is that there has been no change in temperature – that is no correlation between temperatures and time. All data sets show we can reject the null hypothesis and conclude that temperatures have changed with time.
If you are going to claim that a periodic change in temperature is so well accepted that it should be considered the null-hypothesis then you need to demonstrate this and explain exactly what this hypothesis would predict.
Bellman writes “If you are going to claim that a periodic change in temperature is so well accepted that it should be considered the null-hypothesis then you need to demonstrate this and explain exactly what this hypothesis would predict.”
False dichotomy. A third option exists (likely fourth, fifth etc), and that is a blend of periodic and non-periodic factors that resembles a chaotic system. It is a bit like waves out at sea; each wave has a definite cause, but many causes exist and many waves exist. Occasionally the waves converge into a huge “rogue wave” that does not seem to have a cause.
Few here deny climate change. Few here say humans have zero impact. But hardly anyone here (IMO) believes humans control climate as in having the power to stabilize it year after year for hundreds of years to come. It is an influence to be weighed with the benefits to having energy. Many humans (including me) live in relatively cold climates and quite frankly don’t particularly mind the idea of a barely perceptible (maybe) one degree rise.
Bellman,
The climate system null hypothesis most talked about is that there’s no connection between CO2 emissions and surface warming. While this has never been falsified with data, I consider it falsified by the known laws of physics. Thus, this null hypothesis needs to be modified. The next evolution would be a null hypothesis which states that there’s no connection between CO2 emissions and warming that transcends the known laws of physics. This limits the sensitivity to that of an ideal BB at 255K which is about 0.3C per W/m^2. Assuming that doubling CO2 is equivalent to 3.7 W/m^2 of incremental post albedo solar input, this works out to be an absolute upper bound for doubling CO2 of about 1.1C which falsifies the entire range of sensitivity presumed to be catastrophic by the IPCC. This version of the null hypothesis is more robust and has not been falsified with either data or theory.
As a corollary to the modified null hypothesis, if prior changes are far too large to be due to variable CO2 concentrations without violating the known laws of physics, they must be due to something else. We observe significant periodic and quasi-periodic behavior in the proxies with periods sufficient to result in the inability to distinguish between a trend due to increasing CO2 and a net trend arising from the vector sum of all possible periodic, quasi-periodic and quasi-chaotic variability around the mean. This is why linear trends, independent of the period over which they were inferred, are useless as predictors of future behavior.
co2isnotevil,
I’m not sure why using monthly anomalies should impact variance in the annual figures.
Could you say when you think there has been a 2C change in a single year in global temperatures? Looking at BEST the difference over the entire range since 1850 has only been around 1.5C. Most year on year differencies are less than 0.2C.
As I understand it you are saying that some sort of sinusoidal wave should be the null-hypothesis and require statistical evidence to falsify it. This is an odd way of defining a null-hypothesis and effectivly amounts to you saying “I can’t demonstrate that temperatures do follow a sine wave, so I’m I’m just going to claim they should and require others to prove me wrong.”
But it’s also difficult to see how anyone can falsify this null-hypothesis if you don’t speficy exactly what you mean by it. No matter how linear a trend is you can always say it’s part of a much bigger sine wave.
What non linear model are you using to get a trend that is going down? I’ve been looking at the BEST data since 1975 and a linear trend was the best fit I could find.
co2isnotevil
I think you are getting confused here. If the null-hypothesis is that there is no correlation between temperatures and CO2 then that is what you are attempting to falsify.
So when you say “this has never been falsified by data”, you are completely wrong. There is a statistically significant correlation between global temperatures and CO2.
Then you say it has been “falsified by the known laws of physics”, you are claiming that the laws of physics falsify the hypothesis that there is no connection between CO2 and warming. But somehow I don’t think that’s what you wanted to say.
You really don’t need to do that. Falsifying the null-hypothesis tells you nothing about the correctness of the alternative-hypothesis. It’s perfectly fine to say the null-hypothesis is rejected, because the is a correlation between CO2 and temperatures, but that (hypothetically) the “laws of physics” mean that the correlation is spurious or cannot be the whole answer.
I’m beginning to suspect you don’t know what a null hypothesis is.
“There is a statistically significant correlation between global temperatures and CO2. ”
No. This has definitely not been done. The only correlation is coincidental and coincidence is not statistically significant.
You simply can’t distinguish between a short term linear trend and the rising edge of a longer term periodic behavior of which many are known to exist.
All you are saying here is you don’t believe, or don’t understand, the nature of statistical significance. The whole point of saying the correlation is statistically significant is to show that it is highly unlikely that coincidence could cause that much correlation.
You’re free to argue that correlation doesn’t mean causation, but you cannot simply pretend the correlation doesn’t exist.
I clearly understand statistical significance. The issues is that the techniques used to infer statistical significance don’t account for the fact that there are poorly characterized long period influences whose short term behavior is indistinguishable from a linear trend.
What you don’t seem to understand is that the statistical significance of a warming trend is not the same as the statistical significance of the linearity of that trend as projected into the future. The consensus presumes a linear trend because they presume that CO2 is the driving influence. It’s this presumption that’s not statistically significant which leads to statistically insignificant results.
We see the presumed linearity in the models which over-estimate the future by a wide margin because the trend reproduced by the model is not a statistically significant LINEAR trend.
co2isnotevil,
You keep talking about projecting the trend into the future. But that has nothing to do with establishing a trend. I’m making no assumptions about what will happen in the future, no assumptions that CO2 is causing the warming, or that there is a linear relationship – I’m simply trying to look at the existing data and show there is a correlation.
You say that nobody has established a correlation between CO2 and temperature. If I understand you correctly, that’s because you think that a statistically significant result has to take account of unknown future trends. So my question is, what technique would you use to reject the hypothesis that there is no correlation between the two?
Bellman,
“statistically significant result has to take account of unknown future trends”
No. What I’m saying is that statistically significant results must take into account the dynamic state of all periodic, quasi-periodic and quasi-chaotic variability around the mean during the interval over which a trend is measured, most of which is currently unexplained and unquantified.
The physics can’t preclude or support the null hypothesis, but it can set bounds on the mean by quantifying the sensitivity of the surface temperature to incremental solar input. While this doesn’t falsify the null hypothesis, it reduces the possible upper bound of any potential connection from infinite to a far lower value as limited by physics. My point is that this limit is less than the lower limit of 0.4C per W/m^2 claimed by the IPCC, thus while not necessarily falsifying the null hypothesis, it does falsify the range of sensitivity presumed by the IPCC.
Johnny Terawatt commented –
“…considering the US comprises about 7% of Earth’s land surface area. Is this a reasonable argument?”
more to the point,
the us only occupies
1.9% of global
area
Do you not still censor slayers? Here’s a test.
[snip we do, because what happens with “slayers” is that they use pejoratives and it inevitably turns into a food fight, rather than a discussion. You can thank people like Doug Cotton who used multiple fake personalities to try to get their point across here, and Joe Postma, who has made some of the ugliest imaginable comments about me. We have had several discussions at WUWT over the “slayer” science in the past, and nothing came of it except shouting and name-calling. My choice is to exclude such discussions because of the history of lack of decorum, sockpuppetry, incessant thread bombing (like you tried to do here with a comment containing multiple links unrelated to this thread), and vitriol directed at me and others for taking on legitimate issues, like this one: https://wattsupwiththat.com/2013/05/27/new-wuwt-tv-segment-slaying-the-slayers-with-watts/
– Anthony Watts ]
Bloggers should do whatever they feel comfortable with. They have to live with their own blogs day in and day out. The rest of us don’t have such a burden and we really have no right to judge bloggers who do carry that burden. It’s still a free country. So bloggers, censor away! (and please don’t feel as though you owe anyone an explanation for having done so)…
afonzarelli, you’ve forgotten an underlying truth:
Just because you have the right to do something doesn’t make it right.
Selectively censoring comments in a scientific discussion is malfeasance, despite the fact that its a free country. So yes, people censoring valid scientific comments DO owe an explanation for their devious, underhanded, but as you point out perfectly legal behavior.
“So bloggers, censor away! (and please don’t feel as though you owe anyone an explanation for having done so)…”
and please don’t feel as though you deserve any respect or credibility…
Willis, there could be various reasons why a blogger might sensor. i wouldn’t rule out the possibility that some folks just can’t stomach it. (and remember it’s day after day after day) i personally don’t know how y’all do it! Certainly you and Anthony are to be praised for having fair and open comment pages. For others, that could be the difference between keeping a blog comment page open or not. Freedom of choice here. Blogs are monarchies, not democracies. Commenters have no right to expect otherwise. (and kudos to you both for living up to our best expectations anyhow)…
post script~ willis, it’s nice to see craig provide us a fine example as to why bloggers might want to delete comments (☺)…
Willis, one last thing… Anthony mentioned recently that the reason Tisdale no longer presents posts here is because of the comments page. Svalgaard echos the same sentiments when he oft says there are quality people he knows of that no longer post comments here because of the raucous nature of the comment page as well. So, sensorship can actually mean an improved comment page. Key here is that it’s a blogger’s prerogative to run his blog however he sees fit. (it ain’t nobodies’ business, but his own)…
Fonzie, thanks for your comments.
Yes, there are many reasons why blogs censor comments. Most often it is for violation of the site policy, whatever that might be, and I have no problem with that.
What I do have a problem with is a site claiming it is scientific that censors innocuous scientific comments the owner disagrees with. And the worst is when, like Tamino, they do it with no public notice. Here, if we snip a comment, we leave it and we say why it was snipped.
But Tamino and Gavin Schmidt just disappear comments they don’t like, drop them in the oubliette without any evidence that they ever existed. This allows people to get the totally incorrect impression that one side has no arguments against the brilliant logic espoused by the blog owner … and that, to me, is despicable.
Finally, you say that people don’t post here because of the rough-and-tumble nature of the comments. I doubt that. I suspect that in many, perhaps most cases, “rough and tumble” or “raucous nature” or whatever phrase they use is just code for “people might disagree with me, I’ll go back to the safety of my ivory tower”. I say this in part because many of these same people refuse to debate the issues with any skeptic anywhere anytime. There’s always a good excuse, the forum is too crude, or it is “giving deniers unwarranted attention”, or “your supporters will mock me”, but for me, it’s the same old story …
Short version? Harry S. Truman said it best. “If you can’t stand the heat, get out of the kitchen”. If you want to take to your ivory tower and not defend your ideas in the public marketplace, up to you … but don’t think that will prevent people from pointing out the faults in your ideas.
w.
“Most often it is for violation of the site policy, whatever that might be, and I have no problem with that.”
I do have a problem when site policy prohibits challenging the orthodoxy as seems to be the case with warmist blogs and why I can’t post as ‘co2isnotevil’ on any of them.
This is the only recent chart of station count I’ve made lately, and has other stuff scaled, but you can see how the ncdc data set from the Air Force drops to a very small number if stations reporting.
I find it hard to believe the weather people had vastly more records than the Air Force did.
All of the gold standards of Climate Science — USCRN, ARGO, Satellite Temp and SLR — have either been ignored, attacked, or adjusted.
And if temps aren’t rising in the U.S., and don’t pose any threat, why should Americans even care?
do you mean
why should americans
care about anything
else going in the
world?
it doesn’t affect
the us?
You understood the question the same way I understood the question. Perhaps you have an answer?
some of us care ethically about
how our actions affect the enormous
number of poor throughout the world.
and the change in our own environment
that are already here and that are
coming in this century.
crackers345 wrote: “some of us…”
Us? How many of you are in there?
“care ethically about how our actions affect the enormous number of poor throughout the world.”
There’s that plural again. For whom do you speak? Why do you speak? I doubt you care that much about the poor. But if you do, what exactly have _you_, not “us”, done about it?
crackers345 December 4, 2017 at 7:26 pm Edit
Glad to hear that, crackers. So are you going to speak out against the demonization of CO2 and the attack on fossil fuels because it raises energy prices and thus screws the poor of the world?
w.
willis, you’re not poor.
why shouldn’t you pay for clean energy?
don’t use the poor as an excuse for your own greed.
Crackers, are you saying “clean energy” requires a reduction in CO2? Because that’s just silly.
The poor eat BECAUSE of CO2, not in spite of it.
Here’s the argument I’ve posted several times in several blogs recently; see if you can poke holes in it:
“Increased atmospheric CO2 over the past 50 years, according to some studies, has caused world-wide foodstuff production to increase by 15-25% (which isn’t surprising since trees, depending on variety, are now growing from 30-70% faster for the same reason).
The math is simple: Currently, foodstuff production accounts for a seventh of the world-wide GDP of ~$70 Trillion, which would be $10 Trillion. Taking the lower estimate for increased foodstuff production (15%) of that would be $1.5 Trillion, which divided by a worldwide population of 7.5 billion (an admittedly high estimate) results in $200 per year for every man, woman and child on the Earth!
That’s the annual contribution industrial countries (those that have substantially enriched atmospheric CO2 over the past 50 years) make indirectly to developing nations. Another way of looking at it: Since at least 2/3 of the world’s population is found in developing nations, the “annual payment” to them is $1 Trillion!!
I think that’s more than enough. Indeed, all that additional food has averted massive famine and starvation. They should be grateful rather than greedy.”
And nothing about Mr. Eschenbach’s comments indicates he’s used the poor as an excuse for his own greed, crackers. In fact, if you’ve been around long enough you’ve undoubtedly seen posts on WUWT where he’s been the champion of the poor, not their oppressor.
crackers345 December 4, 2017 at 8:00 pm ‘willis, you’re not poor.’
Richer people paying more for energy doesn’t mean poor people paying less. They just pay more too and out of a smaller income. Venezuela subsidises fuel and sits on the world’s largest reserves. That may be your model but it’s a poor one.
Here is Benny Peiser telling the facts of life to rich kids at University of Cambridge, worth reading.
https://iowaclimate.org/2017/10/29/benny-peiser-what-i-told-cambridge-universitys-spoiled-green-students/
The end of the linked speech above provides an excellent summary.
‘We in Nigeria have coal but we have a power problem. Yet we’ve been blocked because it is not green. There is some hypocrisy because we have the entire western industrialization built on coal energy, that is the competitive advantage that they have been using. Now Africa wants to use coal and suddenly they are saying oh! You have to use solar and wind which are the most expensive, after polluting the environment for hundreds of years and now that. Africa wants to use coal they deny us.’
Is that really what you want to achieve – fighting African attempts to provide affordable energy to hundreds of millions of poor people? That would be the result if you took todays’ motion seriously.
No. The goal of humanists and humanitarians cannot be to deny the world’s poorest access to cheap and reliable energy. This is what today’s motion essentially demands — prioritise the green agenda and sacrifice economic growth and poverty reduction.
At its core, the motion is deeply wicked and should be rejected by everyone who takes the urgent needs of the world’s poor into consideration rather than prioritise an intolerant if well-meaning green agenda that is harming millions of people today.
“Yet we’ve been blocked because it is not green.”
How are they being blocked? Nigeria is a large sovereign nation with a lot of oil.
The statement is from Nigerian finance minister, Mrs Kemi Adeosun. You’d better ask her. I imagine the same comments apply to oil as coal but as I say ask Mrs Adeosun.
“I say ask Mrs Adeosun”
So you don’t know? She was speaking to IMF. Sounds like they wanted someone else to pay for the coal development, and they declined.
‘Sounds like’ neither of us knows.
IMF have definitely swallowed the Kool Aid though so aid for coal is not so cool.
crackers, I suspect you don’t even know any poor people. Or think you do but like a typical brainwashed progressive, you only know them from your perspective…so let’s expand your narrow horizons.
So, the poor. Which poor? Poor people in the U.S. are not like poor people in Africa, which are not like poor people in Asia, which are not like poor people in Europe.
In general, there are three categories. First World Poor, Poor, and Extremely Poor.
First World Poor: Richer than the most poor in 2nd and 3rd world countries. Live paycheck to paycheck. Very little savings. Do not own property or assets. Often have poor credit. Their lives are most affected by changes in variable expenses – gas prices and utilities expenses have massive effects on them.
Poor: Only lead decent lives because of support from government programs. Have no means to make their lives better. Can only afford food, rent and utilities because of money given to them from a government. No education, no generational push to get educated, culture and lifestyle drag them down and keep them from bettering themselves. Government pays for variable expenses but they are treated little better than serfs.
Extremely poor: No government programs. No access to food or jobs, no running water, no electricity, no means of transportation. They live hand to mouth daily and have no variable expenses because they don’t have any access to anything that would cause variable expenses.
Each of these three categories have one thing in common crackers: THEIR LIFE IS MADE BETTER BY ACCESS TO INEXPENSIVE ENERGY!!!
@Nick Stokes sounds like you answered your own question. Nigeria is being blocked from utilizing its coal by a politically motivated (read “watermelon green”) IMF that refuses to provide the funding to allow the development and use of Nigeria’s fossil fuel resources.
If I were President Trump, I would seize the opportunity to tour Africa and offer financial assistance to allow African nations to develop coal-fired electricity and raise their nations out of poverty.
crackers, you care so much about the poor that you are willing to put into place policies that end up killing them.
As always, Nick pretends that he doesn’t know the answers to the questions he asks.
Nigeria is blocked from building coal plants because the western agencies will not provide the financing needed to build such plants.
AGW, China is already doing that. And reaping the political and economic rewards from it.
So, don’t use the poor to signal your own virtue, either.
“Tamino” may have been the “hero” of “The Magic Flute” but he was a total wuss who fainted when menaced by a dragon and had to be rescued by Three Ladies. The name fits.
… and, according to the Branagh movie, he gets involved in a custody dispute and switches sides, betraying a grieving mother who commits suicide when she realizes what happened. link You could look at him as a bit of a dupe.
ValkyrIes, the rock stars of plot devices.
He was a “seeker of the truth” who accepts, without any attempts at verification, what is told to him by Papagelno, then the Queen of the night, then the child spirits, then Pamina then Zorastro.
That’s the point Tamino is making. The trend since 1975 is significant and tells us a lot about warming over that period.
The trend since 2005 is not statistically significant, but that tells us nothing – it could be negative or it could be ridiculously high.
The Earth is estimated to be 4.5 billion years old. The trend since 1975 or 2005 “tells us nothing – it could be negative or it could be ridiculously high.”.
The point Tamino is trying to make tells us nothing. it’s meaningless.
Any honest person or honest scientist would acknowledge that the Earth’s climate. and its change, are poorly understood at this point.
That makes no sense. How does the age of the earth change the statistical significance of the trend since 1975?
This has nothing to do with how well the climate is understood. It has nothing to do with what caused the warming of the past 30 years. It’s acknowledging that the last 40 years have warmed significantly.
“Bellman December 4, 2017 at 5:59 pm
It’s acknowledging that the last 40 years have warmed significantly.”
What significant warming outside of adjustments?
Patrick MJD
Every data set I can find says there’s been significant warming over the last 40 years. Are you suggesting that every single data set has been adjusted to the point of adding a spurious significant trend? Could you produce an nu-adjusted set that does not show significant warming?
Here’s a chart of averages of min and max temp measurements
Min temp follows dew point, dew point follows the ocean cycles.
It has a 97% correlation with dew point, and maybe a 30% correlation with co2.
This isn’t a science issue, it’s a political issue. We are not in any danger from co2, CS is <0.5°C, and the atm automatically compensates for any conceivable increase in co2 we could do.
Bellman asks if there is an unadjusted data set that does not show significant warming. Maybe other readers can help me here, didn’t our host (in the thick of the “adjustment” hooha) pull together all “unadjusted” sites and show no warming? I recall Mr. Stokes telling us the adjustments were overall cooling not warming-then showing charts from the sixties forward (ie, all the “cooling” adjustments were in the thirties and forties). I thought Watts’ work would end the discussion, but if Mr. Stokes can pretend not to know the IMF won’t fund coal energy, and he can pretend not to know that adjustments were necessary to kill the pause (before nature did it for them), then his backfire is strong enough to keep him going. NIck, have you considered visiting Lewandoski’s couch?
Yes, it warmed from an era that had scientists talking “ice age”, and nothing muchbhappened except it got a bit warmer.
Except for the mental health crisis of climate obsessed people, the world gas done just fine.
The pause stretched from 1998/99 to 2016 ir longer. Pretending that doesn’t count but the warming from the mid 1970s to 1998 does count (for what?) is at best disingenuous.
All if this raises the question:
What climate changes?
The world is greening. Fewer people are starving.
Yet the climate obsessed see only doom.
“The trend since 1975 is significant and tells us a lot about warming over that period.”
It’s not any more significant than the warming from 1910 to 1940, and is of the same magnitude. What does that tell us about the warming for that period and for the post 1980 period?
Actually it is.
The trend from 1910 to 1940, (HadCRUT data) is 0.127 ±0.057 °C/decade.
The trend from 1975 to 2015 is 0.171 ±0.034 °C/decade.
The last 40 years show a significantly steeper rise.
Bellman and all other AGW proponents. Please note that land uses have greatly changed since 1900. Moreover, they have changed significantly more since 1960. Most upward trends particularly in nighttime minimum temperatures can be attributed to warming caused by all the black bodies created in urban and suburban areas. Plus many weather monitoring systems have been encroached by land use development or poor site locations near heat sources. Probably more than 50% of the reported land based warming is artificial and elevated due to these causes and has nothing to do with changes in CO2 levels over time. Most properly cited rural weather monitoring locations (of which they are fewer today than ever) show no upward trend that some of you claim.
The trend from 1910 to 1940, (HadCRUT data) is 0.127 ±0.057 °C/decade.
The trend from 1975 to 2015 is 0.171 ±0.034 °C/decade.
The last 40 years show a significantly steeper rise.
Bellman, i would hardly call a 0.044C/decade (0.0044/year) a significant difference. However, I admit it is a difference. Are we to conclude the additional 0.044C/decade is the contribution from CO2?
I meant there was a statistically significant difference. Though it does represent a 3rd greater rate of warming, and over a third longer period.
No. I’m not saying anything here about attribution, I was simply pointing out that the two periods did not show the same magnitude of warming.
It is indeed sad to be labeled a deni@r by some people when wanting to openly discuss science, facts and hopefully arriving at a correct hypothesis of what is being discussed. Assuming you can even have a balanced conversation anymore with some people. I have had some fairly bad experiences recently, when even hinting at questioning the official dogma.
I hope folks here will realize that some of us can’t comment with our real names, when there are numerous nutbar Antifa’s out there wanting to do serious damage. I had a rental house trashed by low life Antifa wannabe’s because I only said the science should stand above all else in the end regarding the ongoing understanding of how our climate works and I would be happy to accept any conclusion and even change my mind if the future facts warranted. And they said I was just a capitalist property/land owner taking advantage of the poor anyway. Sad.
Earthling2, thanks for the comment. I do indeed realize that “some of us can’t comment with our real names, when there are numerous nutbar Antifa’s out there wanting to do serious damage”. It’s a never-ending issue for those of us who don’t think that there is a consensus or that CO2 is the temperature control knob for the planet.
However, I don’t believe for a minute that that applies to alarmists like crackers365 and others. I’ve never seen or heard of anything bad happening to anyone who declares that CO2 must be fought with all our strength. Instead, they get feted and patted on the head.
So I have no respect for alarmists like Tamino or crackers365 who cravenly post and attack people from behind an alias. In my book they are pitiful albeit dangerous cowards, afraid to sign their own names to their own words, and unwilling to stand behind what they’ve said.
w.
Crackers is worse he is clearly a troll, it takes effort to even type like because it’s all part of his act.
Tamino has a history of trying to compare apples with pears. Quite a while ago Tamino had a blog post where he compared modern temperatures to pre-1900 proxies that had a 100 year resolution. I posted a comment on his blog that it was like trying to compare a filtered AM radio signal with the unfiltered AM signal still containing the carrier – in other words, it is futile to reach any conclusions about supposed sudden rises in the modern era when you’re comparing proxies which by nature will not reliably show any change smaller than 100 years. My comment did not even make it into his comments, but surprise! surprise! he tried unsuccessfully to respond to the point I made in his next blog post. Sadly, one has to come to the conclusion that he is intellectually dishonest, particularly since he does not allow any disagreements in his comments section. Actually this is quite sad, because of all the pro-warming bloggers for a while he seemed to me one of the better ones who actually tried to look at things scientifically, but eventually I had to come to the conclusion that he really doesn’t what he’s talking about and is simply covering it up.
Wasn’t that the time when he tried to “prove” that the current warming was “unprecedented” by adding an artificial spike to the proxy data.
He definitely didn’t like being told how flawed his understanding of proxy data was.
LOL @ Willis and Willard.
…
Foster is correct!!!!
….
You guys need to put on your big boy pants and realize his argument holds water.
C. Paul Pierett December 4, 2017 at 5:59 pm
Gosh, am I crestfallen. You’ve destroyed every one of my scientific and logical arguments by using your brilliant new method, “science by assertion and lots of exclamation marks” …
And who is “Willard”? Not only are you hilarious, you are incoherent as well.
Go back to Tamino’s place, I’m sure people won’t laugh at you there … here, on the other hand …
w.
LMAO @ Willis, not knowing who “Willard” is.
…
(SNIPPED)
(You made an opinion, then you begin to troll in your next reply) MOD
(Snip) MOD
(Snipped the baseless waaay off topic comments. You keep this up, you will be put into permanent moderation) MOD
Thanks, Rob. Paul seems to think I should know about a name I’ve never heard Anthony use. Why on Earth would I know that? I stay away from Wiki in general, never even knew Anthony had a page.
But it seems any bogus excuse to try to portray me as ignorant is good enough for Paul.
Some people just have too much time on their hands.
w.
Willis: If the references to “Willard” above refer to what I think they refer to, it is a pretty disgusting insult.
“Willard” was a film that came out in 1971. If you read the plot line for it, you will might understand why the reference is insulting. https://en.wikipedia.org/wiki/Willard_(1971_film).
Probably not an atypical insult coming from the most clueless and ignorant of climate alarmist believers. BTW, congrats to Pierett for being snipped three times in a row. That usually doesn’t happen. Want to try for four?
Perhaps you forgot a sarc? Ever heard of William Connolley (sp?)?
Oops, forgot that Willard is Anthony’s actual first name. My apologies.
Rob Bradley December 4, 2017 at 7:22 pm Edit
Wikipedia is a good source for anything that is not even mildly controversial. For climate science, however, it is horribly biased as a result of the unending underhanded machinations of Willian Connolley. It was so bad he was asked to step down as an editor … you should get over yourself.
w.
Rob Bradley notices “Willis has yet to gain enough statue”
He has a boat; doesn’t need statue.
Most of this is just noise by the faithful loons after the trench war rubbish. You can expect this rubbish for the next few weeks.
Wikipedia can be a great source. As Willis points out, anything that is slightly controversial or has advocates on both sides can be highly suspect. But, even for things that are not controversial, there are times when I have found very poor descriptions. If you are an expert and/or educated, you can often tell when Wiki is off base. A few years back, I was looking for some extra sources on pH and buffers for my Biochemistry students and came across a poorly written, somewhat misleading wiki on this topic. Had nothing to do with climate or anything controversial. Just, not a source I would link to for my students.
For non-controversial subjects, Wiki is at best OK. It’s a decent first source that can help you locate some primary sources.
” I estimate the warming rate at 10 ± 14 °F/century (95% confidence limits)”….
…if you think that part was hysterical…..wait until the second part………
“Because the uncertainty is so large, we say that the claim the trend is upward fails to reach “statistical significance.”
“Because the uncertainty is so large, we say that the claim the trend is upward fails to reach “statistical significance.”
Sounds like he agrees with Willis.
“Sounds like he agrees with Willis”
As Willis says, he does. It was Willis’ idea to test USCRN trend for significance after 13 years. No-one was claiming that it is.
Nick, I think the point was to check the Climate Reference Network as it has the most pristine set of stations. It was not completed until 2008, so one can’t go back much further. The point is there used to be something called a “pause” and with the latest el Nino, it went away. As long as one is clear that this is a short trend and this is US only, I see nothing wrong with pointing this out. Sadly, some feel that any fact that disagrees with their “message” needs to be attacked. Since Willis did not say that the world was not warming and did not “d**y” anything, Tamino is the one who is out of line here. The team seems to like to not play fair or straight with the facts. When it is pointed out that the models are “overheated”, rather than have an admission and a meaningful discussion like scientists would do, many are mostly advocates and they trot out a graph using RCP4.5 or an older more obscure emissions pathway without admitting that, since only emissions pathways that are lower than what has actually occurred match the temperature (and only during and just after a major el Nino), in fact it is correct to say that most models are “overheated”. Sad, since there are papers by respected scientists that say just this and the IPCC admits this as well, but when arguing on a blog, people like Gavin Schmidt won’t admit this and instead obfuscate.
I estimate the future to be warmer or colder, with a 50% confidence of course.
There’s a 50% chance the weather will be the same?
The alarmists are simply ratcheting up their alarmist rhetoric as they know they are losing.
IF they had the observations on their side, they wouldn’t feel the need to resort to name calling.
Their climate hustle is in collapse. They know it.
How far do you need to extend the USCRN data, keeping the same underlying trend and the same variance before the data would achieve what is commonly understood as statistical significance (the usual test being p-value < 0.05)?
The t-value for trend generally goes as about N^(3/2), where N is number of periods. So on Tamino’s numbers, it is
13*(1.4^(2/3))=16.3 years
Willis used a Hurst model, which gives very high error bars because of persistency. But you really then need to show that there is persistency. I expect Tamino used ARMA(1,1), which also gives fairly high bars. Using the more conventional AR(1), I find that the trend is borderline significant now.
And thus, Nick Stokes – the mathematician – sells his soul as a politician.
Borderline and significant, now that is a wonderful combination! I’m hearing you Nick, I’ve got some land I’d like to sell, its swamp land but it is borderline prime! You know what I mean, its trending dry its just a little wet! But the trend is is significant, you can bet your house on it! 😉
“I’ve got some land I’d like to sell”
Why don’t you try the calculation yourself. It isn’t hard. I get 0.55+-0.31 (se). t value 1.77. Between significant and not significant, the gods have placed, as they so often do, a border region.
Scott,
Nick gave an informative response to a question and, in doing so, has added much more to the discussion than your disparaging remark.
I looked up “tamino’s” blog, thinking I might try reasoning with them. But he and his commentors are busy arguing over how evil Texans are. Spending any amount of time stressing over them is a waste of energy. They already know everything.
Makes me feel a little kinder towards Griff, Ivan and (maybe) cracker. At least they don’t spend all their time on leftard sounding boards.
Willis Eschenbach commented – “Of course, Tamino is still free to comment here, we don’t censor the views we might disagree with—that’s science.”
from what i’ve heard & read
lots of people are banned
from commenting here. no?
You have to try pretty hard, crackers. And you don’t get banned or censored for dissenting views. You’re still free to post here, aren’t you?
many have been banned here. just
google.
“lots of people are banned from commenting here. no?”
Those who use “lots” instead of “many” may not be credible.
folks with a broken
caps key, and a rogue enter
key may also not be
credible. no?
crackers, people have been banned here, but not for their scientific views. They have been banned for trolling, for abusive behavior, for breaking the blog policies … but not because they disagree with Anthony or I or anyone about the science.
For example … you’re still posting here. As are the folks who are loudly and sometimes unpleasantly disagreeing with me over at my post on thermodynamics. You have to go seriously off the rails to get banned around here.
w.
Yes, disagreement is fine by me. But it does take a lot to get banned, for example, I tolerated David Appell’s abusive comments for years, until he brought my deceased mother into the conversation, saying essentially that “Watts is such a denier, he denies the existence of his own mother”.
That was it for me. That’s an “he can go eff himself” moment, I’m not required to accept abuse over disagreements.
Anthony, you keep lying about that.
Of course, I had no idea your mother died. I merely made a joke about your claims, and you took that and applied it to your dead mother to try to score points and pretended I intended that for her specifically.
That was not just a lie, but a very despicable thing to do.
PS: Thanks for admitting you ban people here. Willis, take note and admit the truth.
AWatts is an effing hypocrite:
https://wattsupwiththat.com/2015/12/15/the-most-eye-opening-thing-ive-seen-while-at-agu15-so-far-muslimcarolers/
BTW, I offered to shake hands with you. It was by no means a reciprocal gesture, like you tried to pretend.
And David Appell just admitted he’s been trolling here as “Crackers345” while lecturing me on ethics and hypocrisy.
Such integrity with this one.
Readers can decide for themselves, from my viewpoint, David Appell was abusive:
https://wattsupwiththat.com/2011/07/24/david-appell-denies-he-has-any-class/
Notice when crackers wants to make an actual point and be sensible he can actually type without the I am a CR/LF special needs typing victim.
One of the key differences between WUWT and other blogs is that by the time someone is banned, 97% of the readers wish that person had been banned weeks ago.
Your welcome is well worn out.
(I was about to send Anthony e-mail asking him to have Crackers be put on permanent Moderation,and about a couple others who are full trolls) MOD
In reply to a post in which Willis notes that people have been banned, David Appell implies that Willis doesn’t believe that people have been banned here.
Truely pathetic, even for a banned troll.
Crackers doesn’t really add any quality debate to the general discussion. I would definitely ban him now that he brazenly says that he is David A who insults you and your deceased Mother. There are a few who are so annoying, and even some on this side who constantly break rules and shout in all caps, that they should be on Moderation ensuring they follow the rules. I find when it gets really stupid or rude, I just close the browser and come back in a few days. It gets aggravating, especially sometimes dreaming in the middle in the night about all this madness and ranting, these voices still bouncing around inside one’s head. Most folks are excellent here, but there are a few that I would be glad to see go elsewhere or just banned. Wouldn’t hurt my feelings, and I know you would double the readership here, because the people I have told about WUWT always say…Why do a few people get to run amok?
I only wish there were scientifically qualified warmists contributing to the discussion. Unfortunately, the warmists who contribute to the discussions in this blog don’t have the scientific chops to adequately defend their positions or to attack skeptical positions. But then gain, it’s hard to defend the indefensible or attack the indisputable.
“(I was about to send Anthony e-mail asking him to have Crackers be put on permanent Moderation,and about a couple others who are full trolls) MOD”
Nothing I’ve seen crackers say that could be construed as trolling and the same goes for my self and several others. (Show me one example.)
Wiki: starting quarrels or upsetting people, by posting inflammatory, extraneous, or off-topic messages in an online community.
Disagreeing with bunkum is not trolling. Clowns and parrots claiming bunkum, like there has been no anthropcentric warming, are the “full trolls”.
IPCC: “It is extremely likely that human influence has been the dominant cause of observed warming since 1950, with the level of confidence having increased since the fourth report.”
If they become inflamed by the truth and become abusive – and they do – then that just makes a mockery of the moderation.
(You have no idea what goes on here as I and the other Mods do,Two people got caught with multiple accounts,Crackers being one of them a rules violation and were banned,you need to let this go) MOD
Anthony,
cracker345 insists that you censor comments and, to prove it, he reveals himself as Dave Appelle, a person who has previously been banned. He then follows by calling you a liar. Why you haven’t banned him again is a mystery to me.
I will add that it is apparent that he is obsessed with you; there is no other explanation for his behavior except that you are living rent free in his head.
(He has done this in other places too, been banned at least 2 other places that I know of, only place I see him post with his real name is at Roy Spenser blog) MOD
Tony,
”Disagreeing with bunkum is not trolling. Clowns and parrots claiming bunkum, like there has been no anthropcentric warming, are the “full trolls”.
Your definition of trolling is pretty subjective.
Clowns and parrots claiming bunkum, like there has been
noanthropocentric warming, are the “full trolls”Enough said.
willis e commented – “Facts are stubborn things, and I know Tamino doesn’t like it, but the facts are that the best data we have say there is no significant warming since 2005.”
it’d be convincing if you calculated trends
and their error bars, with & without
including the corrections for
autocorrelations, as tamino does.
Except Tamino keeps getting caught fibbing faith.
crackers, you obviously think I care if you are “convinced”. My experience with you is that getting hit over the head with a clue-by-four is far from enough to convince you …
So you are not convinced.
So what?
If you hadn’t ruined your reputation, your objections might have weight. As it is …
w.
willis, instead of insulting
me, how about providing the
numbers to back up your
claims?
Crackers, did you read this section in the post?
“Here’s a protip for Tamino. If you want to compare trends, you need to compare them over the same time span. I’d do that for the NCDC data that Tamino used, as I suspect that there is no significant trend in that as well … but then like far too many folks masquerading as scientists, he didn’t post a link to his data as used.”
Can you do better Crackers and do the job YOURSELF too?
willis provided no numbers at all,
let alone trends and their
uncertainties.
those are what matter to
some of us who are truly
interested in the science
crackers345 writes “some of us who are truly interested in the science”
Note emphasis on THE science. I am interested in science, you are interested in THE science, rather like the gospel. That is one of the virtue signals.
Repeating for blind Crackers,
“Here’s a protip for Tamino. If you want to compare trends, you need to compare them over the same time span. I’d do that for the NCDC data that Tamino used, as I suspect that there is no significant trend in that as well … but then like far too many folks masquerading as scientists, he didn’t post a link to his data as used.”
crackers345 December 4, 2017 at 7:28 pm
Crackers, I’m not insulting you. I’m describing you. You have burned your bridges with me through your incessant attacks. You think I should do something because you ask me? I wouldn’t urinate on you if you were on fire.
No, I take it back, that’s unnecessarily harsh, my apologies. The truth is, I would indeed urinate on you if you were on fire.
Other than that? Do the calculations yourself, if they are so important to you, and report back with your findings. I’ve given you a link to the data, make yourself useful instead of endlessly carping about how you don’t like things.
Sheesh … some people think I’m their dang punching bag, that they can say anything they want about me and then ask me to do something for them. Not happening.
w.
crackers345 on December 4, 2017 at 7:36 pm
willis provided no numbers at all,
let alone trends and their
uncertainties.
those are what matter to
some of us who are truly
interested in the science
I have never seen you post any science at all. What I have seen is you telling others they are wrong. Nothing else. Your posts here are just more of the same.
crackers345 on December 4, 2017 at 7:36 pm
Not only that, but what crackers said is a damn lie. Here’s what I’d said about the USCRN
“Provided no numbers at all”? LEARN TO READ, CRACKERS!
w.
Willis forgot to post this:
“To ignore what he has been told so often, what he has himself acknowledged, and continue to both write and host posts exploiting readers’ ignorance by flouting useless, meaningless “trend” estimates, he has stepped far, far beyond simple ignorance. As far as I can see, there are only two possibilities. 1) He is deliberately misleading his readers. 2) He is culpably and willfully ignorant.
I don’t blame people for ignorance. I do blame them for repeatedly ignoring the truth after it has been pointed out so many times.
My opinion: Anthony Watts has gone beyond “skepticism” to “denial.” That’s why I call him a climate denier. Eschenbach too; he actually uses the phrase, “Many people, including scientists who should know better …” Willis, you should know better.”
[Ummm, you forgot to post your history of sockpupptrey:
You’ve gone by several fake identities and made to order email addresses to comment here. A few examples:
Pippen Kool
trafamadore
ReallySkeptical
That’s sockpuppeting, especially when you shape shift in the same day on the same thread (I have examples). I’know who you are out there in Kalamazoo, shall I post that information for all to see?
In the meantime – after a history of 833 comments under different names since September 2013, you are banned. See it really DOES take a lot, but this seemed like the right time -Anthony]
RS: Thanks so much for giving us your opinion, and for proving you are a fool instead of keeping silent and leaving us wondering. And thanks to crackers for revealing his Appelness, I knew the (hit enter button every ten syllables) typing thing was to cover identity.
ReallySkeptical December 4, 2017 at 7:45 pm
Dear heavens, medico cura te ipsum …
And no, I didn’t “forget” to post Tamino’s personal ad hominem attack. I have no interest in repeating lies and slander.
w.
Tamino is right: Of course Watts is a denier. So is Willis.
This will be their legacy, all for a few dollars in return. Their name will be dogshit forever.
I still think AWatts will apologize for his denialism and demonic work before he dies. Who wouldn’t?
http://davidappell.blogspot.com/2014/04/anthony-watts-admits-to-taking-money.html
now, appropriate for
the trump era, watch
the lies, insults and censorship take place here.
AWatts is afraid of the truth. He’s afraid his readers might see the opposing side. Hi$ job is to create an alternative world where all science is wrong. And this from a college dropout. What a joke.
“AWatts is afraid of the truth. He’s afraid his readers might see the opposing side.”
LOL! Riiiiight, that’s why I have a link to Tamino’s blog on my link sidebar and I regularly provide press releases in entirety from the opposing side.
David Appell at his finest agitated reasoning is on display tonight. Such entertainment.
crackers/Appell seems to be using a text on formal fallacies as a guide to his commentary.
Who wouldn’t be banned for that kind of drivel? Perhaps Mr. Appell you should drop it and go back to working on your triple chin.
Oh, I love the irony, when the biter gets bit.
crackers345, who actually appears to be “crackers” 24/7, turns out to be David Appell lying about who he is … not only that, but in his fake persona of crackers he actually cites himself as though he were an independent authority agreeing with crackers.
I said before that there was no depth of dishonesty that crackers wouldn’t plumb … didn’t know how right I was.
Appell, go crawl back into your hole. This kind of deception is despicable. To engage in such reprehensible actions, you must be absolutely desperate watching your CO2 fantasies fall apart …
Good. Couldn’t happen to a more fitting person.
w.
My what an ugly mouth you have David,who has a PHD in his back pocket but writes like an immature juvenile,who can’t even bring up a rudimentary level of debate onto the board.
I remember you having a meltdown when I among a couple others, got under your skin that Tony Heller made a post showing you babbling like a kid going into a fetal ball.
You left soon after that sparing the rest of that blog of your immature behavior.
”not only that, but in his fake persona of crackers he actually cites himself as though he were an independent authority agreeing with crackers.”
Wow, that is truly pathetic.
SO Appell got tired of stalking children (Suyts Blog has the details) and started stalking dead people?
What a waste of carbon.
crackers345 December 4, 2017 at 7:48 pm
crackers, I never said that nobody was banned here. That’s just more of your endless BS. I said they were not banned for disagreeing about the science. Take note and tell the truth, indeed.
“crackers, I never said that nobody was banned here. That’s just more of your endless BS. I said they were not banned for disagreeing about the science.”
I was wondering if Crackers misread the post he was responding to, or if he was intentionally trying to mislead. Actually, I think I’ve wondered that about every one of Crackers’ comments.
Cognitive dissonance.
Doesn’t cognitive dissonance assume the ability to cogitate in the first place?
crackers345 December 4, 2017 at 7:56 pm
Man, your lies just don’t stop. I am not doing this for the money, that’s just your sick fantasy. I got an honorarium once for speaking at a conference, and that’s it.
There is no depth of deception that you won’t plumb, is there?
Ah, well, keep it up. You’re obviously trying to get yourself banned for your endless nastiness and ad hominem arguments. And who knows, you might be successful.
And then you can whine to all your friends about what a terrible place WUWT is, and tell lies about why you got banned … it’s a win-win for you.
w.
Why would you not make money from honest hard work?
squiggy9000 asks: “Why would you not make money from honest hard work?”
The easy answer is that a person did not ask for money, but just engaged in honest hard work as a volunteer.
I just meant there is nothing wrong with compensation for labor.
“And then you can whine to all your friends about what a terrible place WUWT is..”
Maybe he’ll be whining to an empty room.
It’s clear Appell decided the crackers avatar is spent, so it’s going out with a flourish of silly vituperation, sound and fury signifying… that he’ll need a new avatar soon. ‘Cause he seems to enjoy the “concern troll” persona. “Some of us who care for the poor” indeed!
Man, the sockpuppets have been triggered tonight.
You have no idea.
yeah I think we do, the trench warfare loons are out barking at the moon tonight.
Maybe it is the ‘supermoon’, lol.
Willis (and others)
There seem to be three basic propositions that one could ‘deny’ in the overall climate debate, and the alarmists seem to have adopted a deliberate strategy of confounding the three. From mildest to most extreme, I would categorize them as:
1. The average temperature of the earth, as far as we can tell, seems to have warmed about 1 degree C over the past 125 years, with increased levels of CO2 at least partly responsible.
(My observation: Most alarmists and skeptics agree on this rather humdrum and not at all exciting conclusion; many of those who accuse folks of being ‘deniers’ trot this one out to use as a straw man in claiming that skeptics are fools.)
2. Global temperature increases are accelerating due to the the amount of CO2 in the atmosphere, and we will see an additional 2-4 degrees C tempterature rise over the next 80+ years. This temperature rise will cause dangerous increases in sea levels, strong storms, and prevalence of tropical diseases.
(My observation: Most of the scholarly debate inside both the alarmist and skeptical communities relate to these set of propositions. It is in evaluating the future prognostications that the hockey stick and ‘warmest temperatures since…’ memes come from. Declining station coverage, questionable bias adjustments, and valid/invalid proxies all are important parts of these debates.)
3. Increasing CO2 emissions, especially under BAU scenarios, will cause the earth’s climate to spiral out of control, perhaps making the planet unliveable for humankind. Melting of the Antarctic and Greenland ice masses, failing of the thermohaline circulation, and boiling oceans are some of the imagined consequences of these doomsday predictions.
(My observations: Among the alarmist crowd, only the committed crackpots like Al Gore and Bill Nye seem to talk about this regularly, although James Hansen has been in this camp from time to time. Unfortunately, these are the scenarios that seem to be believed by a lot of journalists, members of Congress, and more than a few entertainers. Furthermore, although folks like Tamino, Gavin Schmidt, and Michael Mann would probably not be caught dead spinning this kind of tripe, they seem more than willing to let others do it.)
So, you can put me down as a denier of proposition #3, a skeptic about proposition #2, and a believer in proposition #1. I guess that makes me……??
Good name.
point number one is reasonable.
points 2 and 3 are utter nonsense unsupported by either real world science or history.
I see now why David Appell, aka crackers 345, is not thought of well here. He is a good example of a bad example. His mean-spiritedness exemplifies the attitude of the CAGW “believers” while he/they ignore actual science an its uncertainties. I’m much happier being called a “skeptic” than being called what he and his ilk are: “pathetic”.
I didn’t think crackers was Appell. I always considered Appell a knowledgeable jerk. Crackers345 seems to be just a jerk with too much time. Pity.
That may be the funniest thing I read all day!
“I see now why David Appell, aka crackers 345, is not thought of well here. He is a good example of a bad example. His mean-spiritedness ”
Yeah, Appell is the reason I don’t partake in Roy Spencer’s blog. Who wants to put up with Appell’s kind of BS constantly. Now he is over here starting trouble.
http://images.remss.com/figures/climate/RSS_Model_TS_compare_trop30v4.png
Tropical (30S to 30N) Mean TLT Anomaly plotted as a function of time. The black line is the time series for the RSS V4.0 MSU/AMSU atmosperhic temperature dataset. The yellow band is the 5% to 95% range of output from CMIP-5 climate simulations. The mean value of each time series average from 1979-1984 is set to zero so the changes over time can be more easily seen. Again, after 1998, the observations are likely to be on the low side of the simulated values, indicating that the simulations as a whole are predicting more warming than has been observed by the satellites.
http://images.remss.com/data/msu/graphics/TLS/plots/RSS_TS_channel_TLS_Global_Land_And_Sea_v03_3.png
Global (80S to 80N) Mean TLS Anomaly plotted as a function of time.
Nocooling for over 20 years
But there is at the C10 level and above.
http://images.remss.com/msu/msu_time_series.html
Tho not for 20 years admittedly.
“Again, after 1998, the observations are likely to be on the low side of the simulated values, indicating that the simulations as a whole are predicting more warming than has been observed by the satellites.”
I would suggest that all stat temp products after ’98 are suspect due the disconnect at the change over from the previous MSU sensor to the AMSU onboard NOAA-15 …..
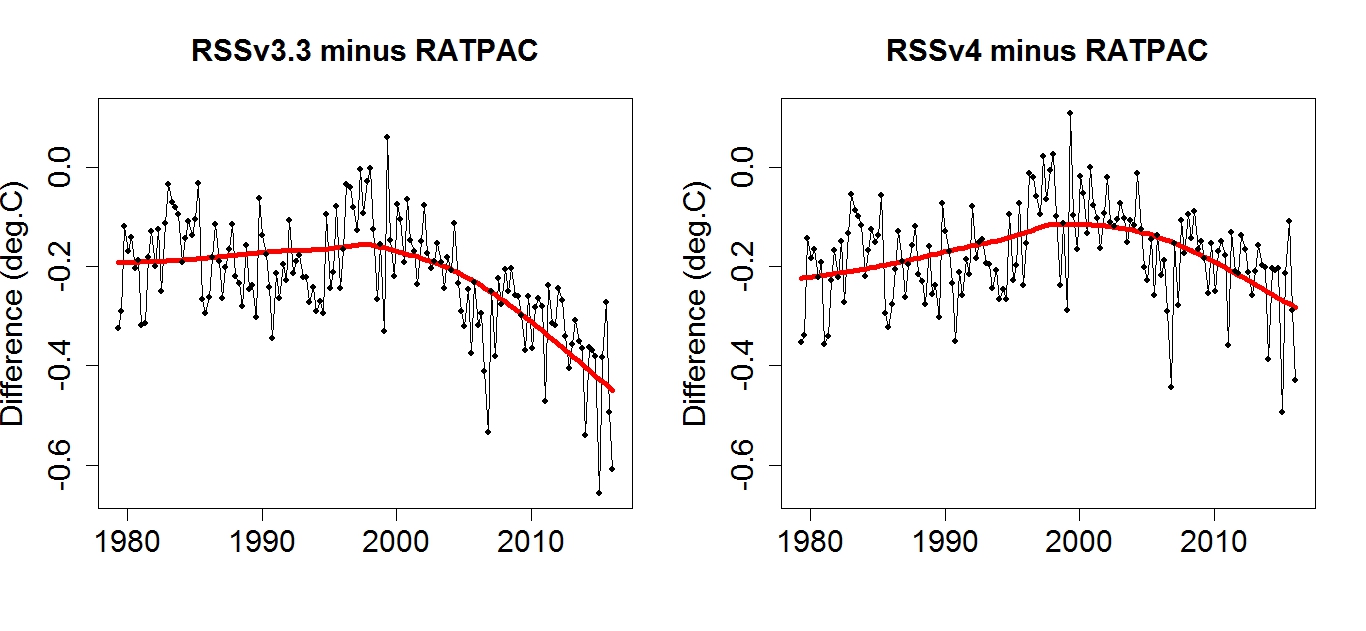
Nonsense, it’s replicated in the surface data as long as they actually use measurements, and don’t make up data.
It’s just what temps are following the distribution of water vapor over land, and the ocean cycles alters that.
“Nonsense, it’s replicated in the surface data as long as they actually use measurements, and don’t make up data.”
What? – the fact that radiosonde data diverge form a single instrument when that SINGLE instrument is replaced, is “replicated” on the surface?
Bizarre comment micro.
“It’s just what temps are following the distribution of water vapor over land, and the ocean cycles alters that.”
As I’ve told you several times (just basic meteorology).
You have it backwards.
WV follows temperature my friend.
And what you show is proof of the GHE of H2O.
Of course, what you don’t seem to understand is it adjusts how much GHE is emitted to control how cool it gets late in the morning while still dark. And no, you have it backwards, but it is meteorological, you guys just aren’t used to designing and simulating regulating circuits, and failed to recognize that nonlinear conductance (in this case temps from the surface to space) when controlled by a different parameter (the effect is tied to temperature with high RH) is how you design a regulator. you can verify by seeing if the output follows the control signal.
Which it does.
It also explains the wide range of Min T across the planet, varies appropriately with water vapor,as that is the stored energy source, and in fact that’s another requirement for a good regulator, a place to store energy to use to regulate. For regulators, that’s a capacitor. And in some ways, temps work like a switching power supply, a single pulse of energy comes in, some powers the load(geothermal), some goes into storage(water vapor), when the input pulse drops, energy from the capacitors supply the load, if the RC constants are sized to the load, you’d see a steady supply output. In the planets case, the energy is supplied only when air temps near dew point, then condensing water vapor, releasing the heat of evaporation as sensible heat slows cooling of the surface, that’s your GHG Effect, the only one that matters because that’s the only one that’s non-linear. But since you don’t know that is how a transistor works, this all means nothing to you. And why you never figured this out and I did.
Believe it or not, this will become part of the science of our planets climatology, and is why we do not have to be concerned for increases in Co2, or the stupid temperature series that don’t matter, that we’ve argued about for 20 years.
And I don’t know what the radiosonde results have to do with changing a surface station, when comparing data for the entire surface station record set.
“Of course, what you don’t seem to understand is it adjusts how much GHE is emitted to control how cool it gets late in the morning while still dark.”
Err, YES.
Why do you think that is news to me or any meteorologist??
I’ve seen/measured it more times than you’ve hot dinners.
But the ALL OF the surface of the planet does not have it’s emission to space regulated in such a way. Irrelevant anyway as there is quite a few miles above the surface in which non-condensing GHG’s also “regulate” emission to space.
Look up the Beer-Lambert Law re reference to path-length.
Surface inversions trapping WV/H2O still radiate to space above …. they can (almost) just as efficiantly as the surface as there is little temp drop over such a distance. At ~ 8km where the effective radiating surface of Earth lies, efficiency is very much reduced however, with the ave temp there 270K.
That, along with the drier zones of the planet and aloft is why CO2 does what it does.
“And no, you have it backwards, but it is meteorological, you guys just aren’t used to designing and simulating regulating circuits”
Circuits have nothing to do with it – meteorology and radiative physics very much does however.
> I pointed out a fact, which is that the US has not shown any statistically significant warming since the USHCN started.
Typo? I think you mean since USCRN started?
Tru dat … I’ll change it. Thanks. I hate typos.
w.
Tamino’s Open Mind (Already Made Up)
The snide remark is that his mind is so open his brains fell out.
The important things about CRN is this.
1. CRN represents the golden standard in stations. Triple redundant, high temporal resolution,
documented siting that comports with the LeRoy standard.
From this we can test certain things.
A. If CRN is the gold standard and other stations are “corrupt”, then we can expect a trend difference between them. We check this. Other stations do not differ from CRN. If anything they have to be adjusted
UP to match it.
B. There is a concern that adjustment codes will corrupt good stations. For example, people commonly
believe that if you have 1 good CRN station and 10 bad stations surounding it that the bad
stations will force a change in CRN stations. This is false.
C) There is a common belief that most stations are not like CRN stations in their siting. This comes from
incomplete census of other stations, like just checking USHCN. We can ( I have ) characterize
the CRN stations using metadata. We can examine
1. the distance to the nearest airport
2. the surounding population
3. The land class — urban, trees, feild etc
4. the impervious area. the amount of land that is paved. We are able to do this down to a 30
meter resolution and in the near future to a 5 meter resolution.
5. the distance from any body of water
6. the amount of water surface nearby.
7. In the near future we will be able to count the buildings in the area automatically
This allows us to build a filter. The Filter is constructed by summing the features of a CRN station.
population less than x, y km from an airport, z% imperivous surface within a radius of r,
etc etc.
Once you have a filter you can Score all the other stations in the US and the world and see
how many match the siting criteria.
You would be amazed how many sites match the CRN criteria.
The last thing you can do is check this AUTOMATED process against the answers you get if you
send people to do the job of site survey
This gives you an accuarcy measure for your automated classification.
As the years go on the answer will not change. year in and year out the CRN stations will match
the so called ‘bad” stations. Year in and year out folks will compare and see that the adjustments
are correct.
And CRN will spread out to other countries.
When We first “discovered” this network years ago ( almost 10) we had a theory. After a few years
CRN would show us how bad the bad stations were.
well its been 10 years.. and the answer is…
The “non crn’ network is pretty good. Better if you adjust it.
Mosh, I fear I’m done with you until you answer the question I’ve asked over and over regarding the BEST “scalpel” algorithm. The issue, as you well know since I’ve asked so many times, is this:
Suppose we have a station in the middle of town. The town is growing, and the UHI is causing the temperature to rise.
So they move the station to the outskirts, which are cooler. However, the town grows up around it, leading once again to a spurious rise.
So they move it to the nearby airport … but prop planes are replaced with jets, and the runways are extended, and the suburbs grow up around it …
Assuming that the temperature overall is stable, neither warming nor cooling, this gives a trendless saw-toothed wave, with a temperature drop at each move.
BUT the “scalpel” method cuts that record into three records. Then it reassembles them into a single record. Presto! The “scalpel” method just converted a trendless record into a clear trend.
Now, I’ve asked both you and Zeke Hausfather about this time after time. You used to tell me that yes, you’d checked that and it wasn’t a problem. Fine, I said, provide me with the test methodology and the results … crickets.
So I asked again … and again … at which point you’ve given up answering me altogether. I even asked in a comment on your blog, and I’ll be hornswoggled if you didn’t censor my comment without any indication that it ever existed!
Really? Foolish me, I was astounded that you would sink that low.
As you might imagine, therefore, at this point I don’t believe a damn word that comes out of your mouth. So you’re free to talk to the hand, because my head is not listening. And when you say above that
I just laugh. Why would anyone believe you at this point? I used to believe you when you said things like that, but hard reality has stripped away both my illusions and your façade of honesty.
I’m still awaiting your answer. In the meantime, feel free to impress the rubes with your unsupported, uncited, unverified claims. I don’t believe a word of them.
w.
PS—It is worth noting that I was an early supporter of the “scalpel” method until someone pointed out the sawtooth wave problem. I thought “Mosh and Zeke must have considered this” … and the whole farrago began with that innocent inquiry.
Tamino who?
“Look, folks, that is comparing apples to oranges.”
No, Willis, I think it’s more like comparing appells to crackers.
co2isnotevil December 4, 2017 at 11:37 pm
I’m sorry, but that’s not true. The laws of physics say that increasing CO2 will cause an increase in atmospheric absorption. And we have verified this both in the lab and by real-world measurements.
But whether that in turn causes a surface temperature change is NOT either falsified or confirmed by the laws of physics.
Let me give you an example of why that is true.
Suppose that I want to find out about how temperature affects solids. I take a 75 kg block of steel, and I put the bottom end of it in a bucket of hot water. I duct tape a thermometer to the top end in the best experimental fashion, and I start recording how the temperature change with time. At first, nothing happens. So I wait. And soon, the temperature of the other end of the block of steel starts rising. Hey, laws of physics, right?
To verify my results, I repeat the experiment with a block of copper. I get the same result, the end of the block that’s not in the hot water soon begins to warm up. I try it with a block of glass, same thing. My tentative conclusion is that the laws of physics say that if you heat one end of a solid, the other end will eventually heat up as well.
So I look around for a final test. Not seeing anything obvious, I have a flash of insight. I weigh about 75 kg. So I sit with my feet in the bucket of hot water, put the thermometer in my mouth, and wait for my head to heat up. Here’s the experimental setup:
After all, the laws of physics are my guideline, I know what’s going to happen, I just have to wait.
And wait … and wait …
I’m sure you can see the problem. Simple physics is simply inadequate for complex systems, and the climate is one of the more complex systems we’ve ever tried to understand. Your claim ignores the thermoregulatory systems of the climate.
For example. Albedo in the tropics is highly correlated with temperature. When the tropics is hotter, clouds form earlier. If the tropical cumulus cloud field forms on average fifteen minutes earlier, that will reduce the solar forcing by an amount equal to a doubling of CO2.
So no, the “laws of physics” do NOT say that incremental CO2 increases perforce must warm the surface as you claim.
Best regards,
w.
Agreed, Willis. Still nothing more than an ASSUMPTION that CO2 level drives the earth’s temperature, with NO empirical evidence in support, and plenty to counter it. They always conveniently forget that key portion of their pet hypothesis…”ALL OTHER THINGS HELD EQUAL,” OR – even WORSE, assume the feedbacks are POSITIVE, again with NO evidence to support this and plenty to counter it.
Willis,
But if you stick your feet in a tub of molten iron, the aforementioned laws of physics start to work again. If you put the feet of a corpse in the tub of cold water and die, again the laws of physics start to work.
In the case of a living person, there’s an active control system that maintains a constant internal temperature over a very wide range of external temperatures, the internal, implicit source of power being glucose. The planet has no such active control system, otherwise we would not experience much difference between summer and winter. The planet only exhibits dampening which slows down the response to change, none the less, the average response to average stimulus still must obey the macroscopic laws of physics.
The physics that supports the idea that power absorbed by the atmosphere in turn affects the surface temperature is COE, where in the steady state, the power being absorbed by the atmosphere is equal to the power being emitted by it which emits power both into space and back to the surface. Measurements show that the average distribution of power emitted into space and power returned to the surface is independent of everything, except geometry, and on average is split 50/50, thus some fraction of what the atmosphere incrementally absorbs must be returned the the surface, thus increasing the surface temperature until that much more is being emitted by it.
Oh yes it does!
Warm water and water vapor are both thermal energy storage, the equal of an electronic capacitor. And the that average matches because it self regulates, stop looking at 24hr averages, and start looking at what’s happening.
That is exactly what this shows, and why I have been showing it for a year now.
Look at how net radiation drops off with rel humidity, and the temp difference between the surface air temp and zenith temps are still relatively the same as when it’s cooling at 3-4F/hr.
micro6500,
The climate system is not an active system. The distinction between an active and passive system is active gain. Active gain is powered gain where more power comes out of the amplifier than goes in and the additional output power comes from an implicit power supply. This is what Bode means by the requirement for an implicit power supply powering the gain that he spells out in the first paragraph of his book.
More to the point, this implicit power supply can not be the same as the signal input (forcing). In other words the Sun is not an implicit power supply, but the forcing input to the system.
Temperature dependencies are not properly modelled as feedback controlling an active system and the fact that climate science subverted Bode to model the climate this way is why it’s so broken. The reason is that this is the only thing that provides any theoretical plausibility for the absurdly high sensitivity claimed by the IPCC and is why warmists are so resistant to accepting that Bode doesn’t apply to the climate.
Yes, the planet stores energy in a way similar to the way an RC circuit stores energy, but resistors, capacitors, inductors and delay elements are all passive components. To make an active system, you need to add a powered amplifier and nothing exhibiting this property exists anywhere in the climate system.
Consider a thermistor. This is a highly temperature dependent resistor, but still a passive component. Consider a voltage variable capacitor. This is also a passive component.
Here’s a little snippet of C code that shows how a delay element can make the surface warmer than the Sun can do on its own. The time step is representative of the average delay. Note that delay is not the same as feedback.
#include
int main()
{
double Pin = 240; // forcing power entering the system
double Pdelay = 0.0; // power being absorbed and delayed by the atmosphere
double Psurf = 0.0; // power arriving and emitted by the surface
double Pout = 0.0; // power leaving the system
double A = 0.75; // fraction of Psurf absorbed by the atmosphere
double F = 0.5; // fraction of Pdelay that’s returned to the surface
int i; // time step equal to the average delay
for (i = 0; i < 20; i++) {
Pout = Psurf*(1.0-A) + (1-F)*Pdelay;
Psurf = Pin + F*Pdelay;
Pdelay = Psurf*A;
printf("Pin = %g, Pout = %g, Psurf = %g\n", Pin, Pout, Psurf);
}
}
No, you’re wrong, you need a nonlinear function.
Consider the sun’s daily impulse of energy as the same as a half wave bridge supplying power to a switching regulation.
And there is the required nonlinear function.
Non-linearity is irrelevant to the distinction between active and passive. For example, you can put a chunk of ferrite in a wave guide and the combination is still a passive, albeit non linear, device. Ordinary diodes are not active components either. Active devices are transistors (current gain), tubes and fets (voltage gain) and even tunnel diodes that manifest gain by incremental negative resistance. Note that active devices used for Bode amplifiers are operated in the linear region of their transfer function and that class C amplifiers and logic switches that are non linear can not be modelled with Bode’s analysis.
I’ll also note I spent 3 years doing semiconductor failure analysis, and was a electronics design tool and simulation SME for 14 years.
micro6500,
I know your background which is why I’m using EE terms that I hope will resonate with you. Before I went dot com, I also spent a considerable amount of time in the semiconductor industry designing and directing the design of GPU’s, CPU’s and SW tools to accelerate chip design including logic simulation (before Verilog) a static timing analyser (before Pathmill), logic synthesis (before Synopsys) and design rule independent transistor level layout synthesis and optimization (nothing has come close since).
Then go look at how a switching power supply works. Pulse of charge goes into storage, storage and pluse supplies load
Transformers, diodes and capacitors are passive devices. A non regulated supply, switching or otherwise, is not properly an active system. It becomes an active system when an amplifier amplifies the difference between the required output voltage and the actual output voltage and uses this difference to vary the pulse width of the signal sent to the transformer, thus varying the output voltage until it matches the requirement.
No, active has a switching element. There is a switching element, basically you can’t use linear trends for cooling, it’s wrong, and because it is a temp switch it acts as a proper regulator.
And the surface data set confirms the correlation. Which doesn’t exist between either absolute or relative humidity
https://www.researchgate.net/publication/253127549_What_determines_the_nocturnal_cooling_timescale_at_2_m
And then at night just storage maintains voltage, or in this case temp. And you can see it here.

Look starting at about 17:00, that’s when the sky cleared
That steep drop in temp is the noncondensing GHG in operation, then air temp hit dew point and temps stop falling under clear skies till sunrise. And you can see in the ir measurements the delta temp hasn’t changed much, so there an equal energy loss as earlier for 30 or 40% of the spectrum. In the first chart you see net radiation dropping by over 60%, at the same time cooling slows. Something is either blocking that much energy only after rh goes up but not blocking the optical window, or the cooling rate doesn’t change during the night, just as rh goes up added energy appears to supplement loss from surface to slow cooling.
And we have a energy and water vapor loaded column that collapse at night, showing that it had to dump energy to space. And sensible IR from condensing water vapor would radiate in all directions. That imo fits better than blocking, as we know is has to be shedding heat.
Consider the surface to space radiative circuit as a depletion mode fet source is earth heat source, space cold is the drain, and is sensitive to rh on the gate, and load resistance is noncondensing GHG’s and absolute humidity. Water vapor is the capacitive element on the drain.
I think the actual circuit doesn’t operate like that, but they look the same.
micro6500,
” … depletion mode fet …”
But where’s the power supply? I see what you are getting at, but there’s still no active gain and this is the crucial requirement for active control. If the surface temperature was actively controlled, the temperature would be constant night and day, winter and summer. In your example, the fet is implementing a voltage variable resistance and not implementing gain.
Macroscopically, we can model the climate system EXACTLY with the following DE:
Pi = Po + dE/dt
where Pi is the power input from the Sun, Po is the power emitted by the planet and E is the energy stored by the planet (surface AND atmosphere). If we define an arbitrary amount of time, tau, such that all of E can be emitted in tau time, we can rewrite this as,
Pi = E/tau + dE/dt
You should immediately recognize this as the DE describing the charging and discharging of an RC circuit. Since Po is also equal to k*Ps (data confirms k=0.61). Ps is dependent on T^4 (SB Law) and T is linearly proportional to E, the time constant, tau, thus has a 1/T^3 dependence. Since tau = R*C, we can model this with either a R or C whose value has a 1/T^3 dependence.
No power supply and no active gain is required.
Except it’s not a single RC, it changes with high rh. That’s what nobody else saw.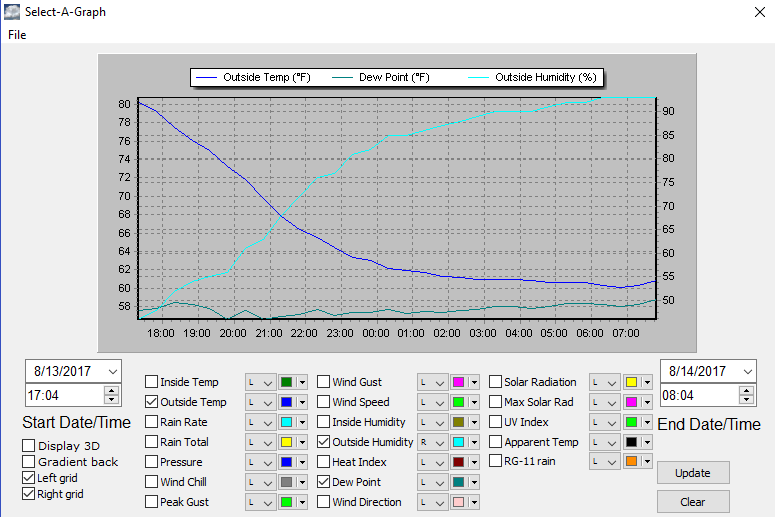
Look at this curve
And remember there’s a -40 or -50F zenith temp visible to the surface at the same time. Something has to supply that loss if energy.
Yes, it’s definitely not a simple RC circuit, none the less, its still a passive system, even if you model the temperature dependent R with a FET based voltage variable resistor.
The crucial missing element is active gain which is assumed by the consensus and is why they’re so wrong. The presumption of active gain provides the plausibility for runaway and a high sensitivity, both of which require an internal source of Joules powering the gain and which has no physical correspondence to any tangible component of the climate system.
It’s the missing internal power supply that provides the plausibility for 3.3 W/m^2 more power above and beyond the 1 W/m^2 of forcing in order to support an 0.8C increase in temperature arising from only 1 W/m^2 of forcing.
Let not argue about active. It’s temperature dependent nonlinear system. It is powered by water vapor (That fundamentally is external to a specific lication) and solar.
Cooling is regulated to dew point, regardless to our changes in Co2. For the same reason, cooling at night limits any amplification during the day.
Water (vapor or otherwise) is not a source of energy but a repository of stored energy and the energy it stores originally came from the Sun (input to the system and not an implicit power supply).
Yes, the interaction between temperature, dew point and relative humidity works to dynamically slow down cooling, but this isn’t a regulatory process with a set point and is just a causal response to change. There’s a significant difference between dynamic (which the climate certainly is) and active (which the climate is not) where consensus climate science conflates these concepts.
If you have Bode’s book, a few other interesting things are section 4.8 that defines sensitivity (climate sensitivity is actually the closed loop gain and unrelated to Bode’s definition of sensitivity). The first chapter also explains the differences between active and passive. Understanding this difference is crucial since Bode makes many contrasts between active and passive systems. For example, a passive system is unconditionally stable and he even offers a proof for that (start from page 108).
The concept of amplification itself doesn’t apply to the climate system as amplification requires the otherwise missing implicit power supply. The C code I showed earlier illustrates how delay can mimic gain. Note that starting from t=0, there is no ‘gain’ (i.e. Psurf == Pi). Only after delayed energy is returned to the surface can the surface emissions build manifesting an increasing temperature and which is universally confused as gain. Note that the inclusion of stdio.h is missing as it was interpreted as an HTML directive and dropped.
If course it’s an energy source as much as the charge stored in a capacitor is.
And yes there is a temperature set point, that’s the whole point, it’s called dew point.as you can see, the flux rate varies over rh for the same temp delta.
I agree that the interaction with the dew point is moderating the rate of temperature change. However; it still eventually cools down at night and warms up during the day. If there was a thermostatic set point, it would stay at the same temperature all day and all night through all seasons. What you’re describing is more like hysteresis which is a property of passive magnetic systems.
What temp does the moon drop to in the dark? Willis shows that thunderstorms breakout when water temps try to exceed about 31C, this shows what controls min T
97% correlation between min temp and dew over 75 million station records
Even 72-73 when station count drops by 80%
micro6500,
The average temperature of the Moon at night drops much lower than the Earth for 2 reasons, first the night is 14 Earth days long and second, there’s no atmosphere to transport heat from warmer portions of the surface to cooler portions.
I seems to me that where we differ is that that you believe that temperatures are a consequence of the due point when I believe it’s the other way around.
What changes first, the temperature or the dew point? Zooming in on your plots, they appear coincident which tells me that the dependency manifests itself in less time then the sample period. But then again, the ‘measured’ dew point is actually calculated from the measured temperature and measured humidity.
Dew point defines min T because the heat of evaporation is in excess to the energy just in enthalpy. It’s an energy barrier that stops temps from falling. True, it has limited capacity, and we see that play out as the seasons change, and each hemisphere warms and cools, unless there’s an incursion of warm humid air, and then it’s warm even though the sun is just as weak as it was a few days earlier.
How does this regulate the average temperature of the planet or the sensitivity of this average temperature to change?
I agree that there’s a connection between the dew point, relative humidity and temperature, since given any two, the third can be calculated. I don’t see how this is a regulating mechanism. If the Sun never rose, the temperature would keep falling. I think the fast rise/fall you see is associated with the short time constant of the atmosphere, while the slower rise/fall is associated with the longer time constant of the land.
At sunset it cools at a “high” rate, until aur temps reach a set temp, based on air temp and dew point. If max temp was warmer say because increasing co2, that night the cooling would change at the identical temp. If the high rate is 4F/hr and it starts 1F warmer, it will take 15 minutes longer to reach that switching temp. If the slow rate is 1F/hr , you exchange cooling rates, and reduce your 1F, to 0.25F increase in min t. The one chart temp stopped dropping completely, it would have cooled the entire additional extra 1F
Fine, but this isn’t a regulating mechanism and just sets a temperature threshold, below which it gets harder to drop further. It’s a non linearity, but is not characteristic of active control.
The relationships between temperature, relative humidity and dew point are deterministic.
http://www.dpcalc.org/
However; given constant absolute humidity, as temperature decreases, the relative humidity increases until the dew point is equal to the temperature at which point water condenses out of the atmosphere and the latent heat temporarily maintains the temperature until the atmosphere runs out of water to condense.
That is a regulating mechanism, and it turns on and off. Yeah deterministic just like a voltage regulator:)
As I see it, it’s just one of several mechanisms implementing the non radiant return to the surface of the latent heat that cooled it as the water initially evaporated and only relevant when the absolute humidity is relatively high to begin with. Another return mechanism is rain. Another is lightning, wind and weather in general.
It’s certainly a contributor to a non linearity relative to transient temperatures, but if the absolute humidity starts out low, it takes much longer to reach the point where the dew point is equal to the air temperature. In fact, where I live, it’s dry enough that dew in the morning is a rare event. In the mountains on a clear winter night, there’s not much absolute humidity to begin with and the temperature can drop quickly all night long.
Yes, and it has a very large drop in night time temps, which the tropics don’t.
And this is important in that it’s the base discharge rate, radiative cooling only, all those other involve convection.
I don’t think you’re ignorant Willis- I just think you’re genuinely stupid. You were probably banned because it takes a great deal of mental effort to debate with the intellectual equivalent of a dining room table and frankly, it’s a waste of everyone’s time.
Here’s a schooling for you which I’ll try not to make too complicated so your facile mind can understand the frankly high school level statistics behind it:
(1) Tamino starts her analysis from 1975 because that’s where the latest linear trend commences. This is clearly stated on her blog if you’d bothered to read it.
(2) As explained in very small simple words on her blog, 12 years is not long enough to show a significant trend- even though the point estimate on that trend is a massive 10 degrees Fahrenheit per century.
(3) That point estimate of the most recent warming is over double the rate of increase calculated from 1975. Interpreting this as “not significant” and that “warming is not occurring” is clearly erroneous as anyone with even a modicum of basic training in statistics will tell you. The correct interpretation is that the point estimate of the warming effect is large, but the standard errors are too wide to draw any firm conclusions because the dataset is far too small- more data is required. Hence the appeal to a larger dataset where that question can be answered with sufficient power.
Here’s a very simple question for you. What would the rate of warming have to be in order to be declared “significant” over the 12 year period assuming the same measured uncertainty in Tamino’s blog? Anybody with about 6 months training in simple undergraduate statistics could tell you the answer- but I honestly wonder if you or anyone on this pathetic excuse for a blog could tell me the answer. And when (if) you work it out, perhaps you might have an epiphany about why your post is so monumentally, unbelievably stupid.
‘monumentally, unbelievably stupid’
I think your name is about to become ‘bruce BANner’
“Tamino starts her analysis from 1975 because that’s where the latest linear trend commences. This is clearly stated on her blog if you’d bothered to read it.”
I just checked Tamino’s blog, and that’s complete nonsense. There is nothing linear about the data in NCDC from 1975 onward, in fact by some strange freak coincidence it seems that the NCDC data also seems to level off at, oh, say 1998-2000. Tamino just decided to hand-draw a curve through the data and chose to make it straight starting in 1975, data be damned. Tamino starts off by admitting that the red line being drawn is “an estimated trend which is not a straight line.” Tamino then uses his own subjective artistry as convenient excuse to then do a linear regression from 1975 and not surprisingly find a linear trend.
Tamino’s post does not make the slightest bit of sense. You can’t disprove the assertion of no statistically significant trend in a first data set from 2005 onward, by merely showing that a second data set shows a statistically significant trend from 1975 onward.
If you’re so gullible that you just blindly accept what someone writes on a blog post without critically evaluating it, maybe you should hold off a little bit before insulting someone else’s intelligence.
‘before insulting someone else’s intelligence.’ – I suspect that was brucie’s entire point, and that he hopes many people will see it his way.
You don’t have a clue how pathetic that post was, do you? Full of self-righteous projection.
Yelling and calling names is why you guys are losing this debate. That and your disingenuousness.
That, and the fact that Mother Nature isn’t doing what you’re (failed) models say Mother Nature should be doing.
This has been a very difficult & unpleasant thread to read. The inability to solve the “actual data” problem, attempting to substitute model results for actual data, and all the while claiming the science is settled is a never-ending echo-chamber…in the mean time, Mother Nature continues on with no perceived evidence of impending doom.
To Extreme Hiatus
your phrase,
They did not choose these deceptive names by accident. The people at the top of this propaganda pyramid are very clever. A more accurate name for Tamino’s blog would be Closed Mind or, even better, Settled Mind.
They need people with the mind open to pour in all the propaganda. If the mind of people is shut, they cannot discharge all the bullshit in.
Agree Leopoldo. They hope that their audience’s mind is not merely open but sufficiently programmed and pried open to be only, and eagerly, receptive to their selective information. But the blog from which the BS pours is not open at all. They want it all one way, their way, which is of course all supposed to be settled and undeniable.
Bruce December 5, 2017 at 2:06 am Edit
You talk to your momma with that mouth? One thing is clear. When a man begins by throwing mud as you are doing, it’s because he’s out of real ammunition.
Onwards. You say.
So what? All that does is guarantee results in one direction, that of the stated trend. That’s called “cherry picking”, look it up.
And as I explained, that’s bull. Since 1850 there have been 15 periods of the same length in the Berkeley Earth global temperature dataset that show a significant trend. You really ought to actually test your claims before you make them, it will save you from this kind of needless embarrassment.
Says the man who erroneously claims that 12 years is “not long enough to show a significant trend” … and now you are making things up out of the whole cloth about what I said in that post. I did NOT say that “warming is not occurring”, not in that post and not in this one. That’s a damned lie and you are a damned liar, but since you are defending Tamino I suppose that shouldn’t be a surprise.
As I pointed out above, your claim that “the dataset is far too small” can be easily falsified by looking at the data. However, obviously, you didn’t do that. The correct conclusion is that the result is not statistically significant, period.
So heck, why not use all the data we have since 1850?
The truth is, what the trend is since 1975 has ALMOST NOTHING TO DO with what the trend is since 2005. For example, the trend up to 1975, starting in 1900, is upward … but the trend 1945 to 1975 was downward. How much does the longer trend tell us about the shorter trend? Heck, it can’t even give us the sign of the shorter trend, much less the value.
If you want to compare trends, you need to use the same time period.
Here’s a simple answer for you. Who cares? If you wish to know that, go ahead and calculate it. For me, it is meaningless to say “if it went up this much it would be significant”. So what? It didn’t go up that much. For me that statement is in a class with the statement “if my aunt had wheels, she’d be a tea tray”. It’s a fantasy about a non-existent reality, and as such, stupendously uninteresting to me.
But since you asked, here’s the real answer—your question doesn’t have enough information to even be answerable. Among other things, it doesn’t just depend on the rate of warming. If it warmed in a slow steady fashion with little variance, a very small trend would do it. But if the data are widely scattered it requires a greater trend. It also depends, and quite sensitively, on the Hurst exponent of the dataset … get back to us when you know what that is, because if you already knew about all of these issues, you wouldn’t ask incomplete questions which cannot be answered for lack of specificity.
Finally, I gotta ask. Are you naturally this charming, or did you go to school or something to acquire your special patina of unpleasantness?
w.
That argument is not logically valid.
For one thing you are comparing a global data set with one for USA only. Global data obviously will have less variance than that for a specific country and so it will be much easier to find short significant trends in global data.
But the main problem is you can only find 15 examples of 12 year significant. This shows that 12 years is not normally long enough to establish a significant trend. It’s also unlikely that a statistically significant 12 year trend is going to be meaningful – if it’s significant it will because there’s an artificially steep trend.
For example, using BEST, the trend over the last 12 years is significant, but that’s only because the recent El Nino has pushed the trend up to an unrealistic fast rate of warming. (0.279 ±0.217 °C/decade).
By contrast most 12 year periods do not show significant warming, despite being part of a longer statistically significant warming period.
Bellman December 5, 2017 at 7:09 am E
First, you can thank tamino for me not using the same dataset, as he did not provide a link to what he used.
Second, while individual countries will have greater variance, they will also have larger trends.
Fifteen examples out of 150 years is around ten percent. So while it is unlikely, it is not statistically unlikely at the p<0.05 level …
Regards,
w.
I’m not sure what you mean by that. Tamino was comparing two US datasets, you were the one who introduced the BEST global set. Looking back I see in your original post you said “there are a number of 13-year periods in US temperature history which do have significant trends.”. But I’d be surprised if there as many short significant periods in US data than in global data.
That doesn’t really tell us anything about the likelihood of a trend being detected as significant. But it still makes my case – most 12 year periods do not show a statistically significant rise even when they occur during longer periods of statistically significant warming.
Your argument is that it means something to say the last 12 years have not shown significant warming – and imply that this means there is an ongoing pause in warming. Yet the majority of 12 year periods during the acknowledged warming periods do not show significant warming. (And as an aside the last 12 years of BEST data do show significant warming.)
Bellman December 5, 2017 at 1:23 pm Edit
As I said, I don’t know what dataset Tamino uses, so I was unable to use that one. But hang on, let’s look at Berkeley Earth data for the US alone …
OK, I just checked. Since 1850 there have been 14 significant periods of that length (13 years), one less than globally. So I would say, you are surprised … however, I’m not. Remember that I said there would be about the same amount in the US, because:
And since 1968, that’s a total of 33 starting years, there have been 9 significant trends more than a quarter.
Really? The frequency of trends in the past tells us nothing about the most recent trend? How does that work?
Actually, no. This is why I ask people to QUOTE MY EXACT WORDS. My argument was that whatever the trend is, it is NOT statistically significant, period, viz:
Since that is undeniably true, I don’t understand your complaint.
Only if you ignore autocorrelation, a far too common mistake in the field … when you adjust for autocorrelation, the p-value of the trend is 0.13, not significant at all. The problem, as Nature magazine put it, is that “Nature is naturally trendy”. As a result, you CANNOT use standard statistics to calculate the significance of a trend.
My best regards to you for persevering, and for avoiding the usual ad hominems to focus on the actual science.
w.
Because the trend since 1850 is clearly not linear.


Bellman December 5, 2017 at 7:43 am Edit
Yes, and the trend since 1975 is not linear either. No natural trend is linear, although we approximate them that way all of the time. We say, for example, that the temperature rose ~ half a degree over the 20th century. But that is a statement about a linear trend.
w.
At first glance it looks a lot more linear than pre-1975. There may be a better fit for the warming since the mid 70s, but unless there is a compelling statistical argument it’s generally best to start with the assumption of linearity.
You should care. Dichotomizing the results of statistical analyses into “significant” and “not significant” is not the correct way to do statistics, nor is it the correct way to interpret p values. The inventor of the p-value, Ronald Fisher never intended it to be used in this fashion and by doing so on a grossly underpowered dataset you’ve committed a cardinal sin and come to a conclusion that’s clearly incorrect. Absence of evidence is not evidence of absence blah blah blah.
Most folk who haven’t been trained in high level statistics don’t even know that there is a difference (and indeed a fundamental inconsistency) between “significance tests” as developed by Fisher and “hypothesis testing” as developed by Neyman and Pearson. You, nor the readers on this blog know any of these subtleties, because you haven’t undergone any meaningful training in basic, let alone high level statistical theory.
Take a freely available MOOC on interpretation of scientific data or basic statistics. It will take you about a month to do. Whilst you won’t be an expert, you’ll learn loads and it will help you avoid making silly statements like the ones in your previous post.
Tamino still exists? who cares?
Quite cool from you to give him some advertisement, but not really useful. Just let the dog bark.
Sure enough Nick but why should we assume that such a border would necessarily equate to the calculable or linear*.
*Scale being the matter of issue here!
While not dealing with this post over at Open Mind, Tamino truly loves to ignore inconvenient data when he has a point to make. His current post talks about the rainfall during Hurricane Harvey, and how it was “the heaviest rainfall ever” and “two of the top three”, with the two days at 250mm each day and a third day just under 250mm. And he then goes on to say that while Hurricane Harvey wasn’t caused by climate change, climate change clearly made it worse.
Fortunately, this is easily verifiable. And in doing so, we can see his claim of “worst ever” is lacking. According to NOAA, in 1979 TS Claudette dropped 42 inches on Alvin TX (a suburb of Houston located about halfway between downtown and the Gulf of Mexico) in a single day. And 42″ is equal to 1060mm! So his “3 of the 4 worst rainfall days” don’t even total to the rain in Alvin over a single 24 hour period! I posted this to his site and it appeared for a very short time before being removed totally.
He’s now embroiled in a “let’s hate Texas” battle with his regulars – and wonders why they are so insulting to Texans. Maybe if he took time to answer technical questions with more openness and less dismissiveness he would cultivate a better clientele.
In 1963 hurricane Flora stalled over Cuba for a few days and dropped over 100 inches of rain in one location. Harvey’s measly 60.58″ dropped over several days pales in comparison.
Living in the US, “holocaust denial” is a non issue. Recalling that Al Gore went to divinity school, I always thought of “denier” as a religious term. For instance, from the King James translation of the Bible:
Matthew 10:33
“But whosoever shall deny me before men, him will I also deny before my Father which is in heaven.”
2 Timothy 2:12
“If we suffer, we shall also reign with him: if we deny him, he also will deny us:”
So the way I see it, we’re called deniers because we deny the one true CAGW religion.
I see another religious reference in Tamino’s reply to Eschenbach: a confirming datum:
“…And when (if) you work it out, perhaps you might have an EPIPHANY”
While we all wait impatiently for the USCRN record to lengthen, there are some interesting longer records. The folks at the NWS office in Gray Maine (covers NH and part of ME) posted the following tables of the top 10 meteorological fall months (Sep/Oct/Nov) that are strikingly different.
While Portland ME is on the seacoast, and Concord NH some 100 km inland, the big difference is the period of record. Portland’s is 1941-2017, Concord’s is 1868-2017, stretching back before the typically used 1885-1890 start date of the USHCN record.
From Portland’s data, you could almost sympathize with Grant Foster for being so bent out of shape:
http://wermenh.com/images/portland-fall.png
I’m in walking distance to Concord’s northern boundary. The period around the 1880s were just as weird a time as the 1930s were, but different. Trend? What trend?
http://wermenh.com/images/concord-fall.jpg
Note that https://www.facebook.com/NWSGray/ uses a proper three decade average for defining the current climate normal. Good for them.
Willis noted at the top:
Indeed!
“albondigas” perhaps his cabbage is a little weak as well?
Anthony,
Could I suggest that rather than suffer deliberate attempts by identified posters to create ‘noise’ and thus devalue the standard of conversation, you move their posts to a separate thread, perhaps given a suitable title. This proposal would have the advantage that no-one could claim to be censored, or modded.
Of course you could also give their multiple identities if known, as that would alert everybody to their inherent mendacity.
I for one would welcome such a thread, as it would be a source of amusement.
TonyN
The best way to deal with trolls is once identified, just ignore them. Their reward is getting as many people as possible to react to them. Unfortunately, in a blog with this many readers, there are a lot of people who can’t ignore trolls’ posts.
Heck, I bet Tamino is checking in here several times a day, at least to look at the comment count.
Ric Werme wrote “The best way to deal with trolls is once identified, just ignore them.”
Alternatively, use them as a springboard to declare your beliefs, which then get counted in Google searches and shifts the balance of public opinion.
Unfortunately, the wordpress.com hosted version of code doesn’t allow moving comments.
That’s too reminiscent of the censorship tactics employed by Real Climate and its “Borehole.”
Perhaps we could have a rotating team of troll stompers. The rest of leave responding to trolls to the professionals.
“I estimate the warming rate at 10 ± 14 °F/century (95% confidence limits).”
Is that the same 95% confidence that they had in their models? At one point they said with a 95% confidence interval that “There will not be a 15 year period of CO2 rising where temperatures don’t follow”. Yet we had 18 years.
How, umm…INCONVENIENT!
Speaking of comments blocked, the CBC, Canadian Broadcasting Corp. the taxpayer funded PR machine for the Liberal government has banned me from making comments. I try to correct their false “climate change narrative” and the Meuller investigative sham and their treatment of Hillary as a goddess.
So much for free speech in Canuckastan.
The USA is the only place in the world where free speech still exists.
Socialists and other bad actors don’t like free speech because it interferes with their agenda. They don’t like it when you don’t agree with them, and have managed to take the ability to disagree away from most of the people of the world.
They are trying to take away free speech in the USA, too, but haven’t been successful as of yet.
“The USA is the only place in the world where free speech still exists.”
…
TA, have you ever been to Sweden?
No, I’ve not had the pleasure of visiting Sweden. Are you implying that there are no limits to speech in Sweden? What happens if one criticizes radical Islam in Sweden?
“we don’t censor the views we might disagree with”
But you do pre-moderate all the comments of people like myself who are off message?
And then search the net to see if I’m a real person?
Open is just that…
“But you do pre-moderate all the comments of people like myself who are off message?”
Deliberately and maliciously lying about the professional qualifications of contributors in order to attempt to damage their scientific credibility and thus their careers can hardly be described as being ‘off message’, you odious little troll.
Nor can boasting on the Guardian CIF blogs about how you visit AGW sceptic blogs in order to “tweak the tails of the deniers” (your words).
Griff, your comments are a source of inspiration to all here, you are polite if off message so why would anyone want to pre moderate you?
Tamino is more vocal than sharp, I found when engaging him on some topic which he was mis-interpreting some years ago — I think it was the Marcott data. He didn’t get it even when I explained it simply. Never went back there, no point.
there there griffy
I posted some bayesian analysis of the USCRN data on Tamino’s website. Using a model that allows for lag1 auto correlation (y(t) = phi*y(t-1) + alpha + beta * x(t) + err) I found as Nick states for an AR1 model above that the trend, beta, is at the margins of stat sig at 8.55 +/-8.67F. Presumably in a year or two, if the values more or less follow that trend, it will be ss.
Re the talk about commenters here, there does seem to have been a change over the last 12 months as far as I can see. Where are regulars like Paul Westhaver who I don’t see posting here anymore?
I use it because it is the alias that the coward is hiding behind. He didn’t reveal his identity, he was outed.
Also, many visitors to both his blog and this blog only know him by his alias.
w.
Typical Eschenbach……“the coward”
…
When you resort to name calling you’ve lost the argument.
Bob, the COWARD is indeed Tamino who attacks Anthony and Willis behind their backs, then fail to post the data for his silliness.
Tommy, it’s a shame you think calling people names helps your side of the argument. Defending Willis’s ad-hom (name calling) shows you are merely tribal.
Robert, its a shame you ignored this part:
“the COWARD is indeed Tamino who attacks Anthony and Willis behind their backs, then fail to post the data for his silliness.”
His cowardliness is demonstrated,which YOU fail to see.
Tommy, your name calling is shameful. When you resort to name calling you’ve lost the argument.
From the post:
“Of course, Tamino is still free to comment here, we don’t censor the views we might disagree with—that’s science.
To begin with, attacking a man where he cannot reply is just scummy. But that’s no surprise, it is Tamino after all. He doesn’t even have the albondigas to sign his own name to his own words … so I expect nothing from him and am yet to be disappointed. As Churchill is reputed to have said of one of his opponents, “He’s a humble man … and he has much to be humble about”.
Grant Foster can post his responses here, but too chicken to do it as he was that way at Bob Tisdale’s blog when he used to pick on him from long distance.
He has been known for years as Grant Foster, I KNEW this about 8-9 years ago,but he still hide behind Tamino.
That is pathetic!
What argument? You haven’t done that yet.
You need to stop being stupidly paternalistic.
Tommy asks: “What argument?” This one: ==== “Bob, the COWARD is indeed Tamino”
(Snipped)
(Why did I snip you,because you never been on topic after FIVE comments,make a big deal over what Willis states on a single word,which he backs up,no violation.You were wrong the entire time) MOD
“….and other detritus that add nothing to further the discussion may get deleted”
RE SNIPPED: “what Willis states on a single word”
…
How hypocritical………I’ll bet I’d be banned if I used the single word that begins with a “d” then is followed by an “e” then a “n”…………etc.
Also, many visitors to both his blog and this blog only know him by his alias.
w.
Robert Kernodle December 5, 2017 at 4:29 pm
Robert, I’m not “name calling” regarding Tamino. I am describing Tamino.
When you attack a man and you do not allow him to respond to your attacks that is cowardice. Period. It’s even recognized in US law that a man has a RIGHT, not an opportunity but a RIGHT, to confront his accusers.
I discuss Tamino here, and he is free to reply.
He discusses me there, and I am banned from replying.
If you do not see that as cowardice I feel sorry for you …
w.
All I see is you calling him names.
…
When you resort to name calling you’ve lost the argument.
…
And you can feel sorry for me if you wish, but all I’m doing is pointing out to you your ad-hom.
Robert Kernodle December 5, 2017 at 5:16 pm
As I said, if that is the outer limit to your vision, I pity you.
Robert, it appears that you don’t understand what an “ad hominem” argument is.
Any old statement about someone, however negative, is NOT an ad hominem.
An ad hominem is when you attack the man instead of attacking his ideas. However, I have been very clear and forceful about the problems with his ideas.
I have also pointed out that attacking a man when he can’t fight back is cowardice … a fact which you seem remarkably unwilling to even notice, much less address.
w.
Calling someone a “coward” is name-calling (which is what you have done.)
..
Describing something that someone has done as “cowardly” is not name calling.
..
You are guilty of calling Grant a coward. “….it is the alias that the coward is hiding behind.”
…
Name calling is an ad-hominem: http://whale.to/vaccine/propaganda3.html
Robert,
Calling someone a “coward” is name-calling (which is what you have done.)
..
Describing something that someone has done as “cowardly” is not name calling.
That is a distinction without a difference and is an obtuse reply. Note that I did not call you obtuse, I characterized what you have done as obtuse. That makes it ok, yes?
Also Willis, could you please tell us what you did on his site that earned your banishment?
I did nothing to earn anything.
w.
You posted something didn’t you?
Robert Kernodle December 5, 2017 at 5:48 pm
Posted something? “If it were so, it was a grievous fault …”
I’ve asked people to quote the exact words, so let me quote mine from below:
w.
Thank you very much Mr Eschenbach, now I know why Grant has banned you: ” You do understand that when you are no fun to play with, that people shun you, right? ”
…
You hit the nail on the head.
Robert Kernodle December 5, 2017 at 6:25 pm
Robert, now you are being childishly silly. My posts attract over a million page views per year. My post on warm things and cool things alone has 1,682 comments. I am the most popular of the guest commenters here. If that is your idea of people “shunning” me, I can only laugh and point and say “Bring that kind of shunning on!”.
As to why Tamino banned me, no, you don’t know why, despite your puerile claim that you do. You weren’t there, you don’t have a clue, don’t pretend. It’s not a good look on you.
In any case, it was something like a decade ago and so the details are fuzzy. From memory, in a discussion I claimed that the big increase in CO2 started around 1945. For some reason that agitated Tamino. He claimed it started much earlier, and he wanted me to disavow the statement. I wouldn’t, so he banned me.
However, I wasn’t upset about it. By that time I’d heard about his nefarious secret censorship practices, the practices that as far as I know you haven’t disavowed, so I felt lucky to have escaped before he started vanishing my comments without a trace.
w.
Eschenbach posts: “It’s even recognized in US law that a man has a RIGHT, not an opportunity but a RIGHT, to confront his accusers.”
..
Your knowledge of the Constitution stinks. You left out an important part of the 4th Amendment: ““in all criminal prosecutions, the accused shall enjoy the right…to be confronted with the witnesses against him.”
..
1) Blogging is not a “criminal prosecution”
2) This blog, and Foster’s are “private property” and not subject to your legal ignorance. You have no “right” on his blog, and if I’m not mistaken, this blog is not yours either.
Robert Kernodle December 5, 2017 at 5:25 pm
..
Dang, dawg, did someone piss in your Wheaties this morning? I’m not interested in discussing anything with someone who claims, based on nothing at all, that my knowledge of the Constitution stinks.
You have absolutely no idea what I know about the Constitution. None. Yet you are willing to attack me, based on the fact that I didn’t include 3 words. However, here was my statement:
Now, is that a RIGHT under US law? Sure. Sorry I didn’t quote the Constitution chapter and verse, but then nobody expects the Spanish Inquision … I figured that folks would figure out that when I said “under US law etc.” that I was talking about the courts. I didn’t realize that you needed special assistance, everyone else seems to have gotten my message.
Go bother someone else. I don’t have time to answer inane questions and take abuse from charming people like you.
You do understand that when you are no fun to play with, that people shun you, right? …. just checking …
w.
“Now, is that a RIGHT under US law?”
…
No Willis, it is not.
…
For one thing “laws” do not confer “rights.” Ever wonder why they called the first 10 amendments the Bill of RIGHTS?
…
Another example of your lack of legal acumen.
“based on the fact that I didn’t include 3 words”
…
Those three words are crucial. For example, in a civil case the “right” you describe does not exist.
@Robert Kernodle
just curious: in sort of civil case would someone NOT have a right to confront his accusers? I confess knowing little in legal matters, but it seems to me that “due process” include this right in ANY case. This right is even recognized out of the courts, in the press, or inside a company, and is, AFAIK, considered a pillar of western civilization (epitomized in Franz Kafka works). Enlighten me if I am wrong
Yes that is correct, Tamino is free to reply here. In fact, I offered him guest post opportunities on two occasions in the past and he turned them down.
Was it self-censorship or because he has nothing to say? Hmmm…
Willis,”I was notified by a friend that Tamino is slagging Anthony and me over at his blog,”
True
but he did try to improve
“Challenge to Anthony Watts — and to myself Posted on November 1, 2017
I’m going to try a new policy. We’ll see how it works out.
It’s this: stick to the science. No baseless ad hominem. No “demonizing” others. That goes for comments here as well.”
It just did not like last long.
But he did try on his blog up until his intemperant article on you.
No help I know……
Robert Kernodle December 5, 2017 at 6:05 pm
This is what you think is important? OK, lets discuss it.
The rights were conferred by the Constitution, but they are implemented by the laws. Here’s an example of one such law:
The Constitution granted the rights, but until they are enshrined in the law, they are meaningless.
So yes, Robert, we do have rights under US law … and I totally fail to see why this trivial nit-picking point is what you choose to focus on.
w.
Willis says: “The rights were conferred by the Constitution”
…
Thank you, you’ll notice I said: “For one thing “laws” do not confer “rights.” I appreciate it when you see things my way.
…
Now all we need to get you up to speed on are the words: “in all criminal prosecutions.”
…
PS, I like how my posts disappear too!
Robert Kernodle December 5, 2017 at 6:35 pm Edit
They would be crucial had I claimed anything about civil cases. In fact, I said we had rights under US law. I didn’t say they applied in all places and times, that’s all you.
w.
Robert Kernodle, a final note.
I said that it was vile for a man to attack someone without giving them the chance to respond, to confront the person accusing them.
Instead of agreeing that that was a bad thing, you dragged the conversation off into the constitution and US law and whether the right is a right under the law and how unutterably stupid I was about the Constitution …
… but you never had the albondigas to just say yes, that is indeed a vile and wrong thing for Tamino to do.
But heck, perhaps you just overlooked it in the joy of sidetracking the discussion, so I thought I’d give you one last chance to join the forces of light … speak up, now, so everyone can hear you.
w.
Hey Willis, go get RISTVAN to comment on your interpretation of the law in this case, he’s a lawyer.
@ w.
“Live and learn” is a great thing.
I learned from your eyeopening article as much as from the occasionally really mean replies.
A thankful heretic.
Is the troll gone??
co2isnotevil December 6, 2017 at 9:39 am
The James Watt flyball governor is a control system. Would you say it is active or passive, and why?
w.
Willis,
A flyball governor is a ‘closed loop’ active control system that exhibits gain as it modulates the fuel flow into the engine which is amplified by burning that fuel, with a tiny part of that energy spinning the flyball. The idea is that a very small amount of energy is amplified to control a large source of energy. In fact, the closed loop gain is quite high and given by the ratio between the energy produced by the engine and the energy required to spin the flyball.
While you can consider many things in the climate system that modulate the incident or outgoing radiation, there’s no gain and no closed loop, thus no active control.
This is what seems to confuse people. The climate system is not a closed loop system, but an open loop system whose forward behavior is constrained by various temperature dependencies and not by active control.
Sorry, I meant the open loop gain is the ratio between the energy produced and the energy spinning the flyball. This is very large. The open loop gain of the climate system, at least per Hansen and Schlesinger’s application of Bode, is exactly 1. However; the concepts of open loop and closed loop do not apply to the climate as the climate system is neither a feedback amplifier or a feedback control system. To be clear, the Hansen/Schlesinger model based on Bode is not a feedback control system, but a feedback amplifier.
Simply put, the climate system doesn’t amplify solar input, it just redistributes it over time and space.
co2isnotevil December 7, 2017 at 11:56 am Edit
I fail to see the difference between that and the tropical cumulus/thunderstorm system. It also exhibits gain as it modulates the solar energy flow into the climate system which is amplified by the greenhouse effect, with a tiny part of that energy initiating the formation of the cumulus/thunderstorm system.
Just as with the flyball governor, a tiny amount of energy is used to control the huge amount of energy pouring into the system. This control is strong enough that on average the temperature of the tropical ocean goes DOWN when the cumulus field forms in the late morning, despite the increasing TOA solar input.
How is this not a tiny amount of energy controlling a large amount of energy?
It also exhibits the “overshoot” necessary to control a lagged system. This overshoot is visible in the dropping of the temperature BELOW the temperature necessary for cumulus formation.
It is also visible in the individual thunderstorms, which also drive the surface temperature below that required for their initiation.
The “greenhouse effect” absolutely amplifies solar input or we’d be a block of ice. And the clouds control the solar input, using a tiny bit of energy to block massive amounts of solar radiation from reaching the surface.
Look, we have a system whereby when the temperature exceeds a threshold, a mechanism using a tiny bit of incoming energy turns down the incoming solar radiation to stop further temperature rises.
How you can say this is not a control system escapes me … what am I missing here?
Thanks,
w.
This mechanism you found is water vapor/atm regulating warming during the day, what I found shows how water vapor then also controls cooling after sunset.
In coolings case, it cools quickly until air temps near dew point, then cooling rate slows 80-100%.
Since min T is dependent on dew point, and dew point is not dependent on co2, min T is not dependent on Co2, and Co2 has little ability to cause warming over night.
When cooling doesn’t stop during the night, any changes to day time max temp from increases in non-condensing GHG’s, would be the first radiated to space at sunset, at the high cooling rate. But you do lose the cooling time for the increased maxed T, from the slow cooling rate at sunrise.
So a 1F increase in Max T would be cause an increase in the following morning min T of ~0.13F, as it’s a ratio of the slow rate (0.5F/hr) divided by the fast rate (4F/hr) times the Temp change from non-condensing ghg’s.
Willis,
The difference is that one has powered gain and the other does not. GHG’s do not amplify, but delay energy emitted by the surface in order to add it to new energy arriving from the Sun in the future, where the energy emitted by the surface in the past originally came from the Sun. Look at the little piece of C code I posted earlier.
You’re also conflating a feedback amplifier, as the climate is incorrectly modelled, with a feedback control system. The purpose of feedback in an amplifier is to make the closed loop gain mostly independent of the open loop gain which can only happen when the open loop gain is much, much larger than the closed loop gain.
It’s also not a small amount of energy controlling a large amount of flux. The energy controlling the flux is about the same as the energy of the flux itself. At a little over 300K, evaporation starts to increase dramatically where the average energy removed from the ocean by latent heat and dumped into the atmosphere becomes about equal to the average incident energy from the Sun.
http://www.palisad.com/co2/sens/st_wc.png
The Y axis is the water column in grams per cm^2 and the X axis is the surface temperature in degrees K. Each small dot is 1 month of date for a 2.5 degree slice of latitude and 3 decades of monthly averages are shown.
Amplification is boosting a small input signal into a larger output signal by adding energy from an implicit power supply.
This implicit, internal source of power is required by both feedback amplifiers and feedback control systems and is missing from the climate even as it’s assumed to exist. This is the defining attribute that distinguishes an active system from a passive one because you can’t have active gain without an implicit power supply.
The implicit power supply can not be the Sun, since the Sun is already the forcing input to the model. It would be like instead of plugging your stereo into a wall socket to power the gain, you power your stereo with the output of your turntable which is also the input to the amplifier.
The fundamental flaw in considering feedback representative at all is that a feedback system, per Bode, samples the input to determine how much output to deliver from an implicit supply. The climate system consumes the input (forcing power) to produce its output (surface emissions). The temperature output of the model is simply surface emissions converted into a temperature by SB (although I was never able to get Schlesinger to admit this). The failure of their model is to ignore COE between the forcing input power and the required power emitted by the surface in order to sustain the presumed temperature rise.
Per the Hansen/Schlesinger feedback model, the open loop gain of the climate system is 1 and the closed loop gain is 1.6, that is, for each Joule of energy that arrives from the Sun, the surface emits 1.6 Joules. While this can be modelled with unit open loop gain and 37.5% positive feedback, it can be equally modelled as an amplifier with an open loop gain of 1000 and 63.5% negative feedback. In fact, for any arbitrary value of the open loop gain, a value of feedback can be found that will result in a closed loop gain of 1.6.
Modelling the climate as a feedback amplifier means that the extra 0.6 Joules came from the implicit power supply, when in fact, it came from the surface a short time in the past. The fact that an internal source of energy is presumed is how they can support 4.3 Joules of surface emissions per Joule of input, where the extra 3.3 Joules comes from the implicit power supply that isn’t really there. Clearly, it can’t come from past surface emissions as it’s larger than what is available from those emissions.
They try to fudge around this by calling the sensitivity an incremental metric. This would mean that the next Joules of input is about 2.7 times more powerful at warming the surface than any of the previous Joules, which of course is impossible since all Joules are the same. More to the point, if the incremental gain and average gain are different, then Bode’s linearity precondition is not met and calling anything feedback is meaningless.
I like this chart, it includes both the warm and cold cycles, as it has to.
This is the wrong model, stop trying to reference this to deny it. It’s wrong.
It is a regulator (much like a switching regulator), that runs on the input power to regulate it’s output to some level below the drop out “voltage” of the regulator. The work the regulator has to do to do the regulating.
The daily Solar pulse is the energy input into the system, and the regulating system uses that to regulate surface air temps to within ~5-10% in absolute temps, by controlling both input and output power streams.
It’s not an amplifier!!!!!!!!!!!!!!
Okay?
And I don’t care what climate scientists think about electronics models, I care how I would model it when I did that for a living.
micro6500,
“I like this chart, it includes both the warm and cold cycles, as it has to.”
Follow this link and you will find more than 50 other plots like this, each of which is a scatter plot of 3 decades of monthly averages for 2.5 degree slices of latitude of one climate variable plotted against another:
http://www.palisad.com/co2/sens
Most interesting is clouds and other things that exhibit control like influences, but are really not. A simple and accurate passive model of the energy balance can be inferred from the average relationships between the climate variables as illustrated by these plots. Note that the dynamics of the atmosphere and its interactions with the surface are not explicitly accounted for, but implicitly accounted as their average behavior affects the measured relationships between the various climate variables.
micro6500,
Yes, the Hansen/Schlesinger feedback model of the climate system is absolutely wrong. My point is that the very concept of feedback has no relevance to how the climate works. It’s difficult for many to grasp because the concept has been so widely misapplied and both sides depend on feedback in order to explain their respective positions.
Positive or negative feedback is irrelevant and the effects you and Willis are observing are not properly considered active feedback control mechanisms. I’m not saying that the effects you’re observing don’t exist. Just that you’re misinterpreting what you are seeing. They’re more properly considered non linearities in the response that seem to arise from the temperature dependent flux of latent heat. They may mimic controlling like behaviors over narrow ranges of conditions, but they’re not properly quantifiable as active feedback control mechanisms.
Technically, the input to the system is energy from the Sun, while the output is what the planet emits, which based on COE must be the same, thus the gain of the system is 1. Attempting to call the surface the output of the system also contributes to the widespread misinformation about feedback.
A regulator must have gain. For example, in a classic linear regulator, there’s gain between the gate of the pass transistor and the regulated output. In a switching supply, there’s gain between the gate of the switching transistor and its load. Every transistor or fet in the circuit has gain. You can’t build a regulator without gain. Even electromechanical regulators have identifiable gain.
An unregulated supply, for example, a transformer, diode bridge and a filter capacitor is a passive circuit. Even so, it will still be capable of maintaining a relatively constant voltage over a wide range of loads, just not to the nearly absolute level of precision you can achieve with active regulation. Even if you add a highly non-linear thermistor to the mix, it’s still a passive circuit.
Thanks, CO2.
In a flyball governor, a very small expenditure of energy in the form of the shifting of the flyballs is throttling the incoming steam power by hundreds of watts.
In the tropics, a very small expenditure of energy in the form of cumulus cloud formation is throttling the incoming solar power by hundreds of watts.
How is the first one a governor and not the second one? Both are using a small amount of energy to regulate hundreds of watts of incoming energy. Both use ambient conditions to determine when to reduce or increase incoming power.
On my planet, anything with a system which varies the incoming power based on the conditions internal to the system is “governed”.
Comments?
w.
Willis,
It’s not a small amount of energy that goes into to forming cumulus clouds. There’s the latent heat of its water as evaporated from the surface, the potential energy of liquid water lifted against gravity and the electrical energy stored in the capacitance formed between clouds, the surface, the ionosphere, themselves and each other.
As I said, it may mimic a governor like effect over a narrow range of conditions, but it isn’t properly characterized as a feedback control system like a flyball governor can be.
It’s certainly true that the exponentially increasing rate of evaporation as a function of temperature has a limiting effect on the maximum ocean temperature, at least until the oceans have completely evaporated. This isn’t a like a an active feedback system maintaining a constant boiler pressure, but something more like the non linearity of the reverse breakdown of a semiconductor junction or even its forward conduction characteristic.
The flyball is an active control system with identifiable gain, while a zener diode is passive nonlinear device designed so that reverse breakdown is non destructive. It has no identifiable gain and can not be modelled with any any kind of feedback circuit. In fact, if you look at the plot of the water column vs. surface temperature in a previous post, it looks like the I/V characteristic of a really poor diode.
There’s gain in this system as well, a small drop in air temp makes a big difference in cooling rates.
That’s what I keep trying to get people to recognize, it’s why net radiation drops off, it’s isn’t equilibrium.
It’s not gain. The small drop in air temp is not ‘amplified’, but just happens to be the point where the air temperature becomes equal to the dew point and which occurs when the relative humidity reaches 100%, thus the temperature is also a function of the absolute humidity. Technically, the delta T is the change in temperature required to increase the relative humidity to 100%.
Globally, it certainly contributes to equilibrium as long as you account for the return of latent heat to the surface as dew condenses on it.
Yes it is, that small drop, stopped about 18F in this case
micro6500,
You understand electronic components. Can you see how a zener diode has a behavior similar to a regulator but can not be modelled as an active feedback control system like an active regulator can? This is exactly analogous to why the effect you’re seeing can not be modelled as an active control system. The knee of the temperature curve depends on what the absolute humidity and temperature were when the Sun set and for all intents and purposes, this is arbitrary and not under any kind of control.
Also, the effect is local, much like the limiting temperature over the oceans when latent heat from evaporation becomes equal to incident energy. Globally, the dew point effect is returning to the surface latent heat that came from somewhere else. In the same way, the latent heat entering the atmosphere as a result of limiting ocean temperatures is redistributed towards the poles.
Think of it like a balloon. The amount of air inside (energy) is constant and if you push in one place, it bulges out in another.
No, this isn’t modeled by a zenor, this has a family of curves over humidity, both absolute and relative (thru temp). Have you read the nocturnal 2m temp paper linked to the nonlinear cooling blog , just follow my name.
I’ve read the article and scanned the paper, and the reason the cooling slows down at the dew point is because latent heat stored in the atmosphere during the day is being returned back to the surface as the dew condenses during the night. Where the slope changes is not a set point, but an inflection point where this return starts and is dependent on the starting temperature and humidity.
During the day, there’s another inflection point where warming starts slowing down at a temperature where evaporation starts up again once the relative humidity gets low enough. Together, these two effect are hysteresis like.
Evaporation has another similar property, where below the 0C ‘setpoint’, there’s little to no evaporation and water vapor while above it, surface cooling from latent heat and GHG effects from water vapor start to become important and at about 300K, latent heat becomes more important then the incident solar power. This is evident in many of the plots in the links I referred you to, both at temperatures of 0C and at about 300K. The 0K setpoint is actually a fixed temperature threshold, but isn’t a thermostatic regulation point either. These things are all just inflection points in the transfer functions relating various climate variables.
Yet another 0C inflection point occurs as ice melts cooling the surface owing to the latent heat of fusion.
I’m also aware the dew point limit is not a constant limit and this is another reason why it’s not a regulatory process, but one of many different temperature dependent processes that distributes energy between and within the surface and atmosphere.
Another way to think of this is as the difference between a regular pyramid and a stepped pyramid. Both start at the same place (top) and traversing down a face, end at the same place (bottom), except that the stepped pyramid is not a linear descent and has a few stops along the way.
I agree with everything other than on it being active, look at the net radiation flux, as current.
In the context of feedback and gain, active and passive have very specific meanings. You should look at Bode’s book to see the formal difference. Section 1.3 (page 4) is an overview of mesh equations for passive circuits and section 1.4 (page 6) is an overview of mesh equations for active circuits. The first sentence of section 1.4 explains how a tube (gain block) and its implicit power supply are what differentiates an active circuit from a passive one.
And you didn’t do much transistor level analysis?
I did quite a bit of transistor level design and analysis. Analog and digital from DC to Ghz.
Okay, zeners are nothing more that a consistent reverse bias breakdown voltage. That isnt an analog of what’s going on.
What I found is min T follows water vapor distribution from the oceans, and the NH is more sensitive than the SH because of land mass asymmetry.
And cooling most places has a 2 state cooling system based on water vapor, actually maybe 1 stage cooling and then it transitions to its warming stage, in either case it is a switch, and it is not fixed to anything other than pressure, temp, and dew point. Co2 is not pertinent. That’s the whole point, min T is dependent in water vapor, and co2 has little to no effect.
co2isnotevil December 7, 2017 at 5:32 pm
The amount of sun coming down at noon in the tropics is on the order of a kilowatt. This is throttled by the clouds, regulating the temperature. Whether it takes 1%, 10%, or 25% of the incoming energy to do that doesn’t change the fact that it is operating in exactly the same fashion as a flyball governor.
Narrow range of conditions? Where did that come from? The combination of the various natural temperature regulating mechanisms has kept the planet’s average temperature from varying by more than half a degree over the entire 20th century … and you think that is some kind of weak system?
However, now I understand your point. The tropical temperature regulating system works exactly like a flyball governor, but it is not one.
You’ll have to explain how that works …
w.
Willis,
The narrow conditions are that it only has effect over oceans and not land, whose upper limit temperature is limited only by solar input.
The tropical temperature limiter doesn’t work like a governor which is an active feedback control system and can not be modelled as one, moreover; the set point of a flyball governor can be adjusted, which is another property of active control.
The limiting temperature over ocean is a function of when the latent heat of evaporation exceeds the incident energy. This isn’t a feedback control system and doesn’t actually regulate the temperature as the temperature is still a function of the incident energy, it’s just that as the energy increases, the local temperature increases more slowly because more energy enters the atmosphere and more energy is transported away towards the poles. It’s really a method of energy redistribution and the global temperature is still affected even as the local temperature is limited.
A zener diode behaves like a regulator, but it can not be modelled as a feedback control system either, while an active regulator constructed with active components can, moreover; an active regulator has an adjustable set point.
Thanks, CO2. I’m writing this powered by the island generator here on Liapari Island in the Solomons where I’m working on a boat.
I know the governor on that generator well. It’s a flyball governor. It is built to keep the generator running at exactly 50 Hz. As a result, it doesn’t have an adjustable set point.
You say:
So according to your theories, this is also something that looks and acts like a flyball governor, but isn’t actually one?
You also say:
Not true. Your “narrow conditions” cover all of the wet tropics, not just the ocean, and actually extend well out past the tropics over the ocean. You get the same kind of thermal regulatory system in England, I’ve seen it in action. You also get it in New Mexico, hardly the ocean, I’ve seen it there when the Southwest monsoon is in operation. Clear in the morning, and then when the temperature rises the cumulus set in. If the temperature keeps rising the thunderstorms form, removing vast amounts of energy from the surface and cooling the surface well below the initiation temperature … the “overshoot” required to govern a lagged system.
So, “narrow”? Hardly. The cloud throttle covers the important part of the planet, the tropics. Half of all the incoming energy hits the earth between 25°N and 25°S, so the throttle is placed where it will have the most effect.
So let me ask again:
In a flyball governor, a very small expenditure of energy in the form of the shifting of the flyballs is throttling the incoming steam power by hundreds of watts.
In the tropics, a very small expenditure of energy in the form of cumulus cloud formation is throttling the incoming solar power by hundreds of watts.
What’s the difference?
We’ve established that a flyball governor doesn’t need an adjustable set point, so that objection is invalid. We’ve established that the dynamics of the system are the same whether it takes 1% or 25% of the energy to run the flyball, so that objection is invalid. We’ve established that the system governs the majority of the region where the majority of the energy enters the system, so the “narrow” objection is invalid … so what is the difference?
Thanks for persevering,
w.
I’ll bet I can I adjust it to 60 Hz by adding some weight to the flyball.
“what’s the difference?”
The difference is that tropical cloud formation isn’t a global surface temperature regulatory process converging to a set point, but is the consequence of an inflection point in the transfer function between ocean surface temperatures and the water column as shown in the earlier plot. The local effect it appears to have in the tropics is offset by excess warming towards the poles.
It’s not regulating the global temperature, but smoothing temperature change across space and time.
co2isnotevil December 7, 2017 at 8:48 pm
Yes, and I can adjust it by breaking one weight off … so what?
w.
co2isnotevil December 7, 2017 at 9:06 pm Edit
What “previous plot”? I didn’t put up any plot of what I think is happening.
I love these kinds of uncited, unreferenced statements. You know this how?
CO2, the earth runs at a temperature well over what the S-B equation predicts. How warm it gets depends inter alia on the clouds … which come and go all the time. And the wind. Which goes up and down all the time. And the albedo. Which is constantly changing. And the presence or absence of aerosols from volcanoes. Which come and go.
But the temperature of the earth hasn’t changed by 1% in the last 300 years.
Two choices. Either we are incredibly lucky … or there is some kind of thermal regulation going on that keeps the temperature within very narrow bounds. As a man who had dealt with governors, I assure you that regulating a system to within 1% is not something that happens by luck.
So I would ask, if you don’t think that the various emergent phenomena I’ve describle are regulating the earth’s temperature to within ± half a percent over 300 years … then what is? The fact that the sun is stable doesn’t explain it, we’re running way about what the sun would predict.
Here is another puzzle. Despite the fact that there is much more land in the northern hemisphere and that the surface albedo is quite different between land and ocean, the overall albedo of the two hemispheres is almost identical. In other words, the clouds take up the slack … again, luck, coincidence, or regulatory mechanism?
To me, the stability of the system is clear evidence of SOME kind of temperature regulation. I have demonstrated how this regulation takes place in the tropics in a number of posts, using a number of datasets from a number of locations.
So … are you saying that there are no thermoregulatory mechanisms at work? And if there are … what do you think they are?
Thanks,
w.
Willis,
The plot I reference was one I supplied in an earlier reply and shows the relationship of monthly averages between the surface temperature and the water column for each 2.5 degree slice of latitude.
I know that power is transferred from the tropics to the poles for many reasons. First, because during the long polar winter, the poles remain warmer than they would without power coming from the tropics. My analysis of the ISCCP weather satellite data also confirms and can quantify this transfer of energy along with other known modes of transfer like the Gulf Stream.
The SB equation predicts the exact temperature of the surface once you apply a non unit emissivity, which is about 0.61. This can be derived from reflectivity and absorption coefficients and average cloud properties, all of which are well reported in the ISCCP data set. It also happens to be equal to the ratio between the 255K emissions of the planet and the 288K emissions of the surface (255/288)^4.
The average temperature hasn’t changed very much in the last 300 years because the solar output has been relatively constant and net effects of orbital change haven’t added up to much recently. In fact, this has been the case for the last 20K years or so and we have been relatively lucky that the climate has been stable enough for mankind to advance out of the stone age. Things will be quite different in 11K years when perihelion aligns with the N summer, rather then the N winter as it currently does. The difference between summer and winter will be quite a bit larger the
I measure an average albedo of about 0.31 in the S hemisphere and 0.29 in the N hemisphere. Both vary sinusoidally around this mean during the year with a little more variability in the S hemisphere.
The apparent global regulation of averages is simply a consequence of a relatively fixed number of Joules arriving at the planet every year. Locally, it actually varies quite a bit around the mean during the course of a year and nearly all of the average variability is sinusoidal in nature. It’s not a regulated system, but a causal system.
They are fixed for a reason.
Willis,
The only thing I can think of is that the average emissivity, e ~ (255/288)^4, is controlled such that 1/e = 1 + e, although it’s not clear to me yet why this would be the ‘attractor’ of the system. It does happen to be true and the monthly average emissivity has varied by no more than about 3.3% around this mean during the last 3 decades.
If it’s the emissivity that’s ‘controlled’, it does mean that incremental CO2 will be compensated for, but this doesn’t mean the temperature is regulated as the temperature will still go up an down as solar input varies.
I said:
You replied:
co2isnotevil December 7, 2017 at 10:50 pm
I give up. If you won’t even discuss, much less deal with, my objections I’m not interested in continuing the discussion. The sun is not what is keeping it stable at 33° or whatever above the S-B temperature. I’ll believe you for the moon. But for the earth?
The sun provides a stable floor in terms of AVAILABLE power … but even that is meaningless, because the clouds allow in variable amounts of it over the year. So the amount of energy ENTERING the system is not constant … and thus, “the sun” can’t be the answer to why the temperature is stable.
w.
Willis,
You are incorrect when you state that the Earth does not obey the SB Law. It must as this is the ONLY law of physics that relates temperature to radiation. The Earth is not like the Moon which is close to an ideal BB. The emissivity is part of the SB equation as well and when you set the emissivity to 0.61, the surface temperature associated with planet’s emissions is exactly what it should be, moreover; as the surface temperature varies, the emissions follow according to the SB law.
While the planet is not an ideal BB, the surface itself is relatively close. Since the Earth does not emit all of the BB emissions of the surface into space, the emissions that don’t leave the planet can only be captured the atmosphere and temporarily stored in GHG’s and clouds. Since the atmosphere has a limited capacity to store energy, in the steady state, it must be emitting the same amount of energy that it’s absorbing. Some of this is emitted into space and the rest is emitted back to the surface. It’s this return of past surface emissions temporarily stored by clouds and GHG’s, combined with new power from the Sun that makes the surface warmer than it would be due to the Sun alone.
The energy from the Sun is mostly constant when considering yearly averages. If there’s a little more than average, the planet is a little warmer and if there’s a little less, it’s cooler, Average cloud cover is also relatively constant.
You are focused on the low level local mechanisms the atmosphere uses to redistribute energy, whereas I’m focused on how the planet MUST behave from a macroscopic point of view in order to conform to the laws of physics. The primary mechanism establishing the surface temperature is the T^4 dependence of the SB Law which is independent of the emissivity.
co2, let me suggest that you read these two posts (post1, post2) about the stability and symmetry of the climate system. It is NOT due, as you claim, to the stability of the sun.
w.
Willis Eschenbach December 6, 2017 at 12:18 pm Edit
co2isnotevil December 6, 2017 at 9:39 am
micro6500,
The climate system is not an active system. The distinction between an active and passive system is active gain. Active gain is powered gain where more power comes out of the amplifier than goes in and the additional output power comes from an implicit power supply. This is what Bode means by the requirement for an implicit power supply powering the gain that he spells out in the first paragraph of his book.
The effect of the tropical cumulus cloud field plus the tropical thunderstorms is a temperature-threshold-based control system regulating the tropical temperatures.
Active or passive?
w.
Passive, for the reasons cited above.
Active or passive? W.
my 2 cents. It’s ACTIVE from a circuit analysis perspective. (All Earth system excepting geothermal are passive from a physics perspective.)
An ‘active’ circuit element is one which can amplify via negative resistance. For example an NPN transistor circuit can be configured so increased current results in a decreased voltage drop (from collector to emitter).
Tidal resonance in the Bay of Fundy is PASSIVE because it is analogous to a high Q RLC resonant circuit consisting of all passive elements. On the other hand, the solar-wind mediation of global temperature is ACTIVE because it analogizes to a small signal transistor amplifier, a circuit which exhibits negative resistance.
When increased TOA insolation results in decreased surface temperature (because of tropical cloud formation), it is analogous to negative resistance. Therefore from the circuit analysis perspective, the cloud thermostat is an ACTIVE circuit.
blueice2hotsea,
You seem to be confusing active with dynamic and/or non linear. Yes, the climate system is both dynamic and non linear, but there’s no active gain and a circuit model of the climate must be strictly passive.
The necessary requirement for an active circuit is an implicit, internal source of Joules to power the gain. A power supply is even required to manifest gain from the negative resistance of a tunnel diode. Such a power supply does not exist in the climate system. The climate is a passive system with Joules coming in, Joules going out and no implicit source of additional Joules to amplify the output making it larger than the input. Confusion arises as the climate feedback model incorrectly assumes that the surface [temperature] is the output, while the output of the system is actually the emissions from the planet into space.
The implicit source of Joules can not be the Sun, as the Sun is the source of all forcing. Considering the Sun as both the implicit power supply and the forcing is no different than connecting the input of a stereo amplifier (forcing input) and its power cord (implicit power supply) to the output of your turntable (forcing source).
Keep in mind that we’re talking about power gain as power gain is required to boost 1 W/m^2 of forcing into the 4.3 W/m^2 required to replace the emissions of a surface 0.8C warmer as presumed by the IPCC. The extra 600 mw/m^2 from the 1.6 W/m^2 of actual surface emissions per W/m^2 of forcing is not a manifestation of gain, but a manifestation of delay and from a circuit perspective can be implemented with a delay line that returns some fraction of prior surface emissions back to the surface in the future.
Consider a transformer, which is a passive device. It can manifest apparent voltage gain (or current gain), but will never manifest power gain since COE limits the power leaving the transformer secondary to be less than the power arriving to the primary, just as COE limits the power leaving the planet to the power arriving.
@co2,
You’re wrong. The Sun supplies just such Joules, which are absorbed in a number of different systems, and it is this power that controls how fast it cools at night, just as if there was a transistor between the surface and space under clear skies that is on at dusk, and shuts off when air temp nears dew point.
You can’t do that with a zener without changing it’s breakdown voltage, and that’s baked into the die. What is needed is a switch, and we have a temperature controlled switch.
micro6500,
The Joules from the Sun are forcing, nothing more, nothing less. These Joules simply can’t also be the Joules coming from the implicit power supply that’s a necessary part of any system with active gain.
I can trivially create a circuit to model the relationship between the Sun, the surface and the planets emissions using a passive network (i.e. no internal source of power). The model is comprised of a resistor with a significant temperature coefficient, a capacitor, a delay line and a few transformers. Relative to the average behavior, this model works better than any GCM. The little snippet of code I showed you in an earlier response illustrates the basics of this model.
The dew effect you observe is only half of it. If you look at when temperatures rises, there’s another inflection point where warming slow down once evaporation kicks back in. This is a classic example of hysteresis.
Explain how slowing down warming during the day, combined with slowing down cooling at night is having any effect on the average? If it’s not keeping the average constant, it’s not regulating the temperature. Otherwise, the relationship between the surface temperature and total forcing goes as T^4 and the data is absolutely clear about this.
You lack imagination. And you’re wrong, you can not model cooling based on passive elements in anyway that can be superimposed over actual physical processes., the decay is not equilibrium, nor does it follow a capacities discharge rate, and where do you expect to find a transformer?
It has a single temperature controlled switch (cooling). The fact you think it’s going to give process level temperature control is just silly.
Imagination can’t defy reality. Beside, the passive model I have works exactly relative to how the AVERAGE responds to change.
You still haven’t explained how your proposed mechanism changes the average. Unless it does this, it can’t be a regulation mechanism. All it’s doing is redistributing energy captured during the day into the night. The day time max is lower and night time min is higher while the average remains the same. The changing slopes are not characteristic of regulation, but of hysteresis.
And the average response? You’re kidding, the average?
micro6500,
The average is all that matters relative to any change in the steady state and this is what climate change is all about. In principle, it’s not an average temperature, since non linearities preclude temperatures from being summed and averaged, but it’s the equivalent temperature of a BB emitting the average emissions of the surface, where emissions can be legitimately summed and averaged.
The average emissions of the surface are linearly related to the average absorption and emissions of clouds and GHG’s, the emissions of the planet and the incident energy. If you look at the scatter plots here,
http://www.palisad.com/co2/sens, all of these linear relationships are clearly supported with the data.
Averages are meaningless if you do not understand the underlying circuit. You’ve modeled meaningless average values.
No. I’ve modelled averages whose variability is validated with data.
Again, I’ll ask you how does redistributing energy from the day time into the night time to slow down cooling, when the extraction of that energy during the day slowed down warming?
You seem to be falling into the same trap as warmist who believe that energy can just magically appear out of nowhere.
That’s still not the underlying process. Water and water vapor move, from tropics towards to poles, and it has to cool on the way.
It cools mostly by returning the latent heat to the surface either as rain, dew or weather in general.
You don’t seem to acknowledging the importance of averages. Averages are all that matter relative to long term change. It’s not what happens in 1 hour at night, but the average of what happens across the whole planet over days, months or years.
You must agree that the average temperature is warmer in summer and cooler in winter. This difference is not meaningless, is not by accident. defies the existence of a regulatory process and is strictly causal to the amount of incident solar energy.
What the transfer of energy from the tropics to the poles does is reduce the sensitivity when expressed as degrees per W/m^2 while the sensitivity expressed as W/m^2 of surface emissions per W/m^2 of forcing is relatively constant from pole to pole. In fact, it seems to reduce it to the sensitivity to that of a BB at the surface temperature, which is only about 0.2C per W/m^2 which is less than the theoretical upper limit of 0.3C per W/m^2.
The reason this happens is that given the sensitivities 1/T^3 dependence (when expressed as degrees per W/m^2), the reduction in energy in the warm tropics has a smaller effect on the temperature than adding that same amount of energy to the much colder polar regions. This is what makes a sensitivity metric as degrees per W/m^2 so bogus. By this metric, the sensitivity is different everywhere on the planet and every day while a sensitivity metric expressed as W/m^2 of surface emissions per W/m^2 of forcing is independent of temperature and mostly constant everywhere.
Have you read my 3 pages at wordpress? Before you make assumptions about what I think, and find important, maybe you can look at the work I’ve done that shows the results of the data I’ve looked at in what I think has relevance. Just follow my name.
But let me add the bit about summer and winter averages treats me like an idiot, have you calculated that slope for every surface station and looked at various areas seasonal slope? You have no clue.
I’ve looked at your stuff and understand what you’re seeing. I just don’t see it as regulating the temperature.
I see this (and some others) as moderating temperatures by moving energy that would otherwise make an already hot place warmer to make a cold place warmer instead. Whether this is between day and night or the tropics and the poles, it’s the redistribution of a finite pool of Joules and has a zero sum influence on the average emissions and its corresponding EQUIVALENT temperature.
My point about winter/summer is not to denigrate, but to make the point that the temperature is not regulated, but even here there’s some moderation that makes the winter a little warmer at the expense of making the summer a little cooler. This is mostly in the form of the oceans thermal inertia.
Moderation and regulation are two different things. Moderation draws the peak temperatures closer together, while regulation would keep the midpoint between the peaks at a constant temperature.
No, summer and winter are from changing length of day compared to night, it changes, that alters incoming energy, as does the our orbit that has the NH closer to the sun in the winter.
On that, the ocean cycles shift warm water around, changing the distribution of water vapor. And the NH responds more than the SH to changes in the oceans because there mire land in the NH.
Yes, the day length is changing resulting in the amount of incident energy changing. If the Sun was weaker or stronger, the temperatures would be different even as the day length remains the same. If the length of the day was the thermostat set point as you suggest, the temperature would be the same independent of the strength of the Sun.
Yes, the SH changes more slowly due to its larger fraction of water and the result is temperatures are moderated more in the S than the N which translates into a smaller difference between summer and winter in the S than in the N, even as the forcing power varies over a wider range in the S owing to how perihelion aligns with the seasons.
Power gain is an important differentiator between regulation and moderation. If the atmosphere exhibited power gain in any way shape or form, it would be violating COE. Regulation requires high power gain, while moderation is an intrinsically passive process, as evidenced by the moderating effect of oceans, which from a circuit point of view can be modelled as a passive capacitor.
Did I mention I calculate the insolation for every station(20 some thousand), for every day from 1940 on? As the days get shorter, it cools longer at night, that reduces day time air temps, and dew point. Go look at my pages, you still do not know all I’ve done so far.
Switching power supply. All it needs is a nonlinear switch to work.
I understand what you’re seeing and it would surprise me if you didn’t see this owing to the relationships between the solar input, temperature, absolute humidity, relative humidity and dew point.
Which comes first? Obviously the solar input and everything else just follows. Even the absolute humidity, whose average is dependent on the average temperature while it’s instantaneous value varies over a relatively wide range around this average. If you look at the earlier scatter plots, the relationship between the temperature and the water column, which is proportional to absolute humidity, follows a very tight distribution.
The dew point and relative humidity aren’t actually measured by weather stations, but are calculated from the measured temperature and absolute humidity.
The atmosphere can supply the non linearity you need, but there’s no active switch, it’s just the non linearity combined with the hysteresis effect of rising and falling temperatures relative to evaporation and condensation.
Even if you can model this as a switching supply, the atmosphere can’t. The atmosphere can only implement it as a passive system because it has no internal source of energy to boost the output. Stored energy doesn’t comprise an internal source, as that stored energy came from the forcing (Sun) in the first place.
Yes it does, it’s just delayed joules, and there’s huge areas evaporating ocean, and warm and cold pools and gyres.

And you can see the effect of this transition in net radiation
And this
Shows that the optical window has to have 20-30W/m^2 outgoing radiation, even as temos have stopped falling under clear skies. Something is powering that balancing radiation, and it’s balancing which is why co2 doesn’t affect it much, if it was warmer at sunset, it just doesn’t switch to slow cooling till it drops the same as the increase. If it was a 1F increase, and it cools at dusk at 4F/hr, it delays the switch for 15 minutes. If the final cooling rate is 0.5F/hr, it reduces cooling by the same 15 minutes, so a 1F increase has a residual of 0.125F. And in nights it stops cooling it’s 0.
If you think about it the planet is the bulb of a liquid glass thermometer, and column height is temp once you calibrate it.
The surface is always emitting based on its temperature and cools as it emits energy. It stops cooling in this case because once dew starts to form, the latent heat that was removed from the surface by evaporation is returned, offsetting the emissions keeping the surface temperature from dropping. Of course, once frost precipitates most of the water out of the atmosphere, the cooling will never slow down until the Sun rises.
I don’t see how this precludes an effect from CO2 though, as the additional CO2 can still increase the day time high temperatures just like a stronger Sun would.
It there’s anything mitigating the effect of CO2, it’s something that drives the average ratio between surface emissions and planet emissions because the data indicates that this ratio is one of the most constant properties of the climate system. The next most constant property is the average ratio between the surface emissions absorbed by the atmosphere and the fraction of those emissions returned to the surface. The monthly averages of both varies by no more than a few percent around its mean which in the first case is 1.615 and in the second case is 0.50.
Here is my answer from last night.
“If it was a 1F increase, and it cools at dusk at 4F/hr, it delays the switch for 15 minutes. If the final cooling rate is 0.5F/hr, it reduces cooling by the same 15 minutes, so a 1F increase has a residual of 0.125F. And in nights it stops cooling it’s 0.”
Do you not understand this? What makes it a regulator is that the switch between these two states is a temperature property. And is do to the heat of evaporation that has to be liberated to allow condensation, and it’s 4.21J/g more than just cooling that air and water mass by 1 degree.
What I have been explaining is why the second one is constant. The energy that has to be liberated is the source of the DWIR, but because they average it out, you can’t tell what process is the cause. that’s what the chart from Australia shows, that net radiation switching state.
I understand what you’re seeing and saying, but it’s not characterizable as a switching regulator. I certainly see how this effect acts to moderate highs and lows by transferring energy from day to night and from the tropics to the poles through evaporation and condensation, but that doesn’t correspond to an effect that regulates the average.
The second constant, that is the fraction of surface emissions absorbed by the atmosphere and returned to the surface, is constant because the geometry is constant.
The atmosphere ultimately emits the surface emissions it absorbs over twice the area over which it absorbed that energy , thus it emits half out into space and the rest back to the surface.
The effect you’re seeing certainly contributes to the 0.62 ratio between surface emissions and planet emissions, but so do innumerable other effects and you can’t focus on a single effect to the exclusion of the many others all acting in concert. The fact that this ratio is relatively constant is not regulation, except to keep the sensitivity when expressed as W/m^2 of surface emissions per W/m^2 of forcing relatively constant. This is not a temperature regulating effect but could be construed as a sensitivity regulating effect. None the less, it’s not active regulation, but the result of a passive and causal response to incident forcing and the 0.62 can be calculated top down as a function of GHG concentrations and the properties of clouds, so unless the properties of clouds adjust in response to CO2 concentrations, there’s no offsetting effects to increasing CO2 concentrations. We don’t see any effects because the effect is far, far smaller than claimed and not because it’s being mitigated by other processes.
“I understand what you’re seeing and saying, but it’s not characterizable as a switching regulator. I certainly see how this effect acts to moderate highs and lows by transferring energy from day to night and from the tropics to the poles through evaporation and condensation, but that doesn’t correspond to an effect that regulates the average.”
Of course it does, you just don’t see it because you’re looking at the ripple, look at temps scaled in degrees K from 3K, because that’s the the reference point in the system.
And of course I can focus on one effect if it’s forcing is 10:1 all the others.
You are still ignoring that there is an energy boundary to air temps dropping below dew point. A big one.
I’m not ignoring what you’re referring to as an energy boundary. As I see it, it’s simply a hysteresis effect between the temperature and atmospheric water relative to when evaporation starts (the inflection point as temperatures rise) and when condensation starts (the inflection point as temperatures fall). It’s simply the consequence of latent heat redistributing a fixed pool of energy across time and space.
I also don’t see the 10:1 difference you’re citing. The temperature drops until dew starts to form, where the latent heat from the original evaporation is returned to the surface slowing down it’s cooling. As temperatures rise, water starts to evaporate slowing down the warming. I just can’t see how these two offsetting effects have any effect at regulating the surface temperature, although they clearly moderate the difference between min and max temperatures.
Just to be sure, do you understand the distinction I’m making between regulation and moderation?
That’s not what that means. Just the flux is defused by 50% if that’s a correct ratio change in geometry.
I’d be the difference of the brightness between a flashlight focused into a beam, to one focused as wide as possible. The flux is reduced.
Wait, you stuck in a nonlinear temperature switch in the way of a temp coefficient. But you have to select values to get your cluge to work, mine is self biasing. And I still don’t get how you can’t see a pulsed forcing, and a pulsed power source are the same.
You still haven’t explained how reducing the max daytime high and increasing the min night time low is a regulatory process. Over any 24 hour period, it’s a zero sum game.
What matters in min temp, and how much it goes up. Dew points set the clear sky low, because it has to lose 4.21 x as much as just dropping air temp 4 hrs earlier, because the rel humidity was a lot lower. To condense that much water vapor it can’t emit radiation to space, it collides and is absorbed before that. That’s the GHG effect, it just doesn’t turn on till middle of the night after the temp has dropped.
That’s why it’s a regulator, it slows after it cools.
No. The min temp alone means absolutely nothing unless the max temp is unaffected, and this is not the case and your plot is very clear about this. There are inflections in the temperature slope both as evaporation kicks in and warming slows during the day and as dew forms at night returning that latent heat to the surface slowing down its cooling.
Just think about the origin of the Joules that are keeping the min temp from falling faster. They have to come from somewhere.
Yes they come mostly from the tropical oceans, and are blown around the globe cooling. This night time process runs on that, and by itself it’s actually loses energy, but the wind blows, new air is blown in. When it’s stationary, some dew is absorbed, lost to the water table, that drys the air, and the daily range is larger.
Yes. And when this energy was removed from the surface, the surface warming at the point of evaporation slowed down. The result on the average temperature (again the EQUIVALENT temperature of average emissions) is zero. How is this regulating the surface temperature? Just because a different place cools by evaporation than is warmed by condensation doesn’t negate the fact that it’s a zero sum effect on the average.
You need to grasp the big picture. You can’t look at one small, local night time effect and extrapolate it to the whole. You need to account for all effects across the entire planet all at once.
What likely leads to your confusion is Trenberth’s adding latent heat to the energy balance and bundling its return to the surface as ‘back radiation’. In fact, the latent heat and its return to the surface has no NET effect on the average emissions and is corresponding temperature. What you are observing is part of the return of latent heat to the surface that Trenberth mis-labels as ‘back radiation’, Clearly, dew is not radiation.
co2isnotevil December 14, 2017 at 11:08 am
Thanks, co2, but I fear I am confused. Perhaps an example will help. What I’ve said is that there is a control system in the climate which constrains the temperature between remarkably narrow limits (e.g ± 0.3°C over the 20th century).
So let me start with a simple question. Is a flyball governor an active or a passive control system?
According to you, it is a passive control system. Is my understanding of your position correct?
Thanks,
w.
co2, can you tear yourself away from micro6500 and actually answer my simple question? I’m starting to think you’re ignoring me, which is very damaging to my self-esteem and might lead me to need a safe space with puppies and hot chocolate to recover …
w.
Willis,
Sorry, I’m not ignoring you. I’ve actually been skiing for the last several days with limited Internet and will often seem to disappear for weeks at a time until the snow is gone. Besides, I thought I already answered the flyball question. This is an active system as it exhibits significant gain in the feedback loop.
You need a lot of gain so that a small difference can be amplified to have a large effect, where the throttle is the controlling variable whose mechanical input is amplified by adding fuel (or air) to the boiler. The throttle amplifies the relatively small difference produced as the flyball spins faster or slower than expected. The closed loop gain here is huge and on the order of many thousands with an even larger open loop gain (i.e. throttle wide open). By contrast, the open loop gain of the climate system is unity and with unit gain, there can be no more power exiting the system than is arriving, thus there is no amplification.
As I’ve explained many times, the climate system can not be represented as a feedback amplifier, per Hansen, Schlesinger and Roe based on Bode’s analysis. A feedback control system is even more constrained and the climate system does not conform to one of these either.
The effect you’re seeing is the redistribution of latent heat from the tropics to the poles. While this does clamp tropical high temps over the oceans, the energy doesn’t just disappear, but is transferred to polar latitudes making them warmer then they be would be otherwise. To me, the effect you describe is a global redistribution of energy operating over seasonal scale times and distances, while the effect micro6500 is seeing is the same mechanism acting diurnally and locally.
It’s a moderation effect and not a regulation effect. It would be a regulating effect if and only if the cooling in the tropics was not accompanied by warming elsewhere, just like micro6500’s effect would be a regulating effect if and only if the slowdown in cooling during the night was not accompanied with a slowdown in warming during the day,
Tamino, is a expert statistician with multiple college degrees who works for an elite analytical company. Grant Foster is an out of work musician.
–> Ray in SC December 5, 2017 at 3:37 pm said:
No, he spouted about a statistical test that sounds well and good but he failed to point out, that sample size is key and that t-tests are unusual or unreliable when the sample size is low. And that is the point at issue here. Calculating the probability of a null hypothesise on too small as dataset is worse than no significance testing at all!
There is a false confidence built it this specific statistic that favours trust in the test itself. For example, the smaller the dataset, the probability that the sample will be further away from the null hypothesis is greater even when the null hypothesis is true.
However, these statistical results have absolutely nothing to do with reality!* Even when you understand it, the theory – which I actually also happen to love – was originally termed “Experimental Probability” because what happens in the real world can not be incapsulated. Every moment, every action, is an experiment. Very large numbers of these “experiments” will approach the “theory”, but that is all we have; to-date!
We – many of us here – keep coming back to this argument about the validity of probability distribution and its application in the “real world”.
*Okay, they do have something to do with reality, I concede that argument but the connection is not coincident with the particular point I’m trying to make here. 😉
Willis Eschenbach December 7, 2017 at 12:57 am
Upstream, I said as follows:
However, Philip has emailed me and has vigorously denied that he ever posting anything over at Slandering Sue’s place. Unfortunately, since he posted for some time under an alias, I can’t check that out … it’s one of the downsides of using an alias.
So, if he is correct (and there’s no way for me to check), then I have wronged him. So let me say here and now that IF in fact he did NOT post anything at Slandering Sou’s, then I unreservedly apologize for and retract what I said about that episode.
Regarding the other fact, that he is on permanent moderation, on the other hand … what I said about that I still hold to.
Best regards to all,
w.
Willis Eschenbach December 14, 2017 at 12:26 pm
co2, I’m reposting my question here because you don’t seem to have seen it above …
w.
co2isnotevil December 14, 2017 at 11:08 am
Thanks, co2, but I fear I am confused. Perhaps an example will help. What I’ve said is that there is a control system in the climate which constrains the temperature between remarkably narrow limits (e.g ± 0.3°C over the 20th century).
So let me start with a simple question. Is a flyball governor an active or a passive control system?
According to you, it is a passive control system. Is my understanding of your position correct?
Thanks,
w.
co2isnotevil December 18, 2017 at 12:42 pm
Perhaps, but you are damn sure ignoring the question I’ve asked three times now. However, I’m a patient man, I’ll ask it again.
Is a flyball governor an active or a passive control system?
According to you, it is a passive control system. Is my understanding of your position correct?
Thanks,
w.
co2isnotevil, you had said that the system of thermal regulation of the earth by tropical clouds throttling the incoming energy was not an active control system. To clarify matters, I asked:
You answered:
co2isnotevil December 18, 2017 at 2:49 pm
Thanks, sorry for my impatience, hope the skiing was great.
However, you’re disagreeing with yourself. Before, you said:
co2isnotevil December 14, 2017 at 11:08 am
But if an active system requires a separate power supply, where is the “power supply” in the flyball governor, which you say is an active system?
Thanks,
w.
WIllis,
Your position seems to be that the gain is modulated in response to system changes so that the output (temperature) remains constant. I see evidence to the contrary where the gain is relatively constant and the resulting surface emissions are the constant gain times the post albedo solar input and that this gain is independent of total forcing and the subsequent surface temperature over the entire range of surface temperatures and corresponding emissions found on the planet.
Your position would predict that the gain decreases as temperatures increase in order to mitigate the cause of the increase. This is not a characteristic of the measured data when the gain is expressed in the proper dimensionless ratio of power densities. Of course, when the gain is expressed in non linear terms such as degrees per W/m^2, the T^4 relationship comes in to play and the gain decrease as temperatures increase, but this has nothing to do with active control and is the consequence of the SB Law.
I’ve also been able to calculate the climate gain as a function of GHG concentrations and cloud properties and I get the same value that I measure, at least within the margin of error, moreover; the calculated gain increases as CO2 concentrations increase. I don’t see any evidence that cloud properties are changing in order to offset changes in GHG concentrations, but that could just be that the incremental effect of increasing CO2 concentrations is still too small to discern from the error and natural variability.
Or you’re wrong. You can pull static forcing out, but that’s what they do wrong, it’s not static!!!!!!
🙂
Willis,
The power supply is the fuel powering the boiler and the coarse gain control is the throttle. In an electronic amplifier, the gain control is typically a variable attenuator driving a fixed gain amplifier. In the steam engine case, the gain is modulated towards a specific mean by the action of the flyball.
To the extent that the climate gain is stabilized, I would tend to agree, but this is not stabilizing the temperature except to the extent that the input is relatively constant. The climate gain is about 1.6 which is 1/e, where e is the ratio between the RADIANT emissions of the planet and those of the surface and is the equivalent emissivity of a gray model model of the planet.