Back in 2014, Anthony put up a post called “NOAA shows ‘the pause’ in the U.S. surface temperature record over nearly a decade“. In it, he discussed the record of the US Climate Reference Network (USCRN). I can’t better Anthony’s description of the USCRN, so I’m stealing it to use here:
This data is from state-of-the-art ultra-reliable triple redundant weather stations placed on pristine environments. As a result, these temperature data need none of the adjustments that plague the older surface temperature networks, such as USHCN and GHCN, which have been heavily adjusted to attempt corrections for a wide variety of biases. Using NOAA’s own USCRN data, which eliminates all of the squabbles over the accuracy of and the adjustment of temperature data, we can get a clear plot of pristine surface data.
Here’s a typical USCRN station

So … what does the USCRN show in 2017? Well, about the same as it showed in 2014 … no statistically significant warming since the start of the record. Here’s the graph from their website.

Trend = 0.6 ± 0.9 °C/decade, p-value = 0.31, far from significant. Source: NCDC National Temperature Index time series plotter
So … still no significant trend. Yes, the dataset is short, 13 years … but there are a number of 13-year periods in US temperature history which do have significant trends.
Finally, do you remember January 2006, when the entire US averaged four degrees C above average, twice the scare-factor temperature rise of two degrees C?
Well, me neither. Many people, including scientists who should know better, hyperventilate about a tenth of a degree C, but we hardly remember four degrees C …
Ah, well. Here on the north coast of California it’s raining, which is always a wondrous thing. The leaves on all of the plants are getting a brisk washing, the trees are shrouded in a luminous mist. The only dissenter is the cat …
Best to all, in sunshine or rain,
w.
Note: I trust Willis won’t mind that I improved the title a bit, changing it to “NOAA’s USCRN Revisited – no significant warming in the USA in 12 years”
Also, I had a similar story in 2015 -Anthony
I find it very hard to believe those 2 Winter spikes of 7 degrees above normal.
Very odd indeed, do you know where the high temps were?
I did a post on the 2012 record in USCRN: https://climatebeagle.wordpress.com/2014/12/31/digging-into-the-definition-of-warmer/
It was really (I think) a mild spring in a couple of locations that led to it being a record year.
Except they are for Single Months and across the whole of the stations.
7 degrees is aweful lot. It would be nice to see the actual station data to see if it was mainly localised to particular states.
2012 was the warmest March on record at MSP…. It was a warm month across most of the country if I recall.
Wow…it got that warm and no tipping point?
I think I was in Sioux City IA In March and it was 91 deg. Crazy warm winter/spring.
AC,
I had this same kind of concern when I first started working with USCRN data. Once I dug into individual station data to answer my concerns, I realized individual station data varies much more than the this with just normal weather variability. The USCRN data typically smooths this out because of the distribution of site locations. During occasional months, however, a slow moving warm or cold air masses can impact enough stations to shift the combined monthly average up or down. In 2006, there were 77 USCRN stations active and with sufficient subsequent data to use in anomaly computations.
NS,
You should probably run a low-pass box filter over the maps to smooth out the unrealistic straight boundaries. The ocean temperatures (extrapolations) look particularly artificial.
Actually, there are a few glitches that I’m looking into. That’s where the sharp edges come from. The plot does show nodes and shade between as advertised, but there are some bits of missing data mainly affecting oceans near shore. But ConUS is not affected.
I’ve fixed the glitch and updated Jan 2006. I’ll leave the whiskery version of Mar 2012 for the record.
Here (from here) is a map of January 2006. It shows each of the GHCN V3 stations (which in the US are the USHCN stations) reporting that month, with a triangular mesh, colored according to GHCN unadjusted monthly average at each station, shaded between. There was a very warm patch around the Great Lakes and upper mid-west.

And here is March 2012

And I enjoyed every minute of it!
Thanks Nick. A picture is worth a thousand words 🙂
Looks very much like history repeating itself.
Somehow the here and now always dominate:
21 Nov 2017 CONUS GFS.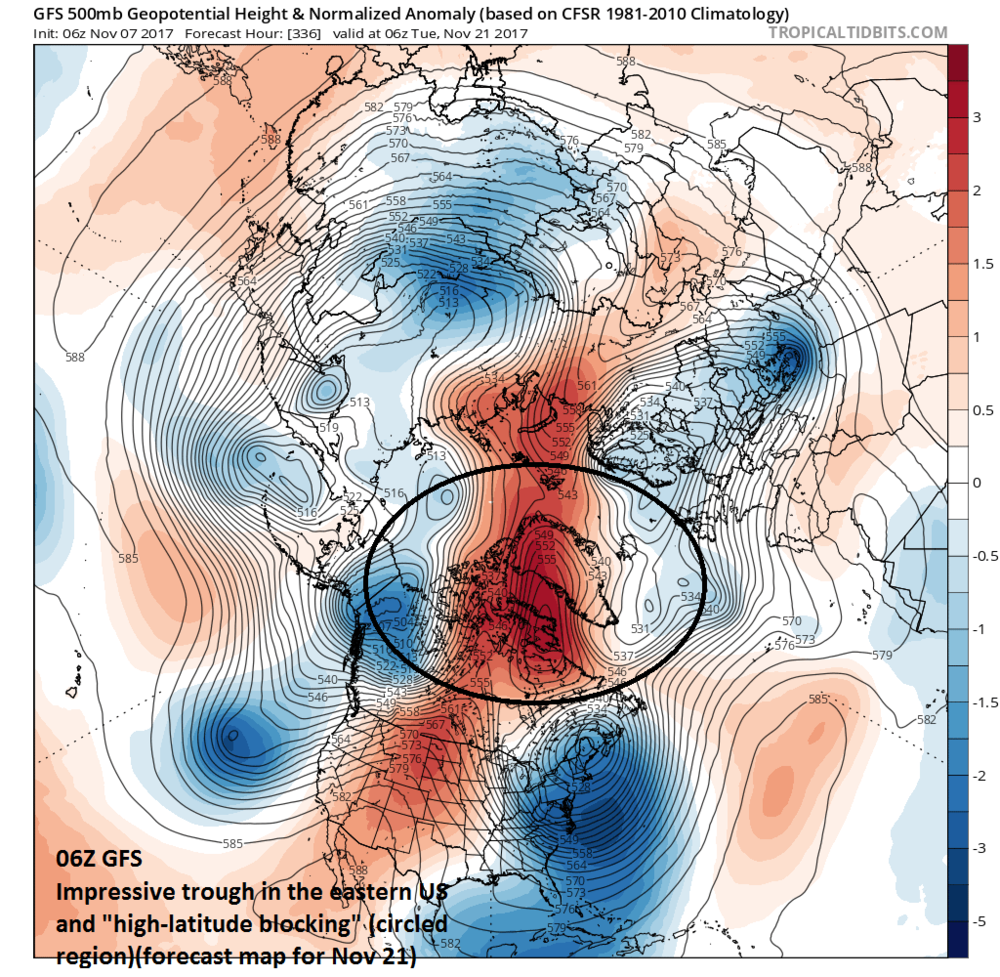
Just wx, not climate.
We are entering a climate optimum, just like the Romans had 2000 years ago for several hundred years.
We should enjoy it, and not invoke pagan blood-letting ritual$ to appease the CO2 daemons.
It is January around the great lakes region.
Perhaps saying it is “less frigidly cold than average” would be more accurate than calling it warm.
Funny thing happened last Winter when “red hot” air over the North pole moved southward into the southern US: We froze our nuts off, and by then the air was modified and warmer.
Hi Nick,
Thanks for the global map you referenced at https://moyhu.blogspot.com.au/p/blog-page_24.html
Looking at Australia, we see clear problems of sparse information, with distortions pointing to lonely Giles weather station. (Readers, look a little north of where the Sth Aust E-W top border meets the N-S WA eastern border. Or enter -25.04, 128.30 into Google Earth search).
Do you ever reach a stage when you say, I shall not publicise this matter because the data are not good enough to support it? Geoff.
Geoff, the Australian Data is crap as shown by Jennifer Marohasy, they are measuring 1 second spikes and truncating low readings. Both things against WMO practice.
The Australian BOM either have no clue about how to do the job or they are deliberately biasing the Data.
I know which version I believe.
Geoff,

“Do you ever reach a stage when you say, I shall not publicise this matter”
No. The data are what they are. I am not responsible for them; I just try to show them as clearly as possible. But I think the anomaly map puts the issue of sparsity in perspective. I show below the map of Australia, Jan 1957 (random choice), with Giles ringed. There is a site at Warburton Range fairly close, but otherwise it is a long way to anything else. But you see that the points that it does connect to are not that different. Barrow Creek, NE and bluish, is an exception. And that is the point of anomalies. They are fairly coherent over long distances. We’d like more samples, but these give a reasonable picture of W central Australia in Jan 1957. And of course, with averaging over the whole globe, the wrinkles you do get with sparse sampling tend to even out.
For at least the second winter in a row, record-breaking cold is about to descend upon the USA:
http://abcnews.go.com/US/record-low-temperatures-northeast-weekend/story?id=51034673
Last year was an El Nino winter, but this one isn’t or won’t be. Thus regardless of WX conditions setup, winters are again getting colder. Shades of the 1960s and ’70s, when CO2 was also rising.
CO2 isn’t a pimple on the posterior of the mighty ocean oscillations, the PDO and AMO.
Are the lines joining station nodes on the graph of Australia determined by the selection of the triangular mesh?
I don’t see why an anomoly would give a better quantification of spatial correlation of temp data than the raw values. The correlations would be identical. One correlates mean-centered difference scores while the other correlates the original values.
For breaks of continuity in the time series data, anomolies bring about their own problems too, because now the choice of what time window to use to compute the mean (and from that the difference scores i.e. anomolies) can radically influence the direction and magnitude of the anomolies.
(There is probably a very detailed post around here on exactly how the anomolies are computed…)
I’m going to add that the answers noaa provides on it’s webpage are not detailed enough and the example it gives, stations in a valley vs. a mountain, does not make any case for an anomoly at all over the raw value.
I suspect the jet stream had wandered far to the north temporarily allowing lots of warm gulf air up into the center of the country.
Very Dry and very hot all across the great plains. South Dakota tied all-time state record @ 122F (only state high record since 2000, (not counting the Hawaiian temp reader error). Many day records also set, but it was mostly due to the Dry. Set a daily high, then a daily low, then another daily high, all with in 25 days. Only reason was doesn’t take much energy to heat air with no moisture and no evaporation cooling of the ground.
Doesn’t that make temperature a very poor proxy for actual heat energy contained in the atmosphere? And, if that is true, what does ‘global temperature’ really mean? My guess is very little. A few hundreths of a degree change in temperature has no meaning when you can’t also say that temperature is a good proxy for heat energy.
I believe the question is what is the period that anomaly is matched against?
A) Were those temperatures captured by USCRN equivalent quality stations?
B) Or matched against NOAA adjusted temperatures?
Well, I don’t know what you guys had where you were in January 2006, but I had about 10 inches of snow piled up on my front steps on January 20, 2006, by 10:45PM. I have pictures.
I believe it was a plume of cold air coming down Lake Michigan, creating an unending overnight lake effect snow storm. The prediction for 1/20/06 was 32F and snow. And boy, did we get snow. Lots of snow. Took a while to get rid of it, too.
The warm winter of 2011-2012 in central Indiana was the reason I began to doubt my belief that CAGW was not happening. After a serious self education I am sure we have nothing to worry about except for the huge waste of resources devoted to fixing a no problem problem. My experience in aircraft maintenence was that the no problem, problem was the hardest to fix.
Yeah, here in Indy we had the #9 warmest winter, the #1 warmest March, #5 warmest May, and #1 warmest July.
But then 2014 was the third COLDEST year ever here, part of a 31-month cold stretch from Sep. ’12 to Mar. ’15.
It all evens out in the end.
Keep en eye on those sneaky cats!
My German Shepard has his eye on the grey cat next door.
Dave Fair
Love, or lunch?
Prey, HotScot.
The same as you and I are for the CAGW profiteers.
Dave Fair
I’m an effing BIG cat mate. 🙂
My Dalmatian has better technique.
I actually have three: German Shepard, Dalmatian and Pug Dog.
Home security sellers now skip our house.
The trend is 6C per century?
Maybe.
The trend is more like “mostly level with a present-data series that averages out to 0.6° C”. Is that 6°C/century?
Maybe.
Maybe not.
Would be very interesting to see the (how many, 100? 1000?) pristine sensor data co-plotted on one graph. Overlapping. And to have a competent cross-correlation set of algorithms applied to all to tease out the real highest mode correlation trend.
Just saying.
GoatGuy
The trend is not statistically significant (smaller than the error) so no justification to claiming any century trend form this data.
Thank you.
You could say that. 6C +/- 9C per century. Of course in climate science one must drop the error bars…I think I saw that in a climate textbook somewhere…let’s see I stored that in the cabinet net to the unicorn farts I think,
Owen, I initially thought the 0.6 +/- 0.9 was beyond parody.
Sort of reminds one of the 0.6 +/- 17 nonsense. They actually printed that for all to see.
In the 2014 post, the trend was -6C per century (albeit not significant).
Looking at a short period of time and extrapolating a trendline to a century – especially when the you’d be at 6C +/- 9C…not the best idea.
So who does it?
You can look at the post I was responding to…
The trend only exists because of the effect of the 2015/16 El Nino
Before that, it had a trend indistinguishable from ZERO.
“The trend is 6C per century?”
Trend only applies to linear things like climate Nitendo models, not to real-world climate which is cyclical. One can always find a “trend” to a portion of a sinusoidal, but such trend has no physical meaning.
If only a system like uscrn had been introduced more widely at the start of the cagw scare, we might by now have a definitive answer that would convince all sides of the argument.
That’s what Lamb called for at the time—more climate data—but he was ignored by his successor and others in the field.
“Data! data! data! I can make no bricks without straw!”
—Sherlock Holmes
Please note the 2014-16 Super El Nino end-effects. Get a grip and give it a few years before staring at the squiggles.
Okay everybody, this is with the best system ever rolled out with measurements sent back via satellite, and the values jump around by 5C over two years. Now, let’s think about our baseline for the “global” temperature. Does anybody on earth believe we actually know what the temperature of the Pacific Ocean (roughly equal area to the 6 inhabited continents) was in 1910? Okay, maybe not oceans… How about the Sahara desert which is roughly equal in area to the contiguous United States? How about Russian Siberia? The Amazon Jungle?
We have no freaking clue what the global temperature was before the industrial revolution, so how can we possibly know if it’s warmer now?
With a paucity of accurate data, one can “project” anything. Temperatures in 1913 are anything the gatekeepers say they are.
Radiosondes, satellites, ARGO and USCRN all point to a lack of CO2-driven warming. Attack warmista propaganda with those data.
Excellent observation chadb
+1000
Typo? In the first image, in the upper-left comment, the last line has this: “… wind fence with a single alter.”
Shouldn’t that be “altar”?
Not a typo. An Alter shield goes around a rain or snow gauge to control wind forces. Named after the inventor and dating from the 1930s.
So, no need to alter it?
Dave Fair
Nope, just worship at it.
Thanks for setting that one up Roger. Good double act.
Aha! So shouldn’t it then be capitalized, thusly: “… wind fence with a single Alter.”
On second thought, since “celsius” (etc.) isn’t cap’d, maybe “alter” shouldn’t be either.
“twice the scare-factor temperature rise of two degrees C”
That scare is about a permanent global anomaly. Don’t compare that for one second with one landmass for one month. The world climate has obviously many zones all with their own anomalies and extremes.
No matter your belief on the matter, the quoted statement remains nonsensical and implies a lack of understanding the difference.
Why not compare to a “permanent global anomaly”? One landmass for one month can have a 4C anomaly excursions and it has absolutely no negative effect and is completely forgetful — and yet a “permanent global anomaly” of half that, rising over a century rather than a month, is going to be some sort of catastrophe that’s too rapid to adapt to? Doesn’t pass the sniff test.
Not to mention that we’ve *already* had about a ~1C change in the “permanent global anomaly” since late 19th century — and yet we’re supposed to worry about going up more than one more degree? The warming so far hasn’t created any catastrophes, it hasn’t even created any mild annoyances. Combined with increased CO2 levels, the world is a better place for it.
Real people/plants/animals aren’t affect by *anomaly*, they are affected by *temperature*. AGW doesn’t change that. Hyperventilating over the “permanent global anomaly” disguises that we are talking about a rather small differential to large temperature changes that happen regularly on a daily, seasonal, and yearly basis, and that both society and nature is already well-adapted to.
John, I understand the 2°C scare factor is about a permanent global anomaly. My point was quite different. It is that a 4°C temperature difference is hardly memorable.
However, given that according to the Berkeley Earth dataset the earth has warmed about 2°C over the last couple centuries, with no visible deleterious effects, don’t expect me to get my knickers in a twist.
Regards,
w.
A useful post.
The most reliable sites show a continuation of the pause.
As does ARGO, Stephen.
“The most reliable sites show a continuation of the pause.”
6°C/Cen is not any kind of pause.
Nick,
Did you forget the +/- 9? Rather silly if you ask me, but climate science does demand error bar removal from most products.
You are being deliberately stupid again, Nick
Even you must know that the trend exists ONLY because of the effect of the 2015/16 El Nino at the right hand of the graph.
Why the continual DECEIT ??
Only when you carefully cherry pick your end points.
“6°C/Cen ”
Come off it , Nick.
Are you REALLY that mathematically inept that you think extrapolating units is any part of real science?
The US officially has N number of “climate regions” but it has many more different climates. The number probably depends, as does the length of the coastline, on the level one wishes/is able to measure it. What I would really like to see is a station by station record of the USCRN sites. Being able to plot them by geographical location would be nice too.
One could make tables of the many variables that might be interesting, not only average temperature over the period of operation but by year, by month, by season, or whatever. Not only the averages but the highs and low, the average of highs and lows by various categories. The range of variation, the correlations with humidity etc. all from the raw data. I don’t know what his would show but it could be interesting.
Until quite recently I only had dial-up modem access. Many web pages could take 15 or 20 minutes to load, making following a series of links to some final destination difficult and frustrating. Now that I might be able to download whatever is necessary to do some of the above tasks, is it the case that the data is available or does NOAA restrict access to a few calculated values? Are there any know links?
Andy,
Here is that USCRN data:
https://www1.ncdc.noaa.gov/pub/data/uscrn/products/
stations.tsv (Tab Separated Value) is a listing of USCRN sites and their status – not all are active.
Hourly, Daily, and Monthly data is available but it is lots of separate files.
(If I remember correctly, there is also an FTP version of this site also.)
Thanks for that Gary.
Do know what the 10th Column is?
The Data for Yosemite Village shows very high readings for that column where other stations do not.
ie some values over 300.
Never mind there are some other sites the same, massive variations from site to site.
AC,
This page provides data field definitions for temp data:
https://www.ncdc.noaa.gov/crn/qcdatasets.html
If one is careful about vetting station records to weed out the highly UHI-corrupted, a very similar absence of any decadal “trend”–positive or negative–is evident in the GAST series during the present century. We’re experiencing persistently high anomaly values, riding probably near the composite peak of multi-decadal oscillations.
True before, but not after, homogenization. I analyzed the CRN1 USHCN stations in the surfacestations.org database to show this. Guest post here 8/3/2015.
Homogenization as performed by “climate science” can produce virtually any “trend.” In any event, I’m not talking about CRN1 USHCN, but about carefully vetted GHCN station records more than a century long.
Homogenization is the theory that corrupted data with few gaps is superior to uncorrupted data with more gaps.
I too have a serious case of curiosity about the two peaks – both appear to be of equal magnitude – how weird is that? Imagine an old style electronic volume indicator meter on your stereo pegging out at max in the red zone… Yes, it got very loud but since it pegged you don’t know how loud.
This would almost indicate an error (i.e. noise) in the data somewhere. I don’t like coincidences especially when they lie on maximum or minimum values. Very curious indeed.
“Trend = 0.6 ± 0.9 °C/decade”………….8/
So somewhere between -0.3 C and +1.5 C….is that like a 50% chance of rain? That can’t be right…..
…I just ate two chocolate brownies….no brain right now
Latitude, everything is 50/50; either it happens or it doesn’t.
“There are liars, damned liars and statistics.” Mark Twain.
exactly….a 50% chance of rain is every day of the year
Now now, probability used in forecasting chances for rain are not that simplistic. But I’m too exhausted to tell you why. 😉
It could be the patter of rain on your windows that contribute to your lethargy, Tom.
The trend ONLY exists because of the effect of the El Nino in 2015/16
Before that, the trend was essentially ZERO.
By my calculation, it is 0.67 °C/Century.
Oops, miscalc. Yes, 6 °C/century.
No, when the error band is 150% of the trend you can safely say it can be anything you want it to be, or more likely, nothing at all.
Like the rest of this so-called ‘science’, its counting fairies on a pin head.
..or somewhere between -3C and +15C….they are calling it a crap shoot
“they”? It’s Willis’ choice of calculation.
Great to see you deliberately using El Nino (NON-anthropogenic) effects to create your mythical warming trends.
Its what you do NIck… because its all that you have.
You were right the first time. 6 degrees C per century is nonsense.
Perfectly stated AndyG55!!
Nick’s spinning false stories gets more pitiful every day.
His desperation is leading to Nick into exposing gaping holes in his mathematical and scientific knowledge.
So be it..
“Great to see you deliberately using El Nino (NON-anthropogenic) effects to create your mythical warming trends.”
It’s not my warming trend. It’s Willis’. I just checked the calc. I haven’t proposed any trends.
Yawn.. you really are a squirmly little worm, aren’t you Nick !!
“Yawn.. you really are a squirmly little worm, aren’t you Nick !!”
Actually, you are the worm. Nick is simply cross checking the data in a graph published by someone else. He did not choose the start and end points, yet you attack him for that.
Chris, yet another brain-washed AGW non-entity, devoid of mathematical anything.
Nick is deliberately bending the data in a dubious attempt to support the AGW farce.
Sorry you are incapable of seeing his AGENDA driven mathematical malfeasance and misinformation.
I am not attacking him.
I am expecting him to start telling the truth.
1. Extrapolating units to “per century” is MEANINGLESS.
2. the slight trend is purely an effect of the 2015/16 El Nino bulge.
Either Nick KNOWS these to be facts, and he is DELIBERATELY mis-leading with his comments..
or
He is really as mathematically ignorant as you are.
Which do YOU think it is?
AndyG, you’re posts are always good for a chuckle. Full of bluster and completely undeserved self importance.
All Nick did was to cross check and confirm the .6C/decade figure that Willis mentioned in his article. So your faux outrage is very selective, which makes it all the more laughable.
The thing is, 6°C/Century is a very high trend. The low significance does relate to the short period. And it means that if you wanted to deduce from this short period that the US is warming, it says that isn’t sure. But you certainly can’t say that it isn’t. And the best estimate of warming rate is very high.
Not true. The best estimate of warming rate is “A trend cannot be determined from the data.”
The error bars are a more quantitative way of saying that. And yes, we are advised not to try to deduce trends from short time periods.
Linear “trends” fitted on a decadal basis have vastly different characteristics, amplitude and phase, than those fitted on century-long data. Given the spectral structure of temperature variations, the former by no means covert directly to the latter by simple multiplication. The “best estimate” based upon thoroughly vetted, century-long global records–not the highly adulterated popular indices–is somewhere near 1/4 degrees Celsius per century.
And the 2014 trend shows a negative 6 degrees C. Which, oh which, to believe?
Sadly, your politics determines the answer, Nick.
I don’t see how anyone can claim a “pause” from this data. The main argument seems to be between something like 0.1 deg C / decade global observations and 0.2 deg C / decade in models. In that context 0.6 deg C / decade is massive. That the uncertainty is even greater just means that this super duper CRN is not telling us anything useful.
Saying you have a massive uncertainty in your data is NOT the same thing as showing a trend of either polarity ( or any other pattern ) does not exist. It is a statement of ignorance: we cant tell what is going on.
I don’t see how anyone can claim a “dangerous warming trend” from this data.
+1
Agreed. It’s like a political poll saying Candidate A leads by 2 points but the margin of error is 3 points. Candidate A still has the lead. In this case, the data shows warming, not a pause. The length is too short to be significant but the edge is toward warming. And don’t blame el nino. There were several cycles in that data… including some la ninas.
+2
Well that’s exactly the point. There is strong sub-annual and inter-annual variability and that is exactly problem in detecting and measuring any underlying trend and being confident that it is NOT due to the variability in the data.
So yes, I do blame Nino / Nina and so do the stats. That is precisely why the uncertainty is greater than the large, detected trend. It is saying that there was a strong warming trend but it is likely that this is just a feature of the short term variability in the data. There is a high probability that the 0.6 deg “trend” is attributable to the recent El Nino years at the end of the data.
I’m sorry that Mary doesn’t have the intelligence to see that the slight positive trend comes ENTIRELY from the 2015/16 ELNino.
You can’t help some people who choose to be willfully blind.
And NO , Mary, the current level has dropped back down after the NATURAL El Nino.
You need to start thinking about what the data is doing rather than acting like a semi-trained monkey applying nonsense linear trends to non-linear, event driven data.
Nonsense linear trends is Nick’s domain… we don’t need two monkeys !!
“And the best estimate of warming rate is very high.” Actually, Nick, that is untrue.
Surface and, especially, atmospheric measurement estimates prove that IPCC climate model warming rates are exaggerated; “not even wrong.”
Do you believe that existing IPCC climate models are fit for fundamentally altering our society, economy and energy systems, Nick? Please, give us your opinion. Without your honest opinion, all we can deduce from your comments is that you are a climate blog dilettante.
This has nothing to do with climate models. Or climate scientists, for that matter. Willis asked whether a trend could be gleaned from the USCRN record so far, and found that it was high but not significant. That means it could easily change with more data, as it changed from 2014 to 2017.
Nick, it has everything to do with climate models.
I pointed out that satellites, radiosondes, ARGO floats and USCRN results indicate no measurable CO2 impacts. CAGW aficionados ignore those data inputs and, instead, play with data to obfuscate truth.
Alarmist beliefs and actions are climate model-driven. Other than a late 20th Century warming trend, there is nothing but models.
Answer the question, Nick: Do you believe IPCC climate models (or any of the data squiggles you play with) are fit for the purpose of fundamentally altering our society, economy and energy systems?
@ Nick Stokes, are you saying you prefer to infer climate ‘trends’ from 2-3 years of data?
Don’t forget that ‘global warming’ was Invented by Maurice Strong, as he explained to the Club of Rome, specifically to provide a ‘global threat’ to mankind that could be used to de-industrialise society.
He founded the IPCC with the sole remit to ‘show’ ‘how much’ global warming mankind’s CO2 emissions would cause….. not if it did or would, not if the earth was warming, and not what affects of influences global climate.
The whole charade was set up to achieve an unelected, unaccountable and anti-democratic world government with a Marxist-socialist character.
Check it out – many, many direct quotes from Strong set this out very clearly – other UN and IPCC spokes-people have reconfirmed the same message. Try Google and you might learn what a total scam it is that you support …… but I suspect you know that very well.
“fit for the purpose”
The facts are
1. Burning vast amounts of carbon has potential to greatly alter the climate (Arrhenius could work that out in 1896)
2. Climate is very important to our well-being.
So people need to make a decision. You never have perfect information; you have to work with what you have. I think there is ample information available, but anyway, saying that the information is imperfect so we’ll proceed as if nothing can go wrong, is not a good way of proceeding.
And that, Nick, is Precautionary Principle BS.
“… potential to greatly alter the climate” is just a slogan. Once past the end of the 20th Century, we know that the global climate has not been altered by Man nor CO2. Please address the accuracy of IPCC climate models that postulate CO2’s “… potential to greatly alter the climate” Do you believe that those models justify altering our society, economy and energy systems?
Your “2. Climate is very important to our well-being” is beyond parody; an appeal to the ignorant and easily led. I guess you might argue against the assertion that a warmer climate is better for humanity?
Man! You even parallel an argument posited by President Bush’s Secretary of Defense “You go with what you have.”
Ignorance as a reason to act? That is what you said: “… saying that the information is imperfect so we’ll proceed as if nothing can go wrong, is not a good way of proceeding.”
“Nick Stokes, are you saying you prefer to infer climate ‘trends’ from 2-3 years of data?”
No. I’m noting that in 2014 WUWT said the USCRN trend from begining was -0.6°F/Decade (F, not C). Now Willis says the trend from beginning is +0.6°C/decade. That sort of change illustrates the problems of short term trend calculation.
Yep, Nick; and I assert that CAGW fear mongering is based on a short term trend calculation of late 20th Century warming.
You have not told us if you believe that IPCC climate models are fit for the purpose of fundamentally altering our society, economy and energy systems. Your dicking around with numbers avoids the question.
What is it? Only a pussy would avoid answering a direct question.
Nick, you always fail to mention Arrhenius’ followup paper of 1906, where he significantly reduces his estimate of the effect of CO2 on warming. Perhaps it’s because he references the work of a scientist by the name of (wait for it) Koch. Svante Arrhenius: Climate Denier!
I repeat, for those not intelligent enough to comprehend.
The ONLY reason there is a trend is because of the effect of the 2015/16 El Nino on the right hand end of the graph.
Before the El Nino , there was a zero trend.
The temperature has all but dropped down to that zero trend level.
Only the most foolish person would think the trend calculated by the adding of that El Nino has any meaning WHAT-SO-EVER.
“The facts are”…
1. That the bulge through 2015/16 is from a NON-CO2 El Nino event.
2. The temperature has now dropped down to the pre-El Nino zero-trend level.
3. There is NO CO2 involvement in this trend.
STOP YOUR DELIBERATE MIS-INFORMATION, Nick.
“Only the most foolish person would think the trend calculated”
Willis chose the period and the calculation. For CRN there isn’t much choice; he used all the data.
Nick, you are avoiding the question: Are IPCC climate models fit for the purposes of fundamentally altering our society, economy and energy systems?
Fixating on chart squibbles is misdirection. Blaming others for one’s assertions is dishonesty.
NS,
You stated, “Burning vast amounts of carbon has POTENTIAL to greatly alter the climate (Arrhenius could work that out in 1896).” You left out, “All things being equal.” That is, in a controlled experiment, one will see warming in the presence of an absorbing gas, if nothing else changes. The problem is, Earth is not a classic, in vitro, experiment. There are numerous interactions called feedback loops that impact the “potential.”
“Only the most foolish person would think the trend calculated by the adding of that El Nino has any meaning WHAT-SO-EVER.”
Nick apparently agrees that the calculated trend is MEANINGLESS for anything but trivial interest.
He has obviously realised that the calculated trend is coming PURELY from the El Nino bulge through late 2014 – 2016.
It signifies NOTHING but the fact that there was just a major El Nino.
It is not evidence of any sort of warming apart from the El Nino bulge, which has now all but subsided.
He KNOWS that he HAS to rely on El Ninos to create a calculated trend.
He KNOWS that El Ninos are unrelated to anthropogenic anything……
.. but STILL he persists with the misrepresentations.
Is temperature of a chaotic atmosphere as measured by select pinpoints supposed to be static?
From these data, the rate of warming is not significantly different from zero.
Only a mathematically inept fool would think this trend is 6°C/Century
Moronic extrapolation of units…
“Moronic extrapolation of units”
No extrapolation. Just converting to familiar units. 1 m/s is 3.6 km/hr. It just is. If you can sprint at 15 mph, that doesn’t mean you can keep it up for an hour.
You have just proven my point. Well done Nick.
They are NOT equal…… your 3.6km/hour is meaningless.
Sorry you don’t have the mathematical integrity to understand that.
I do feel sorry for you , Nick
While you are obviously quite competent at arithmetic, calculations etc….
…you seem to have missed out on a deeper understanding of what you are actually doing.
Can’t help you. Sorry.
Technically accurate. 6°C/Century. I don’t understand the problem.
No, not technically accurate….. technically MEANINGLESS
Unless you are doing Junior high maths level. !!
And yes, it is obvious you don’t understand, and probably never will.
“6°C/Century”
Is the height of mathematical stupidity and nonsense.
To be expected from Nick.
Utter BS Nick!
Since you are making that claim, prove there is a +6°C per century trend.
Willis proved that the alleged trend changes with it rather more likely to drop as rise.
Unless you, Nick, can prove there is a consistent rise across time, there is no solely positive trend.
Show us every month was consistently higher than the same month the previous year?
“Since you are making that claim, prove there is a +6°C per century trend.”
It’s Willis’ number, not mine.
NS,
“+6°C per century trend” is NOT Willis’ number, it is yours! You are the one who multiplied by ten, and you don’t have the integrity to own up to it.
Happy to stay with 0.6 °C/decade if you prefer. It’s the same quantity.
Nick wakes up to reality. (Yet still the under-rider that shows his mathematical ineptitude)
0.6ºC/decade has meaning…
from the data, 6ºC/century is MEANINGLESS.
Now to get little Nick to admit that that calculated trend is PURELY an effect of the now disappeared 2015/16 El Nino.
Come on Nick, see if you can mange the TRUTH.
Just once , without all your normal squirming and worming.!!
Does this best estimate take into consideration future data tampering?
The graph kind of makes all those arguments about increased wild fires, bug infestations, increased asthma , in the US as a result of increased temperatures look like either spurious correlations (the nice term) or utter agenda driven BS.
Frankly, statistics has always baffled me, so I have to ask a stupid question: What does “significant” mean in this context? My naïve view is that significance presupposes attribution of variance to measurement error, but I don’t think that’s what we have here.
When I see “p = 0.31,” my interpretation is that if the temperature isn’t really changing then a trend less than or equal to the observed trend will show up 31% of the time when the measurements are contaminated by noise whose variance is that of the data. Since that percentage exceeds 5%, we wouldn’t consider the measured trend “significant”: we wouldn’t be very sure the temperature has really changed much.
But in the head-post case I take it that the variance is not much attributed to measurement error. Although there is undoubtedly measurement error, I’m assuming we don’t think it’s anywhere near the data variance, right? So significance doesn’t mean confidence here; we’re actually pretty sure that the temperature difference between the first and last months is near zero. In other words, my naïve interpretation isn’t correct in this context.
So I don’t get what significance means here. In particular, I suspect that the question in the back of everyone’s mind is what current measurements bode for the rest of the century, but I don’t see that the trend tells us much about that.
The trend would be meaningful if history told us that, say, 82-year trends fall 95% of the time within 2°/century of the 13-year trends that immediately precede them, i.e., that the temperature trend’s your friend. But I don’t see anyone saying anything like that. So I’m stumped.
Again, I recognize that this is a stupid question, but I honestly don’t know the answer. Can anyone help?
I think Steve McIntyre needs to weigh in here !
The calculation of a regression line from this data, which like all weather data is highly auto-correlated may be an invalid extrapolation.
It means that, if you fit some random model to the data variations, the error bars describe the range that the trend would follow with different outcomes of the random model. I describe it as the trend of the weather that you might have had, rather than the weather you know you had. If you calculate a 14 year trend, then it gives an idea of the range of trend you might expect in the next 14 years, assuming no climate shift.
Significant here means something like that the range of likely trends does not include zero, so you can say it is significantly positive, say. More elaborately, it means that you can reject the null hypothesis, which would be taken as zero trend.
Messrs. Stokes and Gardner:
Thanks for the comments. Actually, though, I think I know technically what trend, p-value, and so forth mean as far as formulas go, and I know the stuff about how well a line fits data. What I’m concerned with is why those formulas are meaningful here, where (if I understand it right) we know the temperatures rather accurately.
To me it seems that you’d use the p-value stuff if you have measurement errors, as I said above, or if you’ve taken a small sample from a large universe and are attempting to infer a universe parameter from the corresponding sample statistic.
The way I see it, though, we don’t have either situation here. If the measurements are pretty good, we aren’t looking to pull signal out of noise; we already have the signal. And we have data for all the months, so we have the whole universe; we don’t need to infer all of it from part of it.
With that in mind, let’s consider what Mr. Stokes said:
When you think about it, that isn’t too meaningful, because we don’t need a p value to reject the hypothesis that there’s a zero trend: we know the data accurately enough to know the trend in the data we have is near 0.6°/decade. Anyway, trend here doesn’t mean much: the data are the data. We know the data meander erratically; they aren’t a linear progression, so there’s no reason to assume they were.
What Mr. Stokes refers to applies to a situation in which you don’t know the actual values, you assume they follow a linear progression, and you’re looking to reject the hypothesis that the linear progression’s slope is zero. Obviously, people do that kind of thing all the time. Again, though, why do that here? We already know what the temperatures actually were.
Perhaps relevant to that is Mr. Stokes’ following statement:
But nothing in our experience leads us to believe that the next 14 years’ trend is, say, 95% likely to fall within the 95% range the previous 14 years’ variance implies, so the “assuming no climate shift” isn’t something we have much reason to do.
In short, although I know folks at this site and others use significance all the time when they talk about temperature trends, it’s not clear to me that they always have a solid purchase on why.
Maybe they do; as I say, statistics is not my forte. But I’m not yet convinced of it.
Note that Nick’s “… “assuming no climate shift”…” is the weasel wording that charlatans use to fool the gullible.
“If you calculate a 14 year trend, then it gives an idea of the range of trend you might expect in the next 14 years, assuming no climate shifts”
Which is of course blatant and absolute NONSENSE.
The assumption of linearity is the “village fool” approach. Perfect for Nick.
I don’t think there is any fundamental difference, Joe. Like you say the ( accurately measured ) short term variation in the system is ‘noise’ in this context and this is the cause of the uncertainty.
Measuring a noisy system accurately or measuring a non-noisy system with large measurement uncertainty leaves you in a similar situation with the data.
Greg:
Yes, I recognize that the mathematics is the same as for removing high-frequency noise from a band-limited base-band signal. But my point is similar to one you recognized last summer in a different context:
That is, the tacit question is what will happen next, but, as you observed, there is no reason to suggest that a particular trend will continue. The variance we observe in the last thirteen years may indeed tell us how confident we can be about next year’s temperature average, but we really want to know what will happen late in this century, right? And as to that I remain unsure that most people know what “significance” means. I know I don’t.
Incidentally, your comment was a reaction to my own use of trends for sea level, which I subsequently recognized has little to recommend it in that context over just the difference between n-year-spaced temperatures. You proposed to substitute the output of a truncated Gaussian filter. (I mention “truncated” because a Gaussian is the limit of a coincident-pole—i. e., critically damped—low-pass filter as the number of coincident poles approaches infinity. The analog-filter delay would therefore be infinite, so we always implement it digitally as non-causal, truncating to limit how great the interval is between the last output time and the last input time.) While I appreciate the Gaussian’s virtues—it rolls off faster than a finite-pole filter—its substitution doesn’t so far as I can see make the output any more predictive of what will happen later.
JB, let me try to give an oversimplified answer. (PhD level econometrics and statistics, for what its worth). Statistics rests on probability theory. Which means it rests on assumptions about the underlying probabilty distributions: normal, log normal, logistic,
Rud, statistical methods applied to adjusted data leads to nonsense.
Oh,well, that clears it all up.
Seriously, the question before the house is, at the end of the day, what we expect the temperature to be in the future. The extent which that depends on the data sequence’s “significance” is not clear. The question here is analogous to that of trends in sea level I mentioned here: https://wattsupwiththat.com/2017/07/25/whos-afraid-of-sea-level-acceleration/
As J implied above, it seems that autocorrelation ought to be a factor.
“As J implied above, it seems that autocorrelation ought to be a factor.”
Yes, it certainly is. I discussed that
here, linking to a post by Hu McCulloch here.
The trend of a set of data is just a weighted mean (the first central moment). And the uncertainty is analogous to the uncertainty of any average. It’s easier to think about for a mean. Suppose you want to know the June average for a place, so you average ten successive Junes. You get a mean, and a spread about the mean. The spread reflects the fact that you might by chance had a run of hot or cold Junes. I set out an example of this here, at WUWT last month. You can predict the variability of the mean estimate, and show that it is meaningful. The sprad of that decade of Junes tells how much you might expect the next decade to vary. Or how you might expect to improve the estimate by gathering a century of Junes.
Again, Rud: Adjusted data is not amenable to statistical analyses.
Joe Born
“We already know what the temperatures actually were.”
That is an important point, too often overlooked. People like to interpret the uncertainty as suggesting that it may not have happened, which is wrong. It is an attempt to quantify how different an answer you might have got if you could somehow re-run the weather with the same climate.
You can see the practical implication here. In 2014, WUWT estimated the slope of USCRN as -0.33±0.4°C/dec. Three years later, we have 0.6±0.9. That is the sort of variability that is implied by the error bounds. I suspect Willis is using a different basis for the more recent trend, maybe Ar(1). You’d normally expect the uncertainty to reduce with more data.
The “random” component is conventionally assumed to be normally distributed, with some sort of autocorrelation (eg Ar(1)). It isn’t, of course. All variation, ENSO and all, gets rolled in. Uncertainty estimates can be pretty uncertain.
Blathering nonsense Nick.
You still have not answered the question: Are the IPCC climate models fit for the purpose of altering our society, economy and energy systems?
“You still have not answered the question”
I have.
Not.
Are the IPCC climate models sufficient to fundamentally alter our society, economy and energy systems?
Quit avoiding the question. Yes? No? Why?
…. unless the variability increased.
Eye-balling Willis’ graph there does seem to be notably more month to month variability starting about half way through 2014. That may be a factor, though doubling the uncertainty seems unlikely.
Willis should state the error model he used as the assumption behind his significance estimation.
To Dave Fair,
The USCRN data is NOT adjusted.
Greg November 9, 2017 at 12:18 am
Happy to do so. I used the usual model, linear regression. I adjusted for the (fairly large) autocorrelation of the data using the Koutsoyiannis method detailed here.
w.
Thanks Willis, thorough as ever. That would be worth putting in the article as an update, since it is important to your result and explains why others when not getting the same numbers when they tried to check.
Something to remember here is that the trend was computed from monthly data. It has been smoothed, reducing the error bars. If the original daily temperatures had been used, the error bar would have been even larger than 0.9C!
It has not been “smoothed” it still has noise and high frequency components. It is temp anomaly data. That may well affect the significance calculations since the data points are no longer fully independent values. Autocorrelation may be more important.
I entered something.
It did not appear.
15 minutes later I attempted to enter it again.
I get a message saying ‘duplicate comment detected’
but it still isn’t here?
Is there some way around this dysfunction?
(Looked around for your comment in the moderation board,never found it) MOD
Andy, the moderators are all volunteers, and must function 24/7, so they are all over the world. Sometimes they don’t get to comments for a bit …
My thanks to all the mods,
w.
I still remember watching the Odd Sites page, a temperature reading in a tarmac carpark, another with a incinerator close by, and then the one that really gets to me, the airport temp reading sites. Some weeks later, I am sitting on a plane, and looking out the window, as we are waiting to take off, the plane in front of us exhaust draft is blowing right across the temp reading and anometer, wonder if is was reading high wind and high temps that day, at first I was trying to figure out what the fenced area was, right next to the tarmac, as we pulled up another plane length, there was the signs telling me exactly what it was, no heat coming from that source as well, then i realized, hahahaha. That was the end of me believing in global warming.
Hey people, it’s a 13 year anomaly graph without a baseline indicated. Good for nothing.
Actually, Tom, it shows (along with ARGO, radiosonde and satellites) CO2 has no measurable impact on earth systems.
Climate frauds used a short term trend (mid-1970’s to early 2000’s) to scare everybody and enable climate profiteers. Given the amounts of money involved, it will be nigh on impossible to reverse the lies.
If 6 deg / century is “not measurable” you have a significant problem with your measurement system. This does not there is not a problem and the claims are a “fraudulent”.
If there is other data that would be capable to showing that the “trend” can be determined to within a useful degree of accuracy, that is a different matter and is not an “along with”. CRN is worthless for answering the question with its current length.
Yes, the “late 20th c. ” thing is a cherry pick and unless they can also explain the early 20th c. rise they are BSing everybody.
Christ, Greg! Asserting “6 degrees/century” is absurdity on a grand level. It came from 0.6 degrees/decade, plus or minus 0.9. Get a grip.
“If 6 deg / century is”
Is a mathematically inept fantasy…..
… a load of junior high maths .. gone wrong !!
Dave Fair,
I’m very puzzled by your delusions that you keep repeating everywhere..
Where, when is ARGO, radiosonde and satellites showing no measurable impact on earth systems???
Please show me..
I track OHC, beginning in 2007 when the ARGO array was fully deployed, with a simple calculation based on actual depth-averaged temperatures (not anomalies), volumes and heat capacity:

That’s the problem with anomalies and why climate alarmists love them so much, it means they can pick a baseline to show whatever they want.
In this case, regardless of what baseline, as they all use the same so there is need to specify it to show that there was no significant change over 12-13 years, or maybe you didn’t understand that?
Personally I hate ‘anomalies’ , I simply want temperatures graphed over a reasonable period of time – say 50 to 100 years. That shows truths that ‘anomalies’ hide or distort.
The only thing frightening about a 100 year temperature series are the multiple adjustments made by the climate record gatekeepers which , time after time, Reduced recorded temperatures for the first half of the 20th century.
Look at the original temps and you have to ask ‘what warming’ and what can CO2 have to do with it ? Because there is a truly insignificant amount to see.
The joke is, OE, that as newer, more accurate measurements and estimates are used, the more CAGW is demolished. ARGO, radiosondes, satellites, USCRN, etc. demolish high sensitivity “estimates.”
Somehow the alarmists are going to have to discredit IPCC AR5’s cooling adjustments to CMIP5 models’ high heating “projections.”
Surely with computers we can now look at how anomalies vary according to differing baselines. This should show the effect of cherry-picking baselines that support a particular point of view.
Must have been a lot of CO2 emission in 2006!
OMG!!! The 48 contiguous states show no warming!!!…..I guess if 1.58% of the total surface area of Earth shows no warming…..then what is the other 98.42% doing?
No. According to this, they show 6°C/Century of warming, with lots of uncertainty because of the short time period.
Again we see Nick trying to use El Nino events to try to claim CO2 based warming
Really is WAY passed a joke…. passed being funny, into just plain stupidity.
AndyG55 … there were la ninas in the data… 2007 and 2010
Mary, part of the problem with that short-term trend analysis is the trend beginning in a ENSO neutral period and ending on a Super El Nino.
“Really is WAY passed a joke…. passed being funny, into just plain stupidity.”
I find Nick to be remarkably patient and credible in this thread. He is just barking out the basic stats.
I’m sorry that you are unable to comprhend the basic issue , Mary.
Don’t compound Nick’s problems.
Yes Mary , Nick has been remarkably patient in face of Andy’s incessant ranting and insulting comments.
He seems to think that shouting at people gives his assertions and opinions have more validity.
You are allegedly compounding Nick’s problems. No doubt I am also compounding Nick’s problems. At some stage Andy655 needs to consider if it is Nick or someone else who has “problems”.
Thanks once again to Nick Stokes, who is one of a small number of informed and informative contributes here.
Greg, you may not have noted that Nick has not answered the question as to if he believes IPCC-used climate models are fit for the purpose of fundamentally altering our society, economy and energy systems. Additionally, Greg, what is your opinion about the use of such models in expensive policy-making?
If people REFUSE to understand basic mathematical concepts.. not my problem.
And I have been remarkably patient with NIck’s DELIBERATE misrepresentation of reality.
I cannot believe he is as mathematically naive as he makes out.
The other 98.42% are doing the same damned thing, C. Paul; nothing of import.
Since temperature measurements over most of the globe are sparse or nonexistent, I’ll take the U.S. stuff.
Additionally, radiosonde and satellite temperature estimates show no alarming trends. Get a grip.
If the current rate of warming be 0.6 °C per century, then the rate has really slowed down since the depths of the LIA during the Maunder Minimum, which was about 3 °C cooler than now. If the trough were AD 1695, then the average since then has been around 0.9 °C per century.
That year in the CET was -2.23 °C below the 1961-1990 anomaly baseline. Tack on whatever has been the warming since 1990, and you get close to 3 °C.
The CET is a good proxy for the world, since it’s in the North Temperate Zone and on an island warmed by ocean currents. The polar regions were relatively colder and tropics probably not as much warmer, although there are conflicting data on that point.
LOL: “The CET is a good proxy for the world”
…
If CET is good, so are bristlecone pines !!!!!
YHGTBSM!
CET is thermometers, not treemometers. CET can be adjusted out of reality, but Mann’s trees never reflected reality in the first place. And then inconvenient true data were hidden to hide the decline.
Don’t forget that those pines going through to 1995 showed that as at 1995, the northern hemsiphere was cooler than it was in 1940, and that is why M@nn truncated the data, and spliced on the adjusted thermometer record.
“current rate of warming be 0.6 °C per century”
No. Willis said 0.6°C/decade.
True, but the actual warming from AD 1850 to 1995 was 0.55 °C, until the books were further cooked, which even slower. Thus, most warming occurred in the 18th and 19th centuries.
“True, but the actual warming from AD 1850 to 1995 was 0.55 °C”
Well, that isn’t the current rate of warming.
Gawd, Nick; the current rate of warming (absent the Super El Nino of 2014-16) is zippo.
There currently is no warming, except for the Super El Nino spike.
Global average temperatures per decade of dedicated satellite era, degrees C:
1979-88: 14.1
1989-98: 14.2
1999-2008: 14.3
2009-18*: 14.3
*Assuming 2018 about the same as this year.
We’re all going to die!
The source of the data, Gabro?
For reference:
1899-1908: 14.0
1909-18: 14.1
1919-28: 14.2
1929-38: 14.3
1939-48: 14.2
1949-58: 14.1
1959-68: 14.0
1969-78: 13.9
Dave Fair November 8, 2017 at 5:28 pm
Reality, even with UCAR’s unwarranted adjustments. Plus NCAR data from the 1970s, pre-cooked books.
https://www2.ucar.edu/climate/faq/what-average-global-temperature-now
More background:
1849-58: 13.7
1859-68: 13.8
1869-78: 13.9
1879-88: 13.8
1889-98: 13.9
“Plus NCAR data from the 1970s”
Your link doesn’t point to any NCAR data; in fact they pretty much say they don’t have any. They point to NOAA, NASA and HADCRUT anomaly averages.
Nick,
I refer you to the NCAR graphs from the 1970s which you so delusionally assert don’t exist.
Actually, due to rounding and averaging for decades, I’ve smoothed the acute peaks and troughs in the real, as opposed to current cooked book, NCAR data.
However, please show your decadal averages, based upon the 1951-90 US government baseline average of 14 degrees C, if they differ from mine.
Sorry. Meant 1951-80. Typing in the cold and the dark to save the planet from too much CO2 emission.
Gabro, I am typing in the cold and dark of Las Vegas!
Please note that Nick Stokes types nonsensical numerical obfuscation to avoid the fundamental question of climate science: Do IPCC climate models justify fundamentally altering our society, economy and energy systems?
“Nick; the current rate of warming (absent the Super El Nino of 2014-16) is zippo.”
You don’t get to wipe off the el ninos and keep the la ninas.
You are arguing over noise.
So you also think El Ninos are part of CO2 force “global warming”
That is what Nick is trying to imply in his every post.
Surely you are not supporting that line. !! ???
It is more than a little eyebrow raising that the one place we have really good measurements for a long time and across an entire continent…we keep on finding no particular trend, short or long term.
Even while the rest of the planet is about to catch on fire and rain sulfuric acid.
And we are supposedly the main culprits…you would think the proximity of all that CO2 being released for all of those years would cause something bad to happen…if CO2 causes bad things to happen.
I am still waiting for a scientifimacal explanation for how an entire continent can be immune to the catastrophe which is supposedly ongoing throughout the rest of the world.
No place in particular yet on that catastrophe…just everywhere…except here.
Anyone?
Anyone?
Bueller?
Its not NO trend.
Willis fit a linear model to a non linear phenomena.
the Linear model has a trend
That trend is Significant at a low level,
he did not find a trend of Zero with high confidence.
you never will with 13 years of data
Shame Willis did not surmise it in an equally clear fashion. It would have avoided a lot of confusion.
must be due to how little co2 the people in north america produce through the burning of fossil fuels . . . . oh !
It’s interesting that USCRN show 0.11 C/decade more warming than ClimDiv (based on the large ordinary station network) over the 12 year 10 month period. (I got trends of 0.57 and 0.46 respectively)
Hence, the adjustments by the PHA-algorithm is not creating any spurious warming, on the contrary it seems to hide about one fifth of the warming..
YES,
the adjustment code does Miss some of the real warming.
The key is that UNADJUSTED GOLD STANDARD data is
WARMER Than Adjusted data over the same period.
this will continue for the rest of time.
So after 20 years skeptics of adjustments will still have the same puzzle,,, why is GOLD STANDARD data
warming faster than the adjusted sites
“… this will continue for the rest of time.” Beyond parody!
“this will continue for the rest of time.”
The Farce is strong in this one, Obi-Wan!
Because you guys know you will be caught now if you tamper. So you cooled the old data where it could be obfuscated. Adjustment game is over. All the fake blood has been squeezed from that turnip
Hey guys,
Actually, the adjustments by Mosh & Co increase the mainly natural warming before 1950, but decrease the AGW after 1950:
https://twitter.com/rarohde/status/843799201544900608
I admit that a 0.11 C/decade difference, between the rural pristine gold standard network and the BIG adjusted network, sounds too large, and I doubt that this will last in the long run.
Maybe a long term divergence of 0.010 C/decade, or so, is more reasonable…?
This chart shows the GISS adjustments in the last ten years. If I was in charge of making the trend look better for the AGW cause, I would do exactly what has been done.
First, I would warm the late 1800s and cool the 1930s/1940s. That gets rid of that unwanted global warming before CO2 forcings were big. Want that to look flat. Check.
I would work really hard to get rid of all that heat at the start of the fossil fuel era … first half 1900s. That is the starting point for CAGW so need to make that cooler. Check.
We really need to get rid of that annoying cooling from the 30s to the 70s. Cool the start, warm the finish. Check.
Be careful with recent data. Too easily to verify. Want to be able to claim we actually cooled the trend since important dates of 1880 and since 1979. Check.
I’m sure many of the adjustments are valid. But seems to me it is a case of “heads we adjust, tails we ignore”. The adjustments are all way too neat and tidy and correspond in every case to make the trend a much better match for CAGW proponents.
But, the adjustment game can only go so far. I suspect it has mostly run its course. The “improvement ” in the trend for the CAGW proponents has been roughly offset by the credibility loss from slicing and splicing. If a substantial portion of the warming comes from administrative adjustments, then either (a) the warming is pretty small or (b) our temperature records are not accurate enough to conclude much of anything.
https://postimg.org/image/8ksxqt3wp7/
No, not that interesting at all.
USCRN seems to respond to warmer period more than ClimDIv or the US satellite data.
There has just been a period affected by the Warm Ocean Blob and by the strong 2015.16 El Nino.
Of course the linear trend shows more warming. Basic maths.
The fact that ANYONE thinks this trend is anything but a remnant of the El Nino transient, and then thinks they can extrapolate the units out to ” per century” makes me wonder if I they ever got out of junior high school, except by skipping maths and science classes.
Also, Andy, include the aborted 2014 El Nino temperature increases.
Perhaps Steven Mosher could list and identify the number of stations with completely uninterupted intact temperature records covering the period post 1850, post 1880, post 1900, post 1920, post 1940, and post 1950, through to date.
As I understand it, there are only a handful of such stations. hardly a good base from which to construct a time series data set.
We maintain our own version of the USCRN historical record in table form here:
https://atmos.washington.edu/marka/crn.2016/usa48/histrec.usa48.txt
March 2012 averaged +5.9 F above normal while January 2006 came in at +6.7 F above normal.
From the picture “inside a large wind fence with a single alter”.
Dang, I knew this thing was a religion.
Thanks Willis
Here is something similar that supports your conclusions. See summary of results in Figure 17 page 12
https://ssrn.com/abstract=2763358
Basically, what we see is meaningless linear trend created by a bulge from the 2015/16 El Nino.
The temperature has now dropped back down to essentially level to the pre El Nino zero trend line.
The assumption of linearity is quite anti-science. !.
And the child-minded extrapolation out to “per century” is the level of mathematical understanding expected from a 10 year old.
OK, 1.8e-09 K/s is the nearest I can get to SI units. You have a very strange idea of the role of units. You can freely convert to whatever you find convenient. They publish extensive tables to assist. 0.06°C.year is 0.6°C.Decade is 6.0°C.Century. The latter is the most widely used.
Linear thinking in a cyclical world….
NS,
You said, “The latter is the most widely used.” Might it be because it gives the biggest number and best supports the AGW story line? For 14 years of data, using a trend value per decade would be the most reasonable unit to use. Extrapolating to 10X of that isn’t really justified.
Nick’s comments yet again show HE HAS NO IDEA !!
Converting UPwards from your data length is MEANINGLESS.
It just shows how badly educated you are in actual mathematics.
Great with fudging and misrepresenting numbers, but doesn’t comprehend basic mathematical principles.
Poor ill-educated Nick.
And converting downwards gives you an average only.
Things Nick MISSED in his basic education !!
“Extrapolating to 10X of that isn’t really justified.”
If you convert your height from 2 yards to 6 ft, it would be unusual to describe that as “extrapolating to 3X”. It’s just units.
Units do NOT imply extrapolation.
When my local veg shop sells endives at 1.95 per 100g ( because he’s too embarassed ) , I told him jeez, that’s almost 20 euros per kilo.
He replies : don’t be stupid that’s not the real price, you’re just extrapolating !!
Explaining the intricacies of basic mathematics to people who aren’t interested in knowing, is a pointless exercise, Greg.
Nick is just NOT interested in learning anything other than what he thinks he knows.
He has shown that on other threads, as well. Sad really.
Hey Greg, tomatoes were at $2990/tonne in the supermarket the other day. ! 🙂
Poor shopping trolley just could not cope ! 🙁
AndyG55, you’ve more than made your point, multiple times. Seems to me the bait has been dangled in front of you and you’ve devoured it repeatedly. I ain’t the moderator, but I do have an opinion and I find your comments very tiresome.
NS,
You said, ” It’s just units.” No, that isn’t true! If you were converting between F and C, that would be converting units. When you use a denominator of 100 years instead of 10 years, you are implying an extrapolation for a longer period of time, which isn’t justified for such a short period of time. It is examples of sophistry like this that earn you deserved criticism.
Clyde,
“When you use a denominator of 100 years instead of 10 years, you are implying an extrapolation for a longer period of time, which isn’t justified for such a short period of time.”
No, that’s absurd. It is just units. If you read any account of speed of tennis serves (eg here), it is given in mph (or km per hour). The record seems to be 157 mph. You could say 69 m/s, but few seem to. Or 0.069 km/s. But the duration less than 1 sec. No-one has any trouble using mph as the unit here. No-one thinks it means the ball will travel 157 miles. People just convert to the units they find most familiar. I think more people find °C/Cen as more familiar (I do), but by all means use °C/decade if you like. Due to the wonders of the decimal system, conversion is easy.
The station equipment includes both ground temperatures and air temperatures. (1.5 m above ground.) “Back” welling theory says that after sun set ground gets cold and downwelling air keeps it warm. Does actual data show that?
It could be interesting to see this chart matched with and WUWT US station chart that goes back 100 years.
Nick Stokes
November 8, 2017 at 3:52 pm: And Prof Wood refuted Arrhenius soon after. The first of many.
Prof Wood had nothing to do with Arrhenius. Or anything else much.
“Trend = 0.6 ± 0.9 °C/decade, p-value = 0.31, far from significant. Source: NCDC National Temperature Index time series plotter …
Finally, do you remember January 2006, when the entire US averaged four degrees C above average, twice the scare-factor temperature rise of two degrees C? Well, me neither.”
If you look at the entire dataset, the average monthly anomaly is +0.7766. But you must take into account the fact that the temperature series starts with an anomaly of +1.75 (Not 0 as any other “reference” would be) and the average anomaly of the first 12 months is +0.7783.
I don’t think you can get much flatter than a +0.7783 anomaly over the first year extending to a +0.7766 anomaly over the entire record. It’s flatter than a pancake.
“Finally, do you remember January 2006, when the entire US averaged four degrees C above average, twice the scare-factor temperature rise of two degrees C?
Well, me neither.”
You probably missed it. West coast missed out. The NOAA report is here. Their map is here:
http://www.wunderground.com/hurricane/history/jan2006temp.png
Looking at that map/plot, I am surprised that it was only 4 degrees, but I bet it was very welcome relief from an otherwise cold winter.
Yes, temperatures routinely vary by a large amount from place to place, day to day, month to month, year to year.
And life goes on.
Making a mockery, on a daily basis, of the notion that 2C is somehow an amount of warming that will be catastrophic, or even a problem.
Even if you did not know that the 2C number is just a number, pulled at random out of the air and having exactly zero physical meaning as a limit or a reason to create alarm.
What is really is, is an amount at which most people will be able to have a perception that the temperature has changed. if they concentrate very hard and pay attention.
Now this begins to look like real data at last…
A classic example of linear regression farcically applied to non-linear series. There is no ‘trend’, only the here and now. Tomorrow’s chaos will merely yield another political perspective on the same variability.

Oops, wrong one. Not that it’s significant 🙂

Lol, I’d like to see AndyG55’s reasoning applied in court!
I wasn’t going 60 miles per hour your honor. I only traveled one mile, and only drove for one minuet! I was only going 1 mile per minute. I didn’t drive for 1 hour or 60 miles, so your extrapolation is unreasonable, and my ticket should be dismissed!
This recent posting sent me off in search of USCRN data. I was looking for data that included both air and ground/soil temperatures. After some links and guidance from Michael Palecki and struggling with Excel I plotted several annual graphs. Aberdeen, SD was the first site I discovered that reported soil temperatures at various depths.
One of the assumptions of RGHE is that at an upwelling LWIR of 396 W/m2 (K-T) the ground will lose muchly heat so fastly that its temperature would fall bigly if not for the downwelling “back” radiation from the GHGs. That suggests that the air would/must be at a higher temperature than the ground.
What I discovered from graphing: USCRN T Air ave, 5 cm, 10 cm, 20 cm, 50 cm, and 100 cm soil temperatures is that during the winter there is a temperature gradient from 100 cm in the cold direction and in the summer a temperature gradient from 100 cm in the warm direction all of it obviously driven by the variation in solar insolation due to the tilted axis and the oblique dispersion of insolation.
What I see from real actual data is absolutely zero evidence of the RGHE assumption mentioned above.
If the globe were to warm by 2 degrees, it begs the fundamental question:
How much would each country warm by, what would be its daytime highs, nighttime lows, summer highs, winter lows?
We can then make a comparison with what we know about how people presently live in different climates to see whether there is a problem.
Bit off topic but UK met Office are still using this weather station I believe.
Hey guys, just some questions as I try to keep up. First, the NOAA still presents data of rising global temperatures, even though it also presents evidence of no trend in the US:
https://www.ncdc.noaa.gov/data-access/marineocean-data/noaa-global-surface-temperature-noaaglobaltemp
What accounts for this? Is it because they don’t use the USCRN recording stations worldwide? Is USCRN a relatively new data source?
The USCRN data base reports soil temperatures at 5, 10, 20, 50 and 100 cm depths. (and a ton of other stuff, too.) I suppose that’s so farmers know when to plant.
Daily Documentation: https://www1.ncdc.noaa.gov/pub/data/uscrn/products/daily01/README.txt
Daily station-year files: https://www1.ncdc.noaa.gov/pub/data/uscrn/products/daily01/
USCRN data tables: select all, copy/paste into Excel, in data tab select “text to column,” delimited, by spaces and POOF Excel rows and columns ready for analysis. Change date column to 01/01/xx date format otherwise the insert graph feature goes nuts.
Goes back to 2000.