Global effects of El Niño event seem to have passed, and we’ve cooled to a value just before the event, according to data from the UK Hadley Climate Centre
Earlier we reported on ocean temperatures dropping, now we have confirmation that global air temperature is dropping as well. The latest data is in, and now according to HadCRUT data, we are back to the same level as before the 2014/2016 super El Niño event heated up the planet.
Clive Best writes:
The HadCRUT4.5 temperature anomaly for September calculated by spherical triangulation is 0.54C, a fall of 0.17C since August. Temperatures have seemingly returned to a long trend after the 2016 El Niño.

Clive Best uses a custom triangulation method to calculate the global temperature anomaly from the raw data, so I thought I’d verify this from the publicly available HadCrut data.
Source of global temperature anomaly data:
HadCRUT4 time series
These ‘best estimate’ series are computed as the medians of regional time series computed for each of the 100 ensemble member realisations. Time series are presented as temperature anomalies (deg C) relative to 1961-1990.
Quoted uncertainties are computed by integrating across the distribution described by the 100 ensemble members, together with additional measurement and sampling error and coverage uncertainty information.
The data files contain 12 columns:
- Column 1 is the date.
- Column 2 is the median of the 100 ensemble member time series.
- Columns 3 and 4 are the lower and upper bounds of the 95% confidence interval of bias uncertainty computed from the 100 member ensemble.
- Columns 5 and 6 are the lower and upper bounds of the 95% confidence interval of measurement and sampling uncertainties around the ensemble median. These are the combination of fully uncorrelated measurement and sampling uncertainties and partially correlated uncertainties described by the HadCRUT4 error covariance matrices.
- Columns 7 and 8 are the lower and upper bounds of the 95% confidence interval of coverage uncertainties around the ensemble median.
- Columns 9 and 10 are the lower and upper bounds of the 95% confidence interval of the combination of measurement and sampling and bias uncertainties.
- Columns 11 and 12 are the lower and upper bounds of the 95% confidence interval of the combined effects of all the uncertainties described in the HadCRUT4 error model (measurement and sampling, bias and coverage uncertainties).
More details are given in the paper introducing the dataset.
According to the Japanese Meteorological Agency, the 2014-2016 El Niño event formed in May 2014.
Plotting the HadCRUT4.5 data (column 2, mean anomaly) for that period yields this:

In May 2014, at the beginning of the ENSO event, Global Temperature Anomaly was 0.608, now in September 2017, it has cooled to 0.561. It appears all affects from that ENSO event are now removed from the global temperature record.
Looks like claims of the “hottest year ever” won’t be happening in 2017, and we may see a return of “the pause” soon.
Don’t expect the official gatekeepers to use any methodology which shows a cooling world.
Reality must not be allowed.
Looking forward to the UAH satellite results for October. Should be available from Dr. Spencer tomorrow or Friday.
JCH expects satellite October to be higher based on through the month figures? If these are available or accessible. Are there sites out there giving daily or weekly updates for some areas.
Hope he is wrong.
I don’t know of updates other than monthlies for UAH observations.
“Hope he is wrong.”
I hope he is right. Warm is good. Warm is healthy and wealthy (to the wise). It is good for plants, food, and humans.
UAH might drop a bit but will likely remain high due to the weak El Nino conditions earlier in the year. Going forward we have a few months of neutral conditions ahead but the biggest impact of the +AMO is in the winter so I don’t look for any big drops in the UAH data until next spring unless we get a lot more ice in the Arctic which I doubt.
UAH for October was 0.63C. Warmest October and a higher anomaly than September.
Love dem wiggles, Bellman.
Should add that this makes the anomaly for October 2017 0.4C warmer than May 2014.
“Love dem wiggles, Bellman.”
That’s what this entire blog post has been about.
Gabro commented – “Looking forward to the UAH satellite results for October.”
the number came in
yesterday. Oct17 was a record high
for
its month,
as was Sep17.
Yup, thanks to the heat radiating off the eastern equatorial Pacific, which is consistent with lowered surface temperature.
And presages future cooling the lower troposphere as observed by UAH.
Resistance is futile!
resistance is exothermic
Bartemis,
Ohm, my God!
Bartemis, you look a little short.
http://i.imgur.com/Bhf5SdR.jpg
I just short circuit this nonsense, Rational.
In response to the 1970’s oil crisis, my university moved back the thermostats in the winter. Our basement electrical lab got down to 58 degrees F.
Our campus newspaper ran a picture of us huddled around a large variable resistor for warmth.
In the summer, my university raised the thermostats during the summer.
The lab I worked in responded by putting a lamp with a 100W bulb right under the thermostat.
Don’t mess with engineers.
Groan. You guys take the cake 🙂
Hey, we’ve been around the circuit a few times.
“Don’t expect the official gatekeepers to use any methodology which shows a cooling world.
Reality must not be allowed”
Unless they change back to the global COOLING scare, caused by CO2, of course, and PRETEND that the Global Warming scare never happened. 😉
They’ll keep up the global warming scare for as long as possible.
Krakow, Poland had snow over last weekend which a native of the city told me about on Monday with the comment that this is several weeks earlier than usual.
What would be interesting would be a correction of the Australian Bureau of Meteorology temperature records and the very likely Cooling effect this would have on global temperatures.
It was recently discovered that an unknown number of BOM weather stations have an artificial restriction limiting low temperatures to -10 C even though the actual low temperature may be degrees lower. BOM also ignore the WMO guidelines for electronic sensors and use a 1 second reading as opposed to the readings averaged over 2 – 10 minutes. UK use the 2 min and USA the 10 min average. Electronic sensors are very sensitive, air temperatures can change by 2-3 deg in seconds hence the need to average this over a number of minutes, not doing so will regularly result in temperatures being recorded which are much higher than the average and thus actual temperature.
I wonder how much the Cooling of past year’s global temps will be if the BOM records are corrected. Mind you the UK HADCRUT records would almost certainly show lower temperatures if UHI was fully corrected for, and that would also Reduce the global temperature record sets.
Both much simpler, far cheaper and more effective ways to reduce global temperatures than reducing CO2 emissions which has no real effect.
This is how it works. As a generation ages and moves on the leftist move from global cooling (the scare from the 60’s/70’s) to global warming (today). Few ever notice or remember. The Leftist must do this because all their predictions never materialize in the 10, 20 or 30 or so years. And because of this the the theme must be changed.
Another thing I’ve noticed the Leftist commonly do is take an issue or trend, albeit the environment or a social issue or whatever, and no matter how subtle the change they magnified it to the nth degree an try to cause a panic. With the Left it’s all about emotion. Facts matter little.
Yes, we. the masses(Marxist vocab) were by now supposed to be huddled atop glaciers.
They can’t have rising sea levels with global cooling, or the poor starving polar bears. Starving people are OK with them, but the polar bears…
That is why they changed from Global Warming to Climate Change.
they already did that in the 70’s same “cure”: MORE taxes MORE regulations
No matter what the problem, the answer is always the same.
More government.
Have you ever noticed that the Left always promotes investment, they rarely advocate spending.
Sounds better, why worry about accuracy.
SteveT
The only value of the official narrative of events is that it tells us what is not true.
The more strongly the corporate elite promotes an idea, the more confident we can be that the opposite is true. When the corporate elite declares — via its government and corporate media representatives — that something is good, we know it is bad; when the corporate elite declares something is true, we know it is false.
When they tell us vaccines are safe, we know that vaccines are poison; when they tell us GMO foods are safe, we know that GMO foods are poison; when they tell us adding hexafluorosilicic acid to drinking water is safe (fluoridation), we know that hexafluorosilicic acid is poison. When they tell us that ISIS is a dangerous Islamic terrorist organization that suddenly appeared fully-formed out of nowhere and that it must be defeated at all costs, we know that ISIS is a manufactured enemy created to provide an excuse for more war and more government control.
And so it is with global warming, anthropogenic or otherwise. When the government and the corporate media tell us that the earth is warming, we know it is cooling.
The most significant determinants of the earth’s climate are solar output, volcanism, and the precession of the earth’s orbit. The actual temperature fluctuations of the past hundred years are not excessive; total global ice cover is increasing, not decreasing (the alleged decline of arctic ice is more than offset by the increase in Antarctic ice); and according to the geologic record, the earth is about due for another ice age: We are headed for a lengthy period of global COOLING.
I guess it is all a matter of the self-chosen vantage point from which to “view” reality.
This is the plot of the entire dataset:
https://crudata.uea.ac.uk/cru/data/temperature/HadCRUT4.pdf
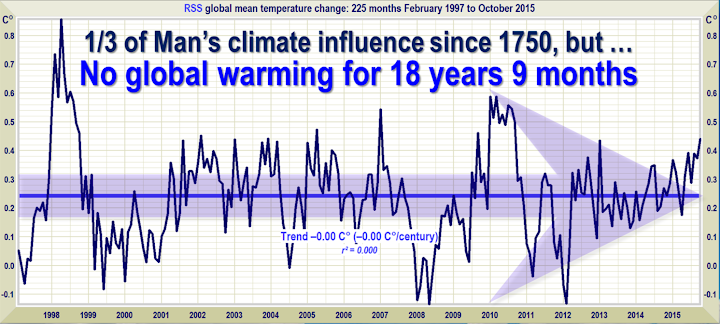
You can “clearly” see the “Pause” in the warming…..
“Walking towards the fire” as the Breitbart quote on your website says, is what humanity is obviously doing. What one should call this, I will leave to the reader.
“and we may see a return of “the pause” soon.”
The pause is a lack of significant warming NOT AN ALTERNATIVE FOR COOLING. As such the pause never went away.
I’ve long suggested that “the pause” should be considered as a change that is closer to no net change than the 0.14C/decade change – or just to use a round figure, any change of +/-0.5C/decade or less.
“The pause is a lack of significant warming”
“The Pause” is a loaded term originally propagated by supposedly objective scientists, intended to imply that the warming they were so emotionally invested in would start back up again (as if they could see into the future). Their use of that term is one of the reasons I don’t think much of them as scientists. Objectively, the lack of warming over an extended period should have opened themselves up to at least the possibility that their theories of anthropogenic warming were flawed, at least in degree. No intellectually honest scientist woulds so casually disregard the philosophy that data should be used to test a theory, in favor of an approach that treats the theory as absolute and contrary data being just a temporary aberration.
Kurt commented – “Objectively, the lack of warming over an extended period should have opened themselves up to at least the possibility that their theories of anthropogenic warming were flawed, at least in degree.”
you don’t understand the science.
natural fluctuations don’t disappear in an
agw world. they’re still there and still operate,
and can cause (surface and LT) temperature
swings of a 0.2-0.3 C/decade.
agw is a long term phenomenon, lasting a couple
of centuries. a decade or two of flat temps in one
variable like surface
or LT
can happen, when natural
fluctuations
offset the GHG warming.
that happened several times in the
20th century, and will happen ago (though
with less frequency as warming increases
in thenext
few decades.
scientists are well aware of this.
What kind of scientist are you, crackers345? What are your credentials to lecture me?
AGW has been proved. there
will be no unproving it, because it’s a
fact. CO2 will never
again revert to
innocence. it’s a
powerful ghg that warms
planets.
magnitude & timing still
uncertain, but co2 causes
warming, period, with
climate sensitivity of > 2 C and
probably more like 3 C.
sorry
‘crackers’ claims CO2 causes the warming and that the ‘climate sensitivity’ is > 2 C and ‘probably more like 3C’.
Clearly crackers has never examined Figure 7 of this published and peer-reviewed paper
“New Study: Global Warming Standstill Confirmed, Climate Models Wrong”
http://www.iieta.org/sites/default/files/Journals/IJHT/35.Sp01_03.pdf
I’m guessing ‘crackers’ chose their nickname for the racial slur used by the Left, but it is more than apropos when used in another sense.
Wow look, crackpot put 10 line of moronic incoherent anti-science garbage together.
Lines were very short.. but hey, twitter has that effect on “wasted” minds.
Yep, Crackers, AGW is an unfalsifiable theory, therefore it is true!
James commented –
“Yep, Crackers, AGW is an unfalsifiable theory, therefore it is true!”
not what I wrote.
i wrote that AGW has been proved.
therefore, like the law of induction, like
conservation of
energy, like F=dp/dt, it’s a fact. and
there is no disproving facts.
(it’s actually a quite easily proved fact, a
very obvious fact)
“AGW has been proved.”
Man, those hallucinogenics they have you on , sure are whacking out your crackpot little mind.
ZERO PROOF. !!
@crackers345 November 1, 2017 at 9:43 pm
“AGW has been proved.” Where is this proof you speak of? You cite no references. You provide no links. You go on to state, “…co2 causes warming…” (sic). Well the “Pause” you just dismissed with a wave of your hand occurred during a time when atmospheric CO2 levels were increasing, a phenomenon that, according to the AGW WAG (cuz it still has never been elevated to Theory, and is a few major details shy of a Hypothesis) CANNOT HAPPEN!!!! Therefore, ergo, ipso facto, and QED it is WRONG!!! In other words, you left out a word, “…AGW has been proved [wrong]…” There, fixed it for you. Now, if you have, or can direct me to, any research or calculations that indicates I might be in error, please, by all means, feel free to introduce it. I’d like to peruse it.
If we consider philosopher Karl Popper’s definition of science, badly paraphrased, as:
1. What is already disproven, or
2. A hypothesis capable of being disproven,
Then we know the AGW hypothesis is not science, using #2. The only way AGW could be true in Popper’s analysis is that #1 is already true.
So is Popper’s method worth using? Consider a Geocentric universe hypothesis. We now know that to be untrue. That hypothesis is science. By knowing it is not true, using Occum’s razor, inter alia, we know more about the nature of the universe.
Popper would suggest that what Crackers deemed to be proven is not science, but what Hayek called scientism.
crackers345,
come on, all scientists will tell you that even Einstein’s theories or Quantum Mechanics have NOT been proved, despite working so fine we actually make stuff and accurate predictions with them, and here you come and you dare say that AGW, that we make no stuff out of, and makes failed predictions, has been proved?
Ô the hubris
crackers, you don’t understand the politics.
Alarmists told us years ago that CO2 was so powerful that it would overwhelm all natural variation.
Regardless, if a few tenths of a degree of natural variation is sufficient to overwhelm the warming of CO2, then CO2 doesn’t warm anything enough to worry about.
crackers, CO2 is a ghg, only your fevered imagination makes it a powerful one.
It is one of the weakest of all the ghgs, In most of the bands that it is capable of absorbing, water vapor has already saturated.
The few bands where it doesn’t overlap with water vapor it’s almost saturated and the earth doesn’t emit much energy in anyway.
Cracked said,
“Its (CO2) a powerful ghg that warms planets”
A complete and utter falsehood. The Sun warms this planet. Period. GHG’S do not generate heat. GHG’S must be warmed by something else. They merely absorb and emit radiation. There is ZERO evidence that the weak, long wave radiation absorbed and emitted by CO2 in Earths atmosphere even CAN warm land or oceans, let alone that it HAS.
If CO2 was so powerful it could “warm” objects, then why aren’t office buildings, schools, homes etc in which the CO2 levels are between 1,000 and 2,000 ppm too warm to inhabit?? And why is pure, concentrated CO2 so freaking cold??
Basic science crack.
“AGW has been proved. there will be no unproving it, because it’s a fact.”
Sorry, theories are theories, not facts. Just as the earth-centered universe and stationary continents and the slowing expansion of the universe were once “proven” theories, all it took was one experiment to disprove them. All theories are one result away from being disproved, that’s why they are called “theories” and not theology. When the Nazis published a book in the 1930’s title “100 scientists again Einstein,” all Einstein said in reply was “If I was wrong all it would take is one scientist.”
“Crackers345:
you don’t understand the science.”
You don’t understand my post. Everything you said is one possible explanation as to why temperatures flattened for about 17 years prior to the recent super-el-nino. But it’s not the only explanation, Another perfectly plausible explanation is that scientists grossly overestimated the effect of CO2 on temperatures. After all, if natural climate variations were strong enough to cancel all the relatively large CO2-effect in the early 2000s, maybe those unpredictable climate variations accounted for quite a bit of the warming in the late 20th century that some scientists had incorrect;y chalked up to CO2.
Your problem is that you take something that is plausible and treat it as an unsubstantiated premise to illogically dismiss data that, while not absolutely disproving the theory of significant CO2 warning, does make that theory a lot more tenuous. That data should make any rational person reconsider the importance of changes in CO2 on temperature, and dial back on the apocalypse silliness.
But that’s not what the warmist crowd did. They just dismissed the flattening temperatures as being merely a “pause” and went on with their dogmatic mantra.
Jeffrey: science is not done as per Popper.
it’s much more organic, sloppy, nonlinear and
human than anything Popper wrote about.
Nonscientists think Popper is a god, but they’ve
never done any science.
Read
Paul Feyerbend if you want a
realistic portrait of the real
scientific process
Only thing sloppy are your incoherent anti-science comments.
Learn to at least speak English, and to put a sentence structure together.
Your posts are those of a low IQ 12 year old.
Reply to old England. True unfortunately but England is doing the same, as is NOAA and tell me you think the French and Germans aren’t? You can see exactly what old England is talking about by looking up the excellent Jennifer Marohasy who was the woman who first twigged to this particular fraud.
The BOM has also been deleting weather stations that don’t fit the narrative in favour of ones that do, right in the middle of airports and expanding suburbs etc. And…just plain lying by homogenization.
When our globalist ex Goldman & Sachs CEO PM first stole the job from Tony Abbott the first thing he did was stop an investigation into the fraudulent practices of the BOM…his stated reason for this was that it would damage the publics confidence in the BOM!!
A couple of weeks later he was arm in arm with the UN climate-cronies, all genuflecting to the black President and his now infamous “Pause Buster Paper.” The greatest fraud in human history.
PS Lord Monkton predicted with astonishing accuracy that the Globalists would attempt to topple Tony Abbott before the French gabfest.
Historically, “The Pause” in this article was known as “The Average”, and the recent “Cooling Anomaly” was known as “A Return to Average Temperatures”. To label recent Cooling as a “Pause” or “Anomaly” requires an expectation of incremental warming. Expect an article in 2030 or 2035 titled something like, “Global Warming — How could so many smart people be so wrong?” (Who are the smart people where were so wrong? It could go either way, but I give it 70/30 chances that it might be the scientific consensus.)
I think that you are correct, sir.
And I expect that the article you mention will be located near one entitled Oat Bran… Silent Killer!!!
More like “How could so many herd followers claim to be so smart?”
Answer is, they weren’t scientists. They were brainless activists who, all combined, didn’t have an original thought amongst them! And some lying bastards like Mike Mann.
This is just the start and not a short-term departure like earlier ENSO cycle swings. There are other factors lining up or overlapping of cycles this time. Invest in fleece
Buy wool futures.
Wear your woollies.
What happened to the El Niño around 2000 in that dataset?
[1998 El Nino? .mod]
Nothing “happened” to it. I chose a time scale to match what Clive Best did, starting in January 1999. The El Nino you are thinking of was in 1997/1998
“It appears all affects from that ENSO event are now removed from the global temperature record.”
September 2017, at 0.561°C, was only slightly lower than annual 2014 (0.579), a record year at the time. And it is higher than any earlier annual average. Monthly temperatures fluctuate. November 2016 was 0.553, but the start of 2017 was much warmer.
The cooler September was mainly due to a steep dip late in the month. It warmed again, and October will be warmer overall.
2017 won’t be the warmest year, but is quite likely to beat 2015 for second.
That doesn’t matter. The Globe is supposedly 0.561C higher than the 1961-1990 average. The addition of ocean data through ARGO Floats gives the best known coverage of the entire surface. How old is ARGO? !961-1990 surface data is still suspect in it’s actual portrayal of a GAST. We’re giving too much credit to CO2 Warming IMO.
Nick,
The effects cannot be “removed” from the global temperature record but what has happened
Is that the temperature has now subsided back to the recent average.
It has some way to go to reintroduce the pause, basically one La Niña of similar effect to the recent El Niño i.e. 2 years or a steady drop over 3 years, both possible.
I see you and JCH pushing the second warmist year in the context of a recent very large El Niño.
Have you no shame.
Firstly it is before any actuality so it is plumping up the disaster meme.
Secondly it is taking advantage of a recent warming singularity.
Like so much of what you argue you take a technicality and weave something out of it which is a wrong interpretation.
Keep going, it is like watching someone play twister, interesting , informative, artistic and irrelevant.
“Secondly it is taking advantage of a recent warming singularity.”
Seems to be more of a trilogy. ♆
We were told 2015 was a singularity. Then 2016. How long can this go on?
Nick,
Super El Ninos are always multi-year. I’d have thought you would have noticed that fact.
good catch, Nick
Gee, Nick, what happened 2001 to 2014? Flattish?
Hiatus, anyone?
CAGW saved by 2014-16 Super El Nino? N. Pacific Blob?
Dave Fair commented –
“Gee, Nick, what happened 2001 to 2014? Flattish?”
1. natural fluctuations
2. cherry picking end points
3. such hiatuses happened many times
in the 20th century – 7, I think, according
to an
Oreskes’ et al paper.
Oreskes? Ha, ha, ha.
And you said it all, crackers: Natural fluctuations!
Nothing you have [ever] said justifies fundamentally altering our society, economy and energy systems. Modelturbation is just that: expensive speculation based on unproven assumptions.
Empirical CO2 ECS and TCR studies approach zero; one might tease out 1 degree C per CO2 doubling, at best.
Beware crackers, “Natural fluctuations” is two edged sword.
If it is strong enough to negate some trend, it is also strong enough to explain the trend all by itself
Only Orwellian masters can have it both way, but you’r not one, so basically you are just embracing a skeptic or “D” story: this all natural fluctuations we are not able to explain
pappylfarq: wrong.
what “natural factors” explain
20th century warming?
the same that “climate scientists” cannot explain either for previous warming (1920-1940 for instance). You don’t find that specific enough? neither do I. To bad “climate scientists” are just incompetent.
I agree with Nick here. Monthly temperatures fluctuate. A 1-year moving average shows that we have only cooled about half of the warming of the 2014-16 El Niño. Temperatures are at the level of August 2015, and 2017 is going to beat 2015 easily.

The last 3 months have been pretty warm, but a colder winter than the past few years appears likely at this point. That’s what the meteorologists are saying.
https://www.thesun.co.uk/news/4795922/weather-forecast-coldest-winter-temperatures-plunging/
My reason to believe they are correct is that we are close to a solar minimum, and the Quasi-Biennial Oscillation is in East mode, conditions that are statistically related to a higher probability of colder NH winters.
You believe CFSR?
I don’t.
What’s CFSR? I don’t understand this love for acronyms that keep most people from knowing what is all about.
Javier,
The acronym CFSR is on your graph. It’s its source: NCAR’s “CLIMATE FORECAST SYSTEM REANALYSIS”, a third-generation reanalysis product.
I beg your pardon for not spelling it out. I foolishly assumed that you knew the source of your graph.
https://climatedataguide.ucar.edu/climate-data/climate-forecast-system-reanalysis-cfsr
OK. Sorry. We are talking in two threads simultaneously and I use the WordPress comment editor so I was confused. I thought it was about glaciers, silly me.
Reanalysis is in my opinion far superior to the way other temperature databases are built. It includes both satellite and station data. ECMWF (the European product) is my preferred one, but NCAR’s CFSR is fine too.
The good thing about reanalysis is that it is made for weather forecast every few hours, and people’s lives depend on it. ECWMF is made by a 34 country consortium. There is no data tampering there and its commercial value is immense. No incentive for finger-tipping the scales and no way to go back and change the data every Tuesday as GISS does.
Reanalysis will make GISS, HadCRUT, RSS, UAH, and so on obsolete.
Sorry for the caps. I just copied and pasted the name from NCAR’s site.
You should use a running average instead of a centered average since future temperatures have nothing to do with the average at the time. Even 1 year averages are not near long enough if you want to see meaningful long term trends. Ideally you want to include a whole number of El-Nino/La-Nina cycles and a whole number of solar cycles. Anything less than about an 10 year running average will not tell us anything about long term trends.
I don’t make the graph. Oz4caster does. But I like the way he does it. I am interested in knowing with little noise what the global average temperature anomaly is doing. Since February 2016 it is going down very slowly, despite this article. But as long as the cooling continues, a return to Pause average temperatures is possible.
Javier November 1, 2017 at 4:28 pm
IIRC, Willis rejects all reanalysis “data” out of hand, but IMO you make a good point as to why to prefer it over the cooked book “surface” sets, if not satellite observations of the troposphere.
It is taking TOO LONG for the climate to return to its pre-El Nino level.
People are mucking around with the numbers. That is all there is to it.
Bill,
That is because the lack of a La Niña after the big El Niño in my opinion. I expect a La Niña should develop sometime in the 2018-2020 period, but not this winter.
So the after-El Niño cooling might turn out to be smoother but longer.
Bill,
The usual suspects are always mucking with the numbers.
But IMO the UAH team are the last bastion of honest science in this numbers game. If they find that the recent Super El Nino aftermath is cooling off less rapidly than the previous Super El Nino, I’m OK with that.
IMO the planet is due to cool, and will do so sooner or later, and to such an extent that no amount of nookying with the numbers or cheap tricks will be able to hide the decline. Then the gatekeepers’ heating up the present, when it’s the past, will come back to bite them in their collective, well=padded posterior.
CACA spewers have forgotten that what goes up, must come down.
They unrealistically and unphysically imagine, if they’re even serious, that you can extrapolate from the natural warming of 1977 to the late ’90s or early ’00s indefinitely. And they’ve tried to make disappear the natural cooling of the ’40s to ’70s, despite rising CO2.
In south east Australia temperatures have remained cool throughout Spring and I put it down to the collapse of the high pressure belt, alternatively known as the Subtropical Ridge.
A modest La Nina now would keep temperatures subdued and give us breathing space to test our theories on a quiet sun.
Javier says –
“That is because the lack of a La Niña after the big El Niño in my opinion. I expect a La Niña should develop sometime in the 2018-2020 period, but not this winter.
So the after-El Niño cooling might turn out to be smoother but longer.”
these are natural fluctuations.
so they won’t say anything about AGW, except
that the last El Nino seasonal
year, the last La Nina
year,
and the last Neutral year were all
records for their
classification.
Because the Little Ice Age was freaking cold?
Because today is freaking cold over the Holocene?
Because somehow this all has something to do with current (low) CO2 levels?
Because there is gold in them thar models?
“2017 won’t be the warmest year, but is quite likely to beat 2015 for second.”
In which data set? Reality …… or in GISS, HadCrud
Nick,
I look regularly at woodfortrees.org to check the 4/5 main temperature anomalies plus the SST readings etc.
Paul Clark the founder of the site acknowledges there that he is a committed green advocate.He thinks that humankind’s greenhouse gases are driving the world’s temperature increases since the mid-twentieth Century.I happen to disagree with him.
He correctly points out that you can prove that the world temperatures are rising, rising sharply, falling or static, depending on your start and end points.
However he does note that since 1950 the rate of warming on the woodfortrees composite index appears to be between .13 degrees Celsius and .17 degrees Celsius per decade, if the warming continues at the same rate as 1950 to now.
However the rate of warming this century is clearly a fraction of that former decadal rate ( the pause).
We now have the ridiculous policy position that the UN IPCC want literally trillions expended by developed nations to restrain the temperature rise to 2050 to below 2degrees Celsius which will currently occur without any expenditure whatsoever if the former rate of warming(1950 to now) is maimtained.
Put simply,the rate of warming has to accelerate greatly to make this endeavour worthwhile even assuming that the UN devotee Nations can close the gap between promises and actions.
In Australia for the first time a Sky news poll this week shows 45% of those polled wanting to withdraw from the Paris accord, 40% remaining and 15% don’t know.
This is down from about 70% wanting action on climate change in 2006.
The reason: skyrocketing electricity and energy bills.
All the climate science in the world is not going to save “the cause” if this continues.
Herbert,
“However the rate of warming this century is clearly a fraction of that former decadal rate ( the pause).”
Not true. The trend of the WFT index from 2000 to now is 0.166 °C/decade.
Ending on a Super El Nino, Nick.
Should we fundamentally alter our society, economy and energy systems on such a small number? Please, please tell me Nick.
Shocking! Since 1950 we have less than 0.2 degrees C per decade increase in global temperatures according to Wood For Trees, Herbert. In the 21st Century we have had far less, with much more additional CO2.
“The trend of the WFT index from 2000 to now is 0.166 °”
Using the NON-CO2 El Nino again…
oh dear, *snip*… the desperation in palpable.
You KNOW there is NO TREND without that totally NATURAL El Nino.
Why are you resorting to BASELESS LIES and DECEIT, Nick ?
“Ending on a Super El Nino, Nick.”
I didn’t choose the time interval. Just trying to get the numbers right.
I’m trying to get this right: “There are lies, damned lies and statistics.” Mark Twain
Any reasonable person, standing back and looking the surface temperature paleo estimates from the beginning o the Holocene, thermostat estimates from 1850, radiosonde estimate from 1958 and satellite estimates from 1979 would have to agree that, overall, nothing alarming is going on. Argue that, Nick.
One could nitpick any period and produce results to support any position one needed. Nonetheless, Nick, you will have to support the position that any period chosen, coupled with IPCC climate models, justifies any costly and fundamental changes to our society, economy and energy systems. Can you so justify, Nick?
D Fair wrote –
“Ending on a Super El Nino, Nick.”
the 30yr trend for
any surface dataset has
been 0.15-0.2 C since
the early 1990s.
it doesn’t depend on
cherry picking. i can’t say
the same for many of the
other claims
here.
Sum-bitch, crackers345! Explain to me why a trend of 1.5-to-2.0 degrees C per century is worrisome.
El Ninos, the ONLY warming.. as you well know, Nick.
Absolutely NO CO2 warming signature in the satellite temperature data, ONLY NATURAL EL NINOS
Stick to THE FACTS, Nick, and stop squirming !
get your “return” key tourettes under control crackpot.
Dave Fair commented –
“Any reasonable person, standing back and looking the surface temperature paleo estimates from the beginning o the Holocene, thermostat estimates from 1850, radiosonde estimate from 1958 and satellite estimates from 1979 would have to agree that, overall, nothing alarming is going on.”
how so?
how does today’s rate of warming compare
tp
historical rates?
you can choose the historical
period.
Piss off, ignoramus. You know what I am saying; you just can’t deal with it.
Your posts really do make you look like a low IQ 15 year old..
You do know that, don’t you crackpot ?
Ah, Nick Stokes is the guy that Tony Heller schooled.. sorry Nick, but you are not credible until you go to TH’s site and prove that his analysis of the raw NOAA data is wrong. He even provides you with the software. You can check it. He’s calling you out Nick..
Today’s rate of warming..?
Do you mean the COOLING since the peak of the EL Nino?
or shall be avoid EL Ninos transients and steps, (since they are NOTHING to do with CO2 or anthropogenic anything), and look at the periods between them.
Like say from 1980 – 1997..

and from 2001 – 2015..

Oh look,
NO WARMING in the whole satellite temperature data except for NON-CO2, NON-ANTHROPOGENIC El Nino events.
ENSOs happen — and they keep
getting warmer (avg mthly LT temp),
whether for la nina,
el nino or neutral.
“…2017 won’t be the warmest year, but is quite likely to beat 2015 for second…”
Were you holding hands with Gavin as you typed that?
“Were you holding hands with Gavin as you typed that?”
Hands?
An El Nino brings previously-warmed water from many metres below the surface to the surface. The real warming is not the El Nino warming that we see in the graphs, but the earlier warming. So what matters now is not the surface temperature that everyone is concentrating on – what matters is the temperature below the surface. How is that going??
Mike Jonas: “– what matters is the temperature below the surface. How is that going”
WR: Correct. And how was (!) that going. What are the mechanisms behind the storing of the heat? And behind the release of the heat? My guess is that a complex of ocean movements and wind and pressure systems will reveal the mechanism(s) behind surface temperature changes. We are still far from the point that ‘we know’.
For example: ‘wind’, what do we know about ‘wind’? Wind plays a main role in El Nino / La Nina situations, in oceanic upwelling, in mixing of the upper layers of the oceans and so in temperature developments. But what do we know about ‘wind’ and its variations and about the mechanisms behind ‘wind’? Not so much and so far ‘wind’ stayed out of the attention of nearly everyone.
There is still a lot to discover.
Based on the evidence, partly from BoM? Where they don’t do any averaging of TMax? What is the proportion of BoM temps as part of the SH?
-Nick Stokes
The truth is illustrated in the facts you choose to ignore.
The earth has been warming naturally since the depths of the Little Ice Age
We are at a warm point of our interglacial
The period from approximately 1940 to 1970 showed natural variability to the cool side, and present temperatures are much like the 1930’s
The past shows that natural variation is significantly greater than what we see recently and occurs repeatedly.
Today’s and projected CO2 levels are dwarfed by what has existed in the past, during which life flourished.
Climate science is infested with fraud, Nick! Why don’t you apply your talents to that problem?
The called for response to this non-problem is far, far worse than the real problem would be! Even the IPCC says that warming up to 1.8C is generally beneficial. Does it become catastrophic at 1.9?
I can’t believe your conscience lets you sleep at night. Millions will suffer from the economic consequences of this madness, for no gain whatsoever. In fact, the evidence shows that wealthy countries take better care of the environment than poor ones. Why do you want everyone to be poor?
john harmsworth commented >> The earth has been warming naturally since the depths of the Little Ice Age <<
warming caused by what natural factor?
Leave your ghetto basement in the daytime, and look up. !!
Where’s the ACCELERATED warming Nick/cracks ?
the warming is obvious in
ocean heat content
The OHC was NOT measured before about 2003. Even now it is near impossible.
It is a MODEL based product. There is far to little data for the TINY changes that Levitus etc show to be anything but modeled.
wrong. and wrong.
https://www.nodc.noaa.gov/OC5/3M_HEAT_CONTENT/
0-700 m OHC since 1955:

Poor cracked.
Show us where the MEASUREMENTS were taken before 2003
Waiting !!!
Look at the percentage coverage before 2003, and tell us if you REALLY think they have enough viable measurements to calculate OHC to the TINY amounts shown in the graph.
Try to THINK, for once, if you are capable.

This is ALWAYS a classic 🙂
https://earthobservatory.nasa.gov/Features/OceanCooling/page1.php
And of course, Sea temperatures are now starting to drop as the AMO and PDO turn downwards and a La Nina starts to form.
Will be funny watching the alarmista ducking and weaving. 🙂
Andy, this is the last response you will
receive — not interested in your juvenile,
uninformed replies.
the publications are on the page I gave you –
linked. read them.
World ocean heat content and thermosteric sea level
change (0–2000 m), 1955–2010
S. Levitus,1 J. I. Antonov,2 T. P. Boyer,1 O. K. Baranova,1 H. E. Garcia,1 R. A. Locarnini,1
A. V. Mishonov,1 J. R. Reagan,1 D. Seidov,1 E. S. Yarosh,1 and M. M. Zweng1
GEOPHYSICAL RESEARCH LETTERS, VOL. 39, L10603, doi:10.1029/2012GL051106, 2012
Received 26 January 2012; revised 11 April 2012; accepted 16 April 2012; published 17 May 2012
Andy, this is the last response you will
receive — not interested in your juvenile,
uninformed replies.
the publications are on the page I gave you –
linked. read them.
“World ocean heat content and thermosteric sea level
change (0–2000 m), 1955–2010”
S. Levitus et al, GRL v39 L10603 (2012)
I see you DUCKING and WEAVING from producing ACTUAL MEASUREMENTS, or even where they were taken.
I am WAITING !!!
Seems that you KNOW that the OHC by Levitus is NOTHING but a mashed together model.
Thanks for letting everyone know that you HAVE NOTHING TO OFFER.
And yes, I have read the Levitus paper.
As I said, mashed together, data is extremely sparse, almost non-existent in many parts of the ocean, especially the southern oceans.
You do realise what a tiny temperature difference 10²² Joules is, don’t you?
Do you REALLY, in your wildest imaginings, think that they have that sort of measurement accuracy, even now.
Are you really that GULLIBLE and mathematically naive?
crackers345 November 4, 2017 at 9:17 pm
” not interested in your juvenile,
uninformed replies.”
Hehehe!
Coming from you – classic!
Have you ever thought of retraining as a stand-up comic?
Damned impressive measurements to be that accurate. How do they do that?
TApply proper margins of error and then try to make those statements.
It’s easy, Patrick! They determine what temperature they need to ensure their grants are approved. Then they bend the various needles to say what works!
“2017 won’t be the warmest year, but is quite likely to beat 2015 for second.”
1998 is second.
not for ocean heat content
or for avg surface temps
And of course, there is NO mechanism for CO2 causing ocean warming.
When does anyone expect to bring back the 1920-1940 Global Warming, since there is a lot of correlation between sea surface temps and land-surface temps? I have yet to see as many 100F to 110F temperatures as were prevalent during the 30s. Judith Curry presented an article in 2013 about Russian researchers documenting Arctic Ice Melt and we know that the U.S. had extreme warming during that period.
Pretty soon Vicvucik will gallop forth, and declare that he “told us so” a few years back. I for one am happy with that.
The ocean does contain a larger fraction of the integration of incident insolation than the land or air. Land’s heating is too shallow (in actual depth) per day; at night it can easily radiate away. Air’s is even less tenaciously held – there’s ONLY about 10 tons of air above every square meter of dirt, and most tropospheric heating occurs in the bottom 25% of that. Like dirt tho’, it is a fairly efficient IR radiator, so (as evidenced by the 40+ degree temp swings in clear-sky deserts), the diurnal swing can be big. Being IR transparent as well (to a lot of wavelengths), it allows dirt to cool actually below air temperature on sufficiently clear nights.
So the ocean’s top 50 meters is the carrier of a lot of seasonal thermal energy. The Al Gore (and Hanson) schools of Hubris and Alarm like to stir the narrative that we’re not even seeing the majority of the integration of insolation … because the oceans’ temperatures change so LITTLE with so much intercepted energy. Because they’re so deep. But also that means if we’re doomed in the future, we’ve already lit the fire under our stewpots today and in the last 50+ years of our Anthropocene Era.
I kind-of don’t think so. Ocean currents have their seasons. They have there decadal variations. They have their century-long and multi-century (if not millennial scale providences). We have fairly strong evidence that there are giant time-scale chaotic attractors that change things up on whole hemispheres of the planet due to forces we very simply don’t understand to any projective confidence, at all.
For instance, once the Sahara was a Savannah. It had lots of grasslands, lots of seasonal rain, plenty of open water and open rivers. That was what, about 8,000+ years ago? I’m guessing. I think it was called the Neocene Subpluvial. Or maybe Neolithic Subpluvial. Or Holocene Wet Phase. 9,000 a – 7,000 a before present.
Then, like someone turned off a frikkin light switch, it desiccated. Why? Well … the sad but true answer is, we just don’t dâhmned know. Indeed, there’s an equally remarkable paucity of theories as to why the HWP itself came into being. Millennial scale giant-region CLIMATE changes. Big ones.
It’d be interesting to see how the upper 50 meters of ocean has really been doing in the instrumental record. We see snippets of it, but the whole thing?
GoatGuy
https://en.wikipedia.org/wiki/Neolithic_Subpluvial
Easier just to remember “Green Sahara”, roughly 5.0-9.5 Ka, or the Holocene Climatic Optimum.
GoatGuy,
The truth is we know very well why the Sahara desiccated when it did, since the mid-80’s. The Inter-Tropical Convergence Zone, the climatic equator, moved southward following hemispheric changes in Milankovitch insolation due to the orbital variations of the Earth. The African monsoon stopped reaching the Sahara.
The Sahara will be again green in about 8000 years. You can buy now cheap land there and make a killing when the rains return.
Not surprisingly, humans have been blamed:
https://www.frontiersin.org/articles/10.3389/feart.2017.00004/full
” … because the oceans’ temperatures change so LITTLE with so much intercepted energy.”
Definitely incorrect. Anomaly analysis only makes it seem that way since the seasonal variability is subtracted out of the data. The global average temp changes by about 5C every 6 months in lock step with N hemisphere seasonal variability. The global average ocean temperatures changes by about 3C.
The global average change is not representative of the actual response, since each hemisphere acts and responds largely independent of the other as most circulation currents are wholly contained with a hemisphere and very little energy is transported between hemispheres. On a hemisphere basis, the global averages vary by about 11C in the N and 6C in the S. Similarly, the N and S hemisphere specific ocean regions vary by 7C and 4C respectively on a seasonal basis.
The ocean average temperatures were arrived at by filtering 3 decades of ISCCP surface temp data on pixels over ocean.
“…, and we may see a return of “the pause” soon.”
I don’t want to be the bad guy here, but wouldn’t it require a lot of ‘normal’ temperatures, or some quite low temperatures to bring back the pause?
Even “normal” won’t do. When the trough gets as big as the spike, things will change.
Tee up Superwoman. La Nina 2018.
It would require 2018 and 2019 to look like 2000 and 2001 in the above graph. That is, cooling two years after the 1997-98 Super El Nino would have to be repeated after the 2015-16 Super El Nino.
Or a longer period of time with temperatures less far below the median line.
It depends on how one defines the term ‘pause’… Since temps are right back where they were before the el nino, the pause is back. We don’t have to wait til temperatures fall far enough to give us a zero trend. That would entail a significantly cooler temp anomaly than was maintained during the pause before the el nino. (sometimes it behooves us to use a little common sense)…
That is how Lord Monckton always defined it.
Yeah, i know, but think about it for a moment here, werner… The pause really should be defined as the anomaly at which temperatures stopped rising. If we get back to that anomaly then the pause continues. (how absurd it would be if temps started cooling below the level of the pause and yet we couldn’t even state that the pause is back!) Sometimes we have a tendency to over think things in climate science.
Temperatures peaked on February 2016 on most data sets. So they stopped rising in March. Are you suggesting that the pause started in March 2016?
Having said that, I agree that the pause can be defined in other ways. But a slope of 0 or less is easy to define and easy to spot on a graph. It would just lead to confusion if we all talked about the pause with our own unique definition of the pause.
Werner, mine is not a unique definition. It’s reality(!) With your sci fi definition, we could actually see temps cooling below the level of the pause* while the trend still shows warming…
*roughly where temps were from
’02 until the recent el nino
Sorry, werner, i forgot to close the bold after reality (actually i think it was the parenthesis around the exclamation point that did it) i wasn’t shouting at you! If memory serves me correctly, you’ve not been well of late (no?). If so, i hope and pray you are doing better…
Thank you! I am not 100% health wise and may never be. But I am able to cope with what I have.
Affirming life, Werner. That is all any of us can do.
Hang in there. Good luck.
It depends on how one defines the term ‘pause’…
True.
A pause as you are defining it is from now back to any previous time where the trend is zero.
Easily done.
But short.
The pause, the big one, started 20 years ago and 2 years ago went back 18 years.
Gone since the last El Nino.
That pause, that flat level, still exists.
It can come back if we fall enough quickly with a big La Nina or slowly with a a 4 year steady fall in anomalies ,in which case the extended pause will be 24 years duration.
Enough to give Nick and Gavin a major headache and for them to talk of 60 year cycles instead.
The pause should be viewed with El Niño and La Niña data excluded. The temp should be viewed as the baseline upon which those types of defined temp fluctuations are added.
But then …. I don’t believe in global anything …. only regional.
afonzarelli wrote:
“Since temps are right back where they were before the el nino, the pause is back.”
absurd. the 10yr change
in the 10yr moving avg
is 0.10 deg C. (HadCRUT 4.6)
and more importantly,
the top 700 m of the ocean
has heated tremendously in the
last 10 yrs compared to the 10 yrs
earlier: 4.8 x 10^22 joules which
is 3.0 W per square meter.
huge.
Cracker said
“and more importantly,
the top 700 m of the ocean
has heated tremendously in the
last 10 yrs compared to the 10 yrs
earlier: 4.8 x 10^22 joules which
is 3.0 W per square meter.
huge.”
Yea huge number, but Joules are such a wimpy unit. Your palm sized cell phone battery stores 10,000 Joules.
Why not report the temperature rise? Temperature is how the data was gathered, I’m pretty sure they don’t directly measure Joules. Not so huge.
we are just starting measuring heat content, with a drifting thermometer per 3° latitude longitude square … roughly equivalent of a thermometer in a ballon for the whole atmosphere
This data is enough to estimate ocean heat content magnitude, but to claim you can evaluate its evolution in the last 10 years is so much hubris…
And of course (who is surprised?) you are wrong in your number. 3.0 W per square meter x 360.000 km² of oceans x 10 years are 3.4. x 10^20 joules, while 4.8 x 10^22 joules in 10y translate in … 420 W per ocean square meter! Huge indeed, so huge it compares to twice the average sun energy.
Jeff a rerun of the 1950s and 1960s is expected imminently.
It is interesting to note that the 1960s had only one weak La Nina with 3 El Nino events and still produced cooling. I think this shows the biggest influence on the global temperature comes from the AMO driven sea ice variation.
If Arctic ice continues to expand and gets back to 1970’s levels, the Northern Hemisphere temperatures will head for the bottom of the thermometer. Then we can compare to the 1960’s and get a sense of the scale and persistence of the natural warming trend that has been delivering us out of the LIA.
The weak La Nina of 1964-65 appears to be unrelated to what happened in Britain a year earlier, this from wiki.
‘In January 1963 the sea froze for a mile out from shore at Herne Bay, Kent. The sea also froze inshore in many places, removing many British inland waterbirds’ usual last resort of finding food in estuaries and shallow sea.
‘The sea froze 4 miles out to sea from Dunkirk, and BBC Television news expressed a fear that the Strait of Dover would freeze across.
‘The upper reaches of the River Thames also froze over, though it did not freeze in Central London, partly due to the hot effluent from two thermal power stations, Battersea and Bankside; the removal of the old multi-arched London Bridge, which had obstructed the river’s free flow, and the addition of the river embankments, made the river less likely to freeze in London than in earlier times (see River Thames frost fairs).’
Joe Bastardi published A chart based on NCEP October 2metre data. Shows nicely where things are.
In the upper right corner:
Global Anomaly .393 C
CONUS Anomaly .596C.
We will see how UAH compares shortly.
Lotsa, LOTSA cool in central Africa.
Doomsday is just 30 years away so I hear. It’ll always be 30 years away, so to not interfere with careers and professional reputations until they are retired or dead.
This reply above was supposed to be for tom0mason below.
UN says CO2 levels catastrophically up — so panic!
But the ‘best estimate’ series of temperatures slump — it’s just a pause?
Err,, right!
No way! 2015 was 0.763. After 9 months, 2017 averages 0.711. So the last 3 months need to average 0.919 to beat 2015. It has not reached that all year and with a La Nina looming, Hadcrut4 will stay in third.
Were you perhaps thinking of GISS where second is possible?
Yes, it’s true that Hadcrut gave 2015 as very warm, and that will be hard to beat. Yes, I was thinking mainly of GISS, where a 2nd place is quite likely.
Still, absolutely NO CO2 warming signal in the satellite temperature data.
Wouldn’t you agree, Nick .
Oh look , Nicks gone all quiet again. 😉
Nick
” I was thinking mainly of GISS.”
meaning
I was cherry picking my data set and hoped no one would notice.
–
“where a 2nd place is quite likely”
But not guaranteed.
Interesting.
On the TALOTW scale it is exactly the same as 1972.
“Were you perhaps thinking of GISS where ANYTHING is possible?” !!!!!
Chaotic. We have yet to sufficiently model the system, let alone properly characterize its various processes and relationships.
Where can we see updated data from the 2012 Watts “All Rated Stations in the Conus.” Right hand column below.
I don’t hear any talk of RSS anymore. What’s up with that?
They joined the Borg.
Even so Gabro, it still smashed the IPCC 1990 per decade warming prediction.
RSS lost some standing with the “denialists” when Carl Mears took them to task for misrepresenting his data.
(The denialists really like to fit trends starting in 1997, so that the huge 1997-98 ENSO event is at the start of their time series, resulting in a linear fit with the smallest possible slope.)
http://www.remss.com/blog/recent-slowing-rise-global-temperatures/
Ohhh here is Jack Dale, who STILL fails to notice that RSS as it is NOW, exposed the utter failure of the IPCC 1990 per decade prediction.
You truly have no idea, do you Jack.!!
No idea how a back calculation works..
NOBODY started at 1997
But as you say, a HUGE El Nino event, NOTHING to do with CO2 or anthropogenic anything. PURELY NATURAL.
And the 1998 and 2015 El Ninos were the ONLY warming in the whole satellite data.
There is NO CO2 warming signal in the satellite temperature data.
I hope your sock is tasty, because your foot is firmly in your mouth.
AndyG55 – “Lord” Monckton does not like being called a “NOBODY”
Sp which one is you and which one is Sunsettommy?
http://www.axtell.com/new/wp-content/uploads/2011/05/APU_RickCina.jpg
AndyG55, here in the USA, we do not recognize titles of nobility. Instead of calling Monckton “Lord” we call him “Chris”
ROFLMAO… !!!
Poor Jack, so dumb he doesn’t even KNOW how that was calculated.
Your ignorance is showing , yet again, Jack
Back to Junior High.. IFF you can manage that simple level of maths.
Hint: the calculation FINISHES in 1997 !! Do at least TRY !
Little Johnson.. So there is no such thing as King of Denmark or Queen of England
You seem to be lost in your own mindless little world, still. !!
AndyG55 – have you noticed that the anomaly is 0.24C above the mean? Above average temperatures are warmer.
Poor Jack,
Doesn’t it embarrass you to be never able to actually comprehend basic maths?
AndyG55, Monckton is not the King of Denmark, but he might be a queen, but he is not the Queen of England. In fact Chris is not even a member of the House of Lords in England, so he doesn’t even hold a political office.
(SNIPPED) MOD
Poor little jack.
Doesn’t have a clue just how ignorant he is showing himself to be.
Please keep going. 🙂
Seriously.. you really DON’T UNDERSTAND…………………… really ??????
I even gave you a hint. !
(SNIPPED) MOD
AndyG55 – That is a photo of Rick Cina aka Kenneth Richard of NTZ. He is a children entertainer. In both roles he uses puppets. Cina also uses the “Kenneth Richard sock puppet.
Poor little jack has gone off into the muppet-like fairyland of his puerile, wasted mind, yet again.
Home at last, hey (SNIPPED).
(Stop with the hostile remarks!) MOD
I see that Jack avoids my PER DECADE comment with a cute insult. It seems that you have no answer for it.
I have no problem using RSS because it destroys the 1990 IPCC .30C per decade prediction.
1990 RSS, .20C trend
http://www.woodfortrees.org/graph/rss/from:1990/mean:12/plot/rss/from:1990/trend
2001 RSS .16C trend
http://www.woodfortrees.org/graph/rss/from:2001/mean:12/plot/rss/from:2001/trend
Despite the recent big El-Nino, it is warming at a lower rate.
Jack, thanks for highlighting that particular lie from Mears. It shows two things. 1) he is dishonest and 2) he is biased. The 1997-98 El Nino had no effect on the longer term trend as it was immediately followed by the 1999-2001 La Nina. The trend from 1997 and 2001 are almost identical.
If you actually fell for that lie then you should be ashamed of yourself for displaying such poor critical thinking skills.
Richard M – Next time trying reading the entire link before making spurious accusations.
Funny thing, the pause started several years prior to the big 97/98 El Nino.
But don’t let mere facts get in the way of a good rant.
When the link starts off with a shameless lie, it usually indicates that the rest of the link isn’t worth reading.
Much like your posts.
And what shameless lie would that be?
Jack Dale, I read your link long ago. That’s why I knew Mears was lying. I did the analysis. Now the big question is why you would assert I haven’t read the link. Did you think spewing anther lie would change anything? All you’ve done now is proven you are just as dishonest as Mears.
Please specify how Carl Mears is lying about HIS data, which is being misrepresented.
Poor Jack simply can’t understand simple English. I already answered your question. Here is what Mears said:
“The denialists really like to fit trends starting in 1997, so that the huge 1997-98 ENSO event is at the start of their time series, resulting in a linear fit with the smallest possible slope.”
Of course the pause was never created by “starting in 1997”. It was found by starting at the end of the data (for example 2015) and calculating the earliest start date with a zero trend . That it came out to 1997 was simply a result of that calculation. In addition, as I started earlier, the trend is identical if you only go back to 2001. The 1998 El Nino has no influence on the trend slope.
Why Mears (and now Jack) choose to lie is an example of how completely dishonest all of the AGW proponents can be when faced with inconvenient facts.
Richard – you have just presented a classic case of cherry picking.
Sorry Jack but your comment shows you have little understanding of science.
We know the highest emissions have occurred in recent years so looking at recent years should show a larger trend than earlier years. That is not cherry picking. It is how science operates. If you want to find a cause for something where you think you have a correlation you often need to examine the data more closely. That is exactly what is happening. It turns out the correlation breaks down upon closer examination.
You don’t want to accept the truth. Your comments are laughable.
It is your comments that are laughable and show a complete lack of understanding of climate change variables – note the plural.
CO2 is NOT the only variable in climate change, other anthropogenic factors include industrial aerosols, (which promote cooling e.g.1940-70’s), CFC’s and HFC’s, methane, etc.. Also included are natural forcings such as volcanic eruptions, changes in oceans currents, AMO, PDO, El Nino and LaNina, ocean uptake of heat, Milankovitch cycles, etc..
Perhaps you should read Chapter 8 of AR5.
Richard M commented – “We know the highest emissions have occurred in recent years so looking at recent years should show a larger trend than earlier years. That is not cherry picking. It is how science operates.”
that’s a very naive (&
incorrect) understanding
of the climate system.
co2 certainly leads to
warming, but there’s a lot
of noise along the way.
don’t confuse noise and signal.
The pause on RSS disappeared on February 2016. It would have taken years to get it back. Then they came up with a new version that really killed all chances of a return of the pause.
It still kills the IPCC 1990 Per decacde warming prediction.
i.e. when rss’s trend became large, everyone
here stopped accepting their data. not for
any technical reasons, but simply because
of their numbers.
The new RSS trend is still not large compared to IPCC climate models.
Oh dear

and that is after their manic “adjustments™”

Werner Brozek commented – “The pause on RSS disappeared on February 2016.”
that’s an absurd level of (claimed) accuracy.
please learn some statistics
instead of just plugging
numbers into some web calculator.
“that’s an absurd level of (claimed) accuracy”
The turnaround was fairly spectacular, though. On Jan 10,2016, we had Lord Monckton
“I propose that if 20 years without global warming occur, the IPCC, the UNFCCC and all their works should be swept into the dustbin of history, and the prosecutors should be brought in. We are already at 18 years 8 months, and counting.”
On 6 Feb, a subdued heading
“The Pause hangs on by its fingernails”
And then, poof. Gone. Not 17 years, or 16 years. Gone, and no eulogy.
No, Nick. The pause is still there in the data. And the concurrent escalation of CO2 is still in the data: No CO2 impact on atmospheric temperatures.
According to how Lord Monckton defines the pause, in January 2016 it was over 18 years,
in February 2016 it was 0 years,
now it is a bit over 2 years.
Looks like a random walk to me.
The big question is whether the recent El Nino produces an upward step in global temperatures as occurred previously after powerful El Nino events.
If it fails to produce such an upward step AND we now see a tendency for La Ninas to become stronger relative to El Ninos then we may well see downward steps in the future.
If that comes to pass it will serve as evidence in support of my contentions as to the means whereby the level of solar activity influences global cloudiness so as to change the proportion of solar energy able to enter the oceans and drive the climate system.
Continuing upward steps despite the quiet sun would present a problem for my hypothesis.
If we are now back to the temperature that preceded the recent El Nino then that suggests the lack of an upward step on this occasion which is part way to that which I expect to happen.
Trenberth’s step-ups occurred as El Nino-La Nina pairings coincided with solar cycle maximums. The current El Nino-La Nina (assuming this La Nina goes full fledged into 2018) will coincide with a solar minimum after a weaker than average SC24. A step down might be in the offing.
Bingo! Joel… i’ve always found it annoying that peops don’t recognize that the early 2000s step rise coincided with a solar max.
Ditto, I have said many times that it would be nothing but a transient effect.
I suspect leading to a gradual temperature decline in real temperatures over the next few years..
… possibly back to 1980s levels or below.
Only reason for hoping this to be the case would be to watch the exploding AGW heads. 🙂
Stephen Wilde says –
“The big question is whether the recent El Nino produces an upward step in global temperatures as occurred previously after powerful El Nino events.”
the 2015-16 ENSO season saw
the warmest El Nino in the records,
both NOAA surface
and UAH LT.
2016-17 saw the warmest
La Nina, and 2014-15 the warmest
Neutral season.
the monster El Nino season of 2015-16
was 0.37 warmer (NOAA surface) than
the monster El Nino season of 1997-98.
0.12 C warmer in UAH’s lower
troposphere model.
warming continues apace
The difference was 0,511 – 0.484 = 0.027.
2016 -2017 was still part of the effect of the El Nino, you really think that much energy expelled from the oceans just disappears immediately..
You really have been taking the hard stuff today, haven’t you, crack. !!
Warming from El Ninos and ONLY from El Ninos
NO CO2 warming signature in the whole of the satellite record.
NONE whatsoever.
But at a “pace” much less than those produced in modelturbation. Get a grip.
“..of the 95% confidence interval of bias uncertainty computed from the 100 member ensemble.
Would that be like saying 5% is do to computer bias or an anomaly of .393 C has error factor of 5% or +/- .01965 C?
La Nina 2017-2018 is just getting going. The actual seasonal timing of this La Nina is somewhat anomalous.
Most (not all) La Nina’s start in the late summer months and peak into the winter months. This one seems to just be getting going, and won’t officially make it to a full-fledged La Nina by definition until end of March 2018. Interesting t La Nina coming, or not….
Does that mean it will be a weak La Nina?
Or will it come on strong in the NH Spring-time with a huge pent up release of cooler than normal waters across the Eastern Pacific carrying into the 2018 NH summer?
‘Does that mean it will be a weak La Nina?’
Joel it will be a weak La Nina but with the promise of back to back La Nina, the second one being stronger.
This may be due to the effects of the PDO. The PDO has not moved into its negative mode which enhances the trades winds which are needed for La Nina. As a result only the ocean current is setting up at the moment. This was also the big reason we didn’t see a true La Nina in 2016-17.
“Clive Best uses a custom triangulation method to calculate the global temperature anomaly from the raw data”
Ah no. not raw
he uses crutem as input and crutem is is adjusted by national weather services
So making up a number from made up numbers.
Regrettably if temperatures start to rise then AGW proponents will claim they are right. If it falls then they will claim it is due to the measures already taken. They can’t lose. In the Climate Casino the AGW proponents are the bank. It will take a Monte Carlo effect to break the bank.
Actually, atmospheric CO2 is tied to future temperatures in AGW models. If, as seems certain, CO2 continues rising and temperatures remain steady or declines, AGW proponents will be shown as religious nuts.
For CAGW cultists to win they need a very special coincidence, because they lose if
* no GW: temperature stall or go down (no W) or erratically change depending on area (no G)
* no A: human emission drop and it still gets hotter (meaning, human CO2 do not control the temperature)
* no C: human emission continue to grow, temperature also grow, but predicted disaster do not occur, poverty continue to go down, the Earth continue to green, etc.
they will NOT claim it is due to the measures already taken, because they are claiming they are far from enough, which is understatement (their effect is actually zero)
And if anthropogenic CO2 levels stabilize but temperatures keep rising, the whole world wins!
I agree entirely with your logical conclusions. The point I was trying to emphasise is that the AGW proponents will twist any result to their benefit. It is not only a matter of money but of having power over politicians. As O,Brien says to Winston Smith in 1984 it the object of obtaining and keeping power that is the sole motivation.
On the casino theme the house will add 00 to a roulette wheel to favour the odds on their side. Expect more of AGW proponents to use 30years as a predicted date for any consequence rather than the already discredited 10- 15 year predictions that have come and passed.
From the article:
we may see a return of “the pause” soon.
Results of some simple calcs I did appeared in a WUWT article in March:
“For the trend since 1998 to go flat by 2020 (December 2019) the annual average temperature anomaly for the three years Jan 2017 to Dec 2019 would have to be: 0.05C
When did we last have 3 consecutive years as cool or cooler than that?
2007 to 2009: 0.05C
However, January and February 2017, being 0.30 and 0.35C respectively, would raise the three year average to 0.065 if the rest of the months through 2019 were 0.05C. So we have to go further back in time to get a cooler 3-year average. Most recent is: 1994 to 1996: 0.0C.”
That was based on RSS data, which has now changed. Based on current UAH data, the last result is similar. UAH has been relatively warm this year so far (Sept anomaly was 0.54), so we’d have to see anomalies to 2020 hovering around the the UAH baseline (as they did in 1994-96) from now to 2020.
To see what that would look like, here’s Roy Spencer’s UAH graph from his blog.
http://www.drroyspencer.com/wp-content/uploads/UAH_LT_1979_thru_September_2017_v6.jpg
And this would need to start happening from right now for the trend from 1998 to go flat. I think the chances of that are very slim.
Here’s the link to the March WUWT article:
https://wattsupwiththat.com/2017/03/14/how-imminent-is-the-rss-pause-now-includes-january-and-february-data/
Barry, the trend does not define the pause. The anomaly does. If temps get back to the anomaly at which the temps were paused, then the pause is back…
How long is the pause at the present time then?
Some say since the ’97-’98 el nino, others say since ’02. The temperature paused at a certain anomaly (i think we can agree on that) and if the temperature returns to that anomaly then the pause returns. (zat zimple)…
Werner, think of it this way… If temps returned to the anomaly of the pause and stayed there indefinitely, then, because of the el nino, the trend would always show warming. No matter how long temps stayed at the anomaly (100 years!), the trend would still say warming, even though temperatures would be no warmer than they were during the pause…
“the trend does not define the pause”
Unless you use Christopher Monckton’s definition of a pause, which was entirely defined by the trend.
Though if you are using that definition you can only use satellite data, which is currently nowhere near the pause temperature.
By the way, when you say temps have to get back to paused temperatures, are you talking about individual monthly temperatures, or some longer term average?
“If temps returned to the anomaly of the pause and stayed there indefinitely, then, because of the el nino, the trend would always show warming.”
That isn’t true. Assuming say you always start the trend in 1997, then as the recent warm spike moved close to 1997 than the future the trend would become negative.
According to Lord Monckton, the pause on Hadcrut4 is now since October 2014 or exactly 3 years. If it is longer as you say, how would I go about to determine how long it is? What should I look for at the WFT site to determine the length of the pause by your definition?
(http://www.woodfortrees.org/plot)
Yes, it would say warming for say 120 years. But let us say you are using UAH6 with the two humps at 1998 and 2016. If I am correct, moving the start date a few months into 1998 could give a negative slope of say 119 years and 8 months.
Or alternatively, you could say the new pause is 100 years.
afonzarelli,
the trend does not define the pause. The anomaly does. If temps get back to the anomaly at which the temps were paused, then the pause is back
“Return to the pause” refers to the flat or negative trend since 1997/98 that ended (in the satellite records) in early 2016.
If anomalies now head South to what they were in 2014 the trend since 1997/98 will still be positive.
If you don’t include the anomalies from 1998 onward in your trend analysis, then your trend won’t be from 1997/98. It will be from some other date. A flatline in this case would be a new pause, not a ‘return’ to the old one.
The way to do this more rigorously is to only use ENSO neutral months to determine the trend (-.5 LT anomaly LT +.5). Should probably also add in a lag of 3-4 months since we are looking at satellite data. This removes the influence of El Nino on the trend. I looked at this last year and found the trend at that time was flat since 1997. Since we’ve had some warm months during neutral conditions since that time I suspect we now have a slightly positive trend.
“The way to do this more rigorously is to only use ENSO neutral months to determine the trend “
It isn’t rigorous. The definition of neutral is arbitrary. You can have the trend kicked by a run of near Nino (or Nina) months just as for a full Nino. You have to add it all up, not try to make exceptions when a Nino comes along.
Nick, by far the biggest influence on the trend lines themselves are the big anomalous years which are always El Nino or La Nina. Removing them should get a person closer to a true trend. It appears you really don’t want to know the answer. What is it you fear?
“It appears you really don’t want to know the answer. What is it you fear?”
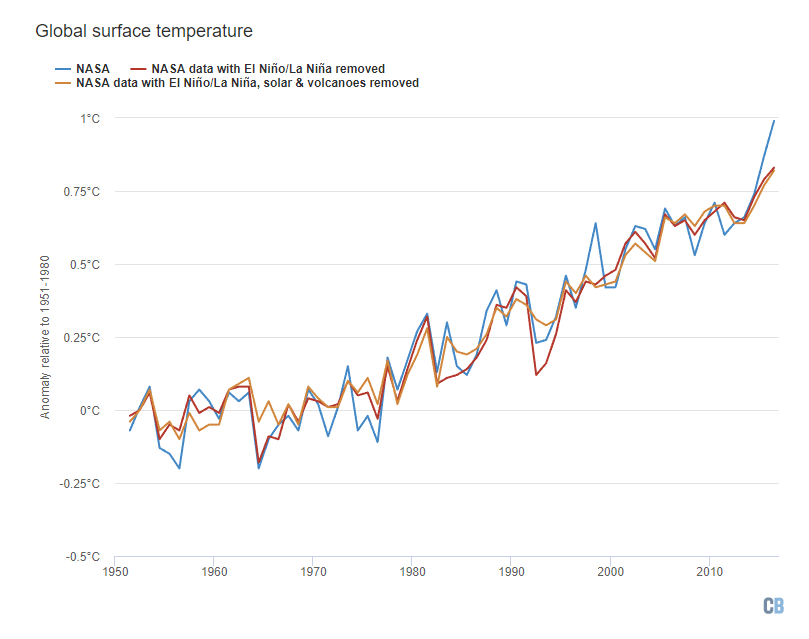
Here is an article quantifying the effect of ENSO on global temp. And here is a plot of the result of removing ENSO. It just leads to more uniform warming, removing any vestige of “pause”.
Nick, you might show radiosonde and satellite estimates up to 2014 [eliminates Super El Nino effects]. The atmosphere does drive the surface, ya know. At least that’s what the “physics” says.
Nick Stokes,
your graph (for whatever it is worth) shows a ~0.15K / decade warming since 1970. It says, with half a century data, that according to IPCC models, for whatever they are worth, the CO2 hypothesis is disproved. So, what’s you choice?
* models are a failure; meaning, we cannot trust them to know what the future will be
* models are good; they only have it wrong about CO2/ GHG, so we can trust them that GHG are not a threat.
“It says, with half a century data, that according to IPCC models, for whatever they are worth, the CO2 hypothesis is disproved.”
Not at all. The models, as summarized by the IPCC, predict about a 0.2 °C/decade warming in coming decades, as CO2 increases. A rate of 0.15 since 1970, as CO2 increased over that time, is quite consistent with that.
Nick, given the log function of CO2 impact on temperatures, future temperature trends should be less than the 1.5 figure. That is, unless future CO2 will increase at a greater exponential figure.
“A rate of 0.15”
And it’s actually about 0.17°C/decade since 1870.
since 1970
Nick, the discussion is about the pause which is shown primarily in the satellite data. Why do you then show NASA GISS data? Your reply once again shows the dishonesty of AGW proponents. I know why you didn’t show UAH data. The trend since 1997 would still be too close to zero for it to be even close to being called statistically different from zero.
As long as you keep being dishonest you will only demonstrate you are not interested in the truth. Sorry, but this common trait of AGW proponents is one of the big reasons people don’t believe a word you say.
“Nick, the discussion is about the pause which is shown primarily in the satellite data. Why do you then show NASA GISS data? Your reply once again shows the dishonesty of AGW proponents.”
This article is about Hadcrut, not UAH. Is the author being dishonest?
I see on the UAH/October thread that there is suddenly doubt about UAH, since it seems to be rising.
Instead of justbashing my oferrings, why don’t you produce some data.
Dave Fair commented – “…[eliminates Super El Nino effects]…”
better question – why was
this last el nino so “super,” the
warmest el nino on record? why
do el nino seasons keep getting
warmer?
2014-15-16 Super El Nino: 1) Aborted 2014 El Nino; 2) Multi-year Northeastern Pacific Blob; 3) Random acts of nature in a slightly warmer world; and 4) Shit happens, but there is no evidence of CO2 driving the whole thing.
Oh, and you don’t address the proper question, crackers345. [345 ….. must be a lot of crackers out there.]
Dave Fair commented – >>Oh, and you don’t address the proper question, crackers345<<'
you're deflecting.
why was the '16-17 el nino so
much warmer than that of '97-9
8
Not so fast, crackers345! You deflected mine first.
Since the exchange has devolved this far, I’m done.
Dave Fair commented – >> 4) Shit happens, but there is no evidence of CO2 driving the whole thing.<<
correction for you: "i don't know the evidence…."
“In May 2014, at the beginning of the ENSO event, Global Temperature Anomaly was 0.608, now in September 2017, it has cooled to 0.561.”
Just for the record the trend from May 2014 to September 2017 is about +2.3 degrees per century.
Not remotely significant of course as we are only talking of a 3 year period.
ok; i can stop the argument completely with the empirical truth about the joke humans play on each other in reference to global man made climate change, or the caricature that ManBearPig, Al Gored brings up when he is lonely, oh so lonely; like little kim un junk, aka rocket boy. None of you idiots are close when debating something you know as much about as a pissant. GOD makes the weather and controls the weather and like the arrogant asses man are, we have no control over any miniscule part of nature especially the weather. Case closed
Eddard Stark warned us this day would come!
Well Duh, it’s because of global warming! Everything is because of global warming
Thanks for the information. It would be nice to have the mainstream media actually report these facts, but I’m not holding my breath.
Looks to me like a Mexican stand-off on the “warming/cooling“ question.
Cooling is a natural and predictable consequence of global warming. The cooler it gets, the more we will see the adverse consequences of higher temperatures.
LOL
Brrrrrrr…the Nobel Committee wants their [Junk] Science Prize back, Mr. Gore.
Gore and the IPCC got a Nobel Peace Prize, like Obama, for not doing anything. The Peace Prize is political. The others are not, except maybe literature.
And economics.
Oh, give the data to NASA and NOAA for a while, and by the time they get through their adjustments you will be convinced the oceans are boiling.
NASA needs to be put out of the business of adjusting surface temperatures.
and NOAA needs deep reforms.
Go Trump.
AGREED. Politicized “science” s**ks.
And frozen just a few years ago.
zombie – raw data is adjusted to
correct for biases.
(not difficult to understand)
how would you like to
handle those biases ?
Crackers, I was going to reply to this question, but then I realized you’re a zealot. You won’t be swayed by evidence, because you’ve swallowed the Kool-Aid and hitched your “self” to the CAGW bandwagon. You believe that “Mike’s nature trick” was simply a description of a technique of presenting data, not an actual attempt at deception. You believe the “bias removal” argument even when on it’s face, there is no evidence of bias in the old readings (that keep getting cooler and cooler, despite historical evidence to the contrary). You believe some “catastrophe” is coming – despite years of lower overall cyclone energy and no evidence of increasing rainfall (or droughts, or flooding). Like some street preacher, you believe “the end is nigh” and facts, figures, and data be damned! Good luck with that….you’ll need it. BTW – even the IPCC has dropped the “3 degree climate sensitivity” dogma, so you might want to update your little red book…..
Adjusting raw data is just the one-way ticket to scientific and communication hell. Biggest no-no.
Just imagine:
We tested the chemical to know if it cause cancer, and “adjusted for bias” no cancer occured in my lab rats so with very high confidence the product is not carcinogen.
Do you buy it? I don’t. So i ask for more investigation, and it happens that actually “adjusting for bias” meant disappearing 2 cancer cases, and they are doomed.
As opposed to
We tested the chemical to know if it cause cancer, and 2 cancer occured in exposed lab rats while 3 occured in not exposed, so with very high confidence the product is not carcinogen.
Do you buy it? I do
that’s the effect of “adjusted data” versus “raw data”.
Bottom line: handle the bias the way it is done in each every science and technical area. Real one. Meaning, publish raw. or go to well deserved hell
The pattern of changes to the ‘picture’ of global surface temperatures has jumped around a great deal in the last 5 years. Before then, the 1997-8 El Nino was a striking feature, but now it has all but disappeared. The months since about 2002 are now dominant when one looks for warmth in the data.
There was a brief outcry when the Karl recommendations seem to have found their way into official acceptance. Were they really valid, in hindsight, or were they beyond the pale as many asserted?
Personally, as one used to lots of data that do not get altered over time, I find the process rather subjectively mystical and I place little faith in the veracity of what we are told to believe today. Especially the juvenile spin like ‘Hottest month ever’ by amounts far less than the noise – noise that officials do not seem to know how to compute honestly.
Normally pretty conservative, just rather uneasy now about the establishment view of ‘science’ of climate.
Geoff.
No. The Karl adjustment that used ship intake temp data to adjust the more accurate buoy data set will be turned around in the next revision. That dubious SST buoy data adjustment by Karl is widely viewed by insiders as his most egregious attempt to cancel the Pause for political reasons (the Paris COP21 meeting was 5 months away). When NOAA does that finally, their dataset will look at lot more like HADCRUT.
And the Pause prior to the 2015 El Nino will be real.
Karl used a bogus SST/Night Marine Temperature correlation. It is now falling apart.
See Bob Tisdale: https://bobtisdale.wordpress.com/
Dave Fair commented –
“Karl used a bogus SST/Night Marine Temperature correlation”
did you or Bob Tisdale write a
letter for publication to the editors
of Science magazine?
why not?
real scientists don’t
read blogs, this or Tisdale’s.
Have you read anything by Bob Tisdale, crackers345? See: https://bobtisdale.wordpress.com/
He has published (free) E books, by the way:
‘On Global warming and the Illusion of Control – Part 1’ presents the basics and illusions behind the hypothesis of global warming and climate change.
‘Who Turned on the Heat?’ is a comprehensive examination of the processes and long-term global-warming aftereffects of El Niños and La Niñas, which are the dominant weather events on Earth.
‘Climate Models Fail’ as its title suggests, is about the poor performance of climate models.
What have you attempted to publish? Could it have gotten by the thuggish gatekeepers revealed in the Climategate emails?
I am an educated critic of CAGW nonsense, especially the fantasies about electric power production. I have actually planned, financed, designed, constructed and operated and maintained electric power generation, transmission and distribution facilities.
I lobbied the Nevada Legislature and Public Utilities Commission on legislation in support of, among other initiatives, renewable electric power generation portfolio standards. Among many other accomplishments, I obtained financing for a geothermal power plant.
Tell me what you have done, crackers345.
Seriously crackpot,…. how the **** would you have the remotest idea what real scientists do.
I doubt you have ever even met one !!
“real scientists don’t read blogs”.
LOL. You really believe their are people that don’t read blog? scientists even WRITE blog, you know.
Whoops, better go ‘correct’ the data and destroy the original.
paul – who’s destroying raw data?
are you saying you don’t understand why the
raw
data has to
be corrected for
biases?
poor crackpot.. tourette syndrome with the “return” key.
crack and pot will do that. Turn an idiot into a cretin.
(You need to back off on this line of commenting) MOD
Please respond to my last missive crackers345. It is impossible to relate to someone without knowing their education, background, strengths, orientation, etc.
You should know that I will respond positively to cogent posts. It is only to mindless talking points and unsupported assertions that I respond flippantly or acerbically.
If you truly want a conversation, please respond. Otherwise, I will assume you are a Troll and will cut you down on sight.
Another Icelandic volcano looks poised to erupt soon, giving the commies their escape-clause out of warming hysteria and onto whatever their next scheme is that will save KGB Putin and his nationalized Russian oil industry.
Another Icelandic volcano looks poised to erupt soon, giving the commies their escape-clause out of warming hysteria and onto whatever their next scheme is that will save KGB Putin and his nationalized Russian oil industry.
No! This can’t be true or fact. The Snowflakes and the Millenials won’t believe it anyway.
Please say this is a Holiday Hoax, please!
Without “Truth” in a man-made global warming, the Snowflakes and the Millennials will have no reason to get up in the morning and face the day!
They will wilt. Their reality will fade away.
They will be offended.
The average global outside air temperature remains within 1 °C over decades? That’s remarkable in many ways – not least taking into consideration Earth’s atmosphere isn’t stable or constant by any measure.
http://apollo.lsc.vsc.edu/classes/met130/notes/chapter1/graphics/vert_temp.gif
Wouldn’t mind relocating to a place where the average local outside air temperature is above the global. Anyone here wishing the opposite for themselves, eh?
Jaakko: so then move. noone’s
stopping you. do we really have
to warm up the entire world just for
you?
many people don’t want it warmer.
arctic natives. laborers in the
tropics. those who live at sea level.
skiers. those who live in and love
mountains. climbers. winter
sports enthusiasts. lovers
of nature. small farmers in
the Niger. Puerto Ricans, worried
about the next monster storm.
etc. get it?
You really do need to prove that CO2 is driving global temperatures, crackers345. Simply asserting that temperatures will get to an unacceptable level, or any effects therefrom derived, will not convince anyone, especially long-term readers at WUWT.
With your Puerto Rico comment, you seem to equate stronger hurricanes with increased global warming. There is no proof of that, and bald assertions can’t change it. On the contrary, all empirical data and even IPCC statements belie the “worse weather” meme.
And what makes you believe I haven’t, Crackers? Well, you’re wrong. I have. About 1000 miles farther south in total. In the green blob optimum temperatures at the end of 19th century 10% of my people starved to death due to years skipping summer.
It’s still too cold to grow corn in there. I don’t want that, but have a property to sell you. In the arctic. Granted, the country isn’t much above the sea level, but the shorelines recede due to Weichselian glaciation rebound.
And what makes you believe that’s what I want from “you” Cracker? Well, you’re wrong again. As far as I’m concerned everyone is free to do what they see best as long as they allow others the same. Did you get that Cracker?
Even “The entire world” cooling CACA faithful are free to what they want. Multiply their own own CO2 emissions if they wish. What I object their unsatisfiable misuse of scare common resources for marketing a constraining and misanthropic CACA religion. I’m not in favour of the opposite extreme, anarchism, but can imagine how CACA could backlash into it.
“do we really have
to warm up the entire world just for
you”
NOBODY is warming up the world, certainly NOT with CO2 emissions.
There is absolutely NO CO2 warming signature in the satellite temperature data.
NONE WHAT-SO-EVER. !!
You are living is a substance induced LIE, crackpot !!
“so then move.”
Inner-city fossil fueled life for you, isn’t it crackpot !!
You will be ok, so long as you have your fossil fuel heating in winter, and/or fossil fuel cooling in summer.
Right ??
And let’s not forget the SJW latte machine.. !!
“many people don’t want it warmer”, your list is quite short, and mostly silliness (you seriously worry about dudes rich enough to afford skiing? small farmers in the Niger want it more rainy, as it is now, not dryer as it was in the colder 60s and 70s, etc.).
On the other hand, lots of people want’s it hotter. All those who spend more on heating than on cooling, or plan to retire in Florida (Mediterranean coast, for Europeans) rather than Montana (or Scandinavia). And you can bet this is true in currently poor country, too, as soon as they will be able to afford, they will head to sunny hot seaside.
crackers names off less than 1% of the Earth’s population who like it colder. They can enjoy fossil fuel powered air conditioning or even refrigeration and have whatever temperature their hearts desire. That is the beauty of a wealthy world supported by cheap energy!
Jaysus! It’s hotter at 115 km in altitude than it is at the earth’s surface. Not many molecules there, I assume, Jaakko.
Cannot exclude CACA includes it in the global outside air temperature hottest evah records. Wouldn’t mind relocating there either, provided Al, Barack, Elon, Richard, Leonardo, Charles, Francis and stay on the surface. Having said that Gaia or whatever their deity is nowadays, may dispatch them deeper down or on Venus when their time is up. And that’s fine by me too.
Humboldt current is very cold now.
Mean and anomalous equatorial temperatures.
http://www.cpc.noaa.gov/products/analysis_monitoring/ocean/weeklyenso_clim_81-10/wkteq_xz.gif
The glaciers here in Wyoming and Montana have been growing for quite some time but this means nothing to the religion of liberal control global warming.
None of this matters.
We’ve been assured many times, on the basis of settled science, that if we failed to take drastic action by a stated date, we would pass a tipping point and that climate change would be irreversible.
We missed those deadlines. It’s too late; anything we do now will be futile – the science is settled. We may as well continue to enjoy our fossil fuels and party on while we can.
Anyone who is still advocating remedial action and continuance of climate research grants at this point is denying the science.
Hear, hear Richard Millard.
Settled science? Is that like settled history?
Naw. Unlike settled history, settled science is like that stuff that settles in a wastewater plant pond…didn’t you know that?
Solar activity decreases. The jet stream is meridional.
http://squall.sfsu.edu/gif/jetstream_norhem_00.gif
Isn’t that what I always said. It will get cooler. What fun it will be with the snow and all that…
See, Al Gore was right all along…crops will fail & there will be 1,000s of climate refugees,
I will become a climate refugee & move south to the warm.
You will need to ski South
Sea ice satellite data is about to stop due to failure to replace satellites:
http://www.nature.com/news/ageing-satellites-put-crucial-sea-ice-climate-record-at-risk-1.22907?WT.ec_id=NATURE-20171102&spMailingID=55269410&spUserID=MTgyNjI5MjAwMDEwS0&spJobID=1280170708&spReportId=MTI4MDE3MDcwOAS2
This is what we pay NASA et al for.. FAILURE !!!
Their ONLY attribute.
And you can BET that should those satellites cease to function, ice ice measurements will drop rapidly.
In FACT, I BET they actually know that the AMO and PDO are turning and that Arctic sea ice will be increasing… so the instruments NEED to fail…. just like so many surface temperature sites have failed.
Climate Scientist “ESTIMATES™” will be the way of the future
“ice ice” => “sea ice”
AndyG55 November 2, 2017 at 2:11 am
This is what we pay NASA et al for.. FAILURE !!!
Had you bothered to read the article you would have learned that NSIDC use data collected by the Defense Meteorological Satellite Program (DMSP) not NASA and have done for the last 30 years. The final probe in the series, the unlaunched F-20, was dismantled last year after Congress stopped funding the program because Mike Rogers thought it was a waste of money. After all why would the US armed forces need weather forecasts covering the Middle-East!
Convenient, we can now be told all the ice has gone & no easy way to dispute.
Much like the church tried to keep the bible in Latin to stop the plebs questing its content.
yes, why pay a few $millions for real data, when you can pay $billions in non-working solutions (fans and solar) to non-problem?
Science or Elon Musk toys, the choice is easy.
The “science” hasn’t relied on real temperatures for years now. Decades, practically!
Physics seems to be malleable to climate scientists, John.
Good. We can forget Global Warming.
Now we just need to wait for when we also can forget Global Cooling.
It is the Sun people. Sun is in a dorm.ant state of activity. This happened a few years back and we saw snow in July in North Dakota. Time to subsidize SUV’s? This could have a profound effect on global harvest and food supplies. During the Maunder Minimum, this type of cooking led to famine. This is proof of why even if we could control the climate and lower temperatures, why would we. Just more leftist anti business, and anti human race probaganga is all that the so called man made climate change is. We are just insignificant ants on this planet and the liberal ego just can’t accept that.
Is the chart below you can see the human impact?
In my opinion you can see the influence of the magnetic activity of the Sun.
http://www.cpc.ncep.noaa.gov/products/stratosphere/polar/gif_files/ozone_hole_plot.png
Your neighbour to the North here in Saskatchewan. The last 20 years have been very good for agriculture in the Northern Plains. That keeps food prices reasonable and millions fed. After 60 years of this so-called catastrophe the world , with higher population, has record levels of grain stores. We need more catastrophes like this!
Pray for global warming!
The ocean’s heat capacity is the 8000 lb gorila vs the atmosphere:
https://wattsupwiththat.com/2011/04/06/energy-content-the-heat-is-on-atmosphere-vs-ocean/
Wondering if this explains the big effect of El Nino? As Jeff Id implies, it’s the oceans, stupid!
I found the graphic (Fig 1 in the link) researching for data to estimate the effects of the latent heat of fusion and vaporization of H2O on the atmosphere from sea level to space, due to a 1″ water equivalent layer, on a normalized basis. Amazing result: +11.4F, just latent heat. (I did this calc because I noticed it always warms when it snows, and being an engineer, I wondered what the effect would be from the 540 + 80 cal/gm latent heat as water vapor in a cloud goes from gas -> solid. My simple answer assumes it’s distributed, but concentration at the phase change location is more realistic. Still shows how huge the latent heat effect is. But best of all I found the link above.)
Never say “El Niño event heated up the planet.” El Niño is not a source of thermal energy to Earth. It is a distribution mechanism of thermal energy accumulated from the Sun a 1 ± 0.5 Centuries ago. It is weather-significant, but noise to climate.
Jeff Glassman November 2, 2017 at 5:47 am: “It is a distribution mechanism of thermal energy accumulated from the Sun a 1 ± 0.5 Centuries ago”
WR: It is called PDO, Pacific DECADAL Oscillation. The release of heat during an El Nino is not about energy that is accumulated in a time frame of a century. Think in decades. You can follow the process by graphs as shown by ren November 2, 2017 at 12:30 am: graph 2 and 3
Persistent heat rise since the depths of the LIA are more likely attributable to ocean heat mass delays. Quite long term.
Yes and no. Yes it’s stored, not generated, heat. Duh. See the link I posted above. It’s the deep ocean (8000 lb gorilla) vs. atmosphere (little monkey). Does affect climate, unless you define climate on a centuries long basis. But then current events are noise, so why are you concerned? Which is it? Can’t have your cake and eat it too.
ocean heating isn’t noise. and it’s been
very large and very sustained.
In my post of 11/2 @ 5:47 am, I criticized the article for saying that the “El Niño event heated up the planet.” Then in my explanation, I compounded a pair of equally bad errors of my own. Apologies.
First, the best model of surface temperature (HadCRUT 3) follows the best model of the Sun (Wang, et al., 2005) with a major lag of about a century and a half. SGW (Solar Global Warming), rocketscientistsjournal.com. The lag is a modeling fit, quite possibly due to the fact that HadCRUT3 data span the period of thermometer data, which have been available only about a century and a half. My second error was to confuse El Niño heating of waters upwelling along the Equatorial Pacific with the thermal energy carried by those waters.
A ready cause for lags in T(TSI) is branches of the MOC, aka the THC. The first order effect of this circulation is to drain the ocean surface layer in the North Atlantic and return it in about one millennium later along the Pacific Equator by the Ekman transport. There it is heated by the Sun to outgas CO2 into Hadley cells (bathing Mauna Loa in CO2-rich air, by the way). At this point, the phenomenon has the name El Niño–Southern Oscillation (ENSO). In La Niña conditions, the return water lies in a cold belt stretching across about three fourths of the Pacific. In El Niño, the return water appears fully heated and in the pattern of a tongue from Peru to mid Pacific. See L’Heureux, 5/5/2014. http://www.climate.gov/print/233902
Röst 11/2 @ 7:17 am mistakenly thought that the PDO was involved, and thanks in part to my error, confused its decadal oscillations with the lag in GAST in response to the Sun. ENSO varies on interdecadal time scales much like PDO, but with a bit shorter periods. Regardless, the frequency of these oscillations has everything to do with the random variability in the flow of the Equatorial upwelling, but nothing to do with the age of that water (or its energy content).
harmsworth 11/2/17 @ 1:14 pm and Rod 11/3/17 @ 5:24 pm suggest that the ocean heat mass was more likely involved. Perhaps so, someday when that heat mass is as thoroughly measured as TSI and surface temperature. For now, the SGW model is surprisingly good without it, and if the ocean heat mass were added as a variable, it would be purged by Occam’s Razor. The same can be said for the temperature of Earth’s core and CO2, contradicting the AGW conjecture.
Crackers345 11/3/2017 @ 5:33 pm says, ocean heating isn’t noise. and it’s been very large and very sustained. The problem here seems to be distinguishing weather from climate. El Niño is a large, though nevertheless local, ocean heating that is noise on climate scales. Only the average over a single El Niño/La Niña interdecadal cycle contributes to estimates of climate on its minimum time scale.
Exactly! SUNSPOTS! Many scientists not selling the Global Warming narrative have been saying this for years. Look at history: Middle age warm up, Maunder Minimum, etc. We have had periods of extreme warmth and cold. It’s cyclical and since about the 70’s it’s been warm. But that also coincides with an increase in sunspots. Now, we are going into Solar Minimum and that means the earth will cool over the next 20-30 years. Sorry Global Warming alarmists, your argument is about to blow up in your face.
What face? They just run silent and move on to other causes with similar, shallow arguments. There won’t be any truth and reconciliation court for them.
Solar scientists would take issue with that.
“Any reduction in global mean near-surface temperature due to a future decline in solar activity is likely to be a small fraction of projected anthropogenic warming. ”
https://www.nature.com/articles/ncomms8535
TSI is only one mechanism by which the sun influences the earth’s temperature.
And the others are?
robots: the LIA wasn’t
created by the Maunder Min.
Contrary to some expectations, the October update for UAH TLT global data is a very high 0.63, even warmer than September. It’s also the warmest October anomaly in the UAH record.
http://www.drroyspencer.com/wp-content/uploads/UAH_LT_1979_thru_October_2017_v6.jpg
Data: https://www.nsstc.uah.edu/data/msu/v6.0/tlt/tltglhmam_6.0.txt
Dr Spencer discusses this at the update:
http://www.drroyspencer.com/2017/11/uah-global-temperature-update-for-october-2017-0-63-deg-c/
no one (else) wants to hear it.
Cracker, if you were half as smart as you seem to think you are, you’d be a genius. Now, Dr. Spencer is smart. Your brilliant statement that GW has been proven, and you even compared it to induction. I’m an EE. I suggest you learn just enough to get yourself past the dangerous stage before such comments. WE understand electromagnetic theory to a depth climate scientists can only dream of. THAT is why, for example, your car starts, your computer works (sort of), etc. etc. Ditto for mechanics (Newtonian and relativistic). There are, of course, things we don’t know but on balance it seems FAIR to write that electromagnetic theory, quantum theory, and mechanics employ very difficult but precise mathematics. By comparison, climate theory is may be as advanced as alchemy. Maybe.
The Dogs coat says the Sun is weak. Grow more fur it’s getting cold!
Fig 4 and the forecasts from my paper
http://climatesense-norpag.blogspot.com/2017/02/the-coming-cooling-usefully-accurate_17.html
show where we are now.
Fig 4. RSS trends showing the millennial cycle temperature peak at about 2003 (14)
“Figure 4 illustrates the working hypothesis that for this RSS time series the peak of the Millennial cycle, a very important “golden spike”, can be designated at 2003.
The RSS cooling trend in Fig. 4 and the Hadcrut4gl cooling in Fig. 5 were truncated at 2015.3 and 2014.2, respectively, because it makes no sense to start or end the analysis of a time series in the middle of major ENSO events which create ephemeral deviations from the longer term trends. By the end of August 2016, the strong El Nino temperature anomaly had declined rapidly. The cooling trend is likely to be fully restored by the end of 2019”
Fig 12 shows the forecast to 2100
Fig. 12. Comparative Temperature Forecasts to 2100.
“Fig. 12 compares the IPCC forecast with the Akasofu (31) forecast (red harmonic) and with the simple and most reasonable working hypothesis of this paper (green line) that the “Golden Spike” temperature peak at about 2003 is the most recent peak in the millennial cycle. Akasofu forecasts a further temperature increase to 2100 to be 0.5°C ± 0.2C, rather than 4.0 C +/- 2.0C predicted by the IPCC. but this interpretation ignores the Millennial inflexion point at 2004. Fig. 12 shows that the well documented 60-year temperature cycle coincidentally also peaks at about 2003.Looking at the shorter 60+/- year wavelength modulation of the millennial trend, the most straightforward hypothesis is that the cooling trends from 2003 forward will simply be a mirror image of the recent rising trends. This is illustrated by the green curve in Fig. 12, which shows cooling until 2038, slight warming to 2073 and then cooling to the end of the century, by which time almost all of the 20th century warming will have been reversed. Easterbrook 2015 (32) based his 2100 forecasts on the warming/cooling, mainly PDO, cycles of the last century. These are similar to Akasofu’s because Easterbrook’s Fig 5 also fails to recognize the 2004 Millennial peak and inversion. Scaffetta’s 2000-2100 projected warming forecast (18) ranged between 0.3 C and 1.6 C which is significantly lower than the IPCC GCM ensemble mean projected warming of 1.1C to 4.1 C. The difference between Scaffetta’s paper and the current paper is that his Fig.30 B also ignores the Millennial temperature trend inversion here picked at 2003 and he allows for the possibility of a more significant anthropogenic CO2 warming contribution.”
Fig 4 and the forecasts from my paper… show where we are now.

“Now”? The WFT trend line ends in early 2015, more than 2 and a half years ago.
Here’s where we are now.
http://www.woodfortrees.org/graph/rss/from:1980.1/plot/rss/from:1980.1/to:2003.6/trend/plot/rss/from:2003.6/trend?.png
https://www.google.com/search?q=geologic+temperature+record&oq=geologic+temperature&aqs=chrome.0.0j69i57j0l2.15888j0j7&sourceid=chrome-mobile&ie=UTF-8#imgrc=30GschKIZcoFcM:
Depends upon your time frame.
The last image might not embed. I’ll try this.
http://i1006.photobucket.com/albums/af185/barryschwarz/rss%20split%20trend_zpsrwctwaii.png
Barry as I said above “Akasofu forecasts a further temperature increase to 2100 to be 0.5°C ± 0.2C, rather than 4.0 C +/- 2.0C predicted by the IPCC. but this interpretation ignores the Millennial inflexion point at 2004. Fig. 12 shows that the well documented 60-year temperature cycle coincidentally also peaks at about 2003……. Easterbrook’s Fig 5 also fails to recognize the 2004 Millennial peak and inversion. Scaffetta’s 2000-2100 projected warming forecast (18) ranged between 0.3 C and 1.6 C which is significantly lower than the IPCC GCM ensemble mean projected warming of 1.1C to 4.1 C. The difference between Scaffetta’s paper and the current paper is that his Fig.30 B also ignores the Millennial temperature trend inversion here picked at 2003.”
This failure to recognize the correlation between the millennial cycle temperature peak at about 2003/4 (The El Nino peak at 2016 is a temporary aberration) and the solar activity peak at 1991 is the root cause of the climate establishments scary dangerous global warming forecasts. See Fig 10 and the paper as a whole for a discussion of the delays between the solar driver and the temperature and other climate indicator peaks or troughs.
N page: a massive
cherry pick; not
science.
Great to see the courageous skepticism. We posted this update on http://www.PressCalifornia.com, a sort of Drudge for just California.
What’s utterly mad about all of this is that, while proof of detrimental warming caused by man-made CO2 has never risen to a degree of certainty that would be demanded in any other field of science, the proof of its beneficial effects in the ecosystem is incontrovertible – all over the world and especially in arid climates.
On November 8th, the anniversary of the last US election, misguided liberals and their loony goons are going to go outside and emit an enormous group scream – surely antithetical to their position regarding CO2 emissions? Well, no matter. On November 8, I’m going to plant corn and capture some of that gaseous goodness. .
And I’ll enjoy their scream.
You are so correct that they ignore the positives of warming. Do they not know that the hot ages were prosperous ages?
Nevertheless, even if they really believe they are correct, what gets me is how glibly they ignore all the fantastic technology God has allowed men to develop over the past 200 years: Automobiles, aircraft, space flight, computers, the internet, modern medicine, telecommunications, electric power & lighting, AIR CONDITIONING. heating, earth moving equipment, roads, skyscrapers, dams, water & sewage systems…the list goes on and on and on. Do they REALLY expect mankind to just sit on their hands and watch a global catastrophe unfold???? If the ancient Dutchmen could push the sea back using only the muscles of men and animals, and primitive wind power, what could we do given 50 years? And even IF we allowed the sea to reclaim land, how many roads and buildings do you know of that are even 50 years old, much less 100? Their wilful ignorance is legion…
My questions are: Does that big shinny thing in the sky have anything to do with the temperature on earth? If so, we should control it posthaste. Does this CO2 create warmth, or does CO2 follow warmth? Lastly, if the liberal leftists had their druthers, would they make the earth cooler or warmer…. for the good of mankind?
The sun does provide the earth with most of its energy. Solar activity varies about 0.2% which is not sufficient to make it a significant factor in climate change. Peer-reviewed studies confirm that.
A meta-analysis paper, put together by both solar and climate scientists, details these studies: Solar Influences on Climate. Their bottom line: though the Sun may play some small role, “it is nevertheless much smaller than the estimated radiative forcing due to anthropogenic changes.” That is, human activities are the primary factor in global climate change. http://solar-center.stanford.edu/sun-on-earth/2009RG000282.pdf
http://solar-center.stanford.edu/images/600px-Temp-sunspot-co2.svg-sm.jpg
1) TSI is only one of, and the weakest mechanism by which the sun influences the earth’s climate.
2) You are ignoring thermal lag.
If TSI is the weakest mechanism the sun has on earth’s climate what is stronger?
Milankovitch cycles were stronger and TSI.
Jack believes what he is told. If you want to know what somebody else thinks, ask Jack. Jack doesn’t want to get into all that “thinking stuff”.
Like what might have caused all the changes that the earth saw regularly and were greater than we see now, but before humans had any impact. Or like, after 60 years of this “catastrophe”, nothing much has even happened, and one decent cool spell like 1940-1970 would utterly wipe out ALL the warming we saw up to 2000.
Makes his head hurt!
John – you do not know jack.
Mark S Johnson November 2, 2017 at 12:32 pm
The highest-energy portion of solar irradiance, the UV. Also magnetic flux.
Also, TSI fluctuates not just on an ~11 year cycle, but over longer periods.
https://phys.org/news/2015-03-fluctuations-solar.html
And UV varies the most. Half or more of TSI flux comes from the much bigger changes in UV, which at its high end makes and breaks ozone and at its low end penetrates seawater the farthest.
Gabro, UV is part of TSI (hint: the “T” stands for TOTAL)
.
“Total solar irradiance (TSI), is a measure of the solar power over ALL wavelengths per unit area incident on the Earth’s upper atmosphere. ” https://en.wikipedia.org/wiki/Solar_irradiance (my emphasis added)
…
What is the w/m2 effect of the magnetic flux? Doesn’t seem to be much considring how cold it is in the Arctic and Antarctica.
Mark S Johnson November 2, 2017 at 2:08 pm
As already noted but apparently ignored by you, the UV portion of TSI varies enormously, while the other spectral bands fluctuate much less.
UV is qualitatively different from the rest of TSI because it makes and breaks ozone and penetrates seawater farther than visible and IR light.
But but global warming. And Al Gore needs more money.
All I get from this is that global temp trends mirror changes in ENSO. This is something we do know.
I just keep hoping for maybe thermo nuclear war, a super volcano, asteroid, or other phenomenon to cause an ice age and wipe out mankind. I may be dead, but at least I wouldn’t have to hear about mankind altering the climate. LOL false data being peddled by the government as usual, the same government that exploded nuclear weapons in our atmosphere then blamed the public for the use of aerosols and hairspray for holes in the Ozone, during the 80’s! 😉 If no ice age then hope for global warming. Plants don’t tend to grow well in permafrost!
So, sell Fairbanks properties or not?
But, but, but … I thought it was models all the way down, Robert!
Anthony:
Individual point or volume temperature sampling/measurements should probably be plotted as statistical deviations and distributions from the calibration curve for the instrument over that reading. Along with thermal and equipment noise, errors and and time based smears.
When taking averages of multiple sites or multiple readings on a site then the calibration curves converge but the sampling noise/error of the samples/measurement does not.
> Temperatures have seemingly returned to a long trend after the 2016 El Niño.
… a trend which just so happens to be what CO2 forcing alone would have predicted over the same interval, if not a wee tad higher.
https://twitter.com/brandonrgates/status/926144837027430400
Uh, Brandon, you are actually showing that temperatures have nothing to do with CO2 concentrations. Except for the ending Super El Nino, that has to do with massive increases in tropical water vapor.
You might consider shaving that pussy facial hair growth.
Hadcrud4 is nonsense, and you know that.
“How do you like my 1-mo baseline?”
Speaking of which; what is the point behind using monthly intervals to measure the validity or lack thereof of the temperature record of the earth? It seems to be used as more of a a talking point than anything else because every 30 days or so some news head will gravely intone that the world has seen its hottest month on record.. You don’t hear much about the colder months. What is so magic about a given month? It seems rather arbitrary and pointless.
Rick,
For purposes of diagnosing climate changes, long term trends are what count most. I used monthly data here for parity with Clive’s analysis, and a 1-month baseline to spare myself the effort of connecting March 1998 to October of 2017 with a horizontal line … again for parity with Clive.
Normally, I’d use annual data because monthly is overkill, and I’d usually dispense with changing the baseline because in y = mx + b when I care about m, choice of what to make b is somewhat arbitrary.
we are back to the same level as before the 2014/2016 super El Niño event heated up the planet.
If 1998-2003 are anything to go by, we need a while to be sure there has not been another step change or other kind of net increase.
Don’t expect to see this made public by the BBC. They “believe”
So the increasing Super El Ninos caused by natural variation and some bad luck. Also, need to explain away Oct data point if it is higher (just call it normal variation).