From the EUROPEAN COMMISSION JOINT RESEARCH CENTRE
The annual assessment of global greenhouse gas (GHG) emissions by the JRC and the Netherlands Environmental Assessment Agency (PBL) confirms that CO2 emissions have stalled for the third year in a row.
The report provides updated results on the continuous monitoring of the three main greenhouse gases: carbon dioxide (CO2), methane (CH4) and nitrous oxide (N2O).
Global GHG emissions continue to be dominated by fossil carbon dioxide (CO2) emissions, which however show a slowdown trend since 2012, and were stalled for the third year in a row in 2016.

Russia, China, the US and Japan further decreased their CO2 emissions from 2015 to 2016, while the EU’s emissions remained stable with respect to the previous year, and India’s emissions continued to increase.

-Other greenhouse gases keep creeping up
Information on the other two greenhouse gases, methane (CH4) and nitrous oxide (N2O), is only available until 2012, as international statistics on agricultural activities – the main source of these emissions – are not updated as frequently as on energy and industry-related activities.
Uncertainty is also higher for these emissions than for CO2 emissions.
However, the data until 2012 shows a steady increase in global GHG emissions, with an overall increase of 91% from 1970 to 2012.
CH4 is mainly generated by agricultural activities, the production of coal and gas, as well as waste treatment and disposal. N2O is mainly emitted by agricultural soil activities and chemical production.
In the EU, 60% of the CH4 and N2O emissions are emitted by the top six emitting countries – Germany, UK, France, Poland, Italy and Spain.
The upward trend in CH4 and N2O emissions is also visible in the US, China, Japan and India which all recorded increasing GHG emissions.
-Europe’s downward trend stalling
Over the past two decades, the EU28 has steadily decreased its CO2 emissions, which still represent two thirds of the EU’s total greenhouse gas emissions.
In 2016, the EU’s CO2 emissions were 20.8% below the levels in 1990 and 17.9% below the levels in 2005. Since 2015, the EU’s CO2 emissions have stabilised, representing 9.6% of global emissions.
-Country profiles
The report is based on the JRC’s Emissions Database for Global Atmospheric Research (EDGAR), which is not only unique in its space and time coverage, but also in its completeness and consistency of the emissions compilations for multiple pollutants: the greenhouse gases (GHG), air pollutants and aerosols.
The new report contains country-specific fact sheets for 216 countries. The factsheets show the evolution of country-level CO2 emissions from 1990 to 2016 and the evolution of country-level GHG emissions from 1970 to 2012.
###
Read the full report here: http://edgar.jrc.ec.europa.eu/booklet2017/CO2_and_GHG_emissions_of_all_world_countries_booklet_online.pdf
MAGA
SuperTrump. ‘Crisis? What Crisis?’
Ha! Very rare to hear that album referenced (the original), btw. Great record!
I’m concerned about the stall–foodstuff production was increasing significantly because of increases to atmospheric CO2. It will be a crisis indeed if CO2 plateaus and foodstuff production also stalls.
This is why I call the windmills “pinwheels of death” .
Indeed. This is so reminiscent of the early 1980s and the run-off of the “Ozone Hole” WE ARE ALL GOING TO DIE crisis.
Recall then that after years of nonsense hyperbole about manmade CFCs causing the “Ozone Hole” (a cyclical phenomenon, as suggested by anecdotal evidence going back to 16th and 17th Century Spanish colonial accounts of unexplained blindness occurring in Chilean sheep flocks), the purveyors of the meme started to declare victory. They did so, because (what do you know) the Ozone Hole started miraculously to close!! All because CFCs were removed from circulation….riiight.
Gradually more and more nonsense statistics and flashy graphics were circulated through the Media, and more and more preening of various academics (who had made entire careers out of the utter BS of the “Ozone Scare”) started to occur. Then, after a few years and entirely without fanfare, the meme was dropped.
The same thing is starting now in CAGW. The cyclical top has arrived and probably passed. There is nothing any “climate scientist” can do to perpetuate the gravy train of WE ARE ALL GOING TO DIE so ably publicized by Gore. The global climate will cool, perfectly naturally, for the foreseeable future – so the CAGW Brigade has decided it is going to declare victory while it can…See, we cut CO2 and voila. Success….!!
This way at least when (or if) societies in the Europe and North America in particular wake up to the fact they are vastly under-prepared for a cooler climate phase (not least because of the damage done by anti-CO2 emission policies to power generation capacity for national grids), the CAGW Brigade will be long gone from public memory; and will in any event be able to say it’s not their fault, victory was declared years ago and we cannot be blamed if governments didn’t prepare for the cold since then….
Watch. Just watch.
I agree with you. There is a segment of society that takes advantage of gullible people. Just follow the money!
It will be interesting to see how this relates to measured atmospheric prevalent assumption seems to be that most or nearly all of the rise is anthropogenic. If so then a stall in human emissions increase should be reflected in the atmospheric trend. If not then the assumption may be wrong.
“If so then a stall in human emissions increase should be reflected in the atmospheric trend. If not then the assumption may be wrong.”
As I understand it anthro emission stands at twice what the biosphere can sink. ie it removes around a half. That being the case then we would need to halve emissions to stand still as far as ppm CO2.
https://scripps.ucsd.edu/programs/keelingcurve/2016/05/23/why-has-a-drop-in-global-co2-emissions-not-caused-co2-levels-in-the-atmosphere-to-stabilize/
That’s not correct. If we reduce our emissions by half and the airborne fraction remains close to ~50%, half of what we will emit will still make it to the atmosphere.
It is however likely that the increased sinks will remain activated for some time (more plants will still need more CO2), and the airborne fraction might go down so it is theoretically possible to achieve negative CO2 change in the atmosphere with positive emissions.
Toneb. The claim can be traced back to alamists’ gross misuse of Henry’s law.
The current emission rate is about 10 Gigatons Carbon while the rate of absorption/sinking would be in the 6 Gigaton range right now after the El Nino blip.
The 50% airborne fraction is just a fluke. The rate of absorption/sinking depends on the amount of CO2 that is in the atmosphere, not how much we emit each year.
The natural absorption/sinking rate will eventually rise to the 10 Gigatons Carbon level (the same as we are emitting in the last 3 years) but that will be many decades from now.
anthro emission stands at twice what the biosphere can sink….
“biosphere” is growing exponentially…and the more you feed it, the faster it will grow
Why it isn’t obvious CO2 was limiting is beyond me
Toneb;
Your understanding appears to be flawed, as it seems to assume a balance in Nature, even though that balance has been disrupted by the end of the Little Ice Age. As the Earth warmed from that cold spell, more CO2 precipitated out of solution in the oceans.
Also, when a detrended analysis is performed tod compare the change in concentration of atmospheric CO2 to the amount of CO2 emitted by human activity, on a year by year basis, there is a very low correlation. When there is a very low correlation between the amount CO2 that humanity adds with the change in the amount of atmospheric CO2, that is evidence that human emissions of CO2 do not cause changes in atmospheric CO2. The apparent correlation between the the the amount of CO2 in the atmosphere and the total amount of human emissions of CO2 is false, because it only means that both have increased over time.
While correlation does not prove causation, a lack of correlation does disprove causation.
Sorry about forgetting the link:
http://edberry.com/blog/ed-berry/why-our-co2-emissions-do-not-increase-atmosphere-co2/
Lack of correlation could also point to not including all the variables.
Richard Bell,
By detrending the CO2 emissions and the increase in the atmosphere, one simply removes the main cause and effect. all what remains is the variability around the trend and that has a high correlation – with a lag – of CO2 variability after temperature variability. That correlation does show the cause of the variability, but doesn’t disprove the cause and effect of emissions and CO2 increase in the atmosphere. That correlation is very high over the past 120 years:
http://www.ferdinand-engelbeen.be/klimaat/klim_img/temp_emiss_increase.jpg
While the correlation with temperature is up – down – up – flat…
Over the past 800,000 years, there was a fixed correlation between temperature (proxies) and CO2 levels in ice cores of about 16 ppmv/K, not by coincidence the solubility change of CO2 in seawater. On short term (seasons to 1-3 years), that is about 4-5 ppmv/K. Since ~1850 the increase is over 120 ppmv/K if temperature was the cause, but that violates the observed solubility factor…
See further my comments (my last comments weren’t even published by Ed…) at the link you gave.
Javier — that’s probably pessimistic since CO2 absorption also increases as a function of CO2 levels — it should be necessary for CO2 emissions to not just increase, but actually continue to accelerate, to maintain the observed accelerating trend in measured levels.
If emissions go from “accelerating” to “flat” the trend should bend down pretty fast, barring some giant flaw in the theory that emissions are the primary factor driving concentrations.
Either the emissions numbers are way off (possible), or human emissions aren’t largely driving CO2 increases right now (looking more likely).
Ferdinand Engelbeen
That graph is a bit nonsensical — the blue line implies past emissions are being re-emitted in every future year. It’s as though you bought a mutual fund, and then every year you claimed the difference from your initial investment was income you could put in another account.
“That correlation is very high over the past 120 years:”
Sure, but that correlation exists for any accelerating trend over the last 120 years.
NASA: “The ocean is great at sucking up CO2 from the air. It absorbs about one-quarter of the CO2 that we humans create when we burn fossil fuels (oil, coal, and natural gas.) If not for the ocean, we’d be in even worse trouble with too much CO2.”
https://climatekids.nasa.gov/ocean/
Remember, the oceans and biosphere do not care where the CO2 came from — they absorb CO2 at a rate dependent on the level of CO2 in the atmosphere (and other variables), irrespective of current emissions. If humans emit twice as much as in one year as another, the amount absorbed depends on the current concentration, not the current emission! That’s why the shift from “accelerating emissions” to “flat emissions” should already be visible at Mauna Loa, and its absence must be explained by adjustment to either the claimed emissions or the theory of strong coupling between emissions and concentrations.
The biosphere capacity to “sink” CO2 is limited largely by CO2 availability and water. Satellite imagery evidence shows that the “capacity” to fix carbon has increased as atmospheric CO2 has increased. One of the more dubious assumptions of the alarmist community is the passive nature of biological response to increased carbon availability. The greatest threat to the biosphere is the excess capacity that it has for “sinking” carbon. Geologically, evidence seems to reflect steady draw down of atmospheric CO2, indicating that biology fixes it faster than geology can make it available again. Warmer weather and more CO2 would only make plants happier.
It makes me happy too…more CO2 is good for trees, lawns and crops. Isn’t that what everyone wants?
talldave2
That graph is a bit nonsensical
It shows the total increase of CO2 in the atmosphere if there were no sinks reacting on the extra CO2 pressure in the atmosphere… Or you buy every year a few obligations without selling one…
Sure, but that correlation exists for any accelerating trend over the last 120 years.
Indeed, like the growing population or industrialisation. In this case both the cause of the growing emissions. But the causal link between CO2 emissions and CO2 increase is a lot more likely than with temperature or any other increasing variable…
That’s why the shift from “accelerating emissions” to “flat emissions” should already be visible at Mauna Loa
Hardly, as the reaction of the sinks to the increase in the atmosphere is very small: about 0.02 * the pCO2 difference between atmosphere and ocean surface.
Increase in 2011: 4.2 ppmv – 0.02 * (391 – 290) = 2.18 ppmv
Increase in 2016: 4.2 ppmv – 0.02 * (402 – 290) = 1.96 ppmv
Accuracy of Mauna Loa for yearly averages is +/- 0.2 ppmv
This is exactly what is expected. The atmospheric CO2 increases because of large yearly emissions, not because they’re every year bigger than the previous year.
Should we halve emissions, the atmospheric CO2 should keep stable for some time. Long time sink development is not well known (uncertainty used for scaremongering), so it is hard to know what exatly happens if today’s emissions are kept for next 50-100 years. I believe vegetation will grow enough to start reducing the atmospheric CO2. Some others think that there’s a tipping point waiting even with stable emissions.
Thanks Ferdinand and Javier for trying to explain. +1 from me.
Ferdinamd,
But the causal link between CO2 emissions and CO2 increase is a lot more likely than with temperature or any other increasing variable…
No one can know that. The sample size is one. Maybe this is pretty close to what always happens in natural warming cycles.
That’s why the shift from “accelerating emissions” to “flat emissions” should already be visible at Mauna Loa
Hardly, as the reaction of the sinks to the increase in the atmosphere is very small: about 0.02 * the pCO2 difference between atmosphere and ocean surface.
Increase in 2011: 4.2 ppmv – 0.02 * (391 – 290) = 2.18 ppmv
Increase in 2016: 4.2 ppmv – 0.02 * (402 – 290) = 1.96 ppmv
Again, this doesn’t make any sense as a fairly simple matter of math — the largest increases in the past 100 years happened in the last five years, even though emissions were flat. If the difference in emissions between a flat and accelerating trend are indistinguishable to the trend of the overall concentrations, over five years, a causal relationship is unlikely even if the sinks are small.
talldave2:
Maybe this is pretty close to what always happens in natural warming cycles.
Sorry, impossible: that violates Henry’s law and the resulting solubility of CO2 in seawater which changes with about 16 ppmv/K as also seen over the past 800,000 years in ice cores…
The whole warming of ~0.8 degrees since the LIA is good for maximum 13 ppmv of the observed 110 ppmv increase above the 290 ppmv in equilibrium with the ocean surface for its current average temperature.
If the difference in emissions between a flat and accelerating trend are indistinguishable to the trend of the overall concentrations, over five years, a causal relationship is unlikely even if the sinks are small.
That depends of the time constants involved. The removal of any extra CO2 above equilibrium is a slow process, with an e-fold decay rate of ~51 years. Thus a small change in emissions between increasing and flat rate of change will not be noticed and certainly not if there is a lot of noise.
Take e.g. sea level changes: it takes at least 25 years to mathematically (!) detect a trend of a few mm within a noise of meters in waves and tides. Does that mean that there is no sea level change at all?
Maybe this is pretty close to what always happens in natural warming cycles.
Sorry, impossible: that violates Henry’s law and the resulting solubility of CO2 in seawater which changes with about 16 ppmv/K as also seen over the past 800,000 years in ice cores…
Every warming trend sees a lagging increase in CO2, the only question is how unusual the magnitude of the current interglacial’s has been recently. The warming process is not nearly well understood enough to rule out much of anything — we have reliable, high-resolution data on exactly one of them and we barely understand that one — just look at the spread of climate sensitivities in the literature. Solubility in sea water is one factor among many, many others.
If the difference in emissions between a flat and accelerating trend are indistinguishable to the trend of the overall concentrations, over five years, a causal relationship is unlikely even if the sinks are small.
That depends of the time constants involved.
That argument won’t help you, as it cuts both ways — a larger time constant implies emissions are less important to concentrations. I studied fusion physics data in which some processes had e-folds that manifested in nanoseconds, versus others that took milliseconds to unfold. Guess which processes dominated? 🙂
The removal of any extra CO2 above equilibrium is a slow process, with an e-fold decay rate of ~51 years.
Again, you don’t know that with any certainty and neither does anyone else. The literature of just the past ten years is full of surprises.
Also, as I pointed out before, the “time lag” explanation, in addition to not bolstering the strong coupling argument for emissions and concentrations, requires that the CO2, having been duly emitted, spend that lag somewhere other than the atmosphere, which is the one variable here we can at least sort of reliably measure and do.
Perhaps the CO2 is hiding in the oceans for a few years? 🙂 Hey! I think I found it next to Trenberth’s missing heat!
talldave2,
As you probably are familiar with simple linear processes, here is what is observed:
1959: 25 ppmv above steady state; sink rate 0.5 ppmv/year; decay rate 50 years; half life time 34.7 years.
1988: 60 ppmv; 1.13 ppmv/year; 53 years; half life time 36.8 years.
2012: 110 ppmv; 2.15 ppmv/year; 51.2 years or a half life time of 35.5 years.
Looks surprisingly linear to me, even if some of the underlying processes may be highly non-linear…
Thus, in my opinion, a factor 0.02 in ratio between net sinks and atmospheric pCO2 above steady state between ocean surface and atmosphere is acceptable for current and near-future sink rates (*).
The ocean surface and land surface temperatures have a small, short-term influence of about 4-5 ppmv/K, the deep oceans a very long term influence of 16 ppmv/K, which since the last glacial-interglacial is long past done. If anything, the small cooling since the Holocene “Optimum” should give lower CO2 levels, not higher…
(*) The IPCC uses the Bern model, which includes the saturation of the deep ocean sinks (and vegetation), leading to increasing time constants and a fraction that never will be absorbed. There is currently not the slightest sign of a decreasing sink rate…
talldave2,
Perhaps the CO2 is hiding in the oceans for a few years?
No, the CO2 is simply added to the atmosphere, that is why CO2 in the atmosphere increases.
The problem is that you expect a direct coupling between emissions and increase in the atmosphere, but the bottleneck is the limited deep oceans – atmosphere exchange, while the ocean surface is in fast equilibrium (less than a year) with the atmosphere.
The increase in the atmosphere is the simple subtraction of emissions minus sinks. The sinks depend of the total pCO2 above steady state, not of the emissions of one year. With a relative long decay rate, the sinks are smaller than the emissions and CO2 accumulates further in the atmosphere. That is all.
“The sinks depend of the total pCO2 above steady state, not of the emissions of one year. With a relative long decay rate, the sinks are smaller than the emissions and CO2 accumulates further in the atmosphere. That is all.”
Fortunately there is a constant increase of Carbon Dioxide that creates a growth of sinks. Without that increase of sinks the sinks would deplete the Carbon Dioxide to a starvation point and that creates a decreased growth because flora would adapt by not flowering and creating seeds or root shoots in other plants, by hoarding the Carbon Dioxide availability to them. The stunted flora will produce an increase of leaves to gather more CO2 from the environment in self preservation or die trying. In cold winter climates the flora that go dormant will struggle to recover in spring. Leading to their extinction over time and repeated years of it.
johchi7,
Good for the plants on earth, you are too pessimistic… The sinks only are active on the extra CO2 above equilibrium, not the absolute CO2 levels. The equilibrium over the past 800,000 years was about 16 ppmv/K change in ocean temperature, that was between 180 and 300 ppmv. For the current ocean surface temperature about 290 ppmv.
But indeed, 180 ppmv during the glacial periods is already very low and at the edge of extinction for C3 plants…
Patrick Moore calculates that, given the Neogene trend, CO2 might fall below the 150 ppm level, at which C3 plants start starving, failing to reproduce and eventually die, in about another two million years, as each succeeding glacial epoch gets colder.
Thus humanity is saving the planet by releasing sequestered carbon as CO2. The last thing we need is more sequestration. The risk of catastrophes from more of the essential trace gas is practically nil, where as the end of most photosynthesis-based life on land is a real danger. Only C4 and CAM plants and whatever microbes, fungi and animals could subsist on them would survive at low CO2 concentrations.
The one thing that the last 6 decades should have taught us, is that alarmist from the other end of the debate have been winning over the ignorance of the population by their scare tactics. Being nice and having scientific proof against their demonizing of fossil fuels and carbon dioxide has lost the debate. To get the attention of the population you have to hit them where it hurts to sway them away from their mindsets of indoctrination. I’m not say we should lie to them like their indoctrinators have done. Just persuade them with stronger language the benefits of increasing CO2.
…and by the way. People respond to common language and not scientists that use all their mathematics and symbols they know, but the layman don’t understand a word of it.
johchi7 October 23, 2017 at 3:10 pm
Even highly educated people fall for the “97%” lie, although they should know better. It IMO has been the alarmists’ most effective propaganda weapon. The Big Lie works, as Goebbels taught generations of propagandists.
Gabro I grew up when Saul Alinsky’s new book was still being talked about…”Rules for Radicals” that came after his book decades earlier “Revellie for Radicals” about community organizing and frankly how to set up protests and scare people into doing what you want them to. Going back farther to how John Dewey took control in education indoctrination tactics and that the Frankfurt School came from NAZI Germany to the USA and their indoctrination tactics of Marxism, Hagel and other socialist leaning philosophers changed all the schools in the USA. That Marxism and Darwinism was already prominent in our higher learning institutions since the middle 1800’s that gave us presidents like Theodore Roosevelt and Woodrow Wilson and Franklin D. Roosevelt and Lyndon B. Johnson many of our politicians of that era was what led to those changes in our schools. Back to Saul Alinsky that those Rules for Radicals are the same tactics being used to push these alarmists ideologies. Remember the “If you repeat a lie enough people will believe it.” of Vladimir Lenin….or was it Hitler? Or the “Give me the children and I’ll…” Well that’s how they’ve done it and still do it. Generations of sheeple indoctrinated from birth to conform to what the government says is truth and the media to spread it in nearly every way… “1984” the Orwellian classic comes to mind. How do you fight back against such a mass brainwashing that has demonized fossil fuels and carbon dioxide? Again, people respond to common language and scare tactics. Too much science is like speaking old Hebrew to an audience of Mandarin Chinese.
People will believe what they want to believe. It’s hard to change their minds if they have a vested interest in believing something.
Not sure what you mean by Darwinism. Social Darwinism? Evolution, like gravitation, is a scientific fact, to include darwinian processes, not a philosophy of education or indoctrination.
Unexpectedly I was called to work and no time to reply. You can find it online what Wilson and Darwinism he brought to govern by. Segregation, eugenics and in general racism as the survival of the fittest twisted mind set he had and his view on our Constitution as a living document that the separation of powers wasn’t a good thing…pretty much defined our Democratic Party that has change our society since then.
Thanks for responding.
That Wilson, like most Democrats, was a racist has nothing to do with the fact of evolution. Nor with Darwin, who, contrary to the belief of many in the 19th century, regarded humans as all the same species and opposed slavery.
http://godfatherpolitics.com/charles-darwin-woodrow-wilson-evolving-constitution/
https://fee.org/articles/woodrow-wilson-progressive-and-dedicated-racist/
“Government” he considered “not a machine, but a living thing . . . accountable to Darwin, not to Newton.” Nothing of that sort could, he believed, “have its organs offset against each other, as checks, and live.” Its health was “dependent upon” the “quick co-operation” of these organs, “their ready response to the commands of instinct or intelligence, their amicable community of purpose.” Wilson was the first to call for there to be a “living” political constitution “Darwinian in structure and in practice.”
To this end, in running for the presidency he openly sought “permission — in an era in which ‘development,’ ‘evolution,’ is the scientific word — to interpret the Constitution according to Darwinian principle.”
Ferdinand’s models are ad hoc, contrived, and non-physical. It is very obvious that human emissions have little influence on atmospheric concentration. One day, people will look back on it like we do at witchcraft and phrenology, and wonder how people could have deluded themselves so.
“It will be interesting to see how this relates to measured atmospheric prevalent assumption seems to be that most or nearly all of the rise is anthropogenic. If so then a stall in human emissions increase should be reflected in the atmospheric trend. If not then the assumption may be wrong.”
Sinks have been growing as our emissions have grown just in a lagging in response, if our emissions have stalled and sinks are still increasing in response to past emissions we should see a flattening and then slow decrease in the amount of CO2 in the atmosphere.
If not than our emissions and are not the cause of the global increase in Co2 concentrations and end of discussion.
Bob Boder,
As Bill Illis aready said, the sinks don’t respond to human emissions of one year, they respond to the total extra pressure of CO2 above the solubility of CO2 in seawater which is ~290 ppmv for the current (weighted) average ocean surface temperature, in dynamic equilibrium (“steady state”) with the atmosphere.
Because human emissions increased slightly quadratic over at least the past 60 years, the increase in the atmosphere also increased sligthly quadratic and so did the sinks. The result is an accidental average 50-55% “airborne fraction” in the atmosphere.
If humans should half their emissions, current sinks would be equal and CO2 wouldn’t increase further.
Now that human emissions stall, but still higher than the sink rate, CO2 further increases in the atmosphere and the sinks still increase, with as result a smaller airborne fraction:
http://www.ferdinand-engelbeen.be/klimaat/klim_img/dco2_em6.jpg
The observed net sink rate is about 0.02*Δ(pCO2(atm)-pCO2(eq)), or an e-fold decay rate of ~51 years, surprisingly linear over the past near 60 years…
Now that human emissions stall, but still higher than the sink rate, CO2 further increases in the atmosphere
At exactly the same rate? Nuh-uh.
talldave2
At exactly the same rate?
See the red line: that is the calculated remainder of emissions minus calculated sink rate, based on the extra CO2 in the atmosphere dynamic equilibrium with oceans (and vegetation). The blue line are the emissions, which remain flat in the past years, while the red line goes somewhat down. When the red line reaches zero, sinks are equal to emissions (at ~520 ppmv in the atmosphere), which will take many decades…
Ladies and Gentlemen,
I just plotted global atmospheric CO2 vs time from 1980 to present from this data source:
ftp://ftp.cmdl.noaa.gov/ccg/co2/trends/co2_mm_gl.txt
The atm. CO2 trend continues to accelerate slightly upwards, despite the alleged stall in the emission rate of CO2 for the past several years.
CO2 is truly a wonderful gas, since it seems to fulfill the wishes of all its proponents:
Since 1958, atm. CO2 has increased whether CO2 emissions have increased or not.
Since 1940, increasing atm. CO2 has allegedly caused global cooling, global warming, and near-constant global temperatures.
Are you sure you’ve got this all sorted out?
No wonder so many people think that CO2 should be curtailed – it is making them crazy. 🙂
Ferdinand,
At exactly the same rate?
See the red line: that is the calculated remainder of emissions minus calculated sink rate, based on the extra CO2 in the atmosphere dynamic equilibrium with oceans (and vegetation). The blue line are the emissions, which remain flat in the past years, while the red line goes somewhat down. When the red line reaches zero, sinks are equal to emissions (at ~520 ppmv in the atmosphere), which will take many decades…
Unresponsive. It would take an enormous coincidence for all these factors to balance net out such that an accelerating trend and a flat trend in emissions lead to exactly the same trend in concentrations. And no one knows what the sinks are, they can only be inferred, so you can fit them to any curve you like.
Allan
That is because the ladies and gentlemen are expecting a constant between 1 emission equals 1 co2 in the atmosphere.
The measured seasonal pass through rate / volume at 100km is increasing
Regards
Allan
I always enjoy and respect your analysis on this subject. However it is based on a closed circuit troposphere. That is, what good up always comes down.
CO2 is not like water it passes through the tropopause and at twice in the annual cycle passes out to higher altitudes on a permanent vacation.
If the emmision volume halved overnight, the annual atmospheric rate would continue to climb at a similar rate, if tropospheric temperature profiles remains constant.
Regards
ozonebust,
If the emmision volume halved overnight, the annual atmospheric rate would continue to climb at a similar rate, if tropospheric temperature profiles remains constant.
That certainly seems to fit the data far better than any of the models requiring emissions to dominate concentrations via some magical process that causes concentrations to rise the same way irrespective of whether emissions are flat or accelerating.
ozonebust and talldave2
If the emmision volume halved overnight, the annual atmospheric rate would continue to climb at a similar rate, if tropospheric temperature profiles remains constant.
Sorry, that is impossible. If the emissions halved, the increase in the atmosphere that year would be zero. The sinks don’t respond to the small increase of CO2 of one year, they respond to the total CO2 pressure (pCO2) in the atmosphere above the dynamic equilibrium between atmosphere and the solubility of CO2 in the ocean surface at the average temperature of the oceans.
Thus if in one year humans add 4.5 ppmv CO2 in an atmosphere at 400 ppmv, that is 110 ppmv above equilibrium (290 ppmv), that gives a sink rate of 0.02 * 114.5 = 2.29 ppmv resulting in an increase to 102.2 ppmv above equilibrium (402.2 ppmv).
If in the next year you add 2.25 ppmv CO2, or half the emissions, the sinks get 0.02 * 116.8 = 2.3 ppmv and there is no additional increase in the atmosphere.
If in the next years you add 4.5 ppmv CO2 each year again, that will lead to a smaller and smaller increase in the atmosphere, as the extra CO2 pressure pushes more and more CO2 into the oceans (and plants). But the difference in the first years is small, as you start already with 110 ppmv extra, thus each year the sinks increase with only about 2%. That difference in sink rate is not even observable at Mauna Loa, as that is within the accuracy of the yearly averages.
The factor 0.02 pressure/sink ratio is what is observed over the past 60 years and is surprisingly linear within a fourfold increase of emissions and extra CO2 pressure in the atmosphere over that time period.
The temperature profile of the atmosphere is important for water vapor, but unimportant for CO2: There is hardly a difference in CO2 increase between Mauna Loa at 4,300 m and Cape Kumukahi, Hawaii at 7 m above mean sea level. Only for fast (seasonal) changes, the amplitude at Mauna Loa is smaller due to the necessary mixing time of several months.
The main influence of natural variations on short time spans are land and ocean surface temperatures and on very long periods (glacial – interglacial) the deep ocean temperatures. as that influences the solubility of CO2 in seawater and the uptake/release of CO2 by plants and thus the equilibrium with the atmosphere. But both are not the cause of the current CO2 increase in the atmosphere…
Ferdinand
Your assumptions are without foundation, and your conclusions of equilibrium do not have data to support.
Again you look at the troposphere like it is a closed system, it is not.
The entire vertical column increases and leaks out at high altitudes in a twice annual cycle.
The real carbon cycle is still not well understood. The annual residual increase is what remains in the troposphere. Not one other person has commented on the seasonal trends shown in the OCO-2 images.
The previously unidentified annual pressure cycle that controls this transport process will post that soon.
Here is an detailed view of the real carbon cycle.
Regards
http://www.blozonehole.com/blozone-hole-theory/blozone-hole-theory/carbon-cycle-using-nasa-oco-2-satellite-images
Interesting, Ozonebust. However, something I think you should consider is that the CO2 anomaly is not proportional to temperature anomaly, rather its rate of change is proportional to (appropriately baselined) temperature anomaly.
This relationship has been manifest since at least 1958, when the Mauna Loa site came online. The higher accuracy satellite data produce an even better fit.
What that means is that there is a very long term equilibration process going on, such that on local time scales, the process looks very much like a direct integration. For very long time constants, it is natural to consider the oceans, which exhibit overturning on the order of centuries. That is the basis of my hypothesis for how this is all coming about.
Ozonebust,
There is not much CO2 that leaks into the highest atmosphere, most movements are in the troposphere as measured by balloons even in the 1960’s:
http://www.ferdinand-engelbeen.be/klimaat/klim_img/seasonal_height.jpg
Where it is clear that the amplitude is much smaller when you pass the tropopause.
Further, about 80% of the atmospheric mass is in the troposphere and CO2 gets less and less from 20 km height and up. Thus sorry, there is little CO2 that can hide in the upper atmosphere…
There is a much simpler explanation for the NH-SH transfer of CO2: 90% of the extra CO2 emitted by humans is emitted in the NH, which has the highest amplitude also in de NH, due to more land/vegetation than oceans. At the highest levels in the NH amplitude, CO2 is transported from the NH to the SH. In summer that can be reverse, but anyway smaller than the NH to SH transport over a full seasonal cycle. Look at the monthly CO2 data of a few NH and SH stations:
http://www.ferdinand-engelbeen.be/klimaat/klim_img/month_2002_2004_4s.jpg
In average the NH stations lead the increase of the SH stations.
The stall in CO2 emissions coincides with the current natural cooling. Going forward, the alarmists will be adjusting current temperatures down and past temperature up to make this coincidence seem relevant.
One must wonder how they get accurate CO2 emissions from some areas, China for instance?
David,
you ask the communist regime. They’re good and honest people, why would they lie?
“One must wonder how they get accurate CO2 emissions”
About the only thing they have to base this on is fossil fuel consumption, although global GDP is also a good indicator …
Only about 5% of the CO2 emitted each year is human-caused. So the fact that human emissions have stalled will have almost zero effect on our plants. Fortunately.
Hivemind,
Any bookkeeper would disagree with you: you forgot to take into account the natural sinks… Human emissions indeed are only about 6% of natural emissions, but they are additional and at maximum they are 3% of the natural sinks (as mass, not the original molecules), thus near all increase is from the human emissions, with a small part from increased sea surface temperatures…
Corrected: It will be interesting to see how this relates to measured atmospheric CO 2concentration. The prevalent assumption seems to be that most or nearly all of the rise is anthropogenic. If so then a stall in human emissions increase should be reflected in the atmospheric trend. If not then the assumption may be wrong.
No sign yet of any lessening of the rate of increase at Mauna Loa –
https://www.esrl.noaa.gov/gmd/ccgg/trends/
but it would certainly be expected to take some time to show up as the rate of output is still large, and the uncertainty of the estimates is likely large also. How good are the Chinese figures, given that they are much the largest emitter, annual economic growth is 6-7% (claimed), new (somewhat cleaner) coal generation is being very rapidly added, and old dirty coal generation reduced only a little,?
According to the first graph, there has been little change in human emissions all the way back to 2010. Before 2010, however, human emissions were increasing steadily. The alarmist dogma (welcomed by special interests and UN bureaucrats) is that increasing human emissions are responsible for increasing CO2 in the atmosphere. The emperor just joined a nudist colony.

Whereas human emissions stopped increasing, have scarcely changed for the better part of a decade, the increase of CO2 in the atmosphere didn’t flinch. Atmospheric CO2 has continued to increase – if anything, even faster.
The contradiction leaves little weasel room.
Ian – the point is that human emissions have stopped increasing, but they haven’t stopped, and the year-on-year extra load is not much altered from expectation.. So we wouldn’t expect this to show up in the CO2 measurements in an identifiable signal for a long while yet. The CO2 concentration remains well within the predicted envelope. There are other reasons for doubt, perhaps, but sceptics on this point are far fewer than sceptics of CAGW. I myself still have reservations that the ‘mass balance calculation’ can be regarded as evidence, but I’m not in particularly good company on that one!
mothcatcher — what, is the extra CO2 hiding in the oceans? 🙂 Sorry, this doesn’t make any sense — violent shifts in output from “accelerating” to “flat” should not be completely indiscernible in the trend of concentrations supposedly driven almost entirely by emissions.
Ian
If CO2 emissions halved overnight and seasonal temperatures remained similar the annual Mauna Loa Increase would rain similar.
The first indication of atmospheric reduction will be recorded at the 100km seasonal variation pass through rate / volumes. The entire vertical column growth rate will stall top down.
The current carbon cycle closed circuit is nothing more than an unqualified myth lacking in imagination.
Mauna Loa Increase would remain similar.
ozonebust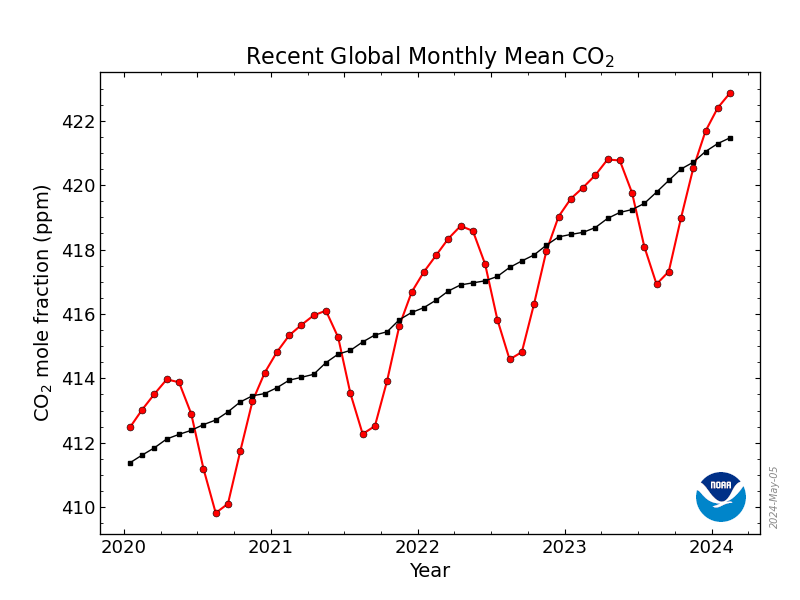
globally it is also 2 ppm per year
Mauna Loa Increase would remain similar.
talldave2,
Indeed most is absorbed by the oceans and also a lot in vegetation, the earth is greening, but that doesn’t not remove all emissions in the same year as emitted. Thus CO2 keeps growing in the atmosphere.
Seasonal and year-by-year variations (Pinatubo, El Niño) are caused by temperature but near zero out at the end of a full cycle or a few years. The long term trend in CO2 is about half of human emissions and its removal follows the extra pressure in the atmosphere, hardly infuenced by temperature.
Further, it would be very remarkable that some natural source increased in exact lockstep with human emissions in the same time span: a quadrupling over the past 60 years…
Ferdinand
The DeVries cycle is 210 years and we have not seen even 60 years of good data, even some changes in equipment during that 60 years….
never mind the Eddy cycle of 1000 years
[there is good historical evidence that the NE or NW passage existed 1000 years ago]
Like the increase of fires and volcanic activities.
Like the increase of fires and volcanic activities.
Ferdinand: “Thus CO2 keeps growing in the atmosphere.”
It’s not just continuing to grow… the increase is still increasing. Not possible.
https://www.esrl.noaa.gov/gmd/ccgg/trends/gr.html
talldave2,
You need to take into account that in El Niño years there is less uptake (specifically by tropical vegetation) and more during La Niña or Pinatubo…
1998 and 2015-2016 were strong El Niño years, 1992 was the Pinatubo eruption.
Despite that, the variability in CO2 increase was not more than +/- 1.5 ppmv around a trend of +90 ppmv, here enlarged for the period 1985-2000, asssuming a response of 4 ppmv CO2 / K temperature change:
http://www.ferdinand-engelbeen.be/klimaat/klim_img/wft_trends_rss_1985-2000.jpg
Henry’s
That is the rate recorded at Mauna Loa. It is the rate used for the global increase.
The curve is controlled by the annual thermally driven tropospheric pressure cycle, as are all sample site curves.
It records the circulating accumulation and then the dilution of oxegenation. Look at the CO2 minimum date.
In April 2017 at a congressional hearing Dr Judith Curry stated quite clearly that there is no understanding of what controls the polar sea ice cycles. Nothing has changed since that time.
 ?w=800
Greg Goodman posted this chart some time ago, it is on the WUWT CO2 page.
It identifies the immaculate relationship between the Arctic sea ice cycle and the Alert CO2 cycle.
They are both controlled by the same annual pressure cycle.
If you do not know what controls the Arctic sea ice cycle – you DO NOT know what controls the CO2 cycle.
I would ask anyone commenting here to please explain why the high latitude CO2 curves go flat (i.e.) the CO2 stops rising) during December in the mid – high NH latitudes for many weeks during winter, then rises slightly in spring before declining. During the flat no growth period NH emissions are at a peak and oxidation is not occurring.Why do the curves go flat?
Logic needs to enter this discussion,may it arrive soon.
Regards
henryp,
Those cycles have an influence on temperatures, thus on CO2 levels, but even the MWP-LIA drop of ~0.8ºC did give only a drop of about 6 ppmv CO2 in the high resoution (20 years) DSS ice core of Law Dome:
http://www.ferdinand-engelbeen.be/klimaat/klim_img/law_dome_1000yr.jpg
If we may assume that the current temperature is not higher than during the MWP, that is all CO2 from warming oceans you have…
ozonebust,
The CO2 cycle and ice surface cycle have a common cause: seasonal temperatures. Sea ice and CO2 don’t influence each other to a measurable extent.
The CO2 cycle definitely is dominated by the biosphere, not by the oceans: highest uptake is in summer and CO2 and δ13C change opposite to each other. If the oceans/ice were dominant, then CO2 and δ13C would parallel each other. Here for Mauna Loa and Barrow:
http://www.ferdinand-engelbeen.be/klimaat/klim_img/seasonal_CO2_d13C_MLO_BRW.jpg
Mr. Englebeen cites Pieter Tans of NOAA asserting that to the extent temperature affects natural emission of CO2 into the atmosphere, this effect is only a short year-to-year effect. The reason advanced is that this natural emission is predominantly the decay of fallen leaves and dead logs in the tropical rainforests, and this material decays very rapidly under tropical warmth and wetness. That temperature and the rate of atmospheric CO2 increase is correlated over longer intervals follows from temperature increasing from the human emissions over time — the anthropogenic signal in Climate Change.
Look at the Great Leveling of the atmospheric CO2 curve in the early 1990s. I see this occupying 4-5 years. Mt Pinatubo “blew” in 1991, cooling the atmosphere. Look at the 2010s where industrial output was affected by the Great Recession. I see hardly any effect. This offers strong evidence of temperature-stimulated natural emissions. There is also field measurements in support of such natural emissions of comparable scale to the human-caused emissions (Bond-Lamberty, B. & Thomson, A. Nature 464, 579-582 (2010). )
Pieter Tans could be correct and the preponderance of the increase in atmospheric CO2 could be human caused. Or maybe not. We could use better models of both temperature-stimulated emission of CO2 from soils as well as the effect of changes in ocean upwelling affecting both global temperature as well as ocean-atmosphere CO2 balance.
Paul Milenkovic,
The main influence of temperature is the short term influence on mainly tropical vegetation. That is visible in the opposite CO2 and δ13C variability lagging temperature variability. See the graph I sent in response to talldave2 just below this series of answers.
Higher temperatures (and dryer conditions) means less uptake and more release of CO2 in the tropics. That is only temporarely during an El Niño and reverses with the end of the high temperatures and increase of precipitation. Net result near zero after a few years, as tropical forests in general are mature forests with little or no real growth or increasing of more permanent carbon in/on the soils.
On the other side, the extra-tropical forests increase their uptake with higher temperatures – increased growing season – and react more readily to the increased CO2 pressure in the atmosphere.
Thus while temperature is the main cause of the CO2 rate of change variability in the atmosphere, due to vegetation, vegetation is not the cause of the increase of CO2 in the atmosphere, it is an increasing sink.
Thus even when temperature increased somewhat over the past 60 years, that is not the cause of the CO2 increase and δ13C decline in the atmosphere. Neither are the oceans, which are a proven sink for CO2 too and their δ13C levels would increase δ13C in the atmosphere, while we see a firm decline…
Ferdinand
With the greatest respect you are missing the point that I am making. The shape and timing of the curves is not controlled by the biospheres. The biospheres and emissions are contributors to the contents of the curves, but not the precise timing of the shape.
Both the sea ice area cycle and the CO2 cycle are controlled by a pressure cycle.
I am yet to see an answer to my question about high latitude NH CO2 curves.
Regards
Ozonbust:
The biospheres and emissions are contributors to the contents of the curves, but not the precise timing of the shape.
I disagree: the timing may be influenced by ice formation/melt, but the bulk of the δ13C drop in Barrow in the above seasonal curve shows that higher temperatures give more plant uptake in spring-summer-fall and opposite in fall-winter-spring. Nothing to do with pressure while ice formation/melt hardly influences the amplitude, that is mainly due to the amount of CO2 going in and out the biosphere, The oceans do react opposite to temperature as what is observed (both for CO2 and δ13C), thus vegetation is the dominant factor.
Moreover, the high seasonal amplitude of the CO2 and δ13C change is not only visible in the High North, but also in the mid-latitudes: the seasonal CO2 amplitude at the former station of Schauinsland (Black Forest, SW Germany) is larger than at Barrow. In the SH, the seasonal amplitudes are much smaller: more sea, less vegetation…
https://www.esrl.noaa.gov/gmd/ccgg/trends/gr.html
Ferdinand Engelbeen October 20, 2017 at 1:33 pm
talldave2,
You need to take into account that in El Niño years there is less uptake
Sure, but this isn’t the first El Nino, and the others mainly happened under accelerating emissions. What’s more likely, that the steady trend in CO2 concentrations is due to factors we don’t understand very well, or that the wildly fluctuating trend in emissions dominates concentrations but in ways that are precisely offset by other factors to produce a steady trend in concentrations even when emissions flatten?
“We don’t know” has a pretty strong track record against barely plausible models.
talldave2
Human emissions don’t change wildy from year to year, to the contrary: year by year emissions vary less than 0.2 ppmv, which is not even trackable in the Mauna Loa data…
The overall increase is a smooth slightly quadratic increase in total emissions over the past 60 years and a near linear increase in the rate of change.
The wild variability is in the year by year increase in the atmosphere, which is caused by the influence of the high year by year variability in temperature: that influences the sink speed, where the variation is mostly in the uptake by tropical vegetation. During an El Niño, tropical vegetation is even a net producer of CO2 as uptake is suppressed due to dryer conditions in the tropics.
Here the clear influence of temperature on the CO2 rate of change which is mainly in vegetation as the opposite CO2 and δ13C changes indicate:
http://www.ferdinand-engelbeen.be/klimaat/klim_img/temp_dco2_d13C_mlo.jpg
Human emissions increased near linear from 0.23 ppmv/month in 1990 to 0.33 ppm/month in 2012.
That means that near all variability is caused by temperature variability, but that near all of the slopes of the trends (both CO2 and δ13C) are caused by human emissions…
Again, “accelerating” is a wildly different trend than “flat.” This is not that hard to follow.
None of the flak you throw out even comes close to a good explanation of how a wildly fluctuating trend in one variable creates a smooth trend in another.
talldave2
None of the flak you throw out even comes close to a good explanation of how a wildly fluctuating trend in one variable creates a smooth trend in another.
1. Human emissions don’t wildly fluctuate, they were smoothly increasing over time with only a few periods of flattening in times of economical reset.
2. Temperature does wildly fluctuate from year to year, but in average show a small increase.
3. The effect of temperature on CO2 levels is small and gives not more than +/- 1.5 of wild variation around a trend of +90 ppmv in the past 90 years.
Thus the net result is that both the trends of CO2 emissions and increase in the atmosphere are slightly quadratic curves, where temperature cuased variability and the influence of small ups and downs in human emissions are hardly visible. The net effect is a high linear correlation between both:
http://www.ferdinand-engelbeen.be/klimaat/klim_img/acc_co2_1960_cur.jpg
Ferdinand,
Again, wildly fluctuating emissions trend.. I’m not explaining the difference again, and I don’t know why you bring up temperature at all.
talldave2
Again, wildly fluctuating emissions trend.. I’m not explaining the difference again, and I don’t know why you bring up temperature at all.
Dave,
Again, human emissions are not wildly fluctuating, neither from year to year nor in trend.
The observed overall trend in emissions is a fourfold increase since 1960.
The observed overall trend in the atmosphere is a fourfold increase since 1960.
The net difference, that is sink rate, is a fourfold increase since 1960.
There are (mostly economical) periods where emissions were flat or even megative during several years and years with more growth. That is not visible in the growth rates of CO2 in the atmosphere, as the variability in emissions is smoothed in the atmosphere, because the sinks react on the total extra CO2, not the emissions of one year.
In the current situation, a change of 10% in yearly emissions gives a less than 1% change in yearly sink rate. That is not detectable in the Mauna Loa data and widely within the huge year by year variability in CO2 rate of change caused by temperature variability…
talldave2,
To make it more clear:
http://www.ferdinand-engelbeen.be/klimaat/klim_img/dco2_em2.jpg
Human emissions are increasing per year, with periods of a few years of small increase and flat or even slightly less increase in emissions.
All the year to year variability and almost all variable trends is in the sinks, which are caused by temperature. That levels off within 1-5 years to near zero around the trend. The variability is maximum +/- 1.5 ppmv around a trend of 90 ppmv since 1959.
2015 and 2016 were El Niño years which give a false impression of an increased trend of CO2 in the atmosphere, while emissions are flat. Remove these two years and you have a flat trend with increasing emissions, just the opposite. That simply is endpoint bias…
Within a few years the increasing trend in the atmosphere will go down if the emissions remain flat.
If this is the trend moving forward, it removes the pressing need to drastically reduce CO2 usage. If this becomes a long term trend, activists will have to invent another looming tragedy to justify their existence.
Regardless, I’m not convinced CO2 has any appreciable impact on temperatures, but it’s certainly had an impact on plant growth. This is a good thing and something we should hope continues.
Joz Jonlin – There is no pressing need to drastically reduce CO2 usage. Now from the rest of your comment, it is clear that you meant to say that there is no support for the argument that there is a pressing need to drastically reduce CO2 usage. But others will continue to believe that your actual words are correct. What annoys me is that once a cause-and-effect idea has been planted in the population’s minds, even when the cause is removed the effect remains – and the planters know this. In this case, the argument has been that CO2 causes dangerous warming so we must cut emissions of CO2. But even when it is shown that CO2 does not cause dangerous warming, the public will continue to think that we have to cut CO2 emissions. It is going to be a long hard road back from the brink.
It’s the same as the false scare-mongering about overpopulation. It’s beginning to take care of itself.
If the globe is starting to cool while human emissions increase, the atmospheric concentration might remain constant. If emissions stabilise and the temperature increases, the concentration will continue to increase.
The current stability in AG emissions is not the business-as-usual scenario we have been told to avoid. The Ehrlichian neo-Malthusians are going to have difficulty with this one.
Crispin,
You need a lot of cooling, every year again, to compensate for human emissions…
At 2 ppmv/year (xurrent emissions – sinks), you need a drop in temperature of ~0.125ºC/year or ~1.25ºC/decade or ~12.5ºC/century…
Is there a refrigeration mechanic in the house. The Earths atmosphere is 5140 trillion tonnes and I want to drop it 0.125 degree C per year give me the power required to do it that I would need per second. That is and interesting calculation.
I am running the calcs to see the best way to get it out to space but I rarely play with Cooling in Air.
LdB,
You need even much more cooling (by changing the radiation balance), as most heat change (~90%) is in the ocean surface layer (average 200 m thick) and only a few % is in the heat content of the atmosphere, the rest in land and ice. See Fig. 3 in:
http://junksciencearchive.com/Greenhouse/grlheat05.pdf
yeah I am wondering how many say albatross airplanes trailing something like a large reflective foil it would take to basically deny the Earth that much energy. Would be an interesting calc.
…and yet the pCO2 MLO observational record keeps steadily moving upward.
hmmmmmm…. maybe more related to a post-LIA thaw and biogeological cycling increases???
While the oceans are likely net carbon sinks, still Henry’s Law can’t be avoided in a kinetics effect of sink uptake.
Volcanos ignore Henry’s law royally. Henry foresaw it wisely in the precise preconditions of his theory.
The US emissions have been dropping since the turn of the century, and are now back in the same range as the 1970’s. EU’s emissions have been downtrending since the 1970’s. Russia flat since the 1990’s. ONLY China has been increasing.
The only country that matters, even globally, is China.
We outsmarted the Chinese by giving them all our nasty industry! That’ll fix ’em! I wonder if they’ll send us care packages.
It would be nice to see a list or table showing why “US emissions have been dropping.”
Some processes are more efficient, some have been exported.
Autos have become better with higher mpg, but there are more of them.
Coal was used for home heating prior to the 1950s, now much gas.
We have an electric air-sourced heat pump; power is from hydro.
Some group must have done such a list. Anyone have a reference?
John,
Lots of information from EIA:
https://www.eia.gov/environment/emissions/carbon/
For 2016 and downloads for previous years
We can, and should do better. The biosphere needs more CO2, not less.
Yes we can!
La Niña is currently developing.
http://www.cpc.noaa.gov/products/analysis_monitoring/enso_update/heat-last-year.gif
Boy, it will be such delight when in 2 or 3 years we have 7 years flat or negative trend in human emissions while the overall CO2 concentration keeps going up. What a scramble that would be to “adjust” the human emissions data. I cannot wait for the spectacle…
It is funny that the scenario where scientists admitting to being wrong is not in the picture.
Ian,
Even if the emissions get completely flat over a century, CO2 will go up in the atmosphere until the sinks equal the emissions. That will be at an about 2.15 ppmv/year extra sink or 2.15/0.02 = ~110 ppmv extra in the atmosphere compared to today or about 520 ppmv in the atmosphere…
I agree with these estimates.
The weird thing is that climate scientists just will not do the proper modelling to get to this reasonably accurate track. They are pushing the zero emissions track when that is not required at all to stabilize CO2. I think it says something about what their real purpose is.
Yes, 520 ppmv would be wonderful.
Rainer:
Yes, 520 ppmv would be wonderful.
1,000 ppmv even better…
Ferdinand, what percentage of the sinks is vegetation?
David A:
Ferdinand, what percentage of the sinks is vegetation?
About 50:50 (deep) oceans and vegetation, based on oxygen use:
http://www.ferdinand-engelbeen.be/klimaat/klim_img/bolingraph.gif
Global emissions have been outsourced to China and no accounting of this fact reflects lower CO2 growth back to Europe and the USA. Europe has also utilized Russian gas to lower its emissions and the USA has also had a large increase in nat gas when shuttering its coal fired electrification. All this ‘accounting’ is bit of mugs game, although China is left with the worst actual air pollution.
Additionally, if a significant La Nina builds and the Oceans cool a bit, then that will reflect on lower CO2 emissions as cooler ocean waters absorb more atmospheric CO2. If we go into a secular cooling phase for multiple natural variation reasons over multiple years, then that will also tend to put a more serious dent in emissions. That’s when the green club will take credit for all the renewables finally making a difference and the proof? Lower growth to atmospheric CO2 levels. It will be a war to the end on the ‘carbon’ debate.
Looks like the funeral of Paris accord.
Looks like the Paris accord is doing exaxtly what it set out to do
Wow, it must be magic to have plateaued even before the agreement.
Nothing to do with the stalling production of course.
bensquared,
“exactly what it set out to do”
Which was to give the illusion of doing something (meaningless in reality of even the IPCC exaggerated methods) in order to throttle Western-style capitalism and transfer wealth to buy participation (bribes to 3rd world).
Yeah, the Paris Accord was the kind of satisfying #2 success that is best flushed down the loo and not allowed to linger.
Pfffft. Like any of the countries that signed have actually done anything they said they would since they signed it. Nice try.
BB, how so, when nobody is following the Paris accords?
Australia is leading the way on the Paris agreement we have invented all sorts of ways to do creative accounting. We have “roll over credits” and “land use change credits” we are a big country there are no limits to where you hide those pesky CO2 molecules.
Nobody implemented these socalled ‘intentions’ from Paris.
“Looks like the Paris accord is doing exaxtly what it set out to do”
I agree, it was only ever a “feel-good” greenie wankfest.
I’m sure you are enjoying it.
And really , only a 2 year old would call themselves benben. !!
We are piling nonsense on top of nonsense. These CO2 emissions numbers are estimates, at best. The whole brouhaha is a political hot potato and my confidence in the objectivity, accuracy and integrity of the reported numbers is pretty close to the square root of nothing at all.
Yikes, if you think the temperature record is subject to manipulation for political goals… the CO2 emissions numbers are hugely more vulnerable.
I would take them with an astronomically sized pinch of salt.
My thoughts exactly
In principle the emissions should be reasonable exact, as these are based on fuel sales, that means taxes… In reality more underestimated than overestimated due to the human nature to avoid taxes… Or for political reasons (China…).
Thus anyway, human emissions by far exceed the increase in the atmosphere in every year since Mauna Loa started, Thus the mass balance, supported by every other observation, points to human emissions as cause of the atmospheric increase…
Yes. It is dung in the air. Be happy. Add some more!
So F.E.
“Thus anyway, human emissions by far exceed the increase in the atmosphere in every year since Mauna Loa started, Thus the mass balance, supported by every other observation, points to human emissions as cause of the atmospheric increase…”
You would contend that without human CO2 from the last 100 years world CO2 levels would be 160ppmv and dropping?
Are emissions estimates based on sales of fuel, or on the production thereof? The latter seems to make more sense.
george lanham,
Without human emissions, the CO2 levels would drop towards the temperature controlled dynamic equilibrium between ocean surface and atmosphere. For the current average ocean temperature, that is about 290 ppmv.
The speed of removal of any CO@ above that equilibrium level has an e-fold decay rate of around 51 years or a half life time of ~35 years, surprisingly linear over the past 60 years. Not fast enough to remove all current emissions in the same year as emitted…
Pop Piasa,
Would not give much difference, as what is produced is mostly sold and used within a short time. Sales and use are shorter in time lag than production and use.
Nobody, really nobody, can calculate the exact co2 emissions from humans. And then, who cares. its still 0,04%. Rounded off its zero. Has no influence compared to h2o. The atmosphere only delays heat transfer to to universe.
More co2 leads to more food for nature.. more oxygen and more food. Great, bring it on.
The CO2-induced “greenhouse effect” in the wild does not match its characterization in isolation. The profits of catastrophic anthropogenic global warming will need to add progressive (i.e. monotonic) fudge factors to keep pace with Nature’s underwhelming conformance with their deeply held hypothesis… models’ shortcomings.
Radiosondes on weather balloons (since 1958) and satellites (since 1979) do not support CO2 “control knob” theory. Even computer temperature reanalyses belie CAGW.
I like someone’s introduction of the term “wiggle watching,” referring to people slavishly regurgitating their observations of short-term changes in whatever climate metric they are following. I suggest we give it another 5 years-plus to look at 21st Century trends.
Another reason to thank the Lord that Trump won and not Hillary.
The CAGW’ers have been desperately trying to prop-up a global warming trend to match their theory (CO2 is the climate control knob) for a decade now. To wit, Karl, et al, 2015, Gavin S GISS adjustments, BoM station data diddling, NOAA and NASA model “infilling” missing data with synthetic data in large unmeasured areas, etc. The CAGW’ers pretty much can tread water as long as the real GMST is flat or near flat. But a declining GMST just can’t be adjusted away. By 2020 that should be obvious.
SO, how much yearly increase were the doomsday folks counting on? Obviously they need a doubling of CO2 in the not real distant future, according to their logic.
I’m not certain how much, but the effect of the electrification of the transportation sector (EVs to you) should have a gradual but noticeable effect, even if the cars are fueled from the grid, which was 67% fossil fuel based in 2015 in the U.S. , but since then nat gas has replaced a fair amount of coal, so CO2 emissions have been reduced because of that, which has generally been the reason U.S. CO2 emissions have dropped over the past decade.
OF COURSE, one MIGHT expect, in a logical world, that the doomsday folks would be overjoyed
at this stable emission situation. But NOOOOOO……. that would mean they no longer can be saviors of our planet. Bummer!!!! Eliminates most of the reason for their existence.
Warmists to connect the dots between this and the “Pause” in 3…..2…..1….
Well, It looks like we can thank China for their pause….Perhaps Chow Mein and Mandarin Duck are in order tonight
Can you actually believe any figures produced by China or Russia?
Or the EU.
I’m glad somebody thought to add uncertainty date – but does anyone know how it was determined? I question the accuracy of the data. Do we really know China’s emissions to within 4 Gtons or so per year? That’s very hard to believe.
Why can’t we declare victory, and move on to the next manufactured crisis, so our energy prices can come down?
Co2 levels stall (not human emissions) we cannot measure human emissions, and never have measured human emissions.
ocean sea level rise stalls.
ice recovery in last 3 years.
Sun going to sleep.
Doesn’t take a genius
Also, solar forcing on hurricanes and cyclones, Willie Soon also covered this.
https://youtu.be/Fm6Y5mETVk4
https://link.springer.com/article/10.1134/S0016793217050115
I wonder how much of the SLR stall is due to the recent El Nino taking a lot of heat from the oceans and dumping it into the atmosphere, and from there, into space.
Mark – Helsinki:
we cannot measure human emissions, and never have measured human emissions.
I don’t think the customs will agree in that: a large part of the state’s income is from fossil fuel sales and that is the base for the emissions inventories…
Sales are not emissions though, and globally… lol
Mark Helsinki.
To cherry pick Katrina in one of the most active years does not make their evidence compelling. What they need to provide is a complete overlap of data for every year. This should not be difficult.
However it is very interesting, thanks for the link
Regards
seems to me global CO2 rose by about 2 ppm compared to a year ago?
so no stall, my bad, as is, no matter what we do with emissions, thanks for info.
Though I stand by the fact no one “measures” anything like close to even a 10th of human emissions.
co2 emissions numbers come from
models, not direct measurements. since people
charge for, and pay for, fuel for driving, heating,
etc, and power plants etc have
to report to
the govt, it’s possible to get a pretty good handle on
co2 emissions by modeling it.
And because they are models most countries lie. It is going to be the new political game of much carbon emissions can you lie about and actually get away with. I think Australia is doing pretty well but I suspect a few others may be better than us.
How about the 95% of CO2 not produced by human activity? Any changes there?
for the last 5 years it was about 10 ppm, i.e. also 2 ppm per year.
Business as usual – I am happy to report!
If human CO2 emissions were flat, does that mean this year’s increase in CO2 was natural?
El Nino caused a spike in geometic atmospheric CO2 growth, something human emissions could never do.
NOAA act shocked, lol, but you would be shocked only if you believed the oceans to not largely dictate CO2 levels
and good point, but truth is they have little real idea what is actually emitted.
I am certain China’s emissions are far more than claimed, only a 2 years ago? they claimed they found another 14% of emissions from China that was missing. 😀
India has NO CLUE how much CO2 is emitted and neither does China, as home coal use is used by millions, all they have is sales data.
No, it does not mean that. Let’s say you are adding money to your bank account. Every year you add more money than the year before until 2011 when you only add as much as in 2010. Does that mean your account stays flat? Not at all, what it means is that your account goes up no faster in 2011 than it did in 2010.
Now change you for “mankind” bank account for “atmosphere” and money for “CO2.” That’s what the chart means.
but you’ll find little in the way of sales data for a lot of non fossil fuels use.
India and China wood burning, no data, All of Africa wood dung and other CO2 emitting fuel sources.
Global emissions totals are a joke figure
Tom in Indy
(is that in India or Indiana?}
The first smoke from a kettle with water that you put to boil, is the CO2 escaping,
hence a natural reason for the increase in CO2 is the first most logical reason.
However, I think it is all politics here. It seems that powerful governments in US and Europe have made a shift from blaming CO2 to blaming CH4. I am not sure why: perhaps it is the science of farming where they add CO2 in the green houses to get bigger fruit and vegetables?
we need more CO2, not less, as any sane person knows.
Anyway, I have never seen any report showing us the balance sheet of how much cooling and warming a certain GH causes? Have you? Anyone?
chadb — no, you would have to also assume you are removing money at a faster rate, making withdrawals proportional to the account’s size… if your contributions go from “accelerating” to “flat” the overall balance in your account should actually be dropping, not continuing to accelerate upward as though your contributions were also still accelerating.
talldave2,
The withdrawal indeed is proportional to the total height of your account, but was only half your deposit per year. If that gets flat, still your account is going up and thus the withdrawal increases, thus the increase gets smaller, but still is an increase over very long time to where your yearly deposit and withdrawal are equal.
For CO2 in the atmosphere at the current flat emissions (~4.5 ppmv/year), you need ~520 ppmv in the atmosphere to break even.
The withdrawal indeed is proportional to the total height of your account, but was only half your deposit per year.
Again… no one knows that, and even if it were true it can’t explain why flat and accelerating contributions produce exactly the same trend in your account, as though they were only tenuously related. My advice to the bookkeeper is to get a lawyer, as IRS may be looking askance.
This is nothing more than an attempt to peg the coming El Nina to a reduction/leveling of fossil fuel usage.
Ooops…. that would be La Nina. Latent misogyny?
+100 😀
Whatever happened to the dominant “greenhouse gas”, H2O?
its increasing too, but only
after the temperature first
increases. about 7% per 1 C warming.
Still the deadliest chemical on Earth. Just this year it was involved in several major attacks on the United States costing tens of billions of dollars and countless lives.
The UN is reportedly considering a ban.
I really do wish you US people would do dates the right way round, but it’ll be easy for you to look through NASA’s OCO gallery. As in DD/MM/YY
Maybe it helps with keeping track of the 23 ninety fifths of the acre-feet?
No matter, diversity is good, I’ll be the first to say as much 😀
Hopefully here:
https://oco.jpl.nasa.gov/galleries/gallerydataproducts/#gallery
But if you do, you’ll see that CO2 as seen by OCO skyrockets in the Northern Hemisphere in the months March, April and May
Surely the strongest emissions will be through NH winter (Dec, Jan & Feb) because of big energy demands for heating, lighting and (probably) extra motoring.
The CO2 is coming from farmer’s dirt, especially in Mar, Apr & May is when they’re doing their cultivations and spreading nitrogen fertiliser around.
From June on, OCO sees CO2 drop as the crops grow and soak up CO2.
OCO is graphically showing depicting the NH ‘farmer’s calendar’
The CO2 in the sky is NOT, in any great amount, coming from the burning of coal, gas and oil.
Makes sense now why NASA are not saying much, and when they do they go into raptures of muddlement about drought, high temps and bacterial decomposition.
If your houseplant on the kitchen windowsill is OK with 200ppm (below which it dies) of CO2 and one cup of water per week – will giving it 2 cups of water per week make it grow faster?
(That’s before the CO2 in most folk’s kitchens and homes will be well into 4 figures normally.)
Does bringing a plant indoors create a triffid?
Water soluble nitrogen is causing the ‘global greening, just ask any farmer
The CO2 is coming from the burning of dirt and now OCO has been flying for a while, it shows that with crystal clarity.
btw, where the fook does that 50% number come from?
In English please.
Peta of N
Folks have ignored the OCO2 images because they confound the current entrenched carbon cycle theory. Similar to the AGW crowd, skeptics also have entrenched views that are hard to shift.
I remain the only person to provide comments and explanation on the OCO 2 images.
blozonehole.com
CO2 emissions are, I believe, Self Reported by each of the nations.
There has been considerable concern expressed about the accuracy of the whole range of emissions reported including CO2.
Personally I place little faith in these figures. The pause in global temperature ‘rise’ is now around 20 years and the level of concern over the accuracy of those figures and the level of manipulation which has been applied to temperature records is growing.
Perhaps claiming that man-made CO2 emissions have stopped rising is a convenient way of escaping the political and scientific backlash that is coming when man-made global warming is finally understood as the political exercise it always was.
Pause?
Where have you been the last three years?
/Jan
Read upon the word “transient” , Jan
20yr pause?
the surface has warmed
0.34 C in 20 years. (noaa data)
In your dreams …..
You mean homogenised data and continuous adjustments to lower earlier, factually recorded temperatures.
Australian records, an integral part of the global temperature records, have been exposed as not fit for purpose, in breach of WMO recording requirements, overvaluing maxima and under-recording minima. Low temps have been artificially capped at -10 deg C when actual temps have been far lower whilst maxima have been inflated by up to 2 deg C.
In the UK urban temps have regularly been 3 – 4 deg C higher than adjacent rural temps But the rural temps are then homogenised (adjusted) up towards the urban ones using a UHI adjustment of just 1.25 deg C meaning a gross overstatement of actual temperature.
The UK met office claimed the recent late August bank holiday as a new temperature record – but then had to admit that to achieve this they had, on the day they claimed this new record, decided (without any explanation) to reduce the previous record of decades earlier to enable this to become a ‘new’ temperature record.
NOAA “data” are packs of lies.
a lot of anecdotes, not
any science.
ps – adjustments reduce the
long-term warming trend. if they
increased it, i bet you’d
complain
about that too.
NOAA’s “data” are not science.
Once again Crackers, in your dreams , that is not what has been done
Adjustments have been made to the temperature records of the first half of the 20th century – always to Reduce them which makes warming appear bigger .
That has been done several times in the last 25 years and particularly as the ‘pause’ lengthened – any guesses why?
Each time NOAA scientists have explained their previous adjustments to reduce earlier temperatures need revising downwards to make them colder which of course made ‘warming’ seem greater. But of course each it was ‘admitted’ they had got it wrong before it was ‘but trust us, this time we do know.
Manipulation of temperature records accounts for about 1 deg C or around two thirds (66%+) of the claimed ‘warming’.
http://www.madsci.org/posts/archives/2003-06/1055532737.Bc.r.html
Whenever the subject of the increased CO2 as C13 is brought up – because this is what this article is about, emissions from fossil fuels – it always has comments that bring up “sinks” and the discrimination of C13 by it increasing in the environment. Globally there are more C3 plants than C4 plants and C3 plants discrimination of C13 isotopes…which is in reality a very small percentage of discrimination when more CO2 isotopes of less than C13 exist, plants will more readily utilize those and still take C13 in their photosynthesis that exists as a small fraction in our atmosphere. The majority of C4 plants are the plants that most fauna consume as food like corn, fruits and vegetables grown in warmer climates that more readily removes C13 in the warmer months. While those lesser C isotopes of Carbon Dioxide are removed by all flora more readily. That while C13 has a longer half life it increases because there are less C4 plants that would sink it. A warmer global environment would therefore be preferable for the health of the environment, by extending the growing season of C4 plants. Because people are not going to reduce in population and the food that all fauna requires needs to keep increasing. Unless some event causes a mass extinction.
Anthony-just a suggestion. I think a banner at the top of the page proclaiming the running time the world has (enjoyed?) with zero warming would be a good idea. Even the regulars on this site keep falling into the trap of accepting that we are warming when we are not.
If the CO2 GHG effect is real it seems to have run its course and no longer poses any threat. If it ever did.
And it didn’t!
Per capita emissions is a very odd metric, as it is only total emissions that is supposed to drive AGW. India’s population growth outstripping electrical generation and steel production will make per capita emissions go down, but that is NOT a good thing.
I hadn’t thought about that but I guess you could take a couple of million refuges and lower your carbon emissions per capita. Maybe that is the behind the metric selection 🙂
“Per capita emissions is a very odd metric”
What else? Should Danes not have to worry about emissions because China emits more?
Danes should definitely not worry about emissions. They contribute practically nothing anyway, but more importantly, more CO2 in the air is a good thing, not a cause for worry.
Twice current levels would be better, and triple best of all. More than 1200 ppm however won’t do much more to help green the planet.
Nick, you got it. Danes are irrelevant to global emissions compared to China. You can run the numbers. But, because of their dedication to your foolishness, Danes do have the highest electricity rates in Europe despite their Scandanavian interconnectors to flexed hydro to bail out their intermittency.
Nick,
You ask, “Should Danes not have to worry about emissions because China emits more?”
Short answer: No.
Long answer: see Rudd’s immediately above.
“Danes are irrelevant to global emissions compared to China.”
So no-one except China needs to do anything about emissions? Doesn’t sound like a way to get anything done. Now, I realise you don’t want anything done, but metrics like per capita are needed by those who do.
Nick,
Quite right. China is the only country that matters at the moment, since everywhere else CO2 emissions are static or falling.
But China and in future India are doing the world a favor by increasing CO2. What they do need to work on however is reducing real pollution, as the West has done.
CO2 however is not pollution but an essential trace gas vital to life on earth. Three times as much as now in our air would be ideal.
You could have decided per square metre of land saying each same area of the earth should emit at same level. The countries after all control the rules for that square metre.
The choice of Metric was based around humans because the politics behind it that the 3rd world countries had to be not impacted .. they have lots of people so it’s obvious which metric you choose.
Whether it was the right metric is another question altogether but it was the one that was chosen because it had a chance of flying because it was perceived as the most “human fair”.
I should say if you really want impact same as you do in business or warfare you go after the areas with the highest impact. You don’t worry about fairness and equality, you worry about outcomes. You also don’t take options like engineering to actively trying to remove the source of the problem.
My objection to Emission Control is it is half arsed it’s like the war on drugs it has zero chance of working because it doesn’t address the real problems and provides no real solution. Prohibition of anything has never worked not once on anything from Alcohol, Drugs, Nuclear Weapons or Chemical Weapons but somehow the righteous left has convinced itself that it will work on CO2.
I don’t worry about it because it’s doomed and all the money and political will in the world won’t change that.
First of all per captia is 1 a guess, and 2 more averaging to destroy accuracy.
Denmark has no idea how much it emits year on year, sales data is a bad proxy for measurements, averages are a bad replacement for accuracy
Extrapolate this uncertainty globally and consider India China African continent, South America, and you have NO idea what human emissions culmulative amount is.
Fact
ristvan
I suggest the reason why per capita CO2 missions are used in climate debates in certain countries is political
First line of argument is used by the Greens who realize there is not much of a basis to criticize high carbon fuel producing nations like Australia (with abundant coal and natural gas ) if our contributions to world emissions (1.3%) is used.
Hence in this country the Green- Left regularly refer to our per capita emissions which are high, as being a measure of our moral turpitude and global irresponsibility as they like to call it.
Also conversely the 1.5 billion Chinese plus the 1.3 billion Indians can and do argue that as their per capita emissions are very low, they have a”right” to catch up to the Western nations in per capita terms which given their huge populations means big increases in emissions in absolute terms.
But you are right. If one accepts the CO2- Global warming link then- in line with the old 80/20 rule- the main nations which contribute to AGW are China, Russia, Japan, the EU, the USA and increasingly India- are all probably responsible for at least 75 % of global CO2 emissions (acknowledging the uncertainties of measurement)
The numerous remainder nations are all down individually in the 0 to 1to 1.5 % range in absolute terms.
Australia Carbon Emissions are going up nicely 550.4 million tonnes and that is with out creative accounting, it is a lot higher than that in reality. You can see why the government isn’t keen on setting a clean energy target. We have a cute “carry over” number and some good land use accounting, we just need to find a few more places to hide the increase. I suspect it’s probably cheaper to just go and buy a batch of carbon credits but it probably isn’t allowed under the rules.
There is no time soon that our upper house isn’t going to be controlled by minorities and it doesn’t matter which party is in power there is no chance they will get any big reforms thru the parliament. The more they try to squeeze the public the more we vote for minorities and the Carbon dream gets further away.
“Global GHG emissions continue to be dominated by fossil carbon dioxide (CO2) emissions, which however show a slowdown trend since 2012, and were stalled for the third year in a row in 2016.”
But wait, CO2 has been very steadily rising for five years…
https://www.esrl.noaa.gov/gmd/ccgg/trends/index.html
It’s almost like emissions are only loosely related to concentrations… isn’t this sort of an obvious problem for all sorts of existing emissions policy? Scenarios dating back at least as far as Hansen 1988 seem to assume this relationship is pretty strong.
I mean, come on, even the growth rate is higher! https://www.esrl.noaa.gov/gmd/ccgg/trends/gr.html
This makes no sense… we know the absorption is also increasing… this requires emissions to be not just increasing but actually accelerating… is it time to reconsider the notion that maybe CO2 levels are only very weakly coupled to emissions?
higher ocean temperatures
mean less co2 absorption by the
ocean.
el ninos mean less carbon uptake,
because they dry out the tropics
which means less photosynthesis.
and
Damnation! My nefarious plot to destroy the world is falling behind.
Oh well, I am going to the coast this weekend – that’ll get my emission count up for the week.
Better leave the engine running.
Actually
Me feeling guilty abt my big diesel truck is what started me investigating the CO2 story…
For those that believe in AGW, this study completely ignores the primary greenhouse gas which dominates the radiant greenhouse effect and the total concentration of greenhouse gases in the Earth’s atmosphere..Not including the primary greenhouse gas makes this study bogus.
Which gas would that be. According to you.
Water vapor
H2O
the amount of water vapor in the
atmosphere only increases if the
temperature of the
atmosphere first increases (like
from co2).
the change is about 7% more
w.v. per
1 c of warming.
I do have some measurements of rh from weather stations but i would have to see if i can balance to zero latitude.
You guys are just guessing. Measuring rh is like measuring global T of the oceans..which average is correct ….?
Sorry. H2O is the wrong answer.
Current ozone level is able to deflect ca. 25% of all that is being deflected off from earth.
Bad news for plants. No news for the temperature of the earth.
Jack.
You did not see my comments?
weeds are
also plants.
So?
Farmers kill weeds all the time. You don’t need to apply more herbicide to kill more weeds, nor make more passes rodding.
crackers.. are you saying you are a plant?
‘However, the data until 2012 shows a steady increase in global GHG emissions, with an overall increase of 91% from 1970 to 2012.’
That doesn’t sound right to me. From ~280 ppm to ~400 ppm is a 0.012% increase in total atmospheric concentration, not 91%. A 91% increase in a very small quantity is still a very small quantity.
It is only 43% increase in CO2 and still only .012% of the atmosphere which can not influence any temperature because CO2 ,s heating potential is logarithmic {that means that for every doubling of CO2 the heating potential halves } and water vapor is around 4% of the atmosphere and must totally dominate.
The heat supposedly trapped by adding .012% is less than the margin of error
Average water vapor in the atmosphere is 0.48%. Not 4%
Water vapor concentrates in the tropics over the oceans.
http://tropic.ssec.wisc.edu/real-time/mtpw2/product.php?color_type=tpw_nrl_colors&prod=global2×pan=24hrs&anim=html5
Actually, Henryp, the lower troposphere atmospheric water vapor range is from near zero (Antarctica) to about 4% on tropical islands. Declines with altitude lapse rate, but not per Clausius/Clapeyron because of convective processes (something AR4 WG1 black box 8.1 got completely wrong). The lower troposphere median is about 1.8% and the average is about 2%. Amounts to a little over 25mm of precipitable troposphere water, varying a bit year to year. A little google foo will help get your facts straight.
Ristvan
You say it is 2 %.
Your exact source is?
NASA AIRS satellite mission. And, I said about, cause varies year to year a bit as NASA tries to explain.
Now, do your own homework, which was the sole point of my original comment to you. Which from your rejoinder, you are apparently still incapable of doing. I aint gonna do it for you, cause unless you do it yourself you aint gonna learn nuttin.
Water vapor concentrates in the tropics.
http://tropic.ssec.wisc.edu/real-time/mtpw2/product.php?color_type=tpw_nrl_colors&prod=global2×pan=24hrs&anim=html5
Thanks Ristvan
With the rainfall we have had in New Zealand this year I thought we would have 4% water vapor .Thanks for the correction ,I will file that
I do have some measurements of rh from weather stations but i would have to see if i can balance to zero latitude.
You guys are just guessing. Measuring rh is like measuring global T of the oceans..which average is correct ….?
Henryp
Richard Lizdens quote of the century ” Believing that CO2 controls the earths temperature is like believing in magic’
Water at two percent of the atmosphere is fifty times more prevalent than CO2 and has to smother any warming caused by CO2
Do you ever experience frosts .With the urban heat effect the suns warmth is retained in the concrete and roads and frosts are not as severe or as many as in the country side .
Clear night the heat rises from the land and the temperature drops to below 5 degrees Celsius and we get a grass frost . We have exactly the same conditions during the day but cloud comes in before sunset .The clouds hold in the heat that is rising and the temperature stays above 5 degrees .Water vapor and the resultant clouds have a far greater effect on temperature than CO2
Wasn’t there a similar thread on this same report just two weeks ago?
The plants will not be happy with this reduction in their nutrition from CO2.
Stalled is unfortunate. Earth is impoverished for CO2. Optimum CO2 level is about 3X present.
If CO2 levels are indeed flattening out, someone should tell the new prime minister of New Zealand:
http://www.climatechangenews.com/2017/10/20/jacinda-ardern-commits-new-zealand-zero-carbon-2050/
Quote:
‘….New Zealand’s new prime minister Jacinda Ardern has committed the country to erasing its carbon footprint by the middle of the century.
The Labour leader, who brokered a coalition with the populist right New Zealand First party on Thursday, said on Friday that addressing climate change would be among her top priorities.
Ardern, who becomes the world’s youngest female leader, said: “I do anticipate that we will be a government, as I said during the campaign, that will be absolutely focused on the challenge of climate change.”…’.
Zero carbon emissions by 2050. Dreamers can dream foolish dreams….
They would have to stop farming.
CD in Wisconsin,
News gets around the world .Taxinda Adern is our new Prime Minister with the help of our MMP voting system ..During the campaign before the election she was going to tax everything but she pulled back as her support was softening in the polls so she then announced that a committee would examine the effects before the taxes were implemented ..She seems to be committed to taxing water that if not stored in dams runs out to sea and she wants to bring in an Emission Trading Scheme that will tax our farmers for methane emissions from farmed livestock .
I am not aware that any other country in the world taxes their farmers for livestock emissions .Ninety percent of our meat wool and dairy production is exported to the world .
Why would you do this to your export sector when New Zealand rely s exports and we have to compete with subsidized surplus production being dumped on the world market from Northern hemisphere nations
Hopefully her coalition partner Winston Peters (who was the son of a share milker in Northland ) might be able to talk a bit of sense into an empty head .
Didn’t NZ voters learn any lessons from electing major whack job David Lange at age 42?
Now you have an even loonier PM aged 37.
“gwan October 20, 2017 at 5:30 pm
Taxinda Adern is our new Prime Minister with the help of our MMP voting system ..During the campaign before the election she was going to tax everything…”
Everything *IS* taxed in NZ. Everything attracts a GST of 15% (Well ok, there are a few exempt items, like certain sanitary products).
I find it rather worrying for NZers that the thug Winston Peters held the balance of power. What are you guys thinking? I have seen this thug throw punches on Courtenay Place and falling, drunk, out of a taxi.
“CD in Wisconsin October 20, 2017 at 3:01 pm”
There was an article at the Sydney Morning Herald stating that many NZers in Aus are returning to NZ. Previously there was a net outflow from NZ to Aus of about 40,000 people per year. I think once this loon gets her policies in place we’ll see that outflow increase.
If I read the topmost graphic correctly, The sum of US, EU and Russian emissions ~= China emissions @ 35 Gt/Yr. Interesting.
The country data are on the left. Very approximately:
Russia: ~1+ Gton CO2 per year
EU: ~3
US: ~4
Total: ~8+
China: ~11-
If the numbers instead be closer to 2, 4 and 5 Gton each, then China’s output is about equal to the three others’ combined.
Look – either the Emperor is wearing clothes OR he is stark b*ll*ck naked. Can we just stop with the graphs about the thickness of the cloth and get back to the main point.
Is there such a thing as a GHG or not? Some will argue yes, some will argue no. This has been going on for long enough now. What we want is some proper brain power applied to devising experiments in lab or field and observations to get us further down the path of deciding this FUNDAMENTAL question. We see the arguments on both sides. It needs resolving otherwise everything else could be a complete waste of time, effort and money.
You have to start at the beginning if you want to sort this out. There appear to be perfectly valid arguments on both sides. Lets start ripping them to shreds and see what we find.
Yes, there is such a thing. H2O, CO2 and some other molecules do indeed slow IR photons on their way toward space through the air.
The issue is how much, given probably net negative feeback effects. The net GHG effect of increasing CO2 from three molecules per 10,000 dry air molecules to four over the past century or so is demonstrably negligible, at best.
Thinking of getting this plate for my Chevy P/U merely to make Liberal heads explode.
http://i66.tinypic.com/2vu0feq.png
Bottom line: slowing the rise of CO2 emitted has little effect on the rise of CO2. You need to stop it entirely. And that may not be enuf, at least in the short term (100-200 years).
Why on earth would you want to stop the rise in CO2, which has contributed so much to keeping the world fed, clothed and sheltered since the end of WWII?
Why are you so stupid?
Reallyskepical please stop breathing and adding more CO2 to the environment than you inhaled. For that matter I hope you are not breeding and having offspring either to “save the planet” by your ideologies.
Why are you so stupid and ignorant?
I asked you a question based upon the scientific fact that Earth has greened thanks to more plant food in the air. This beneficial development has led to the production of more food and fiber.
What do you have against people eating and breathing?
Are Nobel Prize winning physicist Ivar Giaever, his colleagues Freeman Dyson, heir to Einstein, and Will Happer also stupid? To name but three who have spoken out in favor of CO2 for its greening of our planet.
I see that the troll is now complaining that he has been outed as being a troll,since he never disputes ANY science papers posted.
Gabro,
“I grew up and as an adult helped grow crops of soft white winter wheat in Palouse series soils, while also pursuing an academic career. The ag experiment station of which I speak lies NNE of Pendleton, OR, but the most important work on new strains has been done at WSU, also on Palouse series soils, but in far southeastern WA state.”
I have been at the Prosser station a number of times,been on field trips in the Palouse hills as part of my college education back in the early 1980’s. Roberts doesn’t seem to realize he is making a fool of himself with his stupid comments,which never addresses the science of the links posted. That is why I now call him a troll,since he DEFLECTS over and over,avoiding a real debate.
He brings up the following,
Confounding (which many science papers already addresses,if the fool bother to read them)
Blog (which are run by real scientists who provide the original source to the research they comment on,which Roberts never noticed)
Troll (He is being called a troll,since avoids a real debate with his quick deflecting,disputes a blog,which are run by scientists)
The troll doesn’t know how to make a cogent comment.
Sunsettommy October 20, 2017 at 8:44 pm
Good on you for the Prosser station.
A now lamentably dead buddy of mine from a family friendship going back to the 19th century met his wife at WSU thanks to the Prosser station, from which town she originated.
Robert is not only clueless, but persistently so, which does indeed render him a troll, to his undying shame.
Only a CACA acolyte could possibly question the fertilizing effect of CO2 on most major crop plants and all trees. Just shows how antiscientific is the whole CACA movement.
Hey totallygullible, have YOU stop all use of anything that produces CO2?
Or are you just mouthing hypocritical platitudes again.
To include exhaling?
and Why are you so stupid?
Really,
Seriously, are you so ignorant that you don’t know that more CO2 has been hugely beneficial, and that more would better?
Poor totallygullible..
the AGW apparatchik KNOWS that its WHOLE EXISTENCE relies totally on CO2.
How that must hurt ! 🙂
afonzarelli October 21, 2017 at 4:42 pm
Actually, it might have been interesting to see what Patrick Moore had to say in defense of photosynthesis d@nier Robert, who also libels David Middleton as in the pay of Big Oil.
Talldave2,
The rise in CO2 during the last glacial termination and onset of the Holocene surely contributed to the rise of agriculture. The first crop plants domesticated were all C3. Increase in trees and shrubs, all C3 plants, also helped develop early horticulture and settled lifestyles.
Among C3 crops are most small-seeded cereals such as rice (Oryza sativa), wheat (Triticum spp.), barley (Hordeum vulgare), rye (Secale cereale) and oat (Avena sativa). Among legumes soybean (Gycine max) and peanut (Arachis hypogaea) are C3. So are sugar beet (Beta vulgaris), spinach (Spinacea oleracea) potato (Solanum tuberosum). Fiber source cotton (Gossypium spp.) and popular drug tobacco (Nicotiana tabacum) are also C3 plants.
Cultivation was well along in the world before Mexicans domesticated the C4 plant corn (Zea mays) in a great feat of genetic engineering. Sugar cane, millet and sorghum are C4 too.
Sorry I put the above in the wrong place, given the long string in which Talldave2 posted below at talldave2 October 21, 2017 at 9:34 pm.
I should add that some now think that rice was the first domesticated grain. This is plausible, since, as a wetland plant, it might have benefited from locally enriched CO2. Microbes in swamps and bogs break methane and oxygen down into CO2 and water.
That is interesting!
Gabro,
I agree it’s a very appealing theory on a number of grounds… I hope we get to see a lot more research on it in the near future. There’s very little about climate theories than can be directly tested, but we can put plants in tents all we like 🙂
The strong version of this theory suggests that humans could not have developed agriculture or civilization without that rise in CO2… and that falling CO2 in the next Ice Age might prevent such agriculture even in areas that are still warm enough for it. Chilling!
Gabro — specifically, it would be interesting to see more results on CO2 deprivation… these are presumably somewhat more difficult to arrange than CO2 enrichment, but the implications are fascinating. I know some results exist (or at least I was able to find some a couple years ago) but more replication might flesh this theory out a bit.
Actually.. You can take any study that uses current levels of Carbon Dioxide and the increased levels that produce larger healthier flora as what carbon dioxide deprivation looks like.
Suggest you educate yourself:
http://www.omafra.gov.on.ca/english/crops/facts/00-077.htm
For C3 crop plants, each 10 ppm increase in CO2 boosts growth by about one percent. For trees and shrubs, the effect is even greater.
Thus the 120 ppm rise in plant food in the air since AD 1850 accounts for an ~12% increase in crop plant growth and even more for trees.
Why don’t you want people to eat, be clothed and sheltered? I guess it’s true that anti-human Green Meanies want population to revert to mid-19th century levels, or lower.
Increased CO2 also accelerates the growth of weeds. More weeds mean less crop yield.
As I’ve noted previously, farmers are already killing weeds. They need not use more herbicide to kill more weeds, nor make more passes with their rod weeders.
More CO2 is only better for agriculture and forestry. It has no downsides.
Crop yields have increased significantly around the world.
What farmer doesn’t know ow to control weeds…. seriously.
>>
Robert Kernodle
October 20, 2017 at 6:33 pm
Increased CO2 also accelerates the growth of weeds. More weeds mean less crop yield.
<<
Yeah, let’s get rid of CO2 because there are too many weeds on the planet. And just when I thought I’ve heard every argument against CO2.
Jim
Gabro and AndyG55, both of you know full well that correlation is not causation. If either of you ascribe increased yields to an increased concentration of atmospheric CO2, you’ve ignore all the other factors that come into play when dealing with crop yield such as improved irrigation, genetic hybridization, chemical fertilization, etc.
Masterson, I’m not arguing against CO2, I’m arguing that confusing correlation with causation is a grave error.
Robert Kernodle October 20, 2017 at 6:58 pm
Are you seriously this uneducated?
Increases in crop yield have come from many causes, but the portion from CO2 is not a matter of speculation, but measurement. In lab and field trial after trial, the effect of more CO2 on C3 plants has been ascertained in great detail.
Photosynthesis is a fact, and the effect of more CO2 on the process in crops and trees has been studied up the ying yang.
Robert Kernodle October 20, 2017 at 7:01 pm
You completely fail to grasp reality.
It’s not that there is a correlation between more CO2 and more vegetation. It is the fact that the effect of more CO2 on plant growth can be directly measured for each species of plant.
Gabro says: “Increases in crop yield have come from many causes.”
…
Thank you.
…
Now, please provide all of us the stastical ANOVA study that excludes all the other factors (irrigation, fertilizer, farming techniques, genetics) that show that the rise in yields is due exclusively to CO2
…
PS, ANOVA= “Analysis of variance”
stastical=statistical
Robert,
The causation is not in doubt. We know precisely how much plant growth is enhanced by CO2 from studies which hold all other factors equal.
Please see my link on the ideal level of CO2 for real greenhouses.
How could you possibly presume to comment here without knowing that scientists have precisely and accurately measured the amount of increased plant growth from increasing increments of CO2?
What part of photosynthesis don’t you understand?
>>
. . . that show that the rise in yields is due exclusively to CO2
<<
Why do commercial green houses raise their CO2 levels to 1000 ppm? For the green house effect?
Jim
Gabro, crop yields in Death Valley have not increased. What part of irrigation don’t you understand?
Masterson, the bulk of human foodstuffs are not grown in “commercial greenhouses.”
Robert,
Can you really possibly be this dense, or are you just acting to waste time?
Of the many causes of crop yield increases since WWII, we know precisely what portion is attributable to CO2. Why is this fact so hard for you to grasp?
This fact has been known ever since it was discovered that photosynthesis uses a photon of sunlight to break apart a water molecule taken up by the roots of a plant from the ground, the H atoms of which then attach in the dark reactions to a CO2 molecule to make sugar.
More CO2 also has the advantage of allowing plants to make more sugar with less water, since their leaf stomata need stay open for less time, reducing transpiration.
http://www.sciencedirect.com/science/article/pii/0378377483900756
This is hardly ground-breaking science. Dunno how you missed it.
Why is it so tough for you to realize that of the various causes for higher crop and forest production since 1945, the share thanks to more CO2 is well known?
“Of the many causes of crop yield increases since WWII, we know precisely what portion is attributable to CO2”
…
Nope….per the link you provided…..in the Abstract the first two words are “Probable effects”
…
Do you, or do you not understand the definition of “probable”
…
LOL!!!!
Robert,
Causation, not just correlation, based upon actual science:
http://co2science.org/education/experiments/center_exp/experiment3/figures/final_fig1.jpg
Gabro, please tell me how you differentiate the effects on crop yields between the introduction of “Roundup resilient” crops (Monsanto) versus the increase in atmospheric CO2…….
..
It is 20/80% or is it 30/70% or maybe 40/60%
Robert Kernodle October 20, 2017 at 7:33 pm
The probable effects were based upon estimates of CO2 in future from 1983. Please read the article. The effects of more CO2 were known even then.
The issue was the amount of future CO2, not the effects of more CO2 on plants.
You are pathetic.
Robert Kernodle October 20, 2017 at 7:36 pm
You are willfully obtuse.
Again and again I explain to you that the specific effects of more CO2 are known for each species of commercial plant.
The overall increase in production of course stems from fertilizer use, irrigation and other causes, but that doesn’t change the fact that agronomists know precisely how much is attributable to more CO2.
Why is this simply fact so hard for you to grasp?
Gabro, there is no disputing the results of a study where ONE variable is shown to affect plant growth. The problem you have is to show that all the OTHER variables involved in crop yield have remained constant while CO2 levels have increased.
…
Please study this: “Confounding Factors/Variables” : https://en.wikipedia.org/wiki/Confounding
” the fact that agronomists know precisely how much is attributable to more CO2.”
..
Citation/link please.
Robert,
Scientists have studied the effect of more CO2 on all the major crops in controlled experiments. Why is this so hard for you to understand.
For instance, wheat grows optimally at just under 1000 ppm, while some other crops and especially trees do better at up to 1200 ppm. These parameters are known in great detail, as to growth of roots, stalks and leaves.
I was a soft white winter wheat farmer on the Columbia Plateau, close to the experiment station which produced the wonder strains which have fed the world, so this 2015 result is most interesting to me.
https://www.ncbi.nlm.nih.gov/pubmed/26253981
The optimal atmospheric CO2 concentration for the growth of winter wheat (Triticum aestivum).
Abstract
This study examined the optimal atmospheric CO2 concentration of the CO2 fertilization effect on the growth of winter wheat with growth chambers where the CO2 concentration was controlled at 400, 600, 800, 1000, and 1200 ppm respectively. I found that initial increase in atmospheric CO2 concentration dramatically enhanced winter wheat growth through the CO2 fertilization effect. However, this CO2 fertilization effect was substantially compromised with further increase in CO2 concentration, demonstrating an optimal CO2 concentration of 889.6, 909.4, and 894.2 ppm for aboveground, belowground, and total biomass, respectively, and 967.8 ppm for leaf photosynthesis.
LMAO @ Gabro
…
…
..
” with growth chambers”
…
HA HA HA
….
How much corn is produced in “growth chambers” ????
…
Do they grow enough to feed two, or three steer?
Open air experiment on pine tree growth from Duke:
https://www.sciencedaily.com/releases/1998/08/980814065506.htm
Twelve percent more growth from CO2 levels expected in 2050 v. actual in 1998.
Gabro, do you really need me to explain the difference to you between what is done in a laboratory, and what is done in the corn fields of Iowa?
Robert,
You’re simply making a fool of yourself by d@nying the fact that more CO2 means more C3 vegetation. It’s simply biology, ie photosynthesis.
LMAO @ Gabro: ” expected in 2050 ”
…
Isn’t the Arctic supposed to be ice free in 2050 also?
Robert Kernodle October 20, 2017 at 7:53 pm
No, because you’re a willful ignoramus.
Controlled experiments show the isolated effect of CO2. That won’t change in the field.
BTW, corn is a C4 plant. Your total ignorance is showing again.
Gabro, you are correct, under laboratory conditions, “more CO2 means more C3 vegetation.”
…
However, as I have shown in a previous example, all of the increased CO2 we now have in our atmosphere has not increased crop yields in Death Valley.
Robert,
You just keep getting more an more pathetic. Give it up. You lose, because you know nothing of elementary biology.
The year 2050 was selected as a CO2 level, not for whatever its other effects might be.
But no, the Arctic will not be ice free in 2050. Arctic sea ice has been growing since 2012, and will likely keep doing so for another 25 or 30 years. It’s a natural cycle. By 2050, we should be back in a declining Arctic sea ice regime, just beginning, like the 1980s.
Gabro says: “you’re a willful ignoramus”
…
Name calling is not helping your argument.
Robert Kernodle October 20, 2017 at 7:58 pm
Yes, where crops weren’t grown in 1980 and aren’t grown now, the yields haven’t increased. They are still zero.
Do you have a point to make, or are you still just wasting everyone’s time with your ignorant spew?
Robert,
Not name calling. Just a fact.
You willfully won’t read papers which would educate you and end your obvious ignorance.
Hence, you’re a willful ignoramus.
Gabro says: “But no, the Arctic will not be ice free in 2050.”
…
Now, I have two responses to this statement.
..
1) Please provide me with a shipping address, I’ll send you a bottle of Windex that you can use to clean your crystal ball.
..
2) Please re-boot the computer you are running your MODEL of Arctic ice on…..the results may not be significant.
I see that Robert Kernodle,is being silly since he keeps IGNORING published science research over and over,because he wants to play his stupid word games. CO2 science has many papers on controlled growth to determine how much impact ADDITIONAL CO2 has on plant growth.
Here are examples based Plant Photosynthesis (Net CO2 Exchange Rate)
Responses to Atmospheric CO2 Enrichment:
Zea mays L. [Corn]
http://www.co2science.org/data/plant_growth/photo/z/zeam.php
Triticum durum [Wheat, Durum]
http://www.co2science.org/data/plant_growth/photo/t/triticumd.php
I bet he has NEVER grown fields of wheat like Gabro has,who lives only 50 miles or so away from where I live. I am quite familiar with the Columbia basin,having lived there since the 1960’s,it is a hot dry climate with sandy soils and low in Organic matter.
Large greenhouses deliberately increase interior CO2 levels because it is well known to accelerate growth of nursery stock. The CO2 generators are not cheap either,thus the growth increase has to be significant,which is why they often have it around 1200-1500 ppm levels.
You need to drop your pretzel comments.
Gabro says: “Hence, you’re a willful ignoramus.”
…
Now, Gabro, we all know that doing the same thing (name calling) over and over and expecting different results is …….not what you should be doing in a public place.
LOL @ Sunsettommy
….
” published science research ”
…
http://www.co2science.org is a blog
….
LOL
…
LOL
….
“weekly online publication of its CO2 Science magazine, which contains editorials on topics of current concern and mini-reviews of recently published peer-reviewed scientific journal articles,”
…
Reference: http://www.co2science.org/about/mission.php
…
Editorials and Reviews.
..
nuff-said
Notice that this troll ignored Gabro’s GREENHOUSE link with a stupid comment,showing his ignorance of standard farming methods in dealing with weeds:
“Robert Kernodle
October 20, 2017 at 6:33 pm Edit
Increased CO2 also accelerates the growth of weeds. More weeds mean less crop yield.”
He doesn’t seem to realize farmers have been dealing with weeds for many decades,it is a “solved” problem as long as the Farmer employs his effort on them. Weeds is a minor problem at best and often a ZERO problem.
So he ignores results of INDOOR greenhouse research to deflect to outdoor unspecified weed problem.
You are looking bad, Robert.
Robert,
Your willful ignorance is of biblical proportions, since you d@ny the fact of photosynthesis.
More CO2 necessarily means more sugar, up to the limit of water available. But more CO2 also necessarily means more water will be available, since stomata need stay open for less time to take in the same amount of CO2.
This theoretical is shown to be true in actuality by every experiment ever run on C3 plants and photosynthesis. You are, as I said, just making a fool of yourself.
Sunsettommy October 20, 2017 at 8:08 pm
I grew up and as an adult helped grow crops of soft white winter wheat in Palouse series soils, while also pursuing an academic career. The ag experiment station of which I speak lies NNE of Pendleton, OR, but the most important work on new strains has been done at WSU, also on Palouse series soils, but in far southeastern WA state.
Like most CACA adherents, Robert can’t handle the truth.
Sunsettommy October 20, 2017 at 8:21 pm
Robert is looking as he is, ie a willful ignoramus troll.
Sunsettommy now joins Gabro in name calling: “this troll”
…
Isn’t it funny that when someone points out that a poster’s links are garbage, it earns them the dubious distinction of an ad-hominem (name calling) attack.
Robert is now a confirmed troll since the TWO examples I posted are based on actual published science research, which he completely ignores in his desperate deflection to whining that it is a blog:
“LOL @ Sunsettommy
….
” published science research ”
…
http://www.co2science.org is a blog
….
LOL
…
LOL
….
“weekly online publication of its CO2 Science magazine, which contains editorials on topics of current concern and mini-reviews of recently published peer-reviewed scientific journal articles,”
…
Reference: http://www.co2science.org/about/mission.php
…
Editorials and Reviews.
..
nuff-said”
You said nothing Troll Robert, here are the links to the actual science papers you ignored:
Photosynthesis (Net CO2 Exchange Rate) References
Zea mays L. [Corn]
http://www.co2science.org/data/plant_growth/photo/z/ref/zeam_ref.php
and,
Photosynthesis (Net CO2 Exchange Rate) References
Triticum durum [Wheat, Durum]
http://www.co2science.org/data/plant_growth/photo/t/ref/triticumd_ref.php
The published papers and their results are real,you didn’t show they were wrong at all.
Still want to keep digging deeper?
Gabro, show me the study that attributes GLOBAL crop yields to CO2 concentrations.
…
The study has to show that irrigation, breeding, fertilizers and farming practices are not responsible for the yields.
…
So simple you shouldn’t have a problem right?
Sunsettommy ….. co2science.org is a blog.
….
If you wrote a paper and used a blog as a citation, you’d be a laughingstock.
(SNIPPED) MOD
Robert Kernodle October 20, 2017 at 8:33 pm
I’ve repeatedly showed you the share of global crop increases attributable to CO2, based upon elementary biophysics confirmed by experiment and observation.
You’re just wasting everyone’s time.
Gabro, all you have shown is that under laboratory conditions, that CO2 enhances plant growth. You have not shown that global crop yields have been affected by CO2.
…
Do you understand statistics and measurement? https://en.wikipedia.org/wiki/Confounding
Gee whiz, one of my comments got snipped. (SNIPPED)
(You are fast wearing out your welcome here) MOD
Robert,
I’ve showed you that C3 plants cannot help but increase their growth under more CO2.
What countervailing factors do you imagine could possibly vitiate this fact?
That more CO2 means more growth with less water is also an incontrovertible fact.
The onus is on you to show how more CO2 could not lead to more vegetation on earth, as has been observed. Even where there has been no irrigation, no use of pesticides or no fertilizers, the planet has greened.
As I said, you’re just making a laughingstock of yourself. But as my popular sociology prof at Stanford used to say, there are in fact people who enjoy hurting themselves.
Robert Kernodle October 20, 2017 at 9:00 pm
No one stooped to any low level. We merely accurately described you as a troll and willful ignoramus.
Gabro, I did not call you names. Yet you are unable to provide me with a study/paper/evidence that global crop yields have benefited from increased CO2.
…
You can’t.
(SNIPPED) MOD
Can someone explain to me why Gabro can call Robert names, yet Robert gets snipped?
(Stay out of it,not your problem) MOD
(SNIPPED)
(Your comment was completely off topic,let the MODS handle it) MOD
(Go read Roberts, ad hom comment that was left untouched, https://wattsupwiththat.com/2017/10/20/deepwater-horizon-epillog/#comment-2642223 ,you going to complain that it wasn’t snipped?) MOD
Censorship in action.
“co2science.org is a blog.”
A blog that collates THOUSANDS of peer reviewed scientific studies. !
CO2 is an absolutely essential part of the carbon cycle that supplies for ALL life on Earth
Plants do very little growing below about 250ppm
Plants THRIVE when levels are 1000+ppm
VERIFIED SCIENTIFIC FACTS. !!
GET OVER IT !!
“Increased CO2 also accelerates the growth of weeds.”
And here you are. A pointless non-thinking organic growth.
Anyone got some RoundUp ?
OMG!!! Patrick Moore just got snipped(!)
Mark, blogs are monarchies. (no one here owes anything to anybody) If you don’t like it, then go get your own blog…
Robert Kernodle October 20, 2017 at 8:33 pm
How could more CO2 not fertilize vegetation everywhere, since it is supposedly well mixed:
http://onlinelibrary.wiley.com/doi/10.1002/grl.50563/abstract
Impact of CO2 fertilization on maximum foliage cover across the globe’s warm, arid environments
This area of study offers the opportunity for a lot of empirical testing. Sort of fascinating that it might even explain the rise of agriculture itself (though we probably don’t know enough to say that yet).
And the general increase in the whole world’s biosphere, even the part NOT under direct human influence, ie crops, shows that it is highly likely to be CO2 fertilization and slight warming causing a substantial amount of the extra biosphere growth and hence crop yield.
Dr. Moore makes crystal clear his conclusion that humans are saving most of the biosphere by releasing CO2 otherwise effectively sequestered.
https://www.technocracy.news/index.php/2015/10/30/former-president-of-greenpeace-scientifically-rips-climate-change-to-shreds/
So I suppose that his snipped comment pointed out to Robert how profoundly ignorant is his deni@l of photosynthesis and the greening of the planet thanks to more plant food in the air.
That there are other reasons for increasingly bountiful harvests as well as man-made CO2 in now way detracts from the fact that our freeing trapped CO2 has been essential in the increased growth of crops, forests, grasslands and all C3 vegetation on land. This is especially true in areas, like the Sahel, which were previously too dry tor greenery to grow there.
As has been observed over and over, under higher CO2 regimes, plants need fewer stomata to take in the CO2 the require, so less water is lost via transpiration.
But from the Moderator’s comment, it appears that Dr. Moore came to Robert’s defense.
Which is strange, since it now occurs to me that I gave Robert too much credit, by assuming that he understood photosynthesis. Being ignorant of that process would explain his failure to grasp the greening on the planet under more CO2.
So, for Robert’s benefit, here it is in a nutshell. Land plants take water up from the ground through their roots. In their chloroplasts, they use a photon of sunlight to break a molecule of water into hydrogen (actually protons, ie positive ions) and oxygen atoms. In the dark reactions, the combine the free H with CO2 to produce the carbohydrates (sugars) which plants use for food.
Thus, more CO2 in the air means more carbohydrate and less water use, because of less transpiration from stomata being open less time or there being need for fewer of them.
define “it”
“You need to stop it entirely”
what do you suggest, killing all plant life, covering the oceans in a tarp and shutting down all geological activity, because there is 97% of emissions
“Global GHG emissions continue to be dominated by fossil carbon dioxide (CO2) emissions,…”
I’m just curious, but do we monitor human water vapor emissions?
JohnWho,
Not that I know, but I once calculated it a long time ago. It was completely negligible, except at huge point sources like cooling towers of power plants, the more that temperature is the limiting factor and any extra H2O is raining out if the maximum content is reached with an average turnover of a few days…
“Global GHG emissions continue to be dominated by fossil carbon dioxide (CO2) emissions,…”
is a patently false claim. Our emissions are a mere fraction of the total, whomever wrote that sentence should always be accompanied by an adult when on when typing
“any extra H2O is raining out if the maximum content is reached with an average turnover of a few days…”
Correct Ferd,
Human CO2 and H2O emissions are TOTALLY INSIGNIFICANT against the constant turn-around of natural H2O and CO2 in the atmosphere.
Glad you finally realise that. 🙂
AndyG55,
You forgot one important point: the difference in decay rate between some extra water above the maximum water content of the atmosphere and some extra CO2 above the dynamic equilibrium between atmosphere and ocean surface.
For any extra water vapor the decay rate is a matter of days.
For any extra CO2, the e-fold decay rate is about 51 years, or a half life time of ~35 years.
The latter is the main origin of the increase of CO2 in the atmosphere: the CO2 pressure related decay rate is too slow to remove all human emissions in the same year as emitted, while the natural cycle is totally dependent of (seasonal) temperature changes, hardly pressure dependent.
Why does the chart with this story not have a line showing emissions from volcanoes and thermal vents? Isn’t that a major source of atmospheric CO2? If we are concerned about CO2 concentrations, shouldn’t we be concerned about it regardless of source?
Nechit,
Volcanic emissions are around 1% of human emissions and indeed also one-way. That would increase the CO2 levels of the atmosphere with 2-3 ppmv at steady state. But as much of that CO2 is recycled from subduction of carbonate deposits, the real impact is near zero…
Co2 going down, but, but, but, but, but, but, but, but, WE had the hottest year on record! (sarc off)
Interesting: Either the oceans are getting colder, the plants are healthier or the world economy is in a down turn. Or a combination of all three.
Or China has cut back on concrete production since the completion of the Three Gorges Dam.
Is there a prominent physicist with a PhD who is prepared to state (or prove) whether methane at 1800ppb (0.00018% of the air) has any effect on climate?
jayman
I have challenged the trolls that infest these blogs to prove that methane emissions from live stock can ever warm the world more than .05 degrees in the next 20 years .Not one person has come forward with any proof whatsoever .The facts are that methane emissions from livestock are cyclic and are oxidized in the upper atmosphere into CO2 and H2O and the life of methane in the atmosphere is 8.4 years .CO2 and H2O are exactly what is required to grow fodder for livestock and so the cycle continues .Methane is slowly increasing but the increase is not coming from livestock .As I have pointed out before a molecule of CO2 contains one atom of carbon and two atoms of oxygen and a molecule of methane contains one atom of carbon and four atoms of hydrogen .This means that at any given time there is no more carbon in the atmosphere as CO2 or CH4 from livestock emissions than at any other time in the past .
As the methane is continuously oxidizing into CO2 there cannot be any effect at all.
This is so simple because every thing that livestock eat has grown by absorbing CO2 from the atmosphere
The man is being more stupid by the comment,
“Robert Kernodle
October 20, 2017 at 8:36 pm Edit
Sunsettommy ….. co2science.org is a blog.
….
If you wrote a paper and used a blog as a citation, you’d be a laughingstock.”
You are being an idiot since I posted the links that the “blog” cited to show clear evidence that increasing CO2 levels does indeed increase plant growth. You have yet to counter the posted science.
Gave you linked examples which shows you where the data came from,you ignore it because you are an idiot.
You are a troll.
In Alaska, the winter fully. ?oh=a7085912055e47488218a21fb7aa7f9c&oe=5A67BBC4
https://weather.gc.ca/saisons/animation_e.html?id=month&bc=sea
Robert Kernodle. You are woefully ignorant arguing that increasing levels of CO2 are not increasing yields of food crops around the world .You are saying white is black and black is white .I can not understand why the mods allow you to talk so much utter rubbish and thenallow you to put up some stupid argument
about statistics and the argument about CO2 growing more weeds and suppressing yields is absolutely laughable .
‘Have you ever grown cereal crops or root crops or any crops at all .We spread the stuff that you are spouting on the land and it grows good crops
.We call it Bull S—t ,
When you grow large areas of crops your weed control is critical .We use various techniques such as preplant soil incorporation .Spraying selected chemicals pre emergence and then if needed special chemicals before canopy closure . Of course weeds will respond to Co2 as all vegetation does but weed control is not affected by CO2 and that is a a proven fact as we are killing seedlings with two to four true leaves not weeds as high as the crop grows .
gwan, you almost have to feel PITY for the likes of chernoble.
He has probably never been out of his inner city latte ghetto.
Never actually planted a tree or eaten anything except from a supermarket shelf.
A friend of mine actually grows produce in a greenhouse farm (some 250 greenhouses), and because of the incredibly HIGH QUALITY, and ABUNDANCE due to CO2 ENRICHMENT, he makes a motza selling to some of the top restaurants in the region.
Not just fruit and vege, but also flowers, herbs etc, out of season etc etc
CO2 is a GODSEND to him, like it is to the whole of life on this glorious CARBON BASED planet of ours.
note.. I said “almost” 😉
let the poor sap stew in his own ignorance.
You people are completely wasting your time responding to the TROLL, please stop feeding it.
Let’s summarize (It is early here so don’t nitpick my wording):
1. Atmospheric CO2 lags temperature by hundreds or thousands of years in the ice core record.
2. The rate of change dCO2/dt correlates strongly with global temperature T in the modern data record, and its integral CO2 lags temperature by ~9 months in the modern data record.
3. CO2 satellites show that the high concentrations of atm. CO2 are located in tropical and agricultural areas and the far North, and less so in industrialized areas.
4. Natural CO2 flux into and out of the atmosphere dwarfs humanmade CO2 emissions from fossil fuel combustion.
5. The year-to-year correlation of atm. CO2 with fossil fuel CO2 emissions is low.
6. The year-to-year correlation of atm. CO2 with changes in global temperature is very high, with CO2 lagging temperature.
7. Since ~1940, fossil fuel combustion has greatly increased and global temperature has declined or stayed ~constant for ~52 years, and increased for ~25 years.
8. The evidence strongly suggests that the sensitivity of climate to increasing atm. CO2 is very low.
9. Atm. CO2 is not alarmingly high, it is in fact far too low for optimal plant and crop growth.
10. Atm. CO2 is, in the longer term, alarmingly low for the continued survival of carbon-based terrestrial life on Earth. Past major glaciations (ice ages) were near-extinction events.
11. Excess winter mortality in the human species totals about 2 million Excess Winter Deaths per year, and is high in both warm and cold climates.
12, A slightly warmer Earth with higher concentrations of atm. CO2 would be beneficial for both humanity AND the environment.
13. In conclusion, based on all the above evidence, the warmist gang is terrified of increasing atmospheric CO2, and has squandered many trillions of dollars of scarce global resources on foolish CO2 abatement programs that have also driven up energy costs, reduced electric grid reliability, increased winter mortality, especially harmed the elderly and poor of the world, and diverted our attention and our resources from solving the real and pressing needs of humanity and the environment.
Regards to all, Allan
Addendum, having now had my coffee:
14. We know to a reasonable degree of confidence what drives global temperature and it is almost entirely natural and has an INsignificant causative relationship from increasing atm. CO2:
– in sub-decadal time frames, the cause is primarily Pacific Ocean natural cycles, moderated by occasional cooling from major volcanoes;
– in multi-decadal time frames, the cause is the integral of solar activity;
– in the very long term, the cause is planetary cycles.
15. The next trend change in global temperature will probably be moderate naturally-caused global cooling, staring by ~2020-2030, due to reduced solar activity (as we published in 2002).
16. Cool and cold weather kills many more people than warm or hot weather, even in warm climates. Excess Winter Mortality Rates are surprisingly high in countries with warmer climates, and are lowest in advanced countries that have cheap energy and modern home insulation and heating systems.
17. Adaptation is clearly the best approach to deal with the moderate global warming and cooling experienced in recent centuries.
18. Cheap, abundant, reliable energy is the lifeblood of society. When politicians fool with energy systems, real people suffer and die. That is the tragic legacy of false global warming alarmism.
Allan, just be thankful that you actually get good sleep. As an insomniac for nearly two decades, i get some really bad days that coffee only makes worse. (today just so happens to be one of those bad days, so if i ramble too much then you’ll have to pardon me for that)…
i think that the greens have stumbled backwards into the truth (while wearing a blindfold) here. The cost of energy relies mostly on availability. If energy is scarce or even relatively scarce the price of energy goes up. So the more energy that is out there the lower energy prices are on the whole. Over a decade ago during the expanding bush economy, here in the states electricity prices increased 33%, and gasoline prices reached $4+ per gallon. During this current economic expansion, electicity prices have remained flat and gas is just $2.50 a gallon. The unemployment rate here is actually lower than at any point during the bush boom and the inflation rate is a modest 2% (thanks in large part due to the low cost of energy). It appears that because of this the federal reserve seems prepared to let the u.s. unemployment rate dip below 4% for the first time since the 90s. Yes, people in green areas bear the brunt of higher costs for energy, but we are all benefactors through low inflation and cheaper gasoline prices. And true, although natural gas may not exactly be green, it was tapped into largely because of the push for “going green”. Now that world wide demand for energy is high, it will do us well to have as much energy out there on the market to keep in check the spiraling higher energy prices and its accompanying inflation that we saw a decade ago. Yer (humble) fonz needs to crunch some more numbers on this as i just woke up (figuratively speaking here) to the concept when i glanced at the lastest economic data a short while ago. My thinking is that more energy means cheaper energy on the whole. AND this could mean an ecomomic prosperity that we haven’t seen since (yes) the 50s and 60s…
Allan
Please provide your chart showing the annual lag of nine months.
Regards
HI Fonz,.
RE your insomnia – Moderator or Anthony – please give Fonz my email address (or Fonz please email me through my website) – If we discuss, I may be able to suggest some solutions.
Re low energy prices and abundant energy supply – this,is due to fracking of first gassy and then oily shales in the USA. However, costs should rise somewhat because the industry is losing money today due to excessive competitiveness and these very low prices are not economically sustainable, imo.
Best, Allan
Hi ozonebust,
the information you seek is here:
https://wattsupwiththat.com/2017/10/06/news-from-vostok-ice-cores/comment-page-1/#comment-2630026
[excerpt].
There is incontrovertible evidence that global temperature T drives atmospheric CO2 much more than CO2 drives global temperature. This fact was demonstrated in my January 2008 paper at http://icecap.us/images/uploads/CO2vsTMacRae.pdf and verified by others, such as Humlum et al 2013 http://www.sciencedirect.com/science/article/pii/S0921818112001658
My conclusion does NOT mean that current temperature change is the only or even the primary driver of increasing CO2 – other major drivers of increasing CO2 could include fossil fuel combustion, deforestation, deep ocean exsolution of CO2, etc., and any or all of these could explain the observed baseline increase in atmospheric CO2.
The strong correlation of dCO2/dt vs T and the resulting 9-month lag of CO2 after T demonstrates that CO2 is NOT a major driver of temperature – if it were otherwise, the close correlation of dCO2/dt vs T and the resulting 9-month lag of CO2 after T would not exist.
http://www.woodfortrees.org/plot/esrl-co2/from:1979/mean:12/derivative/plot/uah5/from:1979/scale:0.22/offset:0.14
Many seem reluctant to accept of even discuss this reality, or confuse it with unnecessary complications that obscure the basic fact:
“Atmospheric CO2 lags temperature at all measured time scales – the future cannot cause the past.”
I think that the observed ~9-month lag of CO2 after temperature is important to understanding the carbon cycle and the true relationship between temperature and atmospheric CO2. I think this CO2 vs T relationship is important – far too important to be ignored, as it has been for the past decade.
Regards, Allan
Allen
While reading your breakdown it triggered a thought that I haven’t really pieced together.
What happened over the period in the post to modern industrial age was a war on smog that was a majority of Carbon Monoxide, Nitrogen and Sulfur oxides that reduced the Monoxide to Dioxide and the elimination of most of the Nitrogen and Sulfur oxides. By eliminating smog that is in part like what happens with volcanic activities cooling effect over those local areas. Those areas have warmed. Not because the CO2 increased there as much as the cooling effect was removed.
Hi johchi7,
This hypo has been used by others but does not seem to have much credibility, imo – the amount of industrial smog in the “bad old days” was not large enough in intensity or areal extent to have much impact on global temperatures. Some of the evidence is here (there is much more):
http://wattsupwiththat.com/2015/05/26/the-role-of-sulfur-dioxide-aerosols-in-climate-change/#comment-1946228
It requires a “century-scale” volcano to have a significant impact on global. temperatures.
Evidence is here:
https://wattsupwiththat.com/2017/09/20/from-the-the-stupid-it-burns-department-science-denial-not-limited-to-political-right/comment-page-1/#comment-2616345
I did point out localized areas…without expanding to global.
Hi jochi7,
Yes, I missed your reference to localized areas – I have no opinion on that – could be true but of limited areal extent. There definitely is an Urban Heat Island (UHI) effect vs the countryside, which has generally been attributed to increased pavement, increased energy use, etc, within cities. I suppose cleaner city air could also contribute to UHI.
Thanks Allen. Yes the UHI has been witnessed by me since I was born in 1960 in the “Valley of the Sun” Arizona. The small towns with miles of farm land and desert land and dairies and feed lots between them are now mostly urban sprawling and industrialization with parking lots asphalt and concrete connected by pavement…with a few sparingly left fields and the fruit orchards mostly gone with houses scattered through them. All the usual irrigation ditches are gone or now underground and replaced with swimming pools and lake communities lined with plastic. The yards of homes are lined with plastic to control weeds. The sewer systems and drainage systems adding to the heat of the concrete and asphalt that retains the heat longer after sunset…along with the buildings themselves. Farm crops and orchards that thrived on the CO2 and irrigation were replaced by grasses and yard shrubbery and imported trees. The natural aquafirs that are scattered in this ancient ocean bed have been depleted by all the massive ground cover of urbanization. With fewer areas of open ground the rains cause greater flooding because it can’t penetrate the plastic, concrete and asphalt. With the increased urbanization the “GHG” increased along with the pollen from non-native flora and the constant traffic keeping higher dust in the valley 24/7/365 until enough wind blows it away through the few passes between the mountains. Those cool nights in summer are now just memories to us that have lived here before these changes. Only when passing by a field or orchard that has survived, can you feel the temperature drop a few degrees after dark set in.
ristvan
ozonebust
quote from wikipedia
By volume, dry air contains 78.09% nitrogen, 20.95% oxygen,[1] 0.93% argon, 0.04% carbon dioxide, and small amounts of other gases. Air also contains a variable amount of water vapor, on average around 1% at sea level, and 0.4% over the entire atmosphere.
end quote
So, just for the record, my 0.48% water vapor when looked at it on average over the entire atmosphere was correct
[do you want me to check my original source again?]
I’m not near my data collection to be accurate. But, studies on human respiration show most of the air we breath in removes most of the Oxygen and we exhale Carbon Dioxide nearly the amount of the Oxygen we inhaled.
All fauna to various degrees during respiration does this exchange between the Oxygen inhaled and Carbon Dioxide exhaled, from the microbial to the largest whales. Where fish process their oxygen from the water molecules they too exhale Carbon Dioxide. The microorganisms have their own systems of respiration to do the same thing in the environment they live in, and convert other sources of Oxygen – Sulfur oxides and Nitrogen Oxides – to Carbon Dioxide.
Rocks containing carbon decompose into soils causing a respiration that releases Carbon Dioxide into the environment. Where other minerals have the ability to reduce Carbon Dioxide from the environment by converting into other minerals.
The Carbon Cycle is complex, but more things produce CO2 than sequestration of it. Because many sinks that are organic die and/or burn and/or are consumed by fauna – and that includes fauna that eat fauna – where they return CO2 back into the environment.
Jochie
Some people argued with me about the water content in air. I said it is about 0.48 %. Average. Whole atmosphere.
All of what you said has nothing to do with that?
Henry’s
I made no comment on your water vapour values
Ferdinand
I think we may assume that the 2 ppm of CO2 currently being added every year is man made.
However, the warming that we are seeing is not man made. According to me..
Concerned to show that man made warming (AGW ) is correct and indeed happening (remember my diesel truck), I thought that here [in Pretoria, South Africa} I could easily prove that. Namely the logic following from AGW theory is that more CO2 would trap heat on earth, hence we should find minimum temperature (T) rising pushing up the mean T. Here, in the winter months, we hardly have any rain but we have many people burning fossil fuels to keep warm at night. On any particular cold winter’s day that results in the town area being covered with a greyish layer of air, viewable on a high hill outside town in the early morning.

I figured that as the population increased over the past 40 years, the results of my analysis of the data [of a Pretoria weather station] must show minimum T rising, particularly in the winter months. Much to my surprise I found that the opposite was happening: minimum T here was falling, any month….I first thought that somebody must have made a mistake: the extra CO2 was cooling the atmosphere, ‘not warming’ it. As a chemist, that made sense to me as I knew that whilst there were absorptions of CO2 in the area of the spectrum where earth emits, there are also the areas of absorption in the 1-2 um and the 4-5 um range where the sun emits. Not convinced either way by my deliberations and discussions as on a number of websites, I first looked at a number of weather stations around me, to give me an indication of what was happening:
The results puzzled me even more. Somebody [God/Nature] was throwing a ball at me…..The speed of cooling followed a certain pattern, best described by a quadratic function.
I carefully looked at my earth globe and decided on a particular sampling procedure to find out what, if any, the global result would be. Here is my final result on that:
Hence, looking at my final Rsquare on that, I figured out that there is no AGW, at least not measurable.
El Niño 3.4 index fell the lowest since July this year.
That looks like a cold summer for us here SH
Russian decline traces fall of USSR and sanctions, US switch to NG plus slow ec, China slow ec, EU economically may have reached one of their famous tipping points some time ago. With stubborn embrace of bankrupt climate policy, death spiral is next, with still no sign of any ‘actionable’ global warming negatives. Oh and a lot of that carbon is being sucked in by forests taking over the planet.
“The science is all in”… except for world CO2 still rising while Sea Level has paused for 2 years.
Another variable is those Gassy Baltic Clams which some claim are producing more gas thanks to (the variable of) Agriculture Fertiliser.
What crisis? The crisis is that we are continuing to pump millions of tons of CO2 into the atmosphere every year.
Another aspect of the crisis is that web sites like this one continue to pump millions of tons sophistry and pseudo-science into the public discussion every year.
Crisis AVERTED.
The effect of human release of accidentally sequester carbon, has been to BOOST the whole CARBON CYCLE.
Plant life has been lifted from purely subsistence level to a level where it can actually feed the world’s population (assuming decent distribution and that it isn’t co-oped for fuel.)
The REAL crisis comes if the moronic CO2-HATRED of so many anti-science cretins worshiping at the feet of the likes of Mickey Mann, manages to actually reduce the atmospheric percentage of CO2.
Are you one of those moronic cretins, Jesse?
Jesse
Truth is that most of us ‘sceptics’ have done their own investigations of looked at those of others to conclude that there is no man made warming.
Let me therefore not allow your comment to pass without a challenge. Please enlighten us with your own results or those of others as to why you think current global warming is real and that it is not natural.
[those are two distinct and separate questions]
Fair enough. First, do you mean that there is no warming at all, or that the warming that there is, is not man made? If the former, it would be idle for us try to talk about this — we live in different realities.
But you seem to agree that there is global warming, but that it is natural. I do not believe that it is natural, for the following reasons:
So, first, there is no natural “forcing” known to science that could be causing the warming. Volcanic eruptions, solar cycles, etc. etc. cannot account for a rising trend that is clearly discernable over recent decades.
But secondly, the growing concentration of CO2 in the atmosphere does account for it. We have known, since Fourier published his papers in the 1820s on the subject, that the composition of gases in the atmosphere has a great deal to do with the average surface temperature of the earth. Studies made by Tyndall and others shortly after Fourier’s identified the greenhouse gases: CO2, methane, nitrous oxide, ozone, and water vapor, principally. These scientific discoveries are now almost 200 years old. Generations of scientists have questioned and tested them, and they have stood the test. And we do know that the amount of CO2 in the atmosphere is rising, and that the additional CO2 in the atmosphere comes from the burning of fossil fuels.
A useful primer of the subject is “What We Know About Climate Change”, by Kerry Emmanuel of MIT. A far more challenging but essential book is “The Warming Papers”, ed. by Archer and Pierrehumbert, an anthology of the classic papers on global warming and climate change. You say that skeptics have done their own investigations; perhaps, but if they are unacquainted with the body of scientific studies in an anthology such as this, they have more investigation ahead of them.
Jesse,
Since the end of the Little Ice Age, there was a warming cycle in the mid-19th century, followed by a cooling cycle in the late 19th and early 20th centuries, followed by a warming cycle in the early 20th century, followed by a pronounced cooling cycle from the 1940s until 1977, when the PDO fillped, despite rising CO2 during those decades, followed in the late 20th century by a slight warming cycle, indistinguishable from the previous such interval, followed by the present flat period in the early 21st century.
So-called “climate science” does not know all the natural “forcings”, so cannot attribute the late 20th century warming to human activities. If we did have a measurable effect, it is from cleaning the air rather than adding CO2 to it. The GHE of a fourth molecule of CO2 per 10,000 dry air molecules is at best negligible.
Since during the increase in CO2 since the end of WWII, earth has cooled dramatically, warmed slightly and stayed flat, there is no temperature or climate fingerprint from more of this essential trace gas in the atmosphere.
OTOH, the increase has contributed to the greening of the planet, especially in areas like the Sahel, where the vegetation promoted is woody (hence C3 plants) and in places where there has not been irrigation. So far, more CO2 has been beneficial, and more will be more so.
It has been known for almost 200 years that CO2 and other so-called greenhouse gases keep the surface of the earth a lot warmer than it would be without such gases. Most calculations put the likely surface temperature of an earth without greenhouse gases at around zero degrees fahrenheit.
We are dumping millions of tons of CO2 into the atmosphere every year, year after year. The amount of CO2 in the atmosphere continues to rise accordingly.
We are seeing warming that is very much in line with what scientists expected from the given rise in atmospheric CO2. We are also seeing things that can be accounted for only by a rise in atmospheric CO2: warmer nights world-wide, and a warming of the troposphere with a corresponding warming of the lower stratosphere.
The alternative explanations for all this offered on the web site have been refuted by compentent scientists over and over. Repetition will never make them true.
I would urge everyone reading this thread to read a standard text book on the subject we are discussing, such as John E. Frederick’s “Principles of Atmospheric Science”. This book has no ax to grind; it barely mentions global warming. It does describe how greenhouse gases influence the earth’s average surface temperature, even though they exist in the atmosphere in small amounts.
Jesse
https://wattsupwiththat.com/2017/10/20/what-crisis-global-co2-emissions-stalled-for-the-third-year-in-a-row/#comment-2643448
\
I am sure you have read the book and know the answer to my question?
Water vapor is lighter than air, CO2 is heavier than air. Water vapor concentrates on the equator, rises and transfers latent heat from the equator to the poles. You can never compare the effects of water vapor and CO2, as CO2 does not changes physical state in the atmosphere.
http://tropic.ssec.wisc.edu/real-time/mtpw2/product.php?color_type=tpw_nrl_colors&prod=global×pan=24hrs&anim=html5
“cannot account for a rising trend that is clearly discernable over recent decades. ”
The ONLY warming has come from El Nino and ocean events (ignoring the blatant data manipulation of the surface fabrications)
That is the ONLY discernible warming , and it does NOT come from any human influence.
“the growing concentration of CO2 in the atmosphere does account for it. ”
brain-washed RUBBISH.
There is no empirical evidence that CO2 causes warming in our convectively controlled atmosphere.
Its a LIE, as blatant piece of anti-science garbage.
Jesse
My own investigations lead me to believe there was warming until some time ago [when looked at it on average over a number of SC’s {=solar cycle}
By me, all warming and cooling is natural, as my results suggest:
https://wattsupwiththat.com/2017/10/20/what-crisis-global-co2-emissions-stalled-for-the-third-year-in-a-row/comment-page-1/#comment-2642525
Arrhenius {not Fourier} and Tyndall looked at closed box experiments and their results looked correct – just like you feel the cold when stepping out of the cubicle where you just showered. Instinctively you feel inclined to believe that they must have been right.
However, GHG’s also cool the atmosphere, as I can easily prove to you from a certain paper, by deflecting sunlight, straight from the atmosphere back to space. In fact, even Trenberth has admitted that ozone on its own is responsible for deflecting at least 25% of all that is being deflected away from earth.
So, to form an opinion, one would have to see tests and results to show us exactly how much incoming energy is deflected by GHG’s 0-5 um versus how much is being trapped on earth 10-15 um.
Did you ever see such an investigation ever having taken place, done on any GHG?
Let me know.
Greenhouse gases do not deflect any solar energy into outer space, apart from those that contribute to the earth’s albedo effect, such as water vapor. Water vapor is problematic in its overall effect: it acts as a greenhouse gas, trapping heat, and to the extent that it is reflective, it cools the earth. It’s problematic because water vapor in different formations and concentrations behaves differently.
CO2, however, is not reflective at all. It is transparent to high frequency solar energy but it absorbs the lower frequency infrared energy that the earth gives off in turn; after absorbing infrared, it re-emits it in all directions, one of the directions being back down to the surface of the earth.
Jesse, you say
CO2, however, is not reflective at all.
This is an incorrect statement.
Look at Fig.6 bottom to find deflected light from CO2 in the 1-2 um.
http://astro.berkeley.edu/~kalas/disksite/library/turnbull06a.pdf
[we are looking at earthshine – i.e. light deflected from earth.]
There are also absorptions of CO2 4-5 um and to top it all we also have a few absorptions of CO2 below 300 nm – which is why we are able to identify and quantify CO2 on other planets….
Now, where is your report to show us the balance sheet, i.e. how much energy is deflected away from earth 0-5 um versus how much energy is trapped on earth 10-18 um?
Henry, I know of no such balance sheet, but your position on this question implies that you know of such a balance sheet yourself. If so, I would like to see it, for this is an interesting question. However, I stand corrected: in my earlier post I was ignoring the infrared component of the solar energy that reaches us from the sun.
Anyway, what happens when CO2 absorbs infrared radiation coming from the sun? It is warmed by it, and then re-emits it as infrared, in all directions. But only one of these directions is back into outer space. The rest is radiated into the atmosphere laterally or downward. So even though CO2 bounces some of the infrared coming from the sun back into space, it emits the rest into the atmosphere.
And infrared radiation is only one of the components of the solar energy that reaches the Earth, the other two being visible light and infrared radiation. Here, the case is different. These components pass through the atmosphere to the Earth without interference from CO2; CO2 deflects little or none of it. The earth re-emits some of the energy in these components in the same wavelength, again without interference from CO2. But it re-emits much of the energy in these components as infrared, which is absorbed by CO2.
It is the action of CO2 in absorbing this outgoing infrared radiation than makes CO2 a greenhouse gas. Here, the effect of CO2 on warming cannot be neutral; it permits some components of solar energy to reach the earth without interference, but traps a significant part of the energy in these components and holds it against the earth.
For almost 200 hundred years, there has been nearly universal agreement among physicists and atmospheric scientists that CO2 is indeed a greenhouse gas. I believe that they are right and I hope that I have not garbled their reasoning in this post.
“there has been nearly universal agreement among physicists and atmospheric scientists that CO2 is indeed a greenhouse gas.”
The interpretations have been proven to be nothing but “beginner’s” science.
Which is where you seem to be stuck.
There is NO proven mechanism by which CO2 can cause warming in our convectively controlled atmosphere.
And there is ZERO empirical evidence either.
AndyG55, The ability of CO2 to absorb infrared radiation can be verified by a high school science fair project. We are dumping millions of tons of CO2 into the atmosphere every year. As we have been doing this, the average surface temperature of the Earth has been rising, as the much maligned computer models said that they would. The climate change that was predicted to result from global warming has also been very much as expected: more of the tropical storms that occur have been reaching the highest level of intensity; droughts and wildfires are being more severe and extensive, and are reaching into higher altitudes; the polar ice cap is losing mass; glaciers world-wide are shrinking; nights are staying warming, increasing the lethal potential of heat waves.
To to explain all this, you will invoke “cycles of nature”, without explaining the “mechanisms” by which they work. You prefer the hocus-pocus of ideology to the hard-won insights of scientific research. You are in no position to scold anyone for being stuck at the level of “beginner’s science.”
Jesse says
Anyway, what happens when CO2 absorbs infrared radiation coming from the sun? It is warmed by it, and then re-emits it as infrared, in all directions. But only one of these directions is back into outer space. The rest is radiated into the atmosphere laterally or downward. So even though CO2 bounces some of the infrared coming from the sun back into space, it emits the rest into the atmosphere.
Henry says
You are not getting it [much] and now you want us to ‘learn’?
The quote I made from you shows the basic misunderstanding. You cannot absorb ‘much’ heat in the atmosphere, because there is not much mass. Absorption [by water] takes place in the UV and IR and here there is the mass of the oceans…
What happens when you put your brights on when in misty conditions ? the light is returned to you, mostly in the direction where the light came from: in your face….that is not only one direction. That is THE direction.
Just to give you one problem to ponder: Ozone is mentioned as a GHG because, indeed, we have a little dent in earth’s emission 9-10 um. However, we have strong absorption of ozone in the UV meaning that a lot of incoming radiation is deflected away from earth [like I said, mostly in the direction of the sun, where it came from]
The energy coming in at 300 nm is many times higher than the energy trapped on earth 9-10 um.
Trenberth menrtioned that ozone [he has no figures on peroxides and N-oxides also formed TOA] is responsible for about 25% of all that this returned to space [i.e. 25% of 25-30% which is earth’s albedo]
So what do you think: what is the net effect of more ozone in the atmosphere? Warming or cooling?
let me know.
henryp,
The incoming solar energy in the UV band is definitely warming the lower startosphere where ozone absorbs much of that UV energy. Even the 11-year solar cycle makes an about 1ºC difference in the equatorial stratosphere which pushes the jet streams (and rain patterns) polewards at high solar activity.
The main band of CO2 is at 15 microm where water vapor is not active. That is not only measured in laboratoria, but also by satellites as a dip in transmittance and at two stations on earth as back radiation.
Thus that difference in energy is absorbed and partly reflected by CO2, leading to a warming of the troposphere and the surface. Even if the theoretical result is modest (~1ºC for 2xCO2) and probably lowered by negative feedbacks, as in practice no real warming is measured, CO2 is a proven GHG.
Ferdinand
You are not answering the question?
henryp,
I do miss my reaction on ozone, but here again:
Ozone warms up the lower stratosphere when hit by UV. Even the small change in total solar energy (but about 10% in the UV-range) over the maximum period in a solar cycle gives a warming of ~1ºC in the tropic stratosphere. That increases the equatorial – polar stratospheric air flux and pushes the Jet Streams (including the accompanying rain patterns) polewards. At low solar activity, the reverse can be noticed.
Ferdinand
on the ozone,
look again at the graph
https://wattsupwiththat.com/2017/10/20/what-crisis-global-co2-emissions-stalled-for-the-third-year-in-a-row/#comment-2645525
note that the white area under the red line is what is sent to space by the ozone and some raleigh scattering.
That is a lot of energy…
OTOH there is a tiny bit of absorption of ozone in the 9-10 um that does make a small dent in earth’s emission. Do you see it?
Now what do you think is the net effect of more ozone in the atmosphere?
let me know.,
[the amount of ozone / peroxide and N-Oxide made TOA depends on the amount of the most energetic parts being released from the sun. That depends on the polar magnetic field strength of the sun….the lower, the more of the most energetic particles are being released from the sun…..]
https://www.nasa.gov/topics/earth/features/2012-poleReversal.html
In this is a comment that I can’t copy from my phone. It basically says that when our magnetic field wealens it allows more solar radiation in. Which from my understanding the Earth magnetic field has been weakening and our magnetic poles moving more rapidly. That even that with a Solar Minimum the Earths weakened magnetic field is allowing more solar radiation in. With our ozone as the next line of defense having been weakened allowed more solar radiation in and as it is regaining would trap more in below it from escaping and bouncing back.
johchi
true
the elephant in the room has been moving a bit, north east, in fact, and quite fast,
faster then was originally expected.
Must be a magnetic stirrer effect? i.e. following the sun?
There never was a man made ozone hole. At the time the theory was put forward I was fooled into believing it to be true and even did some research in getting rid of CFC’s.
{I was successful in finding another much cheaper solution for cleaning PC boards]
However, at the time I did realize that I should check the results.
My moment of truth came when I saw the the spectra of peroxide and ozone: almost identical, i.e. doing exactly the same thing.
Going by me: The ozone hole is not a hole. It is where there are more OH radicals forming peroxide doing exactly the same thing as ozone…
Henry, Any object in the universe that is at a temperature above absolute zero emits heat in the form of electromagnetic radiation. Objects emit this radiation in all directions. The warmer the object, the higher the frequency (and lower the wavelength) of the radiation that it emits.
When CO2 absorbs infrared radiation, it does just that — it absorbs it. It does not reflect it. So your illustration about headlights being reflected by mist in only one direction is not to the point here. We are not talking about reflection.
As CO2 absorbs infrared radiation, it grows warmer. When it grows warm enough, it emits electromagnetic radiation in the frequencies of infrared. It emits infrared in all directions — upwards, laterally, and down.
And, yes, the atmosphere does have enough mass to retain heat. Are the terms “hot air” and “cold air” meaningless to you? And as the atmosphere warms, it radiates heat — in all directions, again, one of the directions being down to the surface of the earth. In fact, the surface of the earth receives more heat from the atmoshpere than it does directly from the sun.
Henry, As to ozone, it is a greenhouse gas, so its effect is warming. But it is not one of the major greenhouse gases. The issue around ozone involves its role in blocking harmful ultraviolet radiation from reaching the earth. This radiation is harmful to many forms of life — plant and animal.
For example, a colleague of mine at work was sent to Australia to work with our office there for a couple of months. The first weekend he was there, he went to the beach. He put on the usual amount of the sunscreen that he always uses here in the USA. He got horribly burned right away. He was under a hole in the ozone layer. He skin healed, but now he has to watch for skin cancer.
This problem was universally recognized. In 1988, Reagan signed the Montreal Protocol, an international treaty limiting the production of hydrofluorocarbons, which destroy ozone. This treaty went into effect in 1989, and it has been effective — the holes in the ozone layer are slowly closing.
The NCEP GDAS and CPC temperature and height analyses are used to monitor processes in the Stratosphere and Troposphere. In the table below are zonal mean time series of Temperature.
http://www.cpc.ncep.noaa.gov/products/stratosphere/strat-trop/gif_files/time_pres_TEMP_MEAN_ALL_EQ_2017.png
Ozone releases energy under the effect of very short UV radiation.
Jesse\
You say
When CO2 absorbs infrared radiation, it does just that — it absorbs it. It does not reflect it. So your illustration about headlights being reflected by mist in only one direction is not to the point here. We are not talking about reflection.
end quote
You got that completely wrong and I can also detect that you are listening to the wrong kind of people instead of relying on your own intellect. For some reason – most probably financial – you want to toe the line?
There is no mass in the atmosphere. In the water and the oceans : there is the mass and indeed the UV and IR that gets through the window allowed [by G-D] is what triggers the climate [a lot]
As matter of fact, I investigated this problem [remember I am an analytical chemist, originally]
Go back to my previous comments I made to you and read this summary I made for people just like you a few years ago:
“I am watching with some amusement a lot of scholar discussions on the green house effect as I realized again that the people that I encounter on most scientific blogs don’t understand the chemistry principle of absorption and subsequent re-radiation. In fact very few people do understand it because if they did they would have raised the alarm bells ringing long time ago. But they all got stuck at Tyndall and Svante Arrhenius. …
They know that CO2 (carbon dioxide) “absorbs” in the 14-15 um region. Most people think that what it means is that the molecules absorbs photons here which then subsequently get transferred as heat to neighboring molecules. Then it absorbs again, and so on, and so on…and all the absorbed light is continuously transferred to heat…
Although this may happen up to a certain saturation point as soon as the light or radiation hits on the gas, that is in fact not what is causing the heat entrapment / cooling effect.
The best way to experience re-radiation is to stand in a moist dark forest just before dawn on a cloudless night. Note that water vapor also absorbs in the visible region of the spectrum. So as the first light of sun hits on the water vapor around you can see the light coming from every direction. Left, right, bottom up, top down. You can see this for yourself until of course the sun’s light becomes too bright in the darkness for you to observe the re-radiated light from the water vapor.
A second way to experience how re-radiation works is to measure the humidity in the air and the temperature on a certain exposed plate, again on a cloudless day, at a certain time of day for a certain amount of time. Note that as the humidity goes up, and all else is being kept equal, the temperature effected by the sun on the plate is lower. This is because, like carbon dioxide, water vapor has absorption in the infra red part of the spectrum.
We can conclude from these simple experiments that what happens is this: in the wavelengths areas where absorption takes place, the molecule starts acting like a little mirror, the strength of which depends on the amount of absorption taking place inside the molecule. Because the molecule is like a perfect sphere, 62,5% of a certain amount of light (radiation) is send back in the direction where it came from. This is the warming or cooling effect of a gas hit by radiation.
Unfortunately, in their time, Tyndall and Arrhenius could not see the whole picture of the spectrum of a gas which is why they got stuck on seeing only the warming properties of a gas.
If people would understand this principle, they would not singularly identify green house gases (GHG’s) by pointing at the areas in the 5-20 um region (where earth emits pre-dominantly) but they would also look in the area 0-5 um (where the sun emits pre-dominantly) for possible cooling effects.
For comprehensive proof that CO2 is (also) cooling the atmosphere by re-radiating sunshine, see footnote below.
In all of this we are still looking at pure gases. The discussion on clouds and the deflection of incoming radiation by clouds is still a completely different subject.
So what everyone should be doing is looking at the whole spectrum of the gas molecule 0-20 um. Unless you come to me with a balance sheet of how much cooling and how much warming is caused by a gas, we don’t actually know whether a substance is a GHG or not. So, all that we can say now is that we don’t know what the net effect is of an increase in CO2 in the atmosphere…..
Seeing that CO2 also causes cooling by taking part in the life cycle (plants and trees need warmth and CO2 to grow), and because there is clear evidence that there has been an increase in greenery on earth in the past 4 decades, I think the total net effect of more carbon dioxide in the atmosphere could even be zero or close to zero. But unless we cone up with a test method and measurements, we will never know for sure.
FOOTNOTE
For proof that CO2 is (also) cooling the atmosphere by re-radiating sunshine, see here:
http://astro.berkeley.edu/~kalas/disksite/library/turnbull06a.pdf
They measured the re-radiation from CO2 as it bounced back to earth from the moon. So the direction was sun-earth-moon -earth. Follow the green line in fig. 6, bottom. Note that it already starts at 1.2 um, then one peak at 1.4 um, then various peaks at 1.6 um and 3 big peaks at 2 um. It all comes back in fig. 6 top.
This paper here shows that there is absorption of CO2 at between 0.21 and 0.19 um (close to 202 nm):
http://www.nat.vu.nl/en/sec/atom/Publications/pdf/DUV-CO2.pdf
There are other papers that I can look for again that will show that there are also absorptions of CO2 at between 0.18 and 0.135 um and between 0.125 and 0.12 um.
We already know from the normal IR spectra that CO2 has big absorption between 4 and 5 um.
So, to sum it up, we know that CO2 has absorption in the 14-15 um range causing some warming (by re-radiating earthshine) but as shown and proved above it also has a number of absorptions in the 0-5 um range causing cooling (by re-radiating sunshine). This cooling happens at all levels where the sunshine hits on the carbon dioxide same as the earthshine. The way from the bottom to the top is the same as from top to the bottom. So, my question is: how much cooling and how much warming is caused by the CO2? How was the experiment done to determine this and where are the test results? (I am afraid that simple heat retention testing does not work here, we have to use real sunshine and real earthshine to determine the effect in W/m2/ m3 / [0.03%- 0.06%]CO2/24hours).
I am doubtful of the analysis of the spectral data. I have not seen any work that convinces me. Also, I think the actual heat caused by the sun’s IR at 1-2 and 4-5 um could be underestimated. Here in Africa you cannot stand in the sun for longer than 10 minutes, just because of the heat of the sun on your skin.
So you have some absorption of CO2 14-15 um trapping some heat compared to so much radiation going back to space? What do you think is the net effect of more CO2 in the atmosphere?>
Let me know what you actually FIND yourself?
I don’t understand what happened to my answer to Jesse?
[Comment found and rescued. -mod]
OK. It seems my original comment went up in the air and did not bounce back…..let me try again
@Jesse and @ferdinand meeus
[who both don’t understand]
Jesse says
When CO2 absorbs infrared radiation, it does just that — it absorbs it. It does not reflect it. So your illustration about headlights being reflected by mist in only one direction is not to the point here. We are not talking about reflection.
end quote
This shows me how you misunderstand and how you keep listening to other people instead of using your own brains and observations….Originally, I am an analytical chemist and I wrote this GHG 101 quite a few years ago:
I am watching with some amusement a lot of scholar discussions on the green house effect as I realized again that the people that I encounter on most scientific blogs don’t understand the chemistry principle of absorption and subsequent re-radiation. In fact very few people do understand it because if they did they would have raised the alarm bells ringing long time ago. But they all got stuck at Tyndall and Svante Arrhenius. …in a closed box!
They know that CO2 (carbon dioxide) “absorbs” in the 14-15 um region. Most people think that what it means is that the molecules absorbs photons here which then subsequently get transferred as heat to neighboring molecules. Then it absorbs again, and so on, and so on…and all the absorbed light is continuously transferred to heat…
Although this may happen up to a certain saturation point as soon as the light or radiation hits on the gas, that is in fact not what is causing the heat entrapment / cooling effect.
The best way to experience re-radiation is to stand in a moist dark forest just before dawn on a cloudless night. Note that water vapor also absorbs in the visible region of the spectrum. So as the first light of sun hits on the water vapor around you, you can see the light coming from every direction. Left, right, bottom up, top down. You can see this for yourself until of course the sun’s light becomes too bright in the darkness for you to observe the re-radiated light from the water vapor.
A second way to experience how re-radiation works is to measure the humidity in the air and the temperature on a certain exposed plate, again on a cloudless day, at a certain time of day for a certain amount of time. Note that as the humidity goes up, and all else is being kept equal, the temperature affected by the sun on the plate is lower. This is because, like carbon dioxide, water vapor has absorption in the infra red part of the spectrum.
We can conclude from these simple experiments that what happens is this: in the wavelengths areas where absorption takes place, the molecule starts acting like a little mirror, the strength of which depends on the amount of absorption taking place inside the molecule. Because the molecule is like a perfect sphere, we can calculate that ca. 62,5% of a certain amount of light (radiation) is send back in the direction where it came from. This is the warming or cooling effect of a gas hit by radiation.
Unfortunately, in their time, Tyndall and Arrhenius could not see the whole picture of the spectrum of a gas which is why they got stuck on seeing only the warming properties of a gas.
If people would understand this principle, they would not singularly identify green house gases (GHG’s) by pointing at the areas in the 5-20 um region (where earth emits pre-dominantly) but they would also look in the area 0-5 um (where the sun emits pre-dominantly) for possible cooling effects.
For comprehensive proof that CO2 is (also) cooling the atmosphere by re-radiating sunshine, see footnote below.
In all of this we are still looking at pure gases. The discussion on clouds and the deflection of incoming radiation by clouds is still a completely different subject.
So what everyone should be doing is looking at the whole spectrum of the gas molecule 0-20 um. Unless you come to me with a balance sheet of how much cooling and how much warming is caused by a gas, we don’t actually know whether a substance is a GHG or not. So, all that we can say now is that we don’t know what the net effect is of an increase in CO2 in the atmosphere…..
Seeing that CO2 also causes cooling by taking part in the life cycle (plants and trees need warmth and CO2 to grow), and because there is clear evidence that there has been an increase in greenery on earth in the past 4 decades, I think the total net effect of more carbon dioxide in the atmosphere could even be zero or close to zero. But unless we cone up with a test method and measurements, we will never know for sure.
FOOTNOTE
For proof that CO2 is (also) cooling the atmosphere by re-radiating sunshine, see here:
http://astro.berkeley.edu/~kalas/disksite/library/turnbull06a.pdf
They measured the re-radiation from CO2 as it bounced back to earth from the moon. So the direction was sun-earth-moon -earth. Follow the green line in fig. 6, bottom. Note that it already starts at 1.2 um, then one peak at 1.4 um, then various peaks at 1.6 um and 3 big peaks at 2 um. It all comes back in fig. 6 top.
This paper here shows that there is absorption of CO2 at between 0.21 and 0.19 um (close to 202 nm):
[not sure the reference is still valid]
There are other papers that I can look for again that will show that there are also absorptions of CO2 at between 0.18 and 0.135 um and between 0.125 and 0.12 um.
We already know from the normal IR spectra that CO2 has big absorption between 4 and 5 um.
So, to sum it up, we know that CO2 has absorption in the 14-15 um range causing some warming (by re-radiating earthshine) but as shown and proved above it also has a number of absorptions in the 0-5 um range causing cooling (by re-radiating sunshine). This cooling happens at all levels where the sunshine hits on the carbon dioxide same as the earthshine. The way from the bottom to the top is the same as from top to the bottom. So, my question is: how much cooling and how much warming is caused by the CO2? How was the experiment done to determine this and where are the test results?
I am doubtful of the analysis of the spectral data. I have not seen any work that convinces me. Namely, the level of incoming energy [below 1 um] is how many times higher than what goes up from earth [>10um]?
Even these simple evaluations of trapped energy versus deflected energy I do not find in any paper….
I would be interested in seeing an evaluation of trapped earth vs deflected energy. Nevertheless, the deflected energy represents only part of the radiations of the CO2 that is doing the deflecting. The rest of the radiation is emitted laterally and downwards. CO2 is ever a unidirectional emitter.
And CO2 does not absorb the visible light and ultraviolet radiation received from the sun. But these forms of solar energy warm the earth, which re-emits the warmth/solar energy as radiation in the infrared ranges. The CO2 absorbs this earthshine, and then re-emits it, again in all directions.
Eventually, the earth with re-emit as much solar energy as it receives — otherwise, we would burn up. But adding CO2 to the atmosphere means that more energy has to back up in and below the atmosphere before the Earth can emit enough energy to achieve its input/out energy balance.
eishhh
Jesse, you did not get it GHG 101 and I cannot help you further. I hope Ferdinand gets it.
henryp,
As B.S. chemical engineer, I was involved in the detection of chlorine in different parts of the processes as failure detection and around the factory as early detection of leaks. That was by radiation in the visible spectrum (chlorine is green…). Thus I know something about radiation, be it from a long time ago.
As far as I remember, there is a time lag between absorption and re-radiation. Thus when CO2 re-radiates it would be evenly in all directions, not more reflection like water drops in clouds.
Further during the time span between absorption and re-radiation, the CO2 molecule may collide with N2 or O2 molecules. That transfers the potential energy of the excitated CO2 molecule to kinetic energy of the other molecules and CO2 doesn’t re-radiate anymore, it heats the atmosphere up. The potential for collissions is higher at the air pressure in the troposphere, lower in the stratosphere. That is why CO2 warms the troposphere and cools the stratosphere…
My impression is that you misinterprete the earthshine spectrum in Fig.6 of your reference: the CO2 bands show absorption, not reflection, thus CO2 warms the atmosphere even with parts of the incoming sunlight…
the level of incoming energy [below 1 um] is how many times higher than what goes up from earth [>10um]
If the earth’s radiation is in balance, as much energy should go out as is coming in, or we are in big trouble (and not from that small influence of CO2…).
Ferdinand
there is no real great ‘mass’ in the atmosphere to absorb a lot of heat. Once the gas molecule is filled it can only act as mirror. You must understand that. With water {i.e. the oceans] it is different. Water absorbs the UV and IR [that gets through God’s window] and transfers it to heat [in the water] rather than re-radiating [most of ] it.
That is how I know that that whatever amount of high energy [i.e. UV and below} is let through, is what determines the [change in ] climate….
Look at the UV coming through the atmosphere and you know what the climate is going to be….
Maybe ren has a comment on that?
henryp:
Once the gas molecule is filled it can only act as mirror.
Huh? Never heard of such mechanism… Do you have some background info on that?
Further, the heat content of the atmosphere is relative small (compared to the oceans), but an increase of temperature at a certain height propagates over the full air column (at a fixed lapse rate) down to the surface (for the same convection rate)…
Ferdinand Engelbeen @ October 24, 2017 at 11:09 am
“Further during the time span between absorption and re-radiation, the CO2 molecule may collide with N2 or O2 molecules. That transfers the potential energy of the excitated CO2 molecule to kinetic energy of the other molecules and CO2 doesn’t re-radiate anymore, it heats the atmosphere up.”
Yes, but the process also works in reverse. The kinetic energy of N2 or O2 molecules can be transferred to the vibrational states of the CO2 molecule, from which it can then radiate away. So, there is a cooling, as well as a heating, potential from each CO2 molecule, and both potentials increase with increasing concentration.
The net impact depends then on which process dominates, the heating, or the cooling?
Bart,
Agreed that collissions can go both ways, but as measured in laboratories (HITRAN) at different air pressures and mixtures of air + GHGs, CO2 normally heats the atmosphere in the troposphere and cools the atmosphere in the stratosphere…
Doesn’t take into account convective air currents. Laboratory experiments are just not sufficiently scalable to be extrapolated to the Earth’s entire atmosphere.
Bart:
Doesn’t take into account convective air currents. Laboratory experiments are just not sufficiently scalable to be extrapolated to the Earth’s entire atmosphere.
For the same convection at the same height, the temperature of the air in the troposphere will increase. WIth the same lapse rate, that leads to a warming surface. On the other hand, warmer air and/or surface will increase convection…
The only point which is measured is that both the outgoing IR in the CO2 bands and backradiation show that part of the outgoing IR energy is absorbed by the atmosphere and in part sent back to the surface. The difference in energy anyway must heat the atmosphere…
“The only point which is measured is that both the outgoing IR in the CO2 bands and backradiation show that part of the outgoing IR energy is absorbed by the atmosphere and in part sent back to the surface.”
Yes, but this is a gross measure, not an incremental one.
Think of a parabolic arch, e.g., such as you would get throwing a stone into the air. Everywhere on the parabola, the stone is above the ground, i.e., the function is everywhere positive.
However, there is a point of maximum height, after which the stone is less high than it was before. A line drawn from the origin to the position of the stone is a secant line. Its slope is everywhere positive. It tells you the average change in height of the stone over the distance measured. But, if you want to know how much the height is changing per increment of distance, you have to draw a tangent line. And, the slope of the tangent line is not always positive. In fact, it goes decidedly negative after maximum height is achieved.
Just so, the GHE is everywhere positive. There is always a dip in the OLR spectrum. A secant line drawn on the graph of impeded OLR versus CO2 concentration will always have positive slope. But, what we are looking for is the incremental change in impeded OLR for a given increment of change in GHG, and there is no guarantee that the slope of that line is always positive.
There has been no systematic study, as far as I can tell, of incremental sensitivity. Indeed, I do not think there are data actually suitable for such a study, controlling for other factors besides the rise in CO2. The data would have to have global coverage, consistently gathered over time, with data for all confounding factors also available. We just don’t have it.
I have seen a few studies which purport to show increasing sensitivity, but A) they are generally regional in scope, and B) in fact, they show changes that are consistent merely with a change in the outgoing radiation spectrum due to the change in temperature alone.
Bart says
Think of a parabolic arch, e.g., such as you would get throwing a stone into the air. Everywhere on the parabola, the stone is above the ground, i.e., the function is everywhere positive.
Henry says
Bart, Ferdinand
Sorry. I honestly don’t get it. Or you don’t..I don’t think this is a good representation of what is happening.
We are talking about incoming radiation being deflected away to space 25-30% and upgoing radiation trapped 70-85%,
https://wattsupwiththat.com/2017/10/20/what-crisis-global-co2-emissions-stalled-for-the-third-year-in-a-row/#comment-2645525
right?
Don’t make it too difficult. Think of the molecule acting like a mirror at certain wavelengths.
If you claim that the net effect of more CO2 is that of warming rather than cooling you must come up with the test results or the proof that the heat trapped at 14-15 um caused by the CO2 is more than the heat deflected away from earth by the CO2 0-5 um.
[there are absorptions of CO2 in the UV – which is how we can measure it on other planets – and 1-2 um and 4-5 um]
remember that the ‘spectral intensity’ shown in my graphic is out of scale, i.e. the energy coming from the sun should be shown 20x bigger than what goes up from earth, looking at K…
If you genuinely believe that more CO2 causes some [more] warming you must have that report to show it?
Mod – my response appears to be lost in the queue. Could you please look for it? Thx.
I don’t think it’s an issue of incoming light being deflected, Henry. The amount of sunlight coming in that that wavelength is very small.

What we are talking about is this. The total amount of radiated energy leaving the Earth has to balance the incoming to achieve equilibrium. That is, the total area under the curves depicted above has to match.
CO2 takes a divot out of the curve at the right.

So, to get the same area, the curve has to move upward compared to what it would be if that divot were not taken out. And, that means temperature of the surface will have to increase in order to move that curve higher.
Standard thinking is that, that divot will get deeper if you increase the CO2 concentration. The inescapable conclusion is that this will force surface temperatures to rise to a greater level to boost the curve higher, and reestablish equality of area under the curves.
However, what if that prima facie conclusion is wrong? What if the initial impact of concentration is to make the divot deeper, but beyond some concentration level, it doesn’t actually get deeper, and perhaps even shrinks? How could that come about?
What I am suggesting is that, initially, the CO2 does impede outgoing radiation, and does create a divot. But that, beyond a particular concentration, the CO2 molecules may start collecting as much heat from the ambient atmosphere, and radiating it away, as they intercept from the surface, and prevent from leaving.
In that case, the heating tendency and the cooling tendency are balanced, and you are at a maximal heating potential. Sensitivity to changes in concentration would be zero at that point. Net warming would only be infinitesimally reduced to either side of that critical concentration level. We would be, analogously, at the top of that parabolic arch, with no further increase in that direction achievable.
@moderator
Thanks!
Ferdinand
You don’t need background information of what you can see is happening?
If you put your brights on in misty humid conditions, the light is immediately returned to you, blinding you in the face? this never happened to you?
Like I said,
there is not enough mass in the atmosphere to be the cause of a change in climate….
Man made warming is a hoax perpetuated by men feeling guilty about their car- and aviation trips…
henryp,
What happens in the mist is that water drops, which are spheric, reflect light. As good as glass pearls do or anything spherical that is tranparant for light and has a sufficient light breaking index.
That mechanism doesn’t work for single molecules: either a photon of the right wavelength is absorbed or it passes by if not of the right wavelength. As far as I know there isn’t something like reflection by CO2, as that doesn’t cluster in spheres as there is no condensation of CO2 in the earth’s atmosphere…
Ferdinand/Jesse
https://www.bing.com/images/search?q=emission+spectrum+earth+sun+atmosphere&id=EB58DD1D3D266F84DB4865AA002B1DF2D9E22CE0&FORM=IQFRBA
http://www.barrettbellamyclimate.com/userimages/Sun2.jpg
Ferdinand
water vapor is a gas. No need to make a distinction because of some special properties of water.
Like I said, go to a forest and watch the sun coming up. It is an amazing thing to experience re-radiation.
carbon dioxide is a gas. Note that in the graph I show in the above comment, looking at the area where CO2 re-radiates and the sun emits, i.e. below 5 um: the total surface area is more or less the same area as what we have in the earth’s emission spectrum where CO2 absorbs between 14 and 15 um.
However, the energy below 5 um is many time higher than that of 15 um energy. Note that water vapor also absorbs a bit 14-15 um….
So, CO2 reflects, deflects, back -radiates, re-radiates (whatever word you prefer) a very similar amount of radiation as what it traps [on earth]. In fact, looking at it again now, I would say the net effect of more CO2 in the air is probably that of cooling rather than warming. Remember that the spectra of the sun and earth are not on scale [looking at K], but there is a factor of about 20 x difference (in K) between the sun and earth.
But like I said before, there is no mass in the atmosphere and what we are talking is about 0.01% of the mass of the atmosphere as a result of human activities. That cannot possibly be a cause of any warming.
It is utterly ridiculous to keep hanging on to a theory that cannot be correct?
[“Absorption” is also a word that brings some confusion to the argument. Originally we used the word extinction, if I remember correctly]
henryp,
The reflection of light when there is mist is not from water vapor, it is from water drops, that is een essential difference. Light scattering in the morning is from both water drops and ice even extremely high in the atmosphere and partly from re-radiation.
Further, no matter if it is from incoming sunlight and NIR or outgoing IR, both water vapor and CO2 absorb photons of the right wavelength. Depending of the ratio re-radiation (equally in all directions) and collissions, that warms the atmosphere or does sent half of it back towards space and half towards the earth’s surface.
As both the drop in outgoing radiation and increase in backradiation from CO2 were measured, the difference between outgoing radiation from the surface and what is re-radiated and lost to space is the energy that heats the atmosphere. That is not zero, or you are destroying energy.
Any change in temperature at the same height in the troposphere gives a shift in temperature at the surface, as long as the lapse rate and the convection remain the same. The sum of backradiation reaching the surface and the shift in temperature of the troposphere is what heats the surface.
So, while the effect is proven small, you can’t say that CO2 gives more cooling than warming…
http://www.sciencedirect.com/science/article/pii/S0896844605000343
https://refractiveindex.info/?shelf=main&book=CO2&page=Bideau-Mehu
http://www.dictionary.com/browse/refraction
http://www.biocab.org/Emissivity_CO2.html
https://www.merriam-webster.com/dictionary/emissivity
http://web.physics.ucsb.edu/~lgrace/chem123/troposphere.htm
I’ll just say I’ve been following your thread for days now. With the ideology of CO2 and water vapor acting like a mirror “Reflecting” when “Refracting” and “Deflecting” and ‘Emissivity” is happening in these gases in constant chaotic movement in the atmosphere there is no single direction heat is directed in a molecule in chaotic rotation and movement in every direction, like in a lab experiment that gives the controlled environment to obtain refraction, etc… Just because the experiment said the infrared was (refracted) directed down as it was passing through a CO2 molecule in this controlled condition of a vacuum still air and a set direction of the light to pass into it, doesn’t mean it reacts like it in a chaotic air. Therefore in the case of mist or fog those molecules hit with light are not “Mirrored” they are “refracting” (bending) the light passing through in a chaotic movement of the molecules that redirects the light back to your eyes, as other molecules are hit with the same light (photon) that passed through other molecules, and so on. Only a fraction of the heat is retained in a molecule for a given time, while more is passing through it in refraction, or deflected from it when it hits the molecule at an angle and doesn’t penetrate it – which is the only real mirror effect that happens and that light is directed away from the source of the light on a sphere.
johchi7,
I agree about refraction as main mechanism in reflection in liquids or semi-liquids like supercritical CO2, but I disagree on CO2 as gas or water as vapor: while there is of course refraction for all wavelengths that are not aborbed, any photon that is absorbed and exitated a CO2 or water vapor molecule can leave the same molecule as a new photon in any direction, with equal probability…
Of course there is the 50:50 ratio of where it goes to or away from the surface of the Earth. Just as the higher up the molecules are increases the probability going away from the surface. As the closer to the surface increases the probability of it toward the surface. Just as the closer to the surface increases the probability that it gets caught by a sink. The higher it goes in the atmosphere the less likely it touches any sink and remains in the atmosphere longer. Time to go to work… Oh. Although it’s a different mechanism of how light reacts on something. Because it really is a reflection and not a refraction. Colloidal suspension of partials in a solution hit with a beam of light is observed by looking through the beaker at an angle to that light direction. Because the particles are in motion. Much like gases in the atmosphere are in motion. The light direction is changed upon refraction and their movements.
henryp, I am interested in your contention that there is no mass in the atmosphere. The atmosphere does, incontestably, contain a lot of nitrogen and oxygen, and a miscellany of other elements. How is it that these elements, once they become part of the atmosphere, lose all their mass?
Jesse
Indeed the atmosphere consists of mostly N2 and O2 and these two gases are fully permeable i.e. they cannot absorb any photons, also not from the re-radiated wavelengths of H2O or CO2. It just passes through.
That leaves the so-called GHG’s, which I think make up for about 0.5% of the atmosphere. But what you are saying is that the 0.01% of CO2 that was added in the past 50 years is causing the warming of the whole earth? There is no mass?
Interestingly, my findings show that the so-called global warming has not at all been global. On average, there was no warming in the SH. It is all taking place in the NH>>>
How do I explain that [to myself?]
Come down 1 km down into a gold mine here and I show you the elephant in the room, which has been moving…. Now, down there, there is your mass. And don’t forget the oceans……
Your 0.01% more CO2 in the atmosphere is not doing anything but help plants and trees and crops grow better.
Ferdinand, Jochi
The absorption spectra of water vapor and water [whatever in between form] are almost identical.
Anyway, my example of the light on bright is an illustration of what happens when you cannot see re-radiation..
But we did measure the actual re-radiation from water in the earth shine, remember? Fig 6. Bottom.
Now where is your report showing us the balance sheet of how much energy is deflected by the specific GHG to outer space 0-5 um and how much is bounced back to 5-15 um?
henryp,
You should consult the spectra of liquid water again… The transparancy of water for different colors in the visible spectrum is quite diverse and absolutely different from that of water vapor in the atmosphere:
https://en.wikipedia.org/wiki/Electromagnetic_absorption_by_water
Not only for visible light, but also for UV and near IR.
And you misinterpreted Fig.6 in the earthshine report: it shows the absorption of near IR by CO2 in the 0-5 microm band, not the reflection, which BTW is small, as the absorption bands of CO2 are in the NIR where the sun’s energy is fading to near zero…
Ferdinand,
I am not sure if you are interested in genuine debate or if you want to keep confusing issues?
Let me know.
Up to 2 um the ‘absorption’ spectra of liquid water and water vapor look pretty much the same to me.
In fact in the earthshine report, that I mentioned, they just show H2O, i.e. no distinction between vapor and liquid….
Up to 2 um is also where most of the incoming energy comes from… it enters the ocean, is absorbed and re-radiated, but it disperses as heat – because here is mass – and that keeps us warm…
Now you say.
it shows the absorption of near IR by CO2 in the 0-5 microm band, not the reflection (sic)
I am assuming you don’t understand what is happening. I have done many measurements of substances and elements in gases and in liquids. Obviously one does that at the wavelengths where big ‘absorption’ takes place. In the case of CO2, in N2, you measure at 4.6 um. What actually happens during these measurements is that the light scatters – i.e it does not pass the cuvette – and the scattered light is picked up by the sensors.
What you guys and the ‘books’ are saying is that the light is not scattered, but it is ‘absorbed’ and is ‘transformed’ to heat [in the atmosphere]. This is, in fact, not at all what is happening. If it were, I think I should have seen many explosions as many times I forgot the spectrometers on after measuring and if what you guys are saying were true, the cuvette should have exploded?.
What happens is this: at the wavelengths where absorption takes place the light is sent back , by my calculation, 62.5% in the direction where it came from. The rest is scattered in all other directions. Hence we are able to pick up that same radiation via the moon coming back to us.
If you don’t get it, take the time to again read all my comments on this thread.
henryp,
OK, I now see what you mean…
If the layer of CO2 is thick enough, it is almost opaque in the wavelengths where CO2 is active. In that case the absorption and re-emission is so high that some more IR in these bands is emitted back than diverted towards other directions, as in the forward direction another CO2 molecule will do the same job. Just a matter of probability. That is backradiation, which is the same ‘mechanism as for the earths surface IR going outwards.
In the case of CO2 in the atmosphere, I suppose that the concentrations are a lot smaller and that the probability of collissions with other molecules – in the troposphere – is a lot higher, transferring energy to these molecules, thus increasing the temperature of the air.
Your use of the word “reflection” was rather confusing, as that is sure for light and water drops, not for vapor, where the main action is more backradiation…
With the whole spectrum of scientific advances in less than a century not being able to prove what is happening in our lower troposphere…you want proof of how much is escaped or returned? The problem is that alarmist – on any side – jump to conclusions when new information is found and in reality proves nothing in a chaotic environment with constantly changing variables. Scientific advances have just not reached a point that can answer most questions. Which is why “models” have failed to be accurate. To answer your question may take an unknown time for science to get that far with any accuracy.
Do you guys think this whole thing was an attempt by Goldman Sachs to commodify Carbon and have it traded on the stock market?
Ferdinand
…..transferring energy to these molecules, thus increasing the temperature of the air.
Please explain to me how that works? Since O2 and N2 is permeable to to re-radiated shine of the H2O and CO2?
henryp, That’s a good question. I’ll venture an answer, even though you did not direct the question to me.
One way that molecules can transfer heat to each other is by collision. So that is how O2 and N2 could gain heat by collision with H20 and CO2.
But they could also gain heat by the “re-radiated shine” from the H2O and CO2. This is because the H2O and CO2 would be re-radiating the shine as infrared, and not in the original wavelength of the “shine”.
It’s important to note that when a body absorbs electromagnetic radiation and re-emits it, the re-emitted radiation is not necessarily in the same wavelength as the absorbed radiation. The wavelength of the radiation that a body emits depends on the temperature of that body; the hotter the body, the shorter the wavelength. That is why the sun emits short wavelength radiation (visible light, ultraviolet radiation, and some infrared) while the earth, which is far cooler, emits mostly infrared.
This principle makes the greenhouse effect possible. The atmosphere is transparent to most short wavelength radiation coming from the sun, but is not transparent to the infrared radiation that the earth emits after absorbing visible light, etc.
Actually, much incident sunlight is also in the IR range.
OK. I will think about it and get back to you on that. But you guys must tell me first whether the net effect of more ozone in the atmosphere is that of warming or cooling. If you chose cooling, would you then agree with me that ozone is not a GHG but rather an anti green house gas?
Henryp
Not so simple as you may think.
https://www.ucar.edu/learn/1_5_1.htm
“Good up high, bad near by.” it is a GHG in the troposphere where it is just a trace gas. But it is what blocks the a lot of the UV radiation from entering the troposphere – along with Oxygen it is in constant change from one to the other.
No. Nonsense. [no sense]. There is no good or bad ozone. It behaves the same, either if hit by sunshine at 1 km height or at 40 km.
Same with the earthshine. The way from the top to the bottom is the same as from the bottom to the top.
As per my determinations (see graph) , ozone has been going up both in the Nh and the Sh since about 1995. .And as you can see it seems to follow a sine wave, similar to that of the solar polar magnetic field strengths. As I said, ozone, peroxide and N-oxide are manufactured from the most energetic particles from the sun. Without we’d be dead,e.g. don’t go to Mars…
So, I repeat my question: what would be the net result of more ozone in the atmosphere: warming or cooling?
Let me know.
henryp,
As Jesse already said, that is a matter of collisions between an excited CO2 or H2O molecule and O2 or N2. That shifts the energy of the CO2 molecule to the others and CO2/H20 has not enough energy left to re-radiate. Thus the air temperature increases, as “temperature” is the average kinetic energy of all molecules in a gas.
As Bart said, that is not only one-way: if there are collissions between “hot” O2 and N2 molecules with CO2, the latter can be excited and can send out an IR photon in its own wavelength.
Which one is leading is a matter of average gas temperature and gas density. In the troposphere more CO2 leads to warming, in the stratosphere to cooling.
Some background:
http://aip.scitation.org/doi/abs/10.1063/1.1672337
BTW, do you know the pages of Barrett & Bellamy? Very interesting in-depth analysis of radiation by GHGs:
http://www.barrettbellamyclimate.com/index.htm
Ok. So we are all agreed now that more ozone prevents more UV (heat) coming into the oceans.It is an anti greenhouse effect.
Hence, we do know of at least one mechanism on why it is [has started] cooling:
http://wattsupwiththat.com/2017/10/28/inconvenient-oceans-continue-to-cool/
On the CO2, Ferdinand says
in the troposphere more CO2 leads to warming, in the stratosphere to cooling.
end quote
As I said, it does not matter what happens at different layers of the atmosphere. The sun’s and the earth’s emission hits the gas the same way, wherever, In any case, various measurements have established that the CO2 mixes quickly to about the same concentration everywhere in the atmosphere.
I already proved that the CO2 deflects some light from the sun and more of it means that more light will be back radiated to space. The only absorption in earth’s spectrum is 14-15 um and it is already doubtful that the energy back radiated to earth by the CO2 is even equal to the amount back radiated 0-5 um.
There is another consideration that we must make in the case of CO2. We know for sure that photosynthesis extracts energy from the atmosphere. We also know that earth has been greening quite dramatically over the past decades, both on land and in the oceans. As CO2 takes part in photosynthesis it stands to reason that we must argue that more life i.e. the CO2, is cooling the ocean and land.
Given all these facts it stands to reason that I will argue that the net effect of more CO2 in the atmosphere must be cooling rather than warming, or, at the very least, is close to zero.
OTOH the extra greenery traps some moisture on land and that? traps some heat but we must not confuse issues, i.e. causes and effects.
Which brings us to the H2O….
Some other time perhaps.
https://co2insanity.com/2011/09/04/top-scientists-in-heated-debate-over-%E2%80%98-slaying-of-greenhouse-gas-theory/
CO2 does not evenly mix in the atmosphere… Ever. CO2 loses the heat it takes in, in milliseconds. And yes when during photosynthesis heat is removed from the air but by transferring to heat generated by the flora. There is a cooling effect where CO2 is in high concentrations – by displacing the other lighter gases – like how dry ice is formed out of CO2…that can lead to fast drops in temperature. Such as high concentrations of CO2 in forested areas being hot during the sunlight hours that drop temperature after sunset, due to the fast release of heat from the molecules and the stopping of photosynthesis. Sunlight hours being less than darkness hours over the majority of Earth allow for more cooling of the Atmosphere. So the higher the Ozone content the more the sunlight is blocking UV but not IR that causes CO2 and Water Vapor to heat up for the shortest period during where the sun is shining then moves into darkness where it cools over a longer time. But those are just 2 parts of the total atmosphere where many others have their cooling and warming affects. The Solar Minimum and Earths reduced Magnetic Field are the greatest part of it all.
johchi
CO2 is heavier than air but it quickly diffuses.
most stations measure around 400 ppmv now with each station an almost constant deviation from each other, as well as depending on season, Check NOAA/
I believe just about anybody that has been on WUWT understands those variables. Just as their are few that deny that CO2 has gradually increased since those have been recording the measurements. And the spectrum of those concentrations of CO2 as taken from space show that CO2 is not uniformly distributed. At surface level higher concentrations are in the lower elevations of the troposphere do to gravity and pretty much becomes thinner at high mountains tree lines where they don’t support life of larger flora…and it is much colder above those elevations even in summer of that hemisphere. There is CO2 above 2X global average in forested areas than in most cities that burn fossil fuels. So which one produces more? We should all know that humans create little in comparison and that Bio-Mass creates more CO2 exponentially as it exponentially increases the Bio-Mass. But temperatures have flatlined and in reality decreased globally with the increase of CO2. While making deserts greener and longer growing seasons creeping toward the poles. It therefore makes it logical that the cooling is more equatorial and the warming more polar-ward as CO2 increases. That sea levels have slowly increased by some measurements as polar ice has increased in volume, so has the water vapor in the atmosphere causing more equatorial rain as evidence of more heavy rain caused mud slides, etc. Solar flares linked to cyclones and hurricanes creation that bring the heat fron ocean sufaces into the stratosphere where it cools to form rain. Just as tornadoes and dust devils form to do the same heat transfer. The whole of the matter is science at this time cannot say with any accuracy what to expect in the future. There are just too many variables with no answers. We can bicker and contemplate and discuss all we want and still come up short of solutions. We all seem to have our theories from what we hypothesize…that is science today on climate changes and why there is no end to discussion of it, until more is known.
Sorry after sending I realized some spelling errors.
Bart
this misunderstanding is such a pity/
the first graph you show is out of proportion, just like mine:
https://wattsupwiththat.com/2017/10/20/what-crisis-global-co2-emissions-stalled-for-the-third-year-in-a-row/#comment-2645525
the incoming energy is 20 x greater than outgoing [just looking at K]
the 2nd graph is about the energy trapped on earth, which is clearly being more trapped as CO2 and H2O is increasing due to a) more heat coming in and b) burning of fossil fuels
essentially, the warmist’s argument rests on this argument
1) it is getting warmer
2) the sun (TSI) is the same
3) ergo, we are making too much GHG on earth…
My results show there is no warming since about the new millennium if you look at the rate of change in T (maxima and minima) . There is some warming in the NH due to the movement if earth’s inner core [aligning itself with the sun’s?]
so, I am predicting that
1) it will be getting cooler
2) TSI might be looking the same i.e the area under the chi-square distribution might stay more or less the same, but the whole graph might move a bit to the right or to the left, depending on the various SC’s giving you a different set of concentration of ozone / peroxide / N-oxide products TOA
.
https://www.bing.com/images/search?view=detailV2&ccid=ggnsHcMV&id=BE8A7343651A6868631F98A8394D74518D0615AF&thid=OIP.ggnsHcMVbUi0tV1J-ymOMwHgFJ&q=emission+spectrum+earth+sun+atmosphere&simid=608012262521569882&selectedIndex=3
3) ergo, there is no man made global warming. It is all God’s window up there.
henryp, “A little learning is a dangerous thing.” You would be better off knowing nothing at all about this subject, rather than having gotten just a taste of it — enough to weave implausible demonstrations of the mistakes of the dedicated scientists who have worked long and hard to increase our understanding of global warming and climate change. You breezily dismiss the hard won insights of these scientists with simplistic proofs based on your own misunderstandings of the science. Part of being educated is having a realistic appreciation of just how little you know. Maybe you should work on that first.
Jesse
I analysed the daily data of 54 weatherstations
balanced on latitude to zero
maxima, minima and means
https://wattsupwiththat.com/2017/10/20/what-crisis-global-co2-emissions-stalled-for-the-third-year-in-a-row/#comment-2642525
what exactly did you do to prove to me that [a great part of] the warming observed is man made?
as you can see, by my results there is 100% correlation looking natural –
Failing the publication of your results [or even that of your followers showing me the balance sheet of the warming / cooling of each of the GHG’s]
It follows [from my results] that there is no man made warming.
Live with it/
Jesse,
tell me where you live and I will make a quick determination whether or not temperature in your area has been going up or down.
(always good to start in your own backyard)
Most great thinkers are or were not part of the ‘great’ majority, so always be ready re-think.
We are talking about “global” warming so it doesn’t make any difference whether it’s been getting warmer in one particular place. The warming hasn’t been uniform across the globe.
I will say that the rhododendron in our front yard is blooming about three works earlier than it did when we first bought our house in 1991.
As for thinking that you must be a great thinker because you differ in opinion for the large majority of experts in a field — it’s certainly a pleasant daydream, but it doesn’t pan out very often. Mostly it’s cranks and crackpots who take issue with well-established opinion on a difficult subject. If this were not the case, then the locus of intelligence in the world would be in the Flat Earth Society.
Jesse says\
The warming hasn’t been uniform across the globe.
Jesse
that is my point, is it not?
I am assuming you also live in the SH where there has been little or no warming.
If it were the CO2 doing it, it must be global, should it not? As the CO2 is rising globally, at very predictable rates, as Ferdinand will show you,
True, we cannot have ‘an election’ about science.
You only need one man to get it right….
I am not saying I am the Truth. Only God can make such a statement. But I am looking at my big 4 x 4 with its big wheels and I am not feeling guilty anymore to drive around up the hills just for pleasure, me and my dogs.
Good luck to you too..
henryp, The surface temperature of the Earth has never been uniform and never will be. Latitude, geography, wind patterns, and a host of other factors cause local variations. What increasing levels of CO2 do is raise the average surface temperature.
There’s no point in feeling guilty — that accomplishes nothing. But if we each did a little to cut down on our carbon emissions, together we would all be doing a lot.
I am a senior citizen and don’t expect to live to see the worst consequences of man-made global warming. But like the old man who plants trees to provide shade for later generations, I hope to do what little I can to ward off, or mitigate, the coming calamity.
Jesse
I have plotted RSS versus the warming of the oceans. As you see can it warmed a bit. Is it about 0.3 -0.4?
http://www.woodfortrees.org/graph/hadsst3gl/from:1987/to:2018/trend/plot/rss/from:1987/to:2018/trend/plot/esrl-amo/from:1987/to:2018/trend/plot/rss/from:1987/to:2018/plot/hadsst3gl/from:1987/to:2018
Now what you and others are saying that this warming of the air and the oceans is caused by the 0.005% of CO2 that was added to the atmosphere since 1987….
You are talking about a tiny little change in the mass of the atmosphere can can change the T of such an enormous mass of water.
Don’t you honestly see how ridiculous such an assertion is?
My own results also show same warming of earth at around 0.012K per annum but only after I include the NH. there was no warming in the NH. Total warming in the NH must therefore be around 0.024K / annum.
Like I have said before, besides your CO2 there are at least three other options that are very much more likely to be the cause of warming, i.e.
1) the window of ozone/peroxide/N-oxide manufactured allowed more heat (UV) into the oceans, making them a bit warmer.
2) the elephant in the room is moving – north east to be precise. Come down 1 km into a gold mine here in South Africa and you will quickly realize how big that elephant really is..
3) I have noted in places where they turned a desert into an oasis, like Las Vegas, minima rose sharply over the past 40 years. OTOH, where they cut the trees, in Tandil, ARG, minima sharply fell. So, this is one of the most ironic of my findings: we all want more trees, lawns and crops, yet this traps heat – as a matter of fact. The same can be said for the oceans – that are also getting greener, apparently.
So, I don’t know anymore what to say. 1) and 2) indicate that warming is natural. You cannot stop the sun and you cannot stop the elephant. I think we are lucky that God gives us more warming these days.
3) indicates that if you want more greenery it will trap some heat. What do want us to do about that?
“there was no warming in the NH”.
sorry, that should be:
there was no warming in the SH.