Drought likely to persist in northern Plains
Forecasters at NOAA’s Climate Prediction Center released the U.S. Winter Outlook today, with La Nina potentially emerging for the second year in a row as the biggest wildcard in how this year’s winter will shape up. La Nina has a 55-65 percent chance of developing before winter sets in.
NOAA produces seasonal outlooks to help communities prepare for what’s likely to come in the next few months and minimize weather’s impacts on lives and livelihoods. Empowering people with actionable forecasts and winter weather tips is key to NOAA’s effort to build a Weather-Ready Nation.
“If La Nina conditions develop, we predict it will be weak and potentially short-lived, but it could still shape the character of the upcoming winter,” said Mike Halpert, deputy director of NOAA’s Climate Prediction Center. “Typical La Nina patterns during winter include above average precipitation and colder than average temperatures along the Northern Tier of the U.S. and below normal precipitation and drier conditions across the South.”
Other factors that influence winter weather include the Arctic Oscillation, which influences the number of arctic air masses that penetrate into the South and is difficult to predict more than one to two weeks in advance, and the Madden-Julian Oscillation, which can affect the number of heavy rain events along the West Coast.
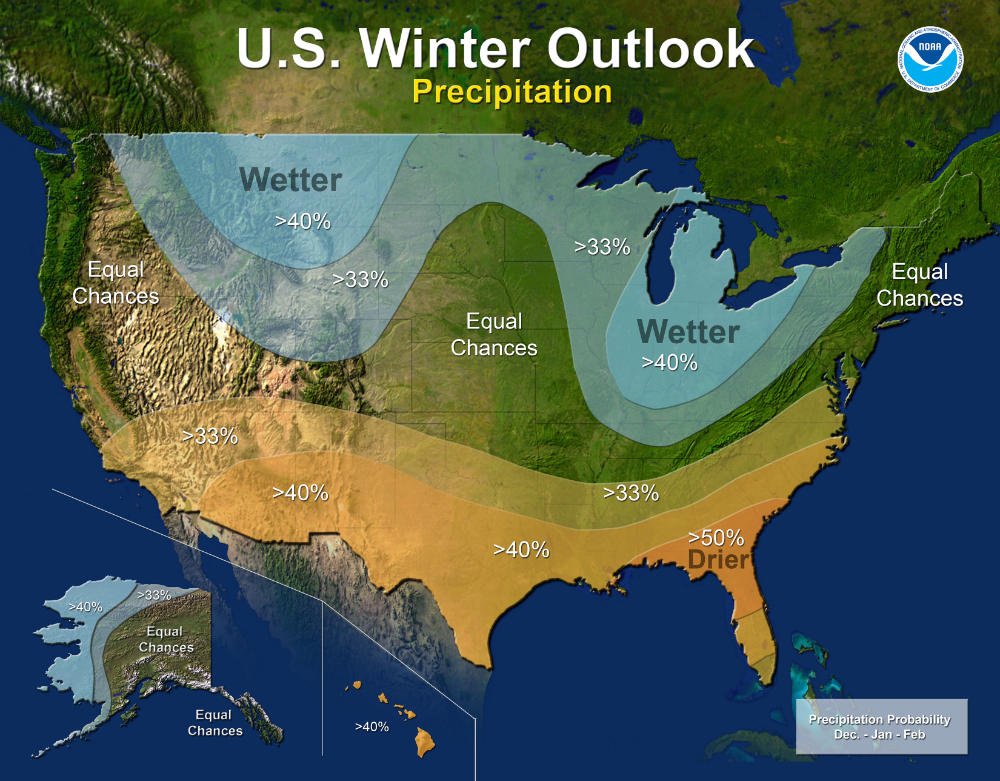
The 2017 U.S. Winter Outlook (December through February):
Precipitation
- Wetter-than-average conditions are favored across most of the northern United States, extending from the northern Rockies to the eastern Great Lakes, the Ohio Valley, in Hawaii and in western and northern Alaska.
- Drier-than-normal conditions are most likely across the entire southern U.S.

Temperature
- Warmer-than-normal conditions are most likely across the southern two-thirds of the continental U.S., along the East Coast, across Hawaii and in western and northern Alaska.
- Below-average temperatures are favored along the Northern Tier of the country from Minnesota to the Pacific Northwest and in southeastern Alaska.
- The rest of the country falls into the “equal chance” category, which means they have an equal chance for above-, near-, or below-normal temperatures and/or precipitation because there is not a strong enough climate signal in these areas to shift the odds.

- Despite the outlook favoring above-average precipitation this winter, drought is likely to persist in parts of the northern Plains, although improvement is anticipated farther West.
- Elsewhere, drought could develop across scattered areas of the South, mainly in regions that missed the rainfall associated with the active 2017 hurricane season.
NOAA’s seasonal outlooks give the likelihood that temperature and precipitation will be above-, near, or below-average, and also how drought is expected to change, but do not project seasonal snowfall accumulations. While the last two winters featured above-average temperatures over much of the nation, significant snowstorms still impacted different parts of the country. Snow forecasts are generally not predictable more than a week in advance because they depend upon the strength and track of winter storms. The U.S. Winter Outlook will be updated on November 16.
A video of NOAA’s 2017 Winter Outlook is available here.
So… basically we’ve spent billions to get results equal to a coin flip.
Maybe a little better than a coin flip… we’ll see.
Perhaps a Dart throwing Monkey
yep…and the last time I checked….snow was water
Nope! EPA has determined snow is a pollutant and is not counted as precip.
But without the billions spent we’d have no idea it’s come down to a coin flip.
Actually… It is a model of a coin flip.
“So… basically we’ve spent billions to get results equal to a coin flip.”
A coin flip would be a seasonal forecast more than a year from now. As we get closer to the forecast period, we can refine the odds based on numerous factors that appear to be or are emerging that have historically and physically effect the outcome of weather patterns over a long enough period to make a difference in the average during that period.
During US Winters, La Nina and El Nino, especially if strong can have the most powerful influence on weather over a 3 month period average.
This latest forecast is highlighting the potential, proven historically correlations………based on regions. If you are in between 2 regions, one is cold, the other is warm from a typical La Nina Winter and there is an equal chance of it being warm or cold from a La Nina, this is not necessarily a coin flip.
It could mean that a shift in the pattern from a stronger or weaker La Nina than expected means that the area outlined in todays forecast will also shift.
If the AO or NAO is definitively negative, then the La Nina effect can be enhanced as the 2 work in tandem in some areas to bring cold down. If the AO or NAO is strongly positive(upper level ridge in the Northeast for instance), then this can overwhelm any La Nina signal in areas that would otherwise be cold…….but end up warm.
A coin flip represents independent odds that are 50% of landing one side each time and every time.
A seasonal weather forecast is very DEPENDENT on numerous elements/teleconnections, ocean indices and historical tendencies that are constantly changing. Cumulatively, they WILL add up to(equal chances of warm/cold or equal chances of wet/dry vs average) in some places in most forecasts but this is not for the same reason for 50-50 odds in flipping a coin.
Another item too is that there is not just 2 categories to consider as in a coin flip. There are 3 chances/categories considered: above, below and equal. So a 40% chance of warmer than average may have the highest probability of the 3 and be shaded with a warm, light orange color, even though the probability of normal to below normal added together are higher at 60%.
It’s only above >50% does the category exceed the combination of the other 2 combined. Obviously, as you head into the core/epicenter of the regions with the highest probabilities, the confidence/skill in using a seasonal forecast product like this usefully goes up.
For the Winter season, a strong El Nino often yields the highest skill for regions downstream. This Winters expected weak La Nina has resulted in cooler than average, (just above 40% along the northern tier with the light blue shade). This means actually that normal to above normal combined are slightly higher because they add up to more than a 50% probability.
If the La Nina is predicted to strengthen more in a month than the current outlook for the La Nina this Winter, the next forecast will likely have more blue in it.
https://m.youtube.com/watch?v=HQfzwFloVqA
Here is another good way to view the forecast to ascertain some use:
http://www.cpc.ncep.noaa.gov/products/predictions/multi_season/13_seasonal_outlooks/color/t.gif
Note that the cold anomaly from D-J-F grows/expands in J-F-M 2018.
What does this tell us?
Compared to average, the 2nd half or end of the upcoming Winter is expected to be colder than the middle 3 months of Winter.
The F-M-A cold anomaly pulls back a bit but is still greater than the D-J-F cold anomaly in blue.
When we get into the Spring and especially Summer in the US, the La Nina correlation is strongest(with a strong La Nina) with regards to suppressing rains in the Plains and sometimes Midwest.
However, going out that far on regional precip is more like flipping a coin. Everywhere but the Northeast has equal chances for J-J-A of 2018. There must be a reason for the green in the Northeast that far out but I wouldn’t attach alot of significance to it.
http://www.cpc.ncep.noaa.gov/products/predictions/multi_season/13_seasonal_outlooks/color/p.gif
One final note. The N-D-J seasonal forecast below has no cold/blue anomalies. With that period front loaded in early Winter weather(some late Fall) and as noted previously, the blue’s show up a month later, in the D-J-F from this article, then expand and peak in the J-F-M 2018 seasonal outlook, we can assume that the models(forecast) expect the Winter to get colder vs average/normal as it progresses.
http://www.cpc.ncep.noaa.gov/products/predictions/long_range/seasonal.php?lead=1
Cooler, wetter North = plenty of frost, snow and ice, right?
Wetter yes but not cooler really, only Washington and Montana. The general forecast shows an equal or warmer winter for most of the north. (I’m in MA. Maybe I can put off replacing my snowblower’s impeller shaft rear bushing another year?)
If you replace it now the odds of a warmer, dryer winter improve dramatically. I’m putting a good 12 hours into snowblower maintenance this fall in order to insure that there are no serious 3-day lake effect events in our area.
“Mark from the Midwest” – along the same lines as snow-blower maintenance leading to less snowfall, after removing our window air conditioner in September, we promptly had several Autumn weekends in the 80’s.
no.
have had MANY blow due to put off mtx.
always cost me more.
yet I never seem to learn….
La Niña does not develop when the jet stream will be meridional.
http://files.tinypic.pl/i/00941/vrot7u3y6hws.png
“NOAA forecasters predict cooler, wetter North and warmer, drier South”. As thr great British comedian, Eric Morecambe, once said, “All the right words but not necessarily in the right order”.
except he said “notes” not “words” but the all theories can be modernised.
Don’t ignore their escape clause: ““If La Nina conditions develop….”
The Farmer’s Almanac is rather better than NOAA and they include long term forecasts that are pretty good.
The Old Farmer’s Almanac, which uses a “secret formula” developed in 1792, claims an 80 percent accuracy rate, but that is almost surely misleading. Independent verifications of its forecasts by actual meteorologists over the years showed skill that was “laughable at best and abysmal at worst” with accuracy about as good as a coin toss. I must also add that NWS prediction map should be using actual numbers instead of using percentages. It shows that much needs to learned about making correct weather predictions and this science is far from settled!
Yesterday was forecast to be windy here on the plains. So I didn’t go fishing. The winds were calm all day. This from the local NOAA office.
Never the two sides (north and south) shall meet right. Except when they do, look out below and don’t blame the weather wordsmiths. I’m preparing for the worst in the “warm and dry zone” not and so should all the “equal chancers”.
“Warmer-than-normal conditions are most likely across the southern two-thirds of the continental U.S”
Good!
I agree. All you winter Texans come on down! Come enjoy the beautiful warm dry Texas weather.
Hmm, then I can expect a colder than ‘average’ winter (December 21st through March 20th), since I am in an area of the South that really gets pummeled by cold when the MJO is strong and the big trough sets up in the USA’s midwest.
Let me check the Farmer’s Almanac …. bingo! Cold and snow forecast for my area. (Probably in February and March, too.)
CBC is calling for a warmest year ever in spite of the cool fall in much of Canada. Any basis for that or are they getting their dire predictions in before they are spoiled by irritating data.
It’s just a recording played on a loop like store music. But the DJs are mad in this case.
Sorry but we are no better at predicting the future than the leftist global warming/climate change people. But the woolly caterpillars are extra woolly this fall so just in case you might want to stock up on firewood.
The wife’s cat offed a squirrel this afternoon (a female, Yay!)
Won’t help my current crop but hopefully there will be a few less pecan predators around next season.
Quite a bushy tail on her which indicates a cold winter according to local folklore.
Unfortunately, squirrels (like wives) obey gas laws and so will expand to fill the space available.
“Other factors that influence winter weather include the Arctic Oscillation, which influences the number of arctic air masses that penetrate into the South and is difficult to predict more than one to two weeks in advance, and the Madden-Julian Oscillation, which can affect the number of heavy rain events along the West Coast.”
A couple of new terms here. At least to me.
So when cold weather manages to make it down into the U.S. from the arctic we are now calling this the “Arctic Oscillation”?
Here’s a good discussion on the AO and NAO:
https://climate.ncsu.edu/climate/patterns/NAO.html
Thanks for that link, Mike. I learned a lot.
Department of Water Resources California Water News posted this forecast:
https://www.usatoday.com/story/weather/2017/10/18/5-000-mile-long-river-sky-deliver-heavy-rain-feet-snow-northwest/776060001/
Wet snowy northwest, dry southwest. No coin flip (or chicken bones, or disemboweled animals) required, just look at at past weather reports.
Oregon’s Pete Parsons will have a new monthly report out soon.
Current one is dated September 21.
Seasonal Climate Forecast
The annual ice age is upon us in the north and maybe worse than average years especially since we are leaning more towards La Nina than El Nino. It seems every winter gets harder to take as one gets older. I was really hoping that there might be some global warming, but it turns out it is only a bit warmer at night in the north, and maybe a week or so on the shoulder seasons of spring and fall that it is better (warmer) than it was in 60’s and 70’s. Other than real bitter cold that hung around longer several decades ago, it seems that for a 1000 miles around me that the climate is pretty much the same as it been since records started being kept back in the 1880’s. The one thing that is noticeable to me is the increase in vegetation/trees of all types. For the most part, I think that is very good and the positive result of more CO2 available in the atmosphere. No case for Alarmism that I can see.
It is nothing short of amazing that after decades of unprecedented climate change, weather looked very much this last winter as it did in winters past. Perhaps a bit warmer out here than it was in the 1960s and 1970s; yet we still had temperatures of -40F last winter. This coming winter, if La Nina repeats, could be open (dry) and warm like it was in 1965; or if La Nina fails to develop, be cold and wet as it was in 1973.
It is very difficult to point this out, and have the observation mean much, to people who are deeply convinced that not only is climate and weather very different now than it was as recently as a couple of decades ago, but that it is near a crisis point.
especially difficult when their salary depends on not understanding a word you just said .
33% chance of warmer winter…yes please
Well, we’ve got opposite predictions in most areas from the Farmer’s Almanac using a method from 1792 and NOAA using the billions we’ve spent on better weather forecasting.
We’ll see at the end of the year which one was a better forecast.
Shouldn’t NOAA’s Weather Prediction Center, rather than NOAA’s Climate Prediction Center, be giving the winter forecast?
I’ll take Joe Bastardi’s forecasts over NOAA’s any day.
Yep
How much? They should bought Piers Corbyn winter package.
I’d rather hear Joe Bastardi’s forecast is.
A visible blockade in the stratosphere over the northern Pacific will cause the jet stream to split in two. One will push air from the Arctic to Canada, the other from Siberia to the north-west coast US.
http://pics.tinypic.pl/i/00941/yi6rtpk42pow.png
I’m struggling to find any sense at all in these maps. What exactly do the “>30%”, “>40%” etc. mean? If the unshaded areas represent an equal probability of greater or lesser than average temperature/precipitation, then why do the probabilities go down in both directions? Why are the more intensely shaded areas associated with smaller probabilities than lighter shaded areas? And what do the inequalities even mean in the first place – >30% overlaps with both 50% and >40%?
I think I understand now – it’s a three-way probability where the unshaded region is 33-33-33.
“Drier-than-normal conditions are most likely across the entire southern U.S.”
The soaking from Harvey & Irma will help see their agriculture through next year.
Well, they haven’t actually made a forecast, as their percentages are so ridiculously low, they can’t possibly be wrong no matter what happens….lol
Take current short term trend, extrapolate into future as new norm.
Go home put feet up.
NOAA is not fit for purpose
Currently in the Arctic Beaufort Sea freezes quickly.
http://masie_web.apps.nsidc.org/pub/DATASETS/NOAA/G02186/latest/4km/masie_all_r01_4km.png
Listen, the NOAA forecast/projection is extremely useful. Now we know for sure what will NOT happen.
+1
The organisation needs a proper clearing out, but it is not just NOAA.
mathematics has replaced physics in many fields.
Climate science is essentually VERY ROUGH numbers being used to pretend they have a precise theory, but you cannot have a precise theory made of extremely rough numbers.
Logic fail, politics, pseudo science
There is a reason why it is so hard to to find what the weather turned out to be in the past days and weeks.
All weather forecasters tells many times a day what the weather shoud be, but few follow up with actual facts of the past weather. That is because it would show that they could just have been reading coin flipping and thea blades, combined with the fact that winter is colder than summer.
We are told that warmer weather should give more storms, but the opposite is a fact in Danmark.
http://www.dmi.dk/nyheder/arkiv/nyheder-2017/oktober/vindstoed-af-stormstyrke-saa-ofte-rammer-de-danmark/
Danmark is a small country, so any small deviations of the weather systems could have great influence, but the meteorologists must know that.
Anyway DMI keeps a record (archive) of what the weather was, that is immidiately accessible, big credit for this service. Look at dmi.dk
‘…..NOAA’S Climate Prediction Center…..’
It just makes me laugh….
Since warming alarmists have taken over weather predictions for the long term, the Farmer’s Almanac is a better prognosticator of seasonal weather.