Guest Essay by Kip Hansen
Why do we even talk about sea level and sea level rise?
 There are two important points which readers must be aware of from the first mention of Sea Level Rise (SLR):
- SLR is a real concern to coastal cities, low-lying islands and coastal and near-coastal densely-populated areas. It can be real problem. See Part 1 of this series.
- SLR is not a threat to much else — not now, not in a hundred years — probably not in a thousand years — maybe, not ever. While it is a valid concern for some coastal cities and low-lying coastal areas, in a global sense, it is a fake problem.
In order to talk about Sea Level Rise, we must first nail down Sea Level itself.
What is Sea Level?
In this essay, when I say sea level, I am talking about local, relative sea level — this is the level of the sea where it touches the land at any given point. If we talk of sea level in New York City, we mean the level of the sea where it touches the land mass of Manhattan Island or Long island, the shores of Brooklyn or Queens. This is the only sea level of any concern to any locality
There is a second concept also called sea level, which is a global standard from which elevations are measured. This is a conceptual idea — a standardized geodetic reference point — and has nothing whatever to do with the actual level of the water in any of the Earth’s seas. (Do not bother with the Wiki page for Sea Level — it is a mishmash of misunderstandings. There is a 90 minute movie that explains the complexity of determining heights from modern GPS data — information from which will be used in the next part of this essay. Yes, I have watched the entire presentation, twice.)
And there is a third concept called absolute, or global, sea level, which is a generalized idea of the average height of the sea surface from the center of the Earth — you could think of it as the water level in a swimming pool which is in active use, visualizing that while there are lots of splashes and ripples and cannon-ball waves washing back and forth, adding more and more water (with the drains stopped up) would increase the absolute level of the water in the pool. I will discuss this type of Global Sea Level in another essay in this series.
Since the level of the sea is changing every moment because of the tides, waves and wind, there is not, in reality a single experiential water level we can call local Sea Level. To describe the actuality, we have names for the differing tidal and water height states such as Low Tide, High Tide, and in the middle, Mean Sea Level. There are other terms for the state of the sea surface, including wave heights and frequency and the Beaufort Wind Scale which describes both the wind speed and the accompanying sea surface conditions.
This is what tides look like:

Diurnal tide cycle (left). An area has a diurnal tidal cycle if it experiences one high and one low tide every lunar day (24 hours and 50 minutes). Many areas in the Gulf of Mexico experience these types of tides.
Semidiurnal tide cycle (middle). An area has a semidiurnal tidal cycle if it experiences two high and two low tides of approximately equal size every lunar day. Many areas on the eastern coast of North America experience these tidal cycles.
Mixed Semidiurnal tide cycle (right). An area has a mixed semidiurnal tidal cycle if it experiences two high and two low tides of different size every lunar day. Many areas on the western coast of North America experience these tidal cycles.
This image shows where the differing types of tides are experienced:

Tides are caused by the gravitational pull of the Moon and the Sun on the waters of the Earth’s oceans. There are several very good tutorials online explaining the whys and hows of tides: A short explanation is given at EarthSky here. A longer tutorial, with several animations, is available from NOAA here (.pdf).
There are quite of number of officially established tidal states (which are just average numerical local relative water levels for each state) — they are called tidal datums and they are set in relation to a set point on the land, usually marked by a brass marker embedded in rock or concrete, a “bench mark” — all tidal datums for a particular tide station are measured in feet above or below this point. An image of the benchmark for the Battery, NY follows, with an example tidal datums for Mayport, FL (the tidal station associated with Jacksonville, FL, which was recently flooded by Hurricane Irma):


The Australians have slightly different names, as this chart shows (I have added the U.S. abbreviations):

Grammar Note: They are collectively correctly referred to as “tidal datums” and not “tidal data”. Data is the plural form and datum is the singular form, as in “Computer Definition. The singular form of data; for example, one datum. It is rarely used, and data, its plural form, is commonly used for both singular and plural.” However, in the nomenclature of surveying (and tides), we say “A tidal datum is a standard elevation defined by a certain phase of the tide.“ and call the collective set of these elevations at a particular place “tidal datums”.
The main points of interest to most people are the major datums, from the top down:
MHHW – Mean High High Water – the mean of the higher of the day’s two high tides. In most places, this is not much different than Mean High Water. In the Mayport example, the difference is 0.28 feet [8.5 cm or 3.3 inches]. In some cases, where Mixed Semidiurnal Tides are experienced, they can be quite different.
MSL – Mean Sea Level – the mean of the tides, high and low. If there were no tides at all, this would simply be local sea level.
MLLW – Mean Low Low Water – the mean of the lower of the two daily low tides. In most places, this is not much different than Mean Low Water. In the Mayport example, the difference is 0.05 feet [1.5 cm or 0.6 inches]). Again, it can be very different where mixed tides are experienced.
Here’ what this looks like on a beach:

On a beach, Mean Sea Level would be the vertical midpoint between MHW and MLW.
The High Water Mark is clearly visible on these pier pilings where the growth of mussels and barnacles stops.

And Sea Level? At the moment, local relative sea level is obvious — it is the level of the sea. There is nothing more complicated than that at any time one can see and touch the sea. If one can note the high water mark and observe the water at its lowest point during the 12 hour and 25 minutes tide cycle, Mean Sea Level is the midpoint between the two. Simple!
[Unfortunately, in all other senses, sea level, particularly global sea level, as a concept, is astonishingly complicated and complex.]
For the moment, we will stay with local Relative Mean Sea Level (the level of the sea where it touches the land).
How is Mean Sea Level measured, or determined, for each location?
The answer is:
Tide Gauges
Tide Gauges used to be pretty simple — a board looking very much like a ruler sticking up out of the water, the water level hitting the board at various heights as the tides came and went, giving passing vessels an idea of how much water they could expect in the bay or harbor. This would tell them whether or not their ship would pass over the sand bars or become grounded and possibly wrecked. One name for this type of device is a “tide staff”.
Since that time, tide gauges have advanced and become more sophisticated.

The image above gives a generalized idea of the older style float and stilling well tide gauges and the newer acoustic-sensor gauges with satellite reporting systems and a back-up pressure sensor gauge. Modern ships and boats retrieve tide data (really, predictions) on their GPS or chart-plotting device which tells them both magnitude and timing of tides for any day and location. Details on the specs of various types of tide gauges currently in use in the U.S. are available in a NOAA .pdf file, “Sensor Specifications and Measurement Algorithms”.
The newest Acoustic sensor — the “Aquatrak® (Air Acoustic sensor in protective well)” — has a rated accuracy of “Relative to Datum ± 0.02 m (Individual measurement) ± 0.005 m (monthly means)”. For the decimal-fraction impaired, that is a rating of plus/minus 2 centimeters for individual measurements and plus/minus 5 millimeters for monthly means.
Being as gentle as possible with my language, let me point out that the rated accuracy of the monthly mean is a mathematical fantasy. If each measurement is only accurate to ± 2 cm, then the monthly mean cannot be MORE accurate than that — it must carry the same range of error/uncertainty as the original measurements from which it is made. Averaging does not increase accuracy or precision.
[There is an exception — if they were averaging 1,000 measurements of the water level measured at the same place and at the same time — then the average would increase in accuracy for that moment at that place, as it would reduce any random errors between measurements but it would not reduce any systematic errors.]
Thus, as a practical matter, Local Mean Sea Levels, with the latest Tide Gauges, give us a measurement accurate to within ± 2 centimeters, or about ¾ of an inch. This is far more accuracy than is needed for the originally intended purposes of Tide Gauges — which is to determine water levels at various tide states to enable safe movement of ships, barges and boats in harbors and in tidal rivers. The extra accuracy does contribute to the scientific effort to understand tides and their movements, timing, magnitude and so forth.
But just let me repeat this for emphasis, as this will become important later on when we consider the use of this data to attempt to determine Global Mean Sea Level from Tide Gauge data, although Local Monthly Mean Sea Level figures are claimed to be accurate to ± 5 millimeters, they are in reality limited to the accuracy of ± 2 centimeters of their original measurements.
What constitutes Local Relative Sea Level Change?
Changing Local Relative Mean Sea Level determined by the tide station at the Battery, NY (or any other place) could be a result of the movement of the land and not the rising of the sea. In reality, at the Battery, it is both; the sea rises a bit, and the land sinks (or subsides) a bit, the two motions adding up to a perceived rise in local mean sea level. I use the Battery, NY as an example as I have written about it several times here at WUWT. (see the important corrigendum at the beginning of the essay there – kh) In summary, the land mass at the Battery is sinking at about 1.3 mm/year, about 2.6 inches over the last 50 years. The sea has actually risen, during that same time, at that location, about 3.34 inches — the two figures adding up to the 6 inches of apparent Local Mean Sea Level Rise experienced at the Battery between 1963 and 2013 reported in the New York State Sea Level Rise Task Force Report to the Legislature — Dec 31, 2010.
This is true of every tide gauge in the world that is attached directly to a land mass (not ARGO floats, for instance) — the apparent change in local relative MSL is the arithmetic combination of change in the actual level of the sea plus the change resulting from the vertical movement of the land mass. Sinking/subsiding land mass increases apparent SLR, rising land mass reduces apparent SLR.
We know from NOAA’s careful work that the sea is not rising equally everywhere:

[Note: image shows satellite derived rates of sea level change]
nor are the seas flat:

This image shows a maximum difference of over 66 inches/2 meters in sea surface heights — very high near Japan and very low near Antarctica, with quite a bit of lumpiness in the Atlantic.
The NGS CORS project is a network of Continuously Operating Reference Stations (CORS), all on land, that provide Global Navigation Satellite System (GNSS) data in support of three dimensional positioning. It represents the gold standard for geodetic positioning, including the vertical movement of land masses at each station.
In order for tide gauge data to be useful in determining absolute SLR (not relative local SLR) — actual rising of the surface of the sea in reference to the center of the Earth — tide gauge data must be coupled to reliable data on vertical land movement at the same site.
As we have seen in the example of the Battery, in New York City, which is associated with a coupled CORS station, the vertical land movement is of the same magnitude as the actual change in sea surface height — 2.6 inches of downward land movement and 3.34 inches of rising sea surface. In some locations of serious land subsidence, such as the Chesapeake Bay region of the United States, downward vertical land movement exceeds rising water. (See The Chesapeake Bay Bolide Impact: A New View of Coastal Plain Evolution and Land Subsidence and Relative Sea-Level Rise in the Southern Chesapeake Bay Region ) In some parts of the Alaskan coast, sea level appears to be falling due to the uplifting of the land resulting from 6,000 years of glacial melt.

Who tracks Global Sea Level with Tide Gauges?
The Permanent Service for Mean Sea Level (PSMSL) has been responsible for the collection, publication, analysis and interpretation of sea level data from the global network of tide gauges since 1933. In 1985, they established the Global Sea Level Observing System (GLOSS), a well-designed, high-quality in situ sea level observing network to support a broad research and operational user base. Nearly every study published about Global Sea Level from tide gauge data uses PSMSL databases. Note that this data is pre-satellite era technology — the measurements in the PSMSL data base are in situ measurements — measurements made in place at the location — they are not derived from satellite altimetry products.
This feature of the PSMSL data has positive and negative implications. On the upside, as it is directly measured, it is not prone to satellite drift, instrument drift and error due to aging, and a host of other issues that we face with satellite-derived surface temperature, for instance. It gives very reliable and accurate (to ± 2 cm) data on Relative Sea Levels — the only sea level data of real concern for localities.
On the other hand, those tide gauges attached to land masses are known to move up and down (as well as north, south, east and west) with the land mass itself, which is in constant, if slow, motion. The causes of this movement include glacial isostatic adjustment, settling of land-filled areas, subsidence due to the pumping of water out of aquafers, gas and oil pumping, and the natural processes of settling and compacting of soils in delta areas. Upward movement of land masses results from isostatic rebound and other general movements of the Earth’s tectonic plates.
For PSMSL data to be useful at all for determining absolute (as opposed to relative) SLR, it obviously must be first corrected for vertical land movement. However, search as I may, I was unable to determine from the PSMSL site that this was the case. The question in my mind? — Is it possible that the world’s premier gold-standard sea level data repository contains data not corrected for the most common confounder of the data? — I email the PSMSL directly and asked this simple question: Are PSMSL records explicitly corrected for vertical land movement?
The answer:
“The PSMSL data is supplied/downloaded from many data suppliers so the short answer to your question is no. However, where possible we do request that the authorities supply the PSMSL with relevant levelling information so we can monitor the stability of the tide gauge.”
Note: “Leveling” does not relate to vertical land movement but to the attempt to ensure that the tide gauge remains vertically constant in regards to its associated geodetic benchmark.
If PSMSL data were corrected for at-site vertical land movement, then we could determine changes in actual or absolute local sea surface level changes which could be then be used to determine something that might be considered a scientific rendering of Global Sea Level change. Such a process would be complicated by the reality of geographically uneven sea surface heights, geographic areas with opposite signs of change and uneven rates-of-change. Unfortunately, PSMSL data is currently uncorrected, and very few (a relative handful) of sites are associated with continuously operating GPS stations.
What this all means
The points made in this essay add up to a couple of simple facts:
- Tide Gauge data is invaluable for localities in determining tide states, sea surface levels relative to the land, and the rate of change of those levels — the only Sea Level data of concern for local governments and populations. However, Tide Gauge data, even the best station data from the GLOSS network, is only accurate to ±2 centimeters. All derived averages/means of tide gauge data including daily, weekly, monthly and annual means are also only accurate to ±2 centimeters. Claims of millimetric accuracy of means are unscientific and insupportable.
- Tide gauge data is worthless for determining Global Sea Level and/or its change unless it has been explicitly corrected by on-site CORS-like GPS reference station data capable of correcting for vertical land movement. Since the current standard for Tide Gauge data, the PSMSL GLOSS, is not corrected for vertical land movement, all studies based on this uncorrected PSMSL data producing Global Sea Level Rise findings of any kind — magnitude or rate-of-change — are based on data not suited for the purpose, are not scientifically sound and do not, cannot, inform us reliably about Global Sea Levels or Global Sea Level Change.
# # # # #
Author’s Comment Policy:
I am always eager to read your comments and to try and answer your on-topic questions.
Try not to jump ahead of the series in comments — this essay covers only the issues of Tide Gauges, the accuracy of their data and the implications of these details.
I will cover, in future parts of the series: How is sea level measured by satellites? How accurate are satellite sea level measurements anyway? Do we know that sea level is really rising? If so, how fast is it rising? Is it accelerating? How can we know? Should I sell my sea front property?
Please remember, Sea Level Rise is an ongoing Scientific Controversy. This means that great care must be taken in reading and interpreting new studies and especially media coverage of the topic — bias and advocacy are rampant, opposing forces are firing repeated salvos at one another in the journals and in the press. In the end, the current consensus — both the alarmist consensus and the skeptical consensus — may well simply be an accurate measure of the prevailing bias in the field from each perspective. (h/t John Ioannidis)
# # # # #
Dr Roy Spencer:
http://www.drroyspencer.com/wp-content/uploads/Sea-level-data-since-1855.jpg
http://www.drroyspencer.com/2017/08/an-inconvenient-deception-how-al-gore-distorts-climate-science-and-energy-policy/
Don B ==> The central point of this essay is that any study trying to show Global Sea Level changes (rise, fall, steady state) are TOTALLY INVALID if they use tide gauge data uncorrected for vertical land movement.
I disagree Kip. The land movement at any place is essentially constant* in the hundred year time frame. Ignoring the land movement will affect the numerical rate in Dr. Spencer’s graph, but it will not affect whether or not there’s an acceleration in the sea level rise, which was his point.
* Yes, there are places where water or oil pumping would change the rate of land movement over time, but these are few in number and not likely to affect the average. If they did it would show up as an increase in the rate, which isn’t seen in Dr. Spencer’s graph.
scarletmacaw ==> One can not determine how much of the change is the result of land movement and how much is the result of actual rising water — without an accurate measure land movement. If he were using data for ONE tide gauge, then he could determine the relative local sea level change at that location….but he wouldn’t know how much of that was water rising and how much from land subsiding.
Spencer however is looking at 1227 different tides gauges — some of the tide stations are on land masses that are rising up and some are on land masses that are sinking. You see the problem here?
Kip: scarletmacaw’s response is carefully worded and absolutely correct in each point he makes, given his own stated conditions. He is referring to the acceleration, not the rate of rise.
Scarletmacaw,
I think that you underestimate the rate of land elevation change for coastal sediments. See this article: https://arstechnica.com/science/2017/10/silicon-valley-rose-as-water-use-restrictions-kicked-in/
While vertical displacements along coastal faults may only happen every few hundred years, there can be several meters of change each time. One then has to take the average over the recurrence interval.
Stephen ==> The assumption that vertical land movement at all locations is static — unchanging in rate — over a century is unsupportable — GIA vertical movement can sort-of be assumed to be steady, but most stations are affected by subsidence due to landfilling, pumping of aquifers, oil extraction, simple subsidence as delta areas not being replenished, etc. Cities are built, islands like Manhattan enlarged with stone and soil, piers extended out on the river muck, and tide gauges installed on them.
So, no, rate-of-change, acceleration, etc can not be determined without correction for vertical land movement of the tide gauges themselves.
Clyde, how can sediments affect a tide gauge? Sediments would deposit around the foundation of the gauge, not under the gauge. I can see how enough sediment would render a gauge inoperable by blocking the sea water, but that’s another matter entirely.
Scarlet ==> When harbors and their piers, to which tide gauges are generally attached, are built on sediments or landfill, the pilings not driven down to bedrock, then as the sediment settles, the piers subsides, and results in an apparent sea level rise.
The Mississippi River delta area is subsiding at a very rapid rate, as it has been denied replenishment of sediments. Existing delta sediments settle and get washed away, and islands are percieved to be being overrun by rising seas — which is not the case. Oil and gas extraction from under the delta causes even more subsidence and thus more apparent SLR.
Kip
I think the important thing here is whether the rate of change is changing, rather than the absolute numbers themselves.
The IPCC admit that sea levels were rising as fast between 1920 and 1950, as in the last 30 yrs, with a lsow down in between. The Jevrejeva figures show the same.
The figure of 1.92mm pa may not be accurate for global sea levels, but that is a separate issue
Paul ==> Thanks for stopping by. The CAGW point is acceleration, as a necessary part of the message that CO2 driven warming will cause catastrophic sea level rise. Doubling next-to-nothing adds up to not much.
The point of concern for most everywhere is that the sea is rising, as it has for a long long time, and localities need to know how much it may rise where they are in the next 50/100 years.
…and for global tide gauges adjusted for land movement I believe the rate of rise is aboutv1.49 mm per year.
As with satellite data I rarely, if ever, see error bars on SL graphics.
David ==> Yes — true. To be covered in a subsequent part in this series.
It can’t show whether global sea level is rising, falling, or in a steady state.
It *can* show that globally no dangerous sea level rise acceleration has been observed at actual tide gauges. And since the local relative sea level is the *only* sea level that actually matters for anything, that’s a very comforting thing to know.
Here’s a 2016 paper in Nature Climate Change, by Aimée Slangen, John Church, and four other authors, which told us when it was that anthropogenic forcings had kicked in and begun driving sea-level rise:
http://www.nature.com/nclimate/journal/v6/n7/full/nclimate2991.html
Slangen & Church were both at CSIRO (in Australia), so I annotated a NOAA graph of sea-level at Australia’s longest tide gauge, to illustrates the findings of that paper:
http://www.sealevel.info/680-140_Sydney_2016-04_anthro_vs_natural.png
Now, why do you suppose they didn’t didn’t include a graph like that in their paper?
“Anthropogenic forcing dominates global mean sea-level rise since 1970”
The title of church’s article in nature – hat tip daveburton
This is awesomely funny! Yeah, why not, that would finally finish out the unnecessary debate.
Of course, the people touting CAGW-SLR talk about open water, satellite measured SLR with sea botton adjustment, and mix that with local relative mean sea level in informal cmmunication. Add some cherry picking and you get +100% acceleration, add some exponential fit and we’ll all drown, DROWN I tell you.
Kip will return to this later…
um…if its a linear trend (doubtful) are the authors implying that some where between 1950 and 1970 natural forcings began shutting down?
If so, its a damn good thing mankind had stepped up to take over so that old mother nature could put her feet up for a bit. What astounds me is that mankind was able to pick up the slack in the natural decline so perfectly so as not to allow a dip in the linear trend. [sarc]
Whilst that plot clearly demonstrates that there is no correlation between rising levels of CO2 and rising levels of sea level rise (no acceleration in the rate of change), one of the important points to emerge from that plot is that tide level rise was virtually flat, for some 20 years, between ~1960 and 1980, and there was only a very slight rise, during the 30 year period, between 1960 and 1990.
To avoid confusion, my comment is referring to the plot posted by Don B
Scarlet’s statement: “The land movement at any place is essentially constant* in the hundred year time frame.”
It is quite well documented that localized phenomena, such as large scale pumping of hydrocarbons or groundwater, can have a very rapid effect on land elevations relative to the center of the earth. Other phenomena include construction of dams that create large freshwater impoundments, and erection of tall buildings, can effect local land elevations. The Wilmingon oil field near Long Beach is an extreme example, having experienced over 30 feet of subsidence since production of oil began in the mid 1920s.
As for the other processes that operate on geologic timescales, such as rebounding from the former ice sheet in northern North America, or tectonic subduction at plate boundaries, yes, those are going to be relatively constant over a 100 year timeframe.
Yet another case, like temperature, of claiming more accuracy in a compilation than existed in the original measurement. How repeated measurements of different things somehow becomes more accurate is beyond me.
Tom,
I think that you mean precision rather than accuracy.
Precision, in principle, may be increased with number of measurements. Accuracy may be biased due to unknown factors in data taking, in which case increased number of data may not increase accuracy.
If one measures the length of a rope QUICKLY using a ruler, increasing the number of measurements can increase precision of the rope’s length.
But if one thought the ruler was graduated in inches, but it really was graduated in centimeters, the accuracy of the measurements would be poor, no matter what the precision.
donb, using anomalies fixes the problem of bias, when you are interested in measuring the change that occurs over time.
Only if the bias is constant.
Yes. An example being if the ruler is made of metal and the temperature changes during the measurements.
For a quick visualization of accuracy v. precision:
Accuracy is having 3 shots land within the center target.
Precision is having a tight 3 shot grouping regardless of location on the target.
>>
rocketscientist
October 8, 2017 at 9:37 am
<<
That explains the difference between accuracy and precision; however, in real life, there is no target present. Precision is the easy part. Accuracy can only be inferred from repeated measurements–preferably using different techniques and hoping that systematic and random errors are cancelled out.
Jim
My understanding of precision is the level of refinement in a measurement. Meaning a micrometer which reads down to the nearest .0001″ is more precise than one which is graduated down to the nearest .001″. Where as accuracy is a measure of the difference between measured and actual. Averaging repeated measurements of a characteristic of the same object will not yield greater precision as precision is determined by the instrument used. You cannot produce a higher resolution than that provided by the individual measurements.
Repeating measument lowers random errors. That’s I measure twice to use the circular saw only once.
when the water is over your head make sure you can swim or have a boat.
If the water is up to ears, recycling it is an option. Old toilet adage.
This is true, but you have to be measuring the same thing, which means it can’t be changing between measurements. Usually we accomplish that by measuring it quickly multiple times. For example, for a tide gauge say we are recording a single datum once each hour. For that hourly datum we might actually make a thousand measurements during a one minute period and average them together. That would reduce the single measurement error due to noise in the system. However averaging the 24 readings for one day to a single value won’t reduce the error any further. This is the common mistake, and an elementary one at that.
But when a thousand people measure a thousand different pieces of wood using a thousand different tools, how can there be any increase in either accuracy or precision in the sum and average of all those measurements?
Andy ==> Correct, sir.
Paul Penrose wrote, “…for a tide gauge say we are recording a single datum once each hour. For that hourly datum we might actually make a thousand measurements during a one minute period and average them together.”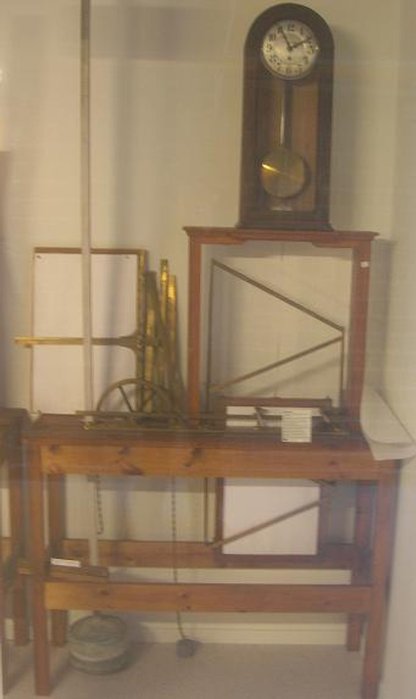
Tide gauges do that short-term averaging mechanically.
You start with what’s called a “stilling well” — just a vertical pipe, fastened securely to something solid, with the low end submerged, sealed at the bottom except for a small hole. Inside the pipe you have a nice, quiet “sea level” which rises and falls with the tides, but not with the waves. That’s why they call it a “tide gauge.”
The stilling well averages out the waves, but not the tides. There are no waves, chop, swell or foam in a stilling well.
You use surveying techniques to precisely measure the height of the tide gauge relative to nearby geodetic “survey markers” (permanent geographical benchmarks), so that if a big storm washes away your tide gauge you can replace it without introducing a step-change in the data.
Then, in the simplest case, you just dip a measuring stick (a “tide pole” or “tide staff”) into the pipe, and read the water level periodically.
If you read it on a rigorous schedule, based on the timing of the tides, you can get a good quality sea-level record with nothing more than a stilling well and a measuring stick. Some such measurement records go back more than 200 years!
As long as you follow well-established best practices (don’t let the pipe fill up with mud, don’t let the hole near the bottom get plugged, etc.), tide gauges are simple, elegant, precise, and reliable.
Note that even in the 19th century they had strong incentives to not botch or fudge their readings, because the measurement sites were usually near channels and harbors, and if they didn’t know the correct water levels and accurately predict the tides, ships might run aground! I trust 19th century tide gauge measurements, done by hand with a tide stick, more than I trust 21st century satellite altimetry, for sea-level measurement.
An improvement is to put a float in the stilling well, and connect the float to a pen on a strip-chart recorder, for continuous readings, as shown in this diagram:
http://www.sealevel.info/tide_gauge_diagram_01.jpg
Here’s a photograph of one such tide gauge, on display in a Swedish museum:
Of course, modern tide gauges use somewhat fancier methods. But it really doesn’t matter very much whether you have a human being reading a tide stick on a schedule synchronized with the tides, or a float attached to a strip-chart recorder, or an acoustical sounder phoning home its readings 10× per hour. You’ll get pretty much the same numbers for MSL, HWL, LWL, etc.
Note: when upgrading your tide-gauge to use improved technology, it is very easy to ensure that the new system doesn’t bias the data. Just keep an old-fashioned tide stick in the stilling well, and check it against your strip-chart recorder or acoustic sounder readings, for consistency.
The contrasts with temperature measurements and satellite altimetry are pretty obvious:
With temperatures you never know when the minimum and maximum will be reached, so even if you used a min-max thermometer your time-of-observation (“TOBS“) could introduce a bias (“correction” of which is an opportunity for introducing other biases). That’s not a problem for sea-level measurement with tide gauges.
With temperatures, the surroundings can greatly influence the readings. That’s generally not a problem for sea-level measurement with tide gauges (though channel silting and dredging can sometimes have an effect on some locations, especially on tidal range).
With temperature measurements, changes in instrumentation, or even in the paint used on the Stevenson Screen, can change your readings. Analogous issues affect satellite altimeters, too, as is obvious by the differences between the measurements from different satellites. But it’s not a significant problem for sea-level measurement with tide gauges.
Also, unlike tide gauges, which are referenced to stable benchmarks, there’s no trustworthy reference frame in space, to determine the locations of the satellites with precision. NASA is aware of this problem. In 2011 NASA proposed (and re-proposed in 2014 / 2015) a new mission called the Geodetic Reference Antenna in SPace (GRASP). The proposal is discussed here, and its implications for measuring sea-level are discussed here. But, so far, the mission has not flown.
Satellite measurements are affected/distorted by mid-ocean sea surface temperature changes, and consequent local steric changes, which don’t affect the coasts.
The longest tide-gauge measurement records are about 200 years long (with a few gaps)! The longest satellite measurement records are about ten years, and the combined record from all satellites is less than 25 years, and the measurements are often inconsistent from one satellite to another:
http://sealevel.info/MSL_Serie_ALL_Global_IB_RWT_NoGIA_Adjust_2016-05-24.png
With temperatures, researchers often go back and “homogenize” (revise) the old data, to “correct” biases that they believe might have distorted the readings. The same thing happens with satellite altimetry data. But it doesn’t happen with sea-level measurement at a particular location by a single tide gauge.
Unlike tide-gauge measurements (but very much like temperature indices), satellite altimetry measurements are subject to sometimes-drastic error and revision, in the post-processing of their data (h/t Steve Case):
http://www.sealevel.info/U_CO_SLR_rel2_vs_rel1p2_SteveCase.png
http://www.sealevel.info/2061wtl.jpg
Those are graphs of the same satellite altimetry data, processed differently. Do you see how much the changes in processing changed the reported trend? In the case of Envisat (the last graph), revisions/corrections which were made up to a decade later tripled the reported trend.
I wonder what place on the oceans has the least tide?
Thinking that the poles would be less directly affected by sun/moon gravity. Perhaps I should say differently, as the pull would be less of an effect at poles. But then I am not a scientist.
John ==> Tidal ranges are typically smallest in the open ocean, along open ocean coastlines and in almost fully enclosed seas, such as the Mediterranean. The Canadian Bay of Fundy has the largest tides, 16 meters.
Tides are extremely complex. The Wikipedia article on tides https://en.wikipedia.org/wiki/Tide will tell you more than you want to know about the subject. There are a regions — the Mediterranean and Gulf of Mexico that have minimal tides. I think I read a few years ago that there are a few spots (six I think) in the open oceans where tides would be close to zero were there any land there from which to observe tides. I have no idea where I read that or whether it is correct.
A study of the hydrographic surveys done in preparation for D-day Normandy brings home just how much tidal conditions can vary across a stretch of just 50 miles of coast line. I imagine most people don’t know that the landings at the British beaches started a full hour after those on the US beaches. Part of that difference due to the presence of sandbars off some of the British beaches which sloped even more gradually than the US beaches and part due to a later high tide.
It would vary with 18 year lunar cycles….
This is all far too simple.
If we allow the public to understand that sea level is measured at a number of relevant locations on the coast, and over a relevant period of time before and after industrialization then they may spot that nothing all that remarkable or concerning has occurred.
What needs to be done, is that we should show the tidal gauge methodology until 1993 and then jump to another methodology generated via a flawed interpretation of satellite altimetry data.
Then chuck in some dodgy calibrations and adjustments.
And – BINGO!! – a hockey stick graph.
Everybody likes a hockey stick. Don’t they?
http://www.columbia.edu/~mhs119/SeaLevel/SL.1900-2016.png
Two points
1) Prior to the satellite adjustment, the tide gauge ran at 1.5mm ish per year and the satellite ran at a rate of rise of 3.xmm ish per year, both with the same rate of doubling of the rate of rise (basically a doubling of the rate over 150years. ) Ie the rate of sea level rise would reach about 6mm a year after 150 years.
2) They adjusted / “recalberated” the rate of sea level using satellite data such that the rate of sea level matched the tide gauges in order to make satellite match the tide gauges in 1993. Not withstanding the satellite doesnt match tide gauges today.
indefatigablefrog ==> I will discuss sea level rise by satellite in the next part of this series.
Looks a little like what you might expect from 2mm/y in orbital decay
Good point – wish I had remembered that adjustment a few months ago –
Skeptical science ran their typical article on the acceleration in the rate of SL along with the likelihood of a doubling of the rate in just 20 or so years and their frequent commentary on 3 – 6 foot rise by the end of the century.
They posters did not seem to grasp that almost the entire increase in the rate of accelleration was due to the change in the method of measurement – not with the empirical / reality rate of sea level rise
Well they really do seem to behave like a throng of uncritically starry-eyed true believers.
Nobody contributing to SkS seems to have the capacity to question even the most grotesquely blatant distortions and misdirections. The fact that they call themselves skeptical is really quite shocking.
Perhaps they do really unskeptically believe that they are skeptical.
Even when they discovered that Al Jazeera wanted to promote their website, nobody there was capable of noticing that a propaganda outlet funded by Qatar might have skewed motives:
http://www.populartechnology.net/2012/09/skeptical-science-from-al-gore-to-al.html
” Nobody contributing to SkS seems to have the capacity to question even the most grotesquely blatant distortions”
Indeed! Real skeptics are censored at SKS.
Indefatigablefrog, I think that graph is Hansen’s, right?
Tony Heller (a/k/a Steven Goddard) memorably called that the “IPCC Sea Level Nature Trick,” to make the point that such spliced graphs molest the sea-level data much like Mann molested temperature data with his “Nature Trick.” Both conflate two very different kinds of data to create a misleading apparent trend.
(In fairness to Hansen, though, at least his bogus sea-level graph draws the two different sorts of measurements in different colors. Mann didn’t do that.)
Andy & MarkW…..adjustments are adjustments are adjustments are adjustments. Doesn’t matter if they are temperature or sea level adjustments, they are all ADJUSTMENTS.
Still haven’t figured out the difference between validated technical engineering adjustments…
… and agenda driven fantasy adjustments, have you Mark’s johnson.
I think that that particular example may be “Hansen on steroids”.
But, a similar examples can be found by googling “sea level rise columbia”.
I found it originally in Columbia University educational material.
And yes, Hansen’s name is associated with a very similar presentation.
It’s shocking to think that university students are being presented with this guff, and then expected to uncritically believe what the graph appears to show.
Quite clearly there has NOT been a critical step change in SLR rate occurring in 1993.
If an apparent step change is produced by the switch between methodologies, then surely we should suspect that the switch is the only cause. Obviously.
The fact that Hansen was happy to attempt to pass this off, is only more evidence of his progressive derangement, as his earlier predictions fail to manifest within his lifetime.
Sorry, when I wrote “Indefatigablefrog, I think that graph is Hansen’s, right?” I meant James Hansen, not Kip, and that’s a link to the web page where he and Makiko Sato have a very-frequently-updated version of the hockey stick sea-level graph which Indefatigablefrog posted:
http://www.columbia.edu/~mhs119/SeaLevel/
The graph is the 2nd figure on that page
Also, some of the older versions can be retrieved from TheWaybackMachine:
http://web.archive.org/web/*/http://www.columbia.edu/~mhs119/SeaLevel/
Mark: adjustments
are necessary to correct
for known biases.
how would you prefer to
correct for these
biases?
Early satellite “adjustments” .. Started around 2002/3 just when they needed some actual SLR.
Current satellite temperature data is also “adjusted.” For example, UAH 5.6 versus UAH 6.0
The reason and method for the satellite adjustments are published and are very defensible.
Neither is true for the ground based network.
You really are a brain-washed AGW sychophant/cultist, aren’t you Mark’s johnson.
So funny watching your ignorant inane remarks.
Adjustments:
UAH ..known technical engineering issues, validated
Satellite SLR..: agenda whim, non-validated.
Note that early TOPEX matched tide gauges well….. then the AGW scám got started.
Everything above about 2mm/year in the satellite SL is from “adjustments™”
AndyG55: ” You really are a brain-washed AGW sychophant/cultist, aren’t you”
…
LOL name calling?
..
https://www.realskeptic.com/2013/12/23/anthony-watts-resort-name-calling-youve-lost-argument/
Do you DENY you are brain-washed?
Do you DENY you are an AGW cultist.
Not name-calling at all.
Just facts.
Learn the difference.
(Andy,drop this useless chatter,debate instead) MOD
Mark: UAH data are
adjusted each and
every month.
it’s not difficult to
understand why, if you
read their papers.
(Crackers: Warning — I will not tolerate off-topic trolling on this essay. This essay is about Tide Gauges and Sea level. Stick with that please. — kh)
Having worked as a GPS engineer for (too) many years, I can tell you that no satellite can produce millimeter accuracy of sea level. Orbits are just not that stable. GPS birds are not accurate to mm/year. Even with adjustments to their ephemeral data on a daily basis.
And if someone says the satellites used for altimetry rely on GPS data, they should appreciate GPS is not very accurate in the vertical dimension.
Thank you for that, EW3. Dr. Willie Soon agrees with you. He explains the problems starting at 17:37 in this very informative hour-long lecture:
NASA agrees with you to, I think. At least it seems like they agree with you, when they argue for the proposed GRASP (Geodetic Reference Antenna in SPace) mission.
BTW, if your identity is not a secret, I’d be grateful for an email. My address is here:
http://sealevel.info/contact.html
GPS is not accurate on a day-to-day basis but once a GPS station is operating for 5 years or so, a definitive signal emerges which is accurate to the tenth of a millimetre.
Sonel.org maintains a database of GPS stations which are co-located with Tide Gauges and there are more than 200 co-located stations which are operating past the 5 years now.
This is the local land uplift around the world (there is newer version of this now but the graphic available is not very good).
http://www.sonel.org/IMG/png/ulr5_vvf.png
The data can be obtained here:
http://www.sonel.org/-Sea-level-trends-.html?lang=en
1960-1992, GPS adjusted tide gauges – 1.82 mms/year.
1992 to 2013, GPS adjusted tide gauges – 2.12 mms/year.
In 2013, GPS adjusted tide gauges -0.345 mms.
In 2012, GPS adjusted tide gauges +4.25 mms.
In 2011, GPS adjusted tide gauges +2.79 mms.
Since sea level changes with the ENSO, we should expect a large rise in 2015 and then a decline in 2016 and 2017.
Bill Illis wrote, “Since sea level changes with the ENSO…”
It depends on where you are. In San Diego, and in the satellite-altimetry graphs, sea-level changes with ENSO. But in the western tropical Pacific sea-level changes opposite to ENSO.
Here’s the J.Hansen / M.Sato graph showing the strong positive correlation between ENSO and satellite altimetry measurements of sea-level:
http://www.columbia.edu/~mhs119/SeaLevel/SL+Nino34.png
But look how San Diego and Kwajalein are mirror-opposites of each other:
http://sealevel.info/1820000_Kwajalein_San_Diego_2016-04_vs_ENSO.png
With proper weightings, it should be possible to build a “global sea-level” index/average from coastal tide-gauges which mostly eliminates the ENSO influence.
Because in the western tropical Pacific sea-level changes opposite to ENSO, I posit that you should be able to also construct a good ENSO proxy by calculating the ratio of news stories about “record high temperatures” to news stories about “drowning island paradises.”
Bill Ellis thank you. I will keep that Sonel link. Now I have a question.
How can there be GPS data available for the 1960s? Though the Navy had a limited system up in the 70s, the 24 satellite NAVSTAR system as we know GPS today did not become fully operational until 1993.
@ Bill Illis,
I always try to read your carefully constructed comments.
So it surprises me that you say ” a definitive signal emerges which is accurate to the tenth of a millimetre.”
Our little orb is being stretched by forces, call it gravity or what you will, and you really think there is some kind of center point where all these forces can be measured from ?
The idea is that a local land uplift or subsidence rate is a geologic phenomenon. The rate will be stable for decades if not thousands of years.
Most of the local GPS uplift/subsidence rates will defined by the Earth rebounding/adjusting from the last ice age glacial loads. These rates have probably changed some through time but for the last several thousand years, they would have been very stable.
The other two impacts will be from:
– tectonic movement (which is again a million year type time-frame although a recent local earthquake can influence the GPS signal occasionally which is treated as a break-point when they happen); and then,
– underground water depletion or resupply (which is stable enough in terms of a decade or more).
Thus, the GPS rate of the last 5 years is probably the rate that has existed for at least a few decades if not thousands of years.
Bill ==> As a note, GPS rate of the last five years is accurate for now — but is no guarantee of the century or millennial scale. Tide Gauges, and their benchmarks, and their associated GPS stations, are located where the sea hits the land, as modified by humans at our whim — filled, built up, cities added, islands created, etc. Local effects at tide gauge CORS stations are often much more than their inland neighbors.
Bill Illis ==> The Sonel network is an attempt at creating a true network of GPS corrected Tide Gauges — but it is still in its infant stages. Many Tide Gauges are linked to GPS stations many kilometers distant (5 km, 7 km, etc). GPSs not attached to the same structure, in other words.
Sonel is better than nothing — but it does not yet give an accurate picture when we are looking at millimeters of change over multi-annual time scales.
I will look for the link to the standard for associated Continuous GPSs for this use — kilometers away is not within the standard for sure.
I will email Dr, Richard Snay, at the NGS, the question …. there is a standard, if I recall correctly.
In a general sense, the Continuous GPS should be attached to the same ‘immovable” structure as the tidal benchmark — this would mean the same bedrock-supported pier, or some such. Just having one within a few miles and then assuming the same vertical movement is an error — as it ignores all the causes (and their results) other than continental GIA movement.
u.k. (u.s.) ==> The reference on this is the CORs site, which explains how all this is done. For the complexity of the calculations that must be performed to arrive at the long-term trend or vertical movement, you might watch the 1.5 hour presentation on how this needs to be done to be accurate.
Bill Illis.
You said, “Thus, the GPS rate of the last 5 years is probably the rate that has existed for at least a few decades if not thousands of years.” Major faults such as the San Andreas have an average lateral motion of about 2 cm per year, but sections can become locked and move much less — until they release! These dominantly strike-slip faults also have a vertical component as well. The only way that the average vertical motion over thousands of years can be calculated is to calculate the average of the episodic events, not through monitoring a short, quiet interval in-between events.
EW3 – that’s why the GRACE
mission was so important.
(2 sats)
GPS can measure vertical movement and East-West and North-South Movement. This has revolutionized continental drift movement and theory (we actually know now).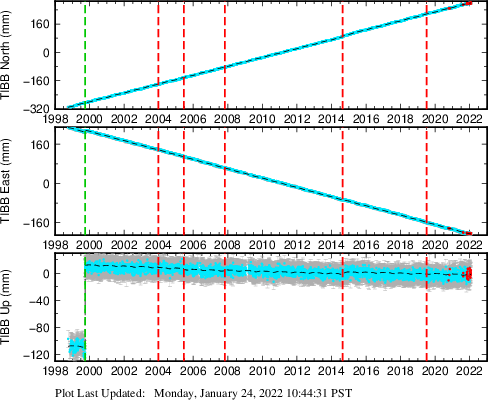
This is the data from the GPS station on the western side of the San Andreas fault at San Francisco (Tiburon Peninsula). The data is actually quite stable other than the earthquakes. Almost all GPS stations are like this with fairly stable trends. Wait five years and that is enough to be reasonably sure.
– west at 19.0 mms/year;
– north at 25.0 mms/year; and,
– down up 1.0 mms/year (although a Magnitude 5 Earthquake in 1999 shifted the station up by 120 mms)
Bill Illis ==> Dr. Richard Snay at NGS is my go-to guy for understanding the CORS results. He recommends waiting for the published analysis for each station as the calculation of long-term means is not as straight-forward as we might like to be.
Can you tell me the source of the graphs you provided?
Kip Hansen October 8, 2017 at 3:07 pm
The data comes from the USGS although Sonel.org also uses this station (Sonel’s charts can’t be linked to since I imagine they are right in the middle of the great global warming debate so they need to be careful and obscure at times).
https://earthquake.usgs.gov/monitoring/gps/SFBayArea/tibb
http://www.sonel.org/spip.php?page=gps&idStation=3024
Bill ==> Thanks for the links.
Bill Ellis,
The two blue diagonal lines (EW & NS) represent the nominal 2 cm/yr ‘creep’ that takes place along unlocked sections of the fault line. It is generally thought that the creep does not relieve all the stress and therefore abrupt movements (earthquakes) can be anticipated at multi-centennial intervals to release the stored strain. The blue lines do not represent the long-term behavior of the faults.
Kip wrote, “For the complexity of the calculations that must be performed to arrive at the long-term trend or vertical movement, you might watch the 1.5 hour presentation on how this needs to be done to be accurate.”
When I started to play the video, it reported that the total length is 3 hours! Yikes!
The web version uses FlashPlayer, so the speed is not adjustable. But there’s a link to an .mp3 version. I guess the thing to do is download the .mp3 version and play it in VLC or similar, so that it can be sped up to save some time.
Thanks for the link!
Dave ==> Good suggestion. I use VLC player as well….very useful. (Not an official endorsement by the management of this blog.)
This grafting exercise has a certain taste of Excel in it. Who was the author, by the way?
Hansen I’m told, but not sure?
Are you talking about the 2nd graph on this J.Hansen / M.Sato page?
http://www.columbia.edu/~mhs119/SeaLevel/
Sato and Hansen. Yes, I’m surprised. OTOH, Hansen was ready to do the congress scam, so why not.
I think I might see a way to average over a month and improve the accuracy somewhat, although I’m not sure how to calculate the improvement. If we assume (as would be reasonable) that actual sea level doesn’t rise more than .17mm per month (which would be the average gain if the actual rise was 2mm/year), then for monthly purposes, we could assume that the daily measurements would likely center around this very small variation, and the kind of accuracy improvement that the author refers to (multiple measurements at a single point in a single day) could be applied, at least within the theoretical variance over the course of a month. Now that’s a lot of assumptions (including the notion that sea level rise is truly constant vs. fits and starts), but if you made those assumptions, you could (theoretically) improve the precision of the monthly measurement.
Am I off base here? Please chime in if so.
Taylor Pohlman ==> You are talking of determining Sea Level Rise from tide gauge data. Certainly, with a long enough time series, and data on vertical land movement, it would possible to determine LOCAL absolute sea level change — this would still tell us nothing of Global Sea Level change.
I was talking about local sea level rise, which, as you pointed out, is the only relevant metric for people who might have concerns. Given different ocean bottom configurations, prevailing winds and currents, one would expect variations between locations, including trend variations. A single number for Global sea level rise, would therefore seem pretty meaningless, in much the same way that a single number for Global temperature does.
I was just pointing out that there should be ways to improve precision locally, vs. the +-2cm for each single measurement
Hi Kip,
I am enjoying to read your post and subsequesnt comment and counter-comments. Can you please tell me about any specific source(s) where i can find data for vertical land movement? And, if you dont mind i would be grateful to receive your email address. My one: https://www.researchgate.net/profile/Bishwajit_Roy5
Looking forward to the next post on SLR.
Let us be clear about our topic.
OK, good. We are talking about local and relative, as pertains to the people living there.
OK, good. On a beach, and the same at a tide gauge.
The gauge constantly measures the tide coming in, and going out. This gives me 2 opportunities a day to measure high water and low water. True, the tides get larger and smaller according to the phase of the moon, but the change is symmetrical (or close enough). So I calculate MSL twice a day or 60 per month.
It seems to me that as we average all the individual MSL readings, we do, in fact, gain precision.
Standard statistics requirements:
1) No systematic error in the instrument calibration. (a topic unto itself)
2) Measurement errors are what is said to be random, and evenly distributed about the mean.
3) With conditions 1 and 2 satisfied, precision increases proportional to the square root of N.
Tony ==> Almost right — the precision of the mean — the mathematical midpoint of all the measurements — is more precise — but the original measurement error/measurement uncertainty must be added back onto the resultant mean. So while we could get a very precise midpoint (mean) — it will still only be properly represented by adding back on the +/- 2 cm.
The only way this makes sense to me is if you are talking about calibration error, not a measurement error.
I appreciate your comments, but I stand my ground.
(I would concede the point if it could be shown that individual determinations of MSL can *not* be averaged together.)
TonyL ==> I will have to write a separate essay to convince you — promise I will. I used to think as you do, until it was demonstrated to me that what I say is the actuality. You will have to wait for the essay — no time here.
Kip is absolutely correct. It doesn’t matter how many times you take a measurement, the accuracy of the instrument determines the error band. There is no reduction in the probability of the actual event being anywhere in the band +-2cm.
This basic misunderstanding of how errors should be dealt with is endemic throughout ‘climatology’. It is the underlying reason behind the results of the ‘random walk’ analysis paper recently published on this site. The error bands that should surround all the data points used in the ‘climate change’ debate completely swamp any perceived ‘trends’.
Basically its all numerology , with no foundation in science at all.
James ==> Thank you, I don’t usually get much support for this oh-so-basic idea.
The correlation between emissions and sea level rise
https://ssrn.com/abstract=3023248
chaamjamal ==> The referenced study uses “The primary sea level dataset for this work is a global sea level reconstruction from 1807 to 2010 created by Dr. Svetlana Jevrejeva of the Permanent Service for Mean Sea Level (PSMSL) group at NOCL from a large number of sea level datasets worldwide (Jevrejeva, 2014).”
Tide Gauge data is not fit for the purpose of determining Global Sea Level change — because is it uncorrected for a known confounder — vertical movement of the land, which is of the same magnitude as the posited local change in sea level.
You are correct, Kim: at about 1/3 of the world’s long-term, high-quality tide gauge locations, vertical land motion (VLM) affects local sea-level more than does global sea-level rise. That’s why at many location local sea-level is falling, rather than rising.
Tide gauge data from long-record gauges is, however, fit for the purpose of determining the derivative of global sea-level change (i.e., the 2nd derivative of global sea-level, i.e., sea-level rise acceleration), because the confounder, VLM, is known to be very nearly linear over centennial time scales, at most gauges, as scarletmacaw mentioned, above. Since the derivative of a linear component is zero, linear VLM cannot affect “acceleration” calculations.
What the longest tide gauge records tell us is that sea-level rise accelerated very slightly (by at most 1.5 mm/yr) during the latter 19th century and the first quarter of the 20th century, but there’s been little if any acceleration since then.
Brest, France, a/k/a PSMSL tide gauge #1, has the longest extant sea-level measurement record. In the 19th century it experienced no sea-level rise. Since 1900 it has experienced about 1.5 mm/yr sea-level rise (6 inches/century). Over the “satellite era” (since 1993) it has measured 2.1 ±1.8 mm/yr of sea-level rise, which is not significantly different from the long-term rate since 1900. Here are the graphs (sea-level in blue, juxtaposed with CO2 in green):
http://www.sealevel.info/MSL_graph.php?id=Brest&boxcar=1&boxwidth=3&thick&c_date=1800/1-1899/12
http://sealevel.info/190-091_Brest_1807-1900.png
http://www.sealevel.info/MSL_graph.php?id=Brest&boxcar=1&boxwidth=3&thick&c_date=1900/1-2019/12
http://sealevel.info/190-091_Brest_1900-2016.png
http://www.sealevel.info/MSL_graph.php?id=Brest&boxcar=1&boxwidth=3&thick&c_date=1993/1-2019/12
http://sealevel.info/190-091_Brest_1993-2016.png
Here’s Brest with six feet of projected sea-level rise by 2100:
Linear:
http://www.sealevel.info/MSL_graph.php?id=Brest&boxcar=1&boxwidth=3&thick&lin_ci=0&lin_pi=1&xtraseg=1&x1=7.130&x2=8.959&g_date=1800/1-2099/12&c_date=1900/1-2019/12&x_date=2017/10-2099/12&co2=1
http://sealevel.info/190-091_Brest_France_plus_6ft_linear.png
Constant acceleration:
http://www.sealevel.info/MSL_graph.php?id=Brest&boxcar=1&boxwidth=3&thick&lin_ci=0&lin_pi=1&co2=1&xtraseg=2&g_date=1800/1-2099/12&c_date=1900/1-2019/12&x_date=2017/10-2099/12&x1=7.130&x2=8.959&xslope=2.100
http://sealevel.info/190-091_Brest_France_plus_6ft_constaccel.png
IMO, anyone who thinks that is plausible needs to get his meds adjusted, or something.
not a peer reviewed
journal paper, just an
amateur
(Crackers: I repeat my warning one last time — no trolling. If you have something constructive to say, and it is on topic, you may do so. Sniping not allowed here. — kh)
Please repair the link to Part 1.
majormike1 ==> Link repaired, thank you for the tip.
Do a daily search on “Sea Level” in the news. The usual story is a meter or more by 2100 and what are we going to do about it.
Here’s a story from Marinij.com this past Thursday:
California has a very low rate of sea level rise. The San Francisco tide gauge records back to 1856 has an over all rate of 1.5 mm/yr and for the last thirty years the rate has been 1.9 mm/yr. Over much of the 20th century that 30 year rate was between 2 and 3 mm/yr.
Source
http://www.psmsl.org/data/obtaining/rlr.annual.data/10.rlrdata
Three feet over the next 100 years comes to an average rate of over 9 mm/yr the question to ask the folks who write these articles is when is this acceleration to these higher rates going to begin to happen? I sometimes doubt that these people even know that there’s a tide gauge in their area.
Steve Case ==> Again, no correction to the Tide Gauge data for vertical land movement — settlement of the river delta mud. It would be possible to come up with valid data, there are several CORS stations around SF Bay.
?????????????
Relative sea level is a function of land movement and sea level change. Correcting tide gauges for vertical land movement is an attempt to measure absolute sea level rise. Absolute sea level rise is what the satellites are trying to measure.
The folks on the West Coast don’t have a problem. Relative sea level is what they need to know and the professors they are listening to are quoting satellite data. It’s a giant bait & switch shell game of propaganda and good old fashion B.S.
If you really want to correct for land movements, there’s the Peltier data
http://www.psmsl.org/train_and_info/geo_signals/gia/peltier/
where values are listed for land movement by tide gauge location.
Steve ==> I was speaking in support of your case — SF Bay is a delta area, where the land subsides on its own as the mud settles.
The Peltier data is an estimate of expected GIA rise or fall of land masses — Pelitier data are not measurements and have not be ground-truthed against continuously operating GPS stations.
PSMSL data sets are not corrected for vertical land movement.
The Western US doesn’t have major concerns about Sea Level Rise (see Part 1).
However, SF Bay locations may have, when subsidence is taken into account.
Thanks for the article, very interesting and I look forward to more. It coincides with a recent experience I had with water levels. I just came back from muskie fishing in Minnesota and had a conversation with my fishing buddy about “tides” on one of the large lakes we fished. I hadn’t thought about it much until I observed what was obviously an “inter tidal zone” along the shore. Not wanting to leave it at that I checked it out with some research when I came home. While there apparently are tides of a few centimeters on large lakes there is a significant change in lake levels caused by seiches. It is a phenomenon where wind and barometric changes can make standing waves that come and go with very low frequencies and is related to the same physics as storm surges. Interesting stuff. Thanks, again.
Steve Lohr ==> Interesting story of the “tides” on Minnesota lakes …thanks for sharing.
Years ago camping one of the the many islands I watch the level of the Lake of the Woods shift a foot with a wind change. Some fisherman unknown to them were running over a reef in a middle of a channel for two day in a roll, did not make over it the third day. The Aluminum boat returned after the grounding the fiberglass boat did not. Yes in large lake wind does make a difference. Of course all could have been avoided it those fisherman had bought a lake map.
“Averaging does not increase accuracy or precision.”
That is a point that has been totally lost in climate ‘science’. They even think that taking averages of uncorrelated model results somehow adds information. We have a hell of a battle to overcome this one.
LewSkannen ==> The idea has infected much of science. I blame computers and the Department of Statistics.
Kip sounds like he’s never progressed beyond the level 101 “Introduction to Statistics” class. Tell me Kip, what does increasing the number of samples have on the estimator for the population mean? Does it not reduce the error of the estimator?
MSJ, I can see how multiple measurements of the same thing would increase accuracy. This is a case of multiple measurements of different things, so it is more analogous to shooting at multiple moving targets. Tell me, O great guru of statistics, how that increases accuracy?
“…I blame computers and the Department of Statistics…..” And I blame people all to willing to support a narrative for ideological reasons. Very informative, thank you.
Mark S Johnson ==> For an in-depth look at the issue, see my recent Series on Averages. Many measurements increase the apparent precision of the mean, but does not evade the original measurement uncertainty (a result of its maximum accuracy — for tide gauges, +/- 2 cm) which must be attached to the resultant mean after calculation.
It is the accuracy/precision of the mean that is in question…..original measurement error does not reduce through averaging.
Original measurement accuray never changes. However, the average of increasing numbers of measurements does in fact increase the accuracy of the population mean estimator. You can’t measure the population mean with a single measurement, hence the accuracy of an individual measurement of said population mean does in fact increase with increasing samples.
You are incorrect to say that: ” which must be attached to the resultant mean after calculation.”
…
The accuracy is determined by the standard error: https://wikimedia.org/api/rest_v1/media/math/render/svg/49c74c15865d7fac09955b1b958feb8ada7362cf
…
Sigma is your “measurement precision.” Don’t confuse precision with accuracy which you apparently are doing.
@ Kip Hansen
I see!
You seem to have made the assumption that the absolute calibration of the instrument is no better than the precision of an individual reading. That is, if a reading is +/- 2 cm, then the final mean must be +/- 2 cm.
Not True!
An instrument can be calibrated far better than the precision of any individual reading. How so, you may ask?
Simple. You lock the unit down on it’s calibration/test stand and let it run *all*day*long*. When you are done, it can be calibrated very accurately, even if individual readings are a bit flaky.
You seem to be mixing up accuracy and precision in some difficult ways, in regards to calibration, and then measurement.
Cheers.
You hit the nail on it’s head TonyL.
…
For example, I can measure the average height of an American male with a 8 foot stick that has markings every foot. Each individual measurement will be to the closest foot, but the average of all the readings will yield the measurement of the population mean to the nearest inch if I take enough samples.
Kip,
If we are defining the uncertainty as the standard deviation (+/- 1 or 2 SD) derived from the probability distribution of the measured quantities, then it appears that the diurnal tidal variations (smallest range) will have the smallest uncertainty, and the mixed semi-diurnal (largest range) will have the largest uncertainty. Thus, a weighted-average should probably be used to describe the average uncertainty for the tidal variations.
You remarked, “…the level of the sea is changing every moment because of the tides, waves and wind, there is not, in reality a single experiential water level we can call local Sea Level.” It should be noted that the instantaneous sea level also changes with barometric pressure, such as when weather ‘highs’ and ‘lows’ (especially hurricanes) pass over an area. To properly assign an uncertainty, all of these factors should be used to construct a probability distribution for a particular interval of time. That is, apparent sea level change varies with locality and date, and the uncertainty varies correspondingly.
TonyL ==> Maybe PSMSL and NOAA will institute increased calibration of there tide gauges. To date, they have not done so. Until then……
Clyde ==> “If we are defining the uncertainty as the standard deviation (+/- 1 or 2 SD) derived from the probability distribution of the measured quantities, ”
You are talking statistics — a language unto itself. Probabilities are not measurements — they are something else altogether.
I am talking measurement error, uncertainty in the actual real measurements. I will demonstrate my point in a future essay. It took a statisticians months to beat this truth into me — I had to do assigned homework, but I learned my lesson.
Kip says: “Probabilities are not measurements”
…
“….. It took a statisticians months to beat….” and they failed miserably. Contact any actuary working in life insurance. They’ll tell you all about the probabilities gleaned from measured life spans.
Troll Johnson demonstrates once again that it is he who doesn’t understand anything.
If you aren’t measuring the same thing, then averaging them doesn’t improve accuracy.
TonyL, in such a situation you have the same sensor reading the same thing thousands of times.
If you took a thousand sensors, in a thousand locations, then averaging those readings would not increase accuracy.
@ MarkW:
Correct. I was specifically addressing *one* tide gauge used for determining MSL at *one* location.
As you know, averaging a heterogeneous collection of readings from all kinds of locations is problematic at best, and invites utter chaos at worst.
Mark’s johnson is displaying a junior high level understanding of measurement .. if that. !!
Please keep going.. Its funny to watch. 🙂
Mark S Johnson writes
No. If you have an 18 foot stick with markings every 6 feet will you still measure the average height with enough measurements?
Now convince me that GMSL is measured accurately with “lots” of inaccurate measurements.
Mark S Johnson
October 7, 2017 at 4:54 pm
Mods – This MSJ seems to be just a troll by its style of insult.
Kip,
If you are measuring something with a constant value, such as the weight of an object, then with respect to the precision of the weight, one only needs to be concerned with the precision (and accuracy) of the measurement instrument. Taking multiple measurements can reduce the random error and improve the precision through the standard error of the mean. Remember, the standard deviation means that ~68% of the readings will be expected to fall within +/- 1 standard deviation. That sounds like probability to me!
However, when measuring something that is changing all the time, such as sea level, then probability does certainly come into account. If one takes a single reading over a day, there is very low probability that the reading will reflect the average level of the water during the day. Despite measuring to the nearest millimeter, a reading taken at high tide might be two or three meters higher than a reading taken at low tide. Thus, even two or three readings averaged does not much improve the probability that one has a representative measurement of the average water level. As the number of measurements increases, the average will approach an accurate estimate of the mean water level for the period of time over which the readings were taken. However, the precision of the individual measurements will remain constant, and will not be improved. The extreme values (high and low tide, large waves, etc.) will have infrequent occurrences and most readings will fall in between and cluster around the actual mean. That is, the probability distribution will provide guidance on both what the mean value is, what the standard deviation is, and whether or not the distribution is skewed. Actually, because of slack water between tides, I suspect the distribution will be bimodal for diurnal tides and maybe multimodal for semi-diurnal.
To summarize, one can take a measurement of the instantaneous water level with reasonable accuracy and precision (you claim +/- 2 cm precision and I have no reason to question that). However, the Empirical Rule states that the estimate for the standard deviation is related to the range of values. That is, for something that is varying, the standard deviation will be larger than if it had a constant value. That is why one cannot average a large number of readings and justify reporting more significant figures. So, I stand by my original claim that one can expect a higher level of precision for the average sea level in the mid-Pacific than for, say, the Bay of Fundy.
Clyde ==> And with that, I wouldn’t disagree.
Mark S Johnson ==> Despite a lot of jargon and definitional proofs, in the real world — where things are measured with rulers and thermometers and yardsticks, the fact remains that when uncertain measurements are averaged to find a mean, the uncertainty of the original measurements devolves on the mean.
As I have promised TonyL, I will write an essay to demonstrate this in simple grade school arithematic.
I will look forward to it.
We can give this topic a rest until then.
Kip, you are confusing the difference between measuring a physical item with estimating a population mean. As I noted above, your understanding of sampling theory (which is a branch of mathematical statistics) is seriously lacking.
TonyL and MSJ,
While we are waiting on Kip to respond, you might want to read these:
https://wattsupwiththat.com/2017/04/12/are-claimed-global-record-temperatures-valid/
https://wattsupwiththat.com/2017/04/23/the-meaning-and-utility-of-averages-as-it-applies-to-climate/
Basically, increasing the number of measurements of some variable will increase the accuracy of the estimate of the mean, but the precision is constrained by the precision of the measurement device. If the thing being measured is constant, then one can improve the precision by eliminating the random error, which should be (in a well-designed experiment) very much smaller than the magnitude of change of some variable.
Before you insult someone, I think that you would do well to be sure that what you believe to be factual actually is. It may avoid some embarrassment and a need to apologize.
Clyde, when calculating a mean, the number of samples is a “perfect” number, hence, the number of digits in the result is the precision of the estimator. Don’t confuse an individual measurement with the measurement of the population mean
One is not measuring a single population mean in climate, one is measuring the change in the average over time. The large number principle might apply to the temperature of Timbuctoo January 20, 2017 @ 1200, but not to single measurements over time of different places.
Mark S Johnson,
I get the sense that you did not bother to read either of the links I provided.
They think that if they take a few thousand measurements from a few thousand locations using a different instrument at each location and a few dozen different types of instruments, on approximately the same day, they can improve their precision by averaging all those readings.
Actually MarkW they can. For example, if you wish to measure the global temperature, going out to your back yard, and reading the value off of your thermometer is not a good measure. If you take ” a few thousand measurements from a few thousand locations using a different instrument at each location,” you are going to do much better than what is happening in your back yard.
” you are going to do much better than what is happening in your back yard.”
WRONG !!!!!
A number of statements and claims here need to be corrected. I have time only for the following:
Tide gauge accuracy is limited primarily by the residual effects of wind waves. Since they introduce short period, zero-mean fluctuations, averaging a large number of independent readings decidedly reduces the inaccuracy of sea-level estimation from this high-frequency effect.
The most rudimentary reflection should alert us that this cannot remotely work in the case of mixed tides. Even a full diurnal cycle is not enough. Experience indicates that a rough estimate of MSL can be obtained from hourly tide-gauge readings over a lunar month. For close oceanographi work, a period covering a full cycle of the precession of lunar nodes (18.6 years) is the preferred standard.
All in all there’s a lack of analytic comprehension of the issues involved. A professional summary of vertical datums can be found here: https://www.ngs.noaa.gov/datums/vertical/
1sky1 ==> Yes, I referenced the NOAA page on tide datums and their page on what tides are.
Tide gauges today use stilling wells to limit the effects of wave action on the readings and have backup pressure sensors to groundtruth the acoustic sensors. However, each individual reading of the acoustic sensor is only accurate to +/- 2 cm — the reading itself, independent of the actual water level outside of the stilling well. Thus, tide gauges do a wonderful job in establishing how much water a ship will have under its hull in the harbor at any given time — the 3/4 inch is simply irrelevant to the real purpose of the tide gauge — quite wonderful accuracy for that purpose, in fact.
Please don’t mistake my flippant remark about Mean Sea Level being practically determined by personal experience — it is only meant to apply at that level.
SteveF is right. Having more samples does improve the estimate of mean in the way he describes. That’s why, in so many circumstances, people go to much cost and trouble to get a large sample.
Sorry Nick if you have a moving background having more samples does nothing, yes it works on a static background. What you are basically saying is you could measure a ruler several billion times and by doing so improve the accuracy of the measurement.
One slight temperature change expanding or contracting the ruler says that everything you just said is stupid and if you don’t understand why you should not be commenting.
It is very clear from ‘warmists’ responses to this article as well as the one on ‘random walk’ earlier, that they completely misunderstand or misuse how statistical techniques can be used.
The =-2cm error band applies to all and every reading, however many you take with the same equipment. That means there is an equal probability of the actual measurement being anywhere in this band. All you do with the thousands of readings is produce a probability distribution and calculate a mean. However that just says that it is more likely that the center of the band is in one place, it does absolutely nothing to reduce the equal probability that it actually lies anywhere within =-2cm from that mean. Kip will no doubt follow with the equations that demonstrate this mathematically. But it is very simple logic if you use your noggin rather than rely on ‘computers’.
You don’t understand what you are talking about. Neither does this post’s author. Uncertainty in the estimate of the true mean of a population falls as 1/(n -1)^0.5; where n is the number of independent meadurements from that population. It is perfectly reasonable to consider the true mean sea level at a location as the average of a ‘population’ of different measured levels over time. The suggestion that the accuracy of the mean sea level at a location is not improved by taking many readings over an extended period is risible, and betrays a fundamental lack of understanding of physical science.
james ==> You are quite right.
stevefitzpatrick ==> I recognize that you are speaking from your education and that you repeat your understanding of what you have been taught. Keep watching here at WUWT and I will present an essay sorting out this point for those of you with classical statistical educations. It is not that you are wrong — but it is a misapplication of something that is true in one field and not true in a larger pragmatic sense.
stevefitzpatrick,
What you claim is only true for something with a fixed value where the uncertainty comes from either estimating a Vernier or trying to guess the correct last value for a digital display that is fluctuating.
Consider this: There have been hundreds of thousands, if not millions, of individuals who have taken IQ tests. The mean is nominally reported as 100 (not 100.000). Individual scores are typically reported to, at most, a single digit. It is usually acknowledged that scores for an individual may fluctuate several points when re-tested. Thus, it is not particularly informative to even report an IQ to more than probably about +/- 5 points. Re-testing may provide bounds, but averaging to try to improve the precision is pointless.
stevefiztpatrick, I feel like I am trying to educate someone about the difference between velocity and acceleration! Yes of course your equation is correct, and is exactly what I said. The more readings taken will produce a distribution around a mean, that mean is the center of a 4cm wide band. It doesn’t matter how many times you take the reading, the 4cm band remains because there is an equal probability of the ‘actual’ being within that band for every reading taken. Think of it this way, every time you take a reading you just move the 4cm band up or down a bit, you never reduce it.
What’s truly clear is the abject lack of any recognition that sea-level estimation is not an ordinary statistical problem but a signal detection and estimation problem in geophysics. Sadly that issue is obscured by those who have never actually done the science, but assume that whatever challenges their Wiki-expertise must be wrong.
More on this tomorrow.
Kip Hansen,
Not from my education, but from 45 years work in science and engineering. The uncertainty in an estimate of a population mean most certainly becomes smaller with more measurements of the population. The uncertainty in the mean sea level at a tide gauge location becomes smaller when many readings are collected over an extended period. The uncertainty in a single reading of a tide gauge is due to external influences like wind driven waves, and not due to limited accuracy of the measuring hardware. Variation due to external influences will average over time; a long term secular trend (eg long term sea level rise… or even a long term fall where glacial rebound is large) will not average out. Any suggestion that it is impossible to measure average sea level at a location with an irreducible uncertainty equal to the uncertainty in a single measurement is simply wrong.
Steve ==> I will send you a copy of the upcoming essay on this point if you wish — you will understand and see that, in the end, we agree about this. It is elementary arithmetic, not statistics, that are the basis of this point.
James Wbeeland,
And I feel like I am trying to educate someone who is disconnected from actual science (or engineeting) experience. The uncertainty in a population mean in a single measurement can be (and routinely is) reduced via taking multiple measurements of the population. To suggest that the mean sea level at a location is uncertain to +/- 2 cm because a single measurement has that uncertainty (due to things like waves) is risible.
Kip Hansen,
If you want to send something then I will read it… and tell you where it is wrong.
stevefitzpatrick,
You should keep in mind that many of us commenting here have similar education and work experience as yourself, and stating yours isn’t going to cut it because we generally don’t give much credence to anonymous authority. Is it possible that after 45 years you misremember some of the details of what you ‘learned?’
Have you read the material at the links I provided above? I address the issue of improvement of precision, with multiple measurements, with some detail in my article, with references.
I have stated that the accuracy of the estimate of the mean will improve with multiple measurements, but the precision will not.
I am not entering the debate as both are sort of right. What you are arguing over is measurement background, Clyde Spencer in his discussion of IQ showed a moving background because IQ measurement is somewhat subjective on test conditions a fact he noted.
If the background is static you can use statistics to improve the accuracy in a simple way if the background is moving it gets a lot trickier. It crops up in physics in all sorts of place like trying to take measurements in a spacetime that is expanding, rotating and moving.
Any physical measurement of even a ruler has a problem that the place you are measuring on Earth is rotating and the ruler is slightly longer or shorter depending where you measure it regardless of how many times you average it. The averaging is telling you more about where you measure it rather than any accuracy.
The question you are all trying to sort out is the measurement background stable enough to allow statistics. I don’t know the subject well enough to have a view but both groups are failing to describe what they are arguing over, so hopefully this sorts that out.
As a suggestion both groups could state what they believe the background tide gauge movement is. For example on the ruler case I gave above I would accept a measurement in millimeters with a couple of decimal places. You try to give me a number in millimeters with 20 decimal places and I am going to laugh myself silly at you.
SteveF is right. Having more samples does improve the estimate of mean in the way he describes. That’s why, in so many circumstances, people go to much cost and trouble to get a large sample.
NS,
You said, “That’s why, in so many circumstances, people go to much cost and trouble to get a large sample.” Perhaps they “go to much cost and trouble” because they haven’t done a formal cost-benefit analysis and just assume that more is better.
Clyde Spencer,
Yes, I read the essays… utter rubbish, betraying the same gross misunderstanding of the subject as your comments on this thread. Really, you have not a clue what you are talking about.
stevefitzpatrick;
I want to thank you for taking the time to respond in detail regarding how and why my essays were wrong, and not just ranting about how things you disagree with are rubbish, as happens all too often here with people who are convinced that they are right and everyone else is stupid. I’m glad that you aren’t the kind of person who has a closed mind and thinks he knows everything and doesn’t feel any need to provide references for his claims. Readers here will see you for the kind of person that you are, and you should consider that your reward for your efforts.
Kip….great piece….very informative and a good read….can’t wait for the second installment!
Latitude ==> Thank you….the next part will cover sea level based on Satellite Altimetry.
You’ll find this interesting….I know it’s huge….but reading between the lines they admit it’s all fake
…they launched a new satellite…when it didn’t give the answers they wanted….they tuned it to match the old satellites that were failing and giving bad data/um….
It’s a hoot!
CalVal Envisat
Envisat RA2/MWR ocean data
validation and cross-calibration
activities. Yearly report 2009.
https://www.aviso.altimetry.fr/fileadmin/documents/calval/validation_report/EN/annual_report_en_2009.pdf
Latitude ==> Thanks for the link — I’ll check it out.
Kip, Keep up the good work.
The ultimate accuracy of any radar is not the return edge of a pulse, but when you get into the weeds of actually getting down to measuring the RF signal wavelength. (in GPS it’s CA vs matching up the actual RF signal (based on the PSN code). Then you get accuracy. With 4 satellites you can get down to sub meter accuracy. (actually closer to an inch or two) But still not mm accuracy. A single RF source like used for altimetry and at that frequency (2 cm wavelength) it’s not realistic to expect mm results.
What you are fighting here are people that believe statistics can overcome precision.
Sorry, but my introductory courses on my way to a Physics degree taught me better.
People live in the real world. Not in a statistical world.
A good example is the recent hurricanes. Ground level anemometers really showed nothing above low level hurricanes. But the statistical geniuses that misused data from a dropsonde turned a rather mundane hurricanes into a a catastrophic event.
EW3 ==> Thanks for your support. I will write an essay demonstrating why we can’t just throw out the original measurement uncertainty when calculating a mean.
Is it not the case that precision depends on the resolution limits of your measuring system, too, to a degree if not totally?
I admit it has been many years since I sailed the strait of Juan de Fuca. It was long enough ago that I did not have an electronic chart plotter. I had only depth charts and tide tables. As I remember, the soundings printed on the depth charts were actual depth at mean low tide in order to show typical depth at minimum water. Printed tide tables were corollated with mean low tide, also. Low neap tides often had positive numbers. If the tide table listed the low tide as +2.3, I knew to expect at least 2.3 feet more depth than chart soundings indicated. This system was developed in the days before accurate time pieces. If a captain new the minimum depth for a given day, he didn’t need to know what it was at every moment of the day.
While I never checked, I always assumed the zero point on a tide staff marked mean low tide so that tide tables would aligned with the tide staff.
SR
The datum level for USGS charts of West Coast waters is mean LOWER low water (MLLW), appropriate for the semi-diurnal tides experienced there.
1sky1 ==> Yes, MINIMUM water expected to be experienced. But not the negative storm surge experienced in Tampa Bay recently, for instance.
MLLW is the mean, not the minimum, of the lower of the two diurnal lows.
BTW, what happened to my comment from half an hour ago?
1sky1 ==> You have a comment here: that it?
Stevan Reddish ==> Tide markings on nautical charts do show the depth at low tide and represent the minimum water expected at the location. The link is to a chart of the Virgin Islands that I have depended on many times.
Just saying, if I am a sailor 100 years ago and I was measuring low water marks i think I would purposely say the low was a little shallower then it really is, just for an extra margin of safety.
Which is why the British and others use LAT as a chart datum to give a little extra safety margin.
I live on the west coast of Australia and seen no evidence of the sea level rise shown in the NOAA Satellite altimeter chart… Ie red =+20cm. Surely Australian land mass would be one of the most stable on the planet, so that probably leaves shrinkage from bore extraction and lower rainfall.???.
Kip
It’s an excellent article. No typos at all that I spotted. (But I’m a lousy proof reader). A few points:
You didn’t mention the need to filter out wave motion. That’s typically done with settling wells of one sort or another although it can be done digitally if your measurement interval is sufficiently short.
You left out barometric pressure as a variable. It is important enough to affect sea level measurements. Roughly 1mm of water level change for one mm HG of air pressure change.
You should not be surprised that PSMSL measurements are not corrected for tectonic changes in gauge elevation. Measuring how fast sites are rising and sinking is extremely difficult . It’s possible to detect a tide gauge that is actually sinking into the muck using surveying, but regional isostasy from glacial rebound or above a subduction zone requires something like GPS — which is just barely able to do the job and takes years of observations to do that. You can’t just plunk your GPS down next to the gauge, go off and get a beer, and come back to get your reading. Not surprisingly, not all, or even most, stations have good tectonics information.
One special case of local sea level. Wherever tidal gauges are situated along a coastline that is parallel to a chain of active volcanoes — e.g. the coasts of Oregon and Washington — it is likely that the tidal gauges are being pushed upward by material being piled up under the coastline by the underlying subduction phenomenon. The problem is that at some point that subduction zone will likely come “unstuck” with a magnitude 9 earthquake and the tidal gauge will abruptly drop a meter or two. We don’t currently know how to correct apparent SLR for that.
Don ==> “requires something like GPS — which is just barely able to do the job and takes years of observations to do that. You can’t just plunk your GPS down next to the gauge, go off and get a beer, and come back to get your reading. Not surprisingly, not all, or even most, stations have good tectonics information.”
Yes, this is the CORS project of the NGS. It does take very long term data and then a lot of calculation to determine the a long term average. This paper is a sample of calculated rates of vertical land movement.
I haven’t seen here any discussion of the change in the shape of the earth itself (not just the seas) as a result of the pull of the sun/moon. The earth is an oblate spheroid made that way because of it’s spin and in addition the nearest and most massive neighbors continuously change that shape with their gravitational pull. This obviously creates differences in the distance to the theoretical center of mass and will correspondingly influence – at least theoretically – any tidal/sea surface height information.
Is this effect orders of magnitude too small to be of any use here?
NW sage ==> The global sea level gurus have decided that since the Earth has changed shape over the last century due to GIA, that this means that the volume of the sea increased, causing sea level rise to “look” to be smaller than it really was. So they have added a bit to the records to make up for it.
You may rightly ask if that really has anything to do with SLR — if the sea surface did not actually rise at all….beats me.
Kip> I might add that not only is the GIA “correction” to satellite altimetry hard to understand, it’s also based on modeling that is highly dubious. There’s plenty of evidence that glacial rebound is a real phenomenon, but the models used to compute it and extend (assumed) land motions equatorward and into the ocean basins look to be even shakier than alarmist climate models. No one even tried to figure out how surface vertical motion in one place affected motion elsewhere until the late 20th century. There are two models of “local” ground surface motion in response to stress from isostasy — both of which are thought to be wrong BTW..
Aside from which — satellites have their problems which you’ll presumably address in your next paper.. But they measure your general planetwide sea level rise (That’s Eustatic rise, right?) directly.and wouldn’t seem to need a “GIA” correction. The only conclusion I can come to is that CU’s GIA correction is political, not scientific. My bet is that the correction wouldn’t be there if it had the opposite sign and made SLR look smaller.
I have seen this myth quoted time and again here. It is wrong. Given normal probability distribution of errors, measuring the same thing many times on many instruments gives a vastly improved accuarcy and range of error.
This is such a fundamental principle of science – that the more times you do an experiment to establish a particular numerical result the more accurate is the averaged result, provided that the reasons for inaccuracy are random – that I fail to see why it is not understood.
+100 Leo
…
As I have posted elsewhere, you can measure the average height of an American male, with a stick having marks at 1 foot intervals, if you take enough samples.
Mark writes (again)
Except this is not generally true.
Specifically say your stick has graduations of say 3 feet, not 1 foot and lets assume that the true average height is 6 foot 1 inch. So now when you measure you’ll find many measurements of 6 feet, essentially none of 9 feet but still quite a few of 3 feet which will mean an overall average of something less than 6 feet.
So you measured “6 feet” many times but your average was less accurate.
This doesn’t make intuitive sense, but is it true? According to tall.life, the average american male height is 5’9.3″, with a sd of 2.94″. They give 13.1 percentile at 5’6″ exactly, and 99.846 at 6’6″ exactly. So measuring all the American males with a 1 foot marker would give 13.1% at 5 feet, 86.746% at 6 feet, and 0.154% at 7 feet. (They give 0 percentile for 4’6″ in below, but it’s actually 1 in a bit over 10 million). Calculating the average from that gives 5.87 feet, or 5’10.4″ — it overestimates the average height by over an inch! The problem is that because there are far more men being rounded up to six feet instead of being rounded down to six feet, the granularity of the measuring stick is introducing a systematic upward bias.
This is measuring a (assumed) normal distribution, so at least the final result, if way off, is still closer than the six inch error margin. What if the distribution isn’t normal? What if we’re using these one-foot marker sticks on manufacturing output that is normally 1’7″, but 10% of the time comes out at 7″. The true average length is 1’5.8″, the measuring stick method pegs the length at 5’10.8″ — a whopping 5 inches off and nearly outside the 6″ error margin — and larger than *any* of the gadgets actually produced.
Now suppose we take the same one-foot measuring stick and measure the *same thing* a million times — a single man of height 5.7″. The original reading tell us the height is 6′ +/- 6″. And after a million readings of this man with the same measuring stick, the results should tell us that his height is — 6′ +/- 6″. It should not tell us that his height is 6.0000′ thanks to the law of large numbers.
Dale, measuring the height of an individual a million times is not measuring the average height of a population. Apples and oranges. It’s the same reason you don’t look at a thermometer in your back yard to measure global temperatures.
…
Oh, by the way Dale, there are tests to determine if things such as “height” are normally distributed: https://en.wikipedia.org/wiki/Normality_test
Mark, your response isn’t responsive to the fact that I showed your claim was wrong. You claimed a one-foot increment would be sufficient to estimate the average height of the American adult male. But if the numbers represent a normal distribution with the mean and sd provided at tall.life, your claim was wrong — even if you sample the entire population.
Linking to a “normality test” is also unresponsive — if you tested every American adult male with your one-foot-increment ruler, you’d find most values at 6, a small fraction at 5 and a tiny number at 7. You can’t prove that the distribution is normal from those results, even if it is.
The example of measuring the same man a million times was simply to show that the number of measurements *by itself* does not magically confer accuracy on the results of many crude measurements.
The population here is not the population of *men*, it is the population of *measurements*. Taking many measurements will drive the mean towards the true value, but it’s the true *measured value*, not the actual value, and in this case there’s five inches difference between the two.
If that bothers you, consider a thought experiment where there are a million *completely independent* samples are taken from a population of men who are from a normal distribution centering on 5’7″ with an sd of 1/10″, the law of large numbers will *still* get nowhere near 5’7.000″ .
Where I and you and several other commenters disagree it that it is not multiple measurements of the same thing, but multiple measurements of change in a quantity. The analogy of measuring the average height of a population with an eight foot ruler marked only every foot would do a rather bad job of measuring the growth of adolescents.
Tom, measuring the “average” and measuring the change in the average are not the same. There is the element of repetition and the time interval which is applicable to measuring the average itself. I believe you are concerned with “anomalies” and not averages themselves. Note that “anomalies” and “averages” are two distinct measurements that although related are not identical.
Tom, if you used the stick to measure the average in, oh, say 2010, then repeated the same measure in 2016 with the same number of samples, you would be able to detect a change if one occurred.
In the example of the eight foot ruler and adolescent’s growth, the change is typically less than the measurement granularity of one foot. So, to use myself as an example, i grew from 5’2″ to 5’11” in eighteen months, and the ruler would show no change, as it only measures to the whole foot.
Tom, apples and oranges. The example of the stick I used is for measuring the population mean not an individual’s height. You don’t look at the thermometer you have outside your home to find out what the global temperature is.
….
Do you understand the difference between a “population mean” and an “individual measurement?”
Yes, and the mythical stick would have Samoans and Thais having the same average height.
Tom, maybe, maybe not. You would actually have to measure each population. After you do the measures, you’d see if there was a difference.
To get back on topic, how one purportedly finds a change of .001 with an instrument that reads to the nearest whole number. . .
By taking enough measurements. The standard error is equal to the standard deviation of the measuring instrument divided by the square root of the number of samples
..
https://en.wikipedia.org/wiki/Standard_error
And as far as climate, the average temperature does not matter all that much, when one considers such things as what one can grow where. What has changed since the LIA was the gradient by latitude more than the overall temperature, with high latitudes with the significant warming.
As an example of how average temperature does not matter much, I could grow citrus in Concord, CA (eastern Bay Area) while I cannot in Cottonwood Shores TX, which has a rather warmer average temperature. It has snowed twice here in nine years, which did not happen in CA.
“By taking enough measurements. ”
ROFLMAO
You have a lot to learn about maths, don’t you little johnson.
You need to go and actually learn about when that rule can be used.. and when it can NOT.
Tom, what you are saying here would be self-evident to a reasonably thoughtful child. That your interlocutor appears to be incapable of grasping such a simple and blindingly obvious truth is revealing indeed.
Leo ==> “Given normal probability distribution of errors, measuring the same thing many times on many instruments gives a vastly improved accuracy and range of error.” — In what case can one assume a normal probability distribution of errors when the original measurement is a range of values, for unknown reasons, surrounding central, single recorded figure? Temperatures recorded as whole numbers (“72”) which is the recorded vale for any temperature between 72.5 and 71.5. In this case, we are not dealing with “errors”, we are actually recording a range of values with a shorthand notation. There is no reason to believe or assume that Nature has magically favored values nearer the central recorded value — each and every possible value between 72.5 and 71.5 may have equal occurrence, or every value reported as 72 may actually be 72.5.
“that the more times you do an experiment to establish a particular numerical result the more accurate is the averaged result, provided that the reasons for inaccuracy are random” — again, there is no reason to believe that Tide Gauges, or any particular installed Tide Gauge, are randomly inaccurate. When NOAA says “the “Aquatrak® (Air Acoustic sensor in protective well)” — has a rated accuracy of “Relative to Datum ± 0.02 m (Individual measurement) “ they mean that explicitly –the Tide Gauge reports a single figure, but it may be 2 cm more or 2 cm less than the report. in effect, each measurement represents a possible range of values between, say if the recorded value is 100, that means in reality any value in the range from 102 to 98. We have no scientific or logical reason to assume that the central figure is preferred by reality.
Suppose you have a ruler marked in cm.
You measure one stick as 11cm. That measurement is between 10.5 and 11.5
Another stick measures as 15 cm, ie between 14.5 and 15.5
The mean is 13cm, but the mean of the low error is 12.5 and the high error is 13.5
There has been NO IMPROVEMENT in the error. end of story !!!
The use of sqrt (n) ONLY applies if you are measuring from a sample that can be assumed to be constant and normally distributed
Temperatures around the world most certainly are neither.
And bear in mind, most of these measurements are (Tmax – Tmin) /2
If anyone thinks this gives a true average of a day’s temperatures, they really need to go back to pre-junior high and start again, this time with some sort of actual thought process.
“measuring the same thing many times ”
But you are NOT measuring the same thing.
assumptions of normal distribution are a load of suppositories.
“Given normal probability distribution of errors, measuring the same thing many times on many instruments gives a vastly improved accuarcy and range of error.”
Only partially true, it should be
“Given normal probability distribution of errors and independent and identically distributed variables, measuring the same thing many times on many instruments gives a vastly improved accuarcy and range of error.
And incidentally hydrological time-series data are usually not normally distributed. More commonly they are Hurst-Kolmogorov distributed.
“This is such a fundamental principle of science – that the more times you do an experiment to establish a particular numerical result the more accurate is the averaged result, provided that the reasons for inaccuracy are random – that I fail to see why it is not understood.”
Well .. yes … Basically, I’m on your side. HOWEVER, there are obviously some constraints. For example, if you are sampling a periodic phenomenon like tides, you need to avoid sampling at the frequency of the event or multiples thereof because if you sample at an integer multiple of the period, you’ll always get the same value. I think that’s probably Nyquist and that probably you need to sample at a rate greater than 1/2 the period of the phenomenon. Likewise, if your measuring stick is calibrated in km, all the measurements will be 0. And even if your measurement units are somewhat smaller than the tidal excursions, I’d worry about quantization and aliasing problems.
I’m going to go off and think about this in hopes that I’ll learn something.
If you had been doing serious statistical analysis of field data you would know that data are very often not normally distributed. Always do a normality test first of all.
Then you know if “standard” statistical methods can be used or not.
And by the way there are plenty of pitfalls even for normally distributed data, for example did you know that standard line regression cannot be used for time-series data where there is uncertainty in the sampling times (which does not apply to tidal gauges but almost alway to proxy data).
tty – AFAICS virtually nothing except some aggregate measurements on unthinkably large numbers of objects in physics, chemistry, astronomy actually distributes normally. But a lot of stuff comes close.enough for gaussian approaches to be useful. And Central Limit Theory really does seem to work most of the time — even for cases like miltipeaked distributions..
That said, the stuff we were taught in Statistics 101 really does need to be viewed with a lot more skepticism than is typically applied. In fact statistics and probability is HARD and most of us — me included — don’t seem to have much aptitude for it.
Averaging many measurements reduces random error. It does not reduce systematic error.
Mr Smith, but in this case they are not ‘random’, they are physically the same every time, ie the instrument has an equal probablity of its reading representing an actual event somewhere in the band +-2cm. This cannot be ‘averaged out’ as if its a random event. The only thing that can be ‘averaged out’ is the position of the center of the band.
This fundamental error of logic applies throughout ‘climate change’ modelling.
LS,
You said, “… the more times you do an experiment to establish a particular numerical result the more accurate is the averaged result,…” Implicit in your statement is that there is a single answer, such as Avogadro’s Number, and the only variation is from random measurement error.
What we are focusing on here is something that does not have a unique, intrinsic value, but has a range of values over time, and we are trying to characterize it with an average value and the observed variance. Assuming a well-calibrated measuring device, the accuracy of the estimated mean varies directly with the number of measurements, approaching the correct value asymptotically, as per the Law of Large Numbers. However, the precision does not increase with increasing measurements. In fact, the apparent precision of the mean may decrease as more measurements take in extreme values on the tails of the probability distribution. Fundamentally, the precision of the estimate cannot be greater than the precision of the measuring device, and may well be lower because of a large variance in the variable. Also, there is no guarantee that the variable has a normal distribution.
Constants are a whole ‘nother ball game!
LS,
You said, “…measuring the same thing many times ON MANY INSTRUMENTS gives a vastly improved accuarcy and range of error.” You would have us believe that conflating a distance measured by chaining, with the results of a laser range finder, will provide increased accuracy and precision over that provided by the laser range finder alone? The chaining might provide a ‘sanity check,’ but is hardly to be considered to be of equal reliability and precision as modern technology. The incorporation of the chaining measurement(s) would lead to reduced precision, as would be evident by a rigorous analysis of error. The rigorous analysis of error is what seems to be blatantly missing from much of the work in climatology.
Yet another wonderful confirmation that the Earth and Moon co-Orbit the Barycenter, i.e. gravitational center of attraction at a location about 1700 meters deep in Earth’s mantle below the Lithosphere. And the joys of Plate Tectonics do live.
What about rising sea levels from polar ice caps melting? Did I miss that part?
Maria ==> This essay is about measuring tides and relative sea levels using tide gauges. It is not about the causes of rising sea levels or whether or not they are rising. Melting Arctic ice cap (mostly sea ice) does not cause any sea level rise. Only melting land ice could cause sea level rise, assuming that there is an imbalance of summer melt and winter gain.
Maria – As Kip mentions, sea ice that isn’t “grounded” by contact with the land’s surface is floating and displaces precisely enough water to compensate for any “rise” when it melts. That’s called Archimedes Principle. If it isn’t clear, try Googling it. You should come up with lots of illustrations that will hopefully clarify what’s going on.
BTW, the IPCC sea level folks seem nowhere near as obtuse as the climate and economic folks. They have been working throughout the history of the Assessment reports on a “budget” for sea level rise that matches known causes to the observed rise. The budget is still not quite right (their opinion). But it’s getting closer. As of AR5 they ascribe about half the observed SLR to thermal expansion of the oceans, a quarter to glacial melt and the remaining quarter to some combination of polar ice (mostly Greenland) melt and depletion of ground storage.
The point i would make is do we need to measure it at all,sea level rise is so slow if we saved all the money wasted on this kind of research we would have a whole lot of spare money and time to fix the problems as they arise better planning would also mitigate a whole lot of these scare sciences.
“It’s so much easier to suggest solutions when you don’t know too much about the problem.”
― Malcolm Forbes
Fred — The problem is that we don’t sensibly restrict sea front development to stuff that has to be there like docks and things that can be quickly moved inland like “tents” and things that can be inundated without harm like parking lots. Instead, we build all manner of stuff as close as 60cm (two feet) above the highest high tides. And, of course, when a big storm comes along, billions of dollars worth of infrastructure get drowned/busted up.
Therefore SLR becomes a significant economic issue. .If we get a foot of SLR in the 21st century, half the already inadequate buffer between people and ocean will be gone.
Fred and Don K ==> Don is exactly right. See Part 1 of this series and two recent essays: one on Miami and one on Guangzhou.
“we must first nail down Sea Level itself.”
I think if you try to stop the sea level rise that way, you will find some technical difficulties.
Roha ==> Gonna use special water nails….guaranteed to hold it in place.
Be sure to freeze them first. It will increase the shear strength significantly.
When it comes to measure the acceleration (or not) of sea-level rise uncorrected tide gauge data are perfectly good. My favorite example is the Kungsholmsfort gauge in Sweden.
All of Sweden is rising due to the isostatic effect of the last glaciation. This has been known (and studied) for almost 300 years and the amount of rise is therefore known to a high degree of precision (and has been verified by GPS measurements at a large number of sites in recent years (SWEPOS system, 350 sites))
http://www.klimatupplysningen.se/wp-content/uploads/2014/04/Absolut.jpg
In southernmost Sweden this rise is less than the sea-level rise and the relative sea level is very slightly rising. Kungsholmsfort (an old coastal fort sited on solid Archaean bedrock) happened to be situated almost exactly on the line where sea-level rise and land rise coincided when the tidal gauge was built in 1886.
And – surprise, surprise – it still is:
http://www.psmsl.org/data/obtaining/rlr.monthly.plots/70_high.png
Mean annual sea level for the first full year of measurement (1887) was 7037 mm above datum and for the last full year of measurement 2016 was 7036 mm above datum.
Since the land rise is very nearly linear – it has been going on for 15,000 years, and will probably go on for quite a while more – the only possible explanation is that there is no “acceleration”. The absolute sea level at Kungsholmsfort was rising by slightly less than two millimeters per year 130 years ago, and it still is.
There is one small complication, because of self-gravity effects melting of the Greenland icecap has very little effect on sea-levels in northern Europe (about 10% of global average at Kungsholmsfort), so if the presumed acceleration is exclusively due to increased melting in Greenland it would not be noticeable at Kungsholmsfort.
As you say, tty, the effect of accelerated Greenland ice melt wouldn’t be very noticeable at Kungsholmsfort, because of gravity field changes, as explained here:
But it would be noticeable at Honolulu, if it were substantial. Do you see any acceleration there?
http://www.sealevel.info/MSL_graph.php?id=Honolulu
http://sealevel.info/1612340_Honolulu_vs_CO2_annot1.png
True, and as a matter of fact the Central Pacific is the area where glacial melt in Antarctica and Greenland adds up maximally, which is probably also the reason that most islands there show clear evidence of significantly higher sea-levels in the mid-Holocene.
So “acceleration” would be expected to show up clearly at Honolulu.
tty, you see a similar situation in Britain, the pivot point is approx Teeside, north of that point is rising ( ie Scotland) and south is sinking ( England), there is also a lesser west/east effect as well.
Tide gauges are the nautical equivalent of thermometers at airports: They are not scientific, they only show the local conditions that pilots need to know about.
Often wrong. Many tide gauges were installed for scientific reasons. For example all tide gauges in Sweden (and other Baltic countries), since there are no tides in the Baltic.
That is just fabricated nonsense.
Tide gauges are installed so there is as little interference from local conditions as possible, eg waves, boat wash etc
Thermometers at airports …… no such consideration.
And of course tides are very constant in period and amplitude, so much so that high tide and its level can be predicted with very good precision.
Entirely different from airport thermometers.
What about earth’s rotation rate? Is Nils Axel Morner in on this?
Lion ==> I have had correspondence with Nils Alex-Morner’s co-author over the last month. I don’t know his personal views on this topic, but nothing I say in my essay contradicts any of his published work.
Earth rotation rate is affected by transfer of mass from the Arctic to lower latituden and vice versa, i e melting/expansion of polar icecaps, but not by sea-level rise per se.
I thought they were putting in tide gauges with GPS to try and sort out the mess with sea level rise?
Yes, but it takes several years to get good enough data to sort things out. And there is no law that says that ground subsidence (or rise) has to be linear. If it is natural isostatic or tectonic effects it is probably close to linear on century timescales, but if it is due to human action (compaction, loading by buildings or fill material, groundwater extraction/drainage) it might be strongly non-linear.
LbD ==> Yes, they are. Both NOAA CORS and Sonel (linked in other comments) along with PSMSL GLOSS network are moving along. The programs concerning tide gauges and Continuous GPS however are not tightly coordinated at this time, but it will come together eventually. Once we are sure what the land (to which the tide gauges are attached) is doing, then we will have a better idea of what the sea is doing — in that one place.
Until someone can explain the difference between accuracy and precision, in one simple sentence, I’ll keep thinking it’s all just a matter of semantics.
So there.
Precision is how many significant digits you present, accuracy is the gap between your value and the true value.
NZ Willy,
Very good!
Interesting article, but why do you not talk about air pressure. The tide will be at a different height depending on whether there is a high pressure system or low pressure system overhead. These differences can be significant. There appears to be no compensation for air pressure which makes readings suspect.
Southern Leading ==> Tide Gauge data is not about what is causing the tides — only what are their measurements across time.
Corrections for air pressure and other rather small confounders may come into play when Tide Gauge data is used to try to figure things like local sea level rise or global calculations.
Air pressure does not have centimeter effects — and tide gauges are only accurate to +/- 2 cm.
I generally like your article Kip, but have to slightly disagree on this particular issue – air pressure DOES have an effect on tides: 1mBar change in air pressure is equivalent to 1cm of water level. I speak as a manufacturer of tide gauges, and the most common method is to use an immersed pressure sensor which must either be vented to atmosphere via a tube to maintain a consistent reference and a relative reading, or the data must be post-processed to subtract in independent atmospheric value from the absolute reading from a non-vented sensor.
The Aquatrak sensor you describe is immune to atmospheric effects because it just measures range to target (the water surface); more modern radar sensors also do the same, but without being affected by changes in sound speed through the air. Both will give “actual” tide heights (within the limits of their accuracy), but that value will have been influenced by the atmospheric pressure at the time – a high pressure will depress the tide by 1cm per millibar, and a low pressure will similarly elevate the tide.
Having said all that, I do appreciate that the purpose of this article is not to discuss the causes of the change in tide height, and as far as I am aware, mean atmospheric pressure is yet to be included in the list of things heading in a worrisome direction because of climate change. On that basis, over a reasonable time frame you could expect these effects to average out anyway.
As a final point, most manufacturers these days would quote you a sensor accuracy of ±1cm or better. This can easily be worsened by poor installation or sampling pattern, so I wonder whether your figure of ±2cm is quoted by NOAA taking such factors into consideration, rather than the manufacturers themselves?
You still get an A for the article though.
Matt ==> Thank you for your expertise in the area of Tide Gauges. The exact gauge accuracy data quoted is from the NOAA document “Sensor Specifications and Measurement Algorithms”, the document being supplied to me by NOAA in personal communication. Note that this communication was answering my question as to the exact type of sensor installed at the battery in New York. It was explained to me that NOAA did not normally supply the sensor data as all installed sensors had the same accuracy specs — which is true — +/- 2 cm for all the various sensors for individual readings. They do not explain the basis for the “Estimated Accuracy”.
The illustration for the “Aquatrak®” sensor is supplied at a NOAA page regarding tide gauges and features a pressure water level sensor as a back up to the Aquatrak itself (the illustration is in the main essay.) For the Battery, NY data on sensor types is given here. Before I wrote this essay, the water level sensor was noted to be “backup sensor” — today it is back to Acoustic WL (water level).
And thanks for the good grade….I can use it.
Kip,
You said, “Air pressure does not have centimeter effects…” Except during hurricanes!
Kip — Just a guess based on (too many) years working on government contracts in my youth. The NOAA +/-2cm value may be a “spec value” rather than a measured value. A spec value means that if one is bidding to upgrade/replace/install a tide gauge, the sensor you use must be as good as or better than the spec. Conceptually, although not so often in practice, if your gauge doesn’t meet spec, you will be obligated to bring it into spec at your own expense.
Don K ==> Yes, I am certain that it is the Specified Accuracy — manufacturers must guarantee that the instrument is accurate to that spec. What the actual, in use, accuracy is, NOAA does not state — they simply maintain that all of their approved water level gauges are accurate to the +/- 2 cm standard.
The actual accuracy of any one tide gauge may be within the spec, or may be outside the spec. The Battery, NY was last week operating on the backup sensor, and this week is back on the acoustic sensor. This is the reason for the sensors to all t=have the same required specs….so that they require no adjustments when shifting from the backup to the prrimay.
In the real world, we don’t know if the standard is fro accuracy for the actual water level outside the stilling well, or only applies to the water level inside the stilling well. In a normal busy harbor, these are two entirely different things — waves, wakes, reflected waves and wakes, wind chop, etc.
in any case, we must take them at their word, and let the accuracy of individual measurements be the stated as +/- 2 cm.
Uplift is usually a sudden earthquake event, while subsidence is gradual. So subsidence is built into models but upfilt is not. The resulting absence of the uplift in the models produces a sea level rise all by itself.
NZ Willy,
While uplift is often associated with an earthquake (especially in NZ), in the northern hemisphere there is an adjustment to the loss of ice load after the glaciers melted. It is evidenced as a rather continuous uplift in high latitudes.
There is isostatic uplift in Antarctica as well, though it is only measured by GPS at a few sites. As a matter of fact the uncertainty about this is so large that in practice it makes the GRACE measurements of changes in Antarctic ice volume completely meaningless – the result is completely dominated by the (guessed) isostatic adjustment.
NZ Willy ==> Uplifting occurs along the east coast of the United States anywhere roughly north of Boston, MA, caused by post-glacial rebound and the Earth crust rebounds from the deformation caused by the weight of the last glaciation. This rebound is gradual as well.
Uplifting caused by rapid shifts of the Earth’s crust (earthquakes, fault shifts) requires re-leveling of the benchmark for each tide station to a distant, un-shifted point with a known elevation, resetting the datum to agreed upon geodetic reference, using the methods explained in this 90-minute movie.
NZWilly
Look at the map in the 1.41 am post. It shows the continuous isostatic uplift in Northern Europe.
And continuous uplift is actually quite common in other areas as well. For example the longest series of uplifted beaches anywhere in the World is on the very aseismic coast of South Australia (150 (!) uplifted shorelines dating back to the Miocene).
You can probably learn all that can be known by exploring anchialine pools around the world. One of the newest is the Sailor’s Hat pond on Kaho`olawe island in Hawaii.
Accuracy of GPS?
If we want to separate seal level rise from the local vertical movement of a tidal gauge we could of course add a GPS receiver to it and wait for some time to get a very good measurement of the local movement, problem solved?
The GPS position that we get could of course be very precise but it is in relation to the GPS reference system . This reference system is maintained by keeping the satellites in position and this is of course done using ground stations. These ground station do however move and instead of having a observatory in London as the only reference point we adjust the system based on some twenty reference points. How accurately can we track the movements of these stations and to what degree is it done? Do we have absolute gravimeters at these locations to determine their movement in vertical position? With what accuracy can we do this?
I’m not claiming that it is not done, nor that it can’t be done, but wonder to what degree you could trust a GPS reading during then years that tells you that your position has been elevated by 0.5 cm (let’s skip movement in x and y).
“let me point out that the rated accuracy of the monthly mean is a mathematical fantasy. If each measurement is only accurate to ± 2 cm, then the monthly mean cannot be MORE accurate than that”
Kip,
It can because +/- 2 cm is a random error. You can plot the magnitude of error in the x-axis and the number of occurrence in the y-axis and you’ll have a frequency distribution of errors. You can examine the curve whether it looks like a normal curve or like a rectangle, which means almost equal probability for big and small errors. Since the positive and negative errors are equally probable, they can cancel each other and reduce the average error by doing many measurements.
Excellent point Dr. Strangelove. Further, the tide gauges, with their local SLR and land movement, are quite randomized. If you cannot control a variable, randomize it. This is a standard analysis tool. If you are using the same tide gauges, for the vast majority, changes in sea level over time will be valid. It doesn’t really matter if the means of land movement average to zero, which they most probably do. The only ones who should be concerned about subsidence are the ones in that local area. And you are measuring one thing, global SLR, at several points around the planet with multiple measurements at each location and 1,000’s of stations. The error bar of the answer is a complex issue but solvable. It is clearly better than +/- 2 cm.
Kirtland ==> “It doesn’t really matter if the means of land movement average to zero, which they most probably do. ” There is no reason whatever to believe or assume that vertical land movement averages to zero across the whole Earth….
“If PSMSL data were corrected for at-site vertical land movement, then we could determine changes in actual or absolute local sea surface level changes which could be then be used to determine something that might be considered a scientific rendering of Global Sea Level change.”
For practical purposes, the relative local sea level changes are more important. This is the metric that determines if a coast area will flood and how deep the flooding. Absolute local sea level is hypothetical. It is based on the premise – what if the land does not move vertically? But the land does move!
Strangelove ==> Stay tuned to WUWT and I will demonstrate the principle in a separate essay. You have the idea right for data with random errors and the assumption that one is measuring a static, unchanging object. For tide data, like temperature data, neither of those conditions exist.
My post does not assume that we are measuring a static, unchanging object and it is not required to validate my point.. I doubt that Dr. Strangelove would agree with you either. I think we can all agree that sea level and land movements are not static.
EPILOGUE FOOTNOTE:
It has been a long-standing practice in scientific writing to specify the uncertainty of measurements as +/- 1 standard deviation, and for more conservative researchers, +/- 2 standard deviations. It should be stated explicitly what convention has been adopted.
Attempts to rationalize claims of higher precision by using the Standard Error of the Mean are, at the least, unconventional. More importantly, proponents overlook the requirement for the error in the measurements to be normally distributed, i.e. random, and from a population that represents a fixed value, such as the speed of light.
Clyde ==> One of the recommendation for journals produced by some of the science oversight teams has been that all measurements, graphs, etc must show their error bars, CIs, uncertainty clearly be and explicitly explained as to exactly what they are showing. Standardized statistical “standard deviations” may be far from an accurate estimate of the uncertainties involved with the measurements, and may be used to obscure real uncertainty.
i agree wholeheartedly.
Kip – A quick note on pressure gauges. Their calibration drifts. I’m not sure how much or whether the amount of drift has to be taken into account in SLR measurement applications. Also, they have been known to abruptly change their drift characteristics. That has been a significant problem for the Argo floats, but they are subject to much greater pressures than those used in tidal gauges.
I’m not sure this is an issue for the gauges used or as used in sea level measurement. But I’m not sure it’s not. Just mentioning it so you’re not blindsided by it at some future time. I’ll let you know if I ever come up with some useful numbers on pressure gauge drift.
Don K ==> Thank you for the heads up on pressure water level sensors. I am also aware that humidity and temperature (related in the stilling wells of acoustic sensors) can skew results.
Stilling wells themselves rely on/are a physical averaging scheme which works better under some surface conditions than others.
I am looking for a document that gives the actual measurement and reporting scheme used by US Tide Gauges — there is one for temperatures which states temperatures are measured every second, then averaged for the minute, then rounded to the nearest full degree F, then converted to the nearest degree C with one decimal place. I need that level data for tide gauges — the official reports are every six minutes, and recorded as 2.356 ft (feet to the hundreth) or meters to millimeter precision. My suspicion is that these level of precision are really just the result of long division — the every minute readings averaged every six minutes or some such, the average being rounded to the hundreths place.
Have you any clue?
One big, enormous, colossal, humongous, monumental, huuuuuuuuggggggggggggeeeeeee improvement to this article, would be to move the “What This All Means” two paragraph summary section away from the last two paragraphs, and start the article with those two paragraphs.
After reading the many tedious comments where readers tried to prove the author was wrong about precision and accuracy (I think he was right), I noticed everyone missed one very important point about data accuracy, that especially applies to government bureaucrat “climate science”:
(1) Are the people collecting the data competent and trustworthy,
or are they biased when collecting, “adjusting” and reporting data,
… perhaps because of how they were selected for “goobermint science” work
in the first place (only CO2 is Evil believers will be hired?)
… or caused by their own confirmation bias,
because they expected to see accelerating sea level rise?
Richard ==> Honestly, in this case, I think it is just “hubristic science” — a vastly overconfident view in the power of multiple measurements transmogrified with the aide of computer-based statistical analysis to magically reveal important facts about the physical world whose magnitudes are very very small.
Today’s epidemiology suffers from the same ‘illness’.
My opinion, the basis of this essay, is that the +/- 2 cm original measurements of water levels at tide stations, particularly when uncorrected for vertical land movement, are unfit for the purpose.
It may well be that the general bias in the field of Sea Level is towards accelerated rising — a great deal of effort is made to sustain that view in the literature — including adjustments made when the data does not reflect the desired reality.
Thanks to Matt for his comments on air pressure. If we understand that tides can move sea levels by metres, air pressure by say 30 – 50 cm, wind and weather conditions by something, and rising/falling land by a few millimetres, then the job of measuring “sea level” is complex. Long data series will help, but there are many variables to try and determine a permanent rise of a few millimetres per year.
Southern Leading ==> I would modify your last sentence to this: “Long data series will help, but there are too many variables measured at accuracies with wide original measurement uncertainties to try and determine a permanent rise of a few millimetres per year.”
kip hansen wrote, “let me point out that the rated accuracy of the monthly mean is a mathematical fantasy. If each measurement is only accurate to ± 2 cm, then the monthly mean cannot be MORE accurate than that”
this is wrong, as anyone who’s studied
basic measurement theory understands.
dr strangelove is completely right — assuming the
errors are randomly distributed, the uncertainty
of the
average is much
less than the uncertainty
of their average.
if each of n measurements has an
uncertainty
of e, the uncertainty of the
average of these measurements will
be e/squareroot(n)
Crackers345, one is measuring different things multiple times, not one thing multiple times. The large number rule does not apply.