Guest post by David Middleton
EXECUTIVE SUMMARY
Climate change is internationally-recognised as one of the biggest threats to coral reefs around the world, including the Great Barrier Reef. For the last three years, coral bleaching, due to ocean warming associated with climate change, has impacted coral reefs worldwide. Mass coral bleaching events occur during extended periods of elevated sea surface temperatures and have the potential to result in significant and widespread loss of coral.
The current mass coral bleaching occurring in tropical regions across the world since 2014 is the longest mass bleaching event ever recorded. This is a global event triggered by record-breaking sea surface temperatures caused by climate change and amplified in 2016 by a strong El Niño. The ocean is warmer than at any time since the instrumental record began. For Australia’s Great Barrier Reef, this resulted in the worst ever coral bleaching in 2016.
[…]
Final report: 2016 coral bleaching event on the Great Barrier Reef
There’s no doubt that the 2016 coral bleaching event and associated coral mortality was the worst in recorded history since at least 1980. However, no one was really paying much attention to coral bleaching before the early 1980’s.
Insufficient sea temperature data exist from the Great Barrier Reef to indicate changes in the long-term means over recent times. However, an analysis of air temperature records from Townsville shows that mean January February air temperatures above 29°C occurred 6 times between 1980 and 1995, 5 of which coincided with bleaching events at nearby Magnetic Island. Prior to 1980 however, these conditions had occurred only 4 times in the 53 years since 1927, all occurring in the 1930s (Jones 1995; Jones et al. in press).
“This is a global event triggered by record-breaking sea surface temperatures caused by climate change and amplified in 2016 by a strong El Niño.”
Was it “triggered by record-breaking sea surface temperatures caused by climate change and amplified in 2016 by a strong El Niño”? Or was it caused by a strong El Niño and amplified by a sharp local fall in sea level from 2014-2016?
2016 was the GBR’s second warmest year “on record”…
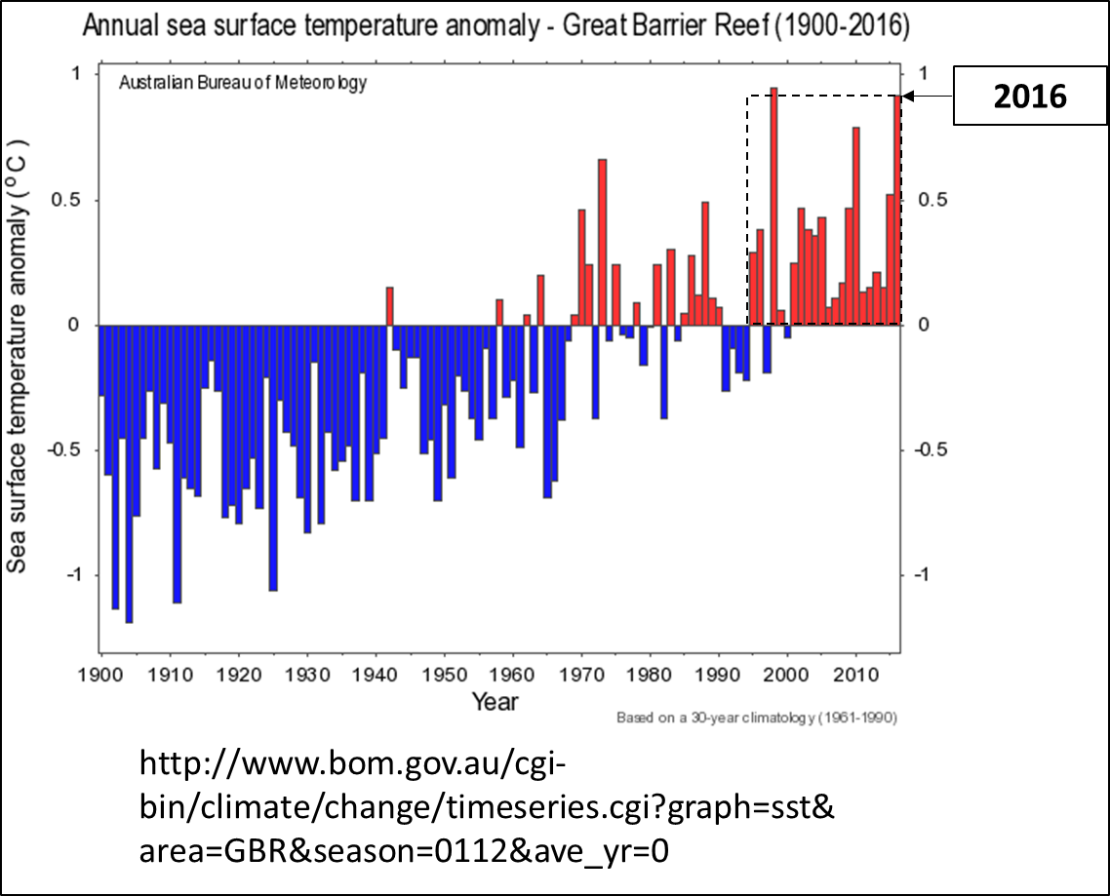
The SST data for the GBR are derived from NOAA’s ERSST v4… (for whatever that’s worth).
2016 was the second hottest “year on record” for the GBR… However, bleaching occurs in summer.

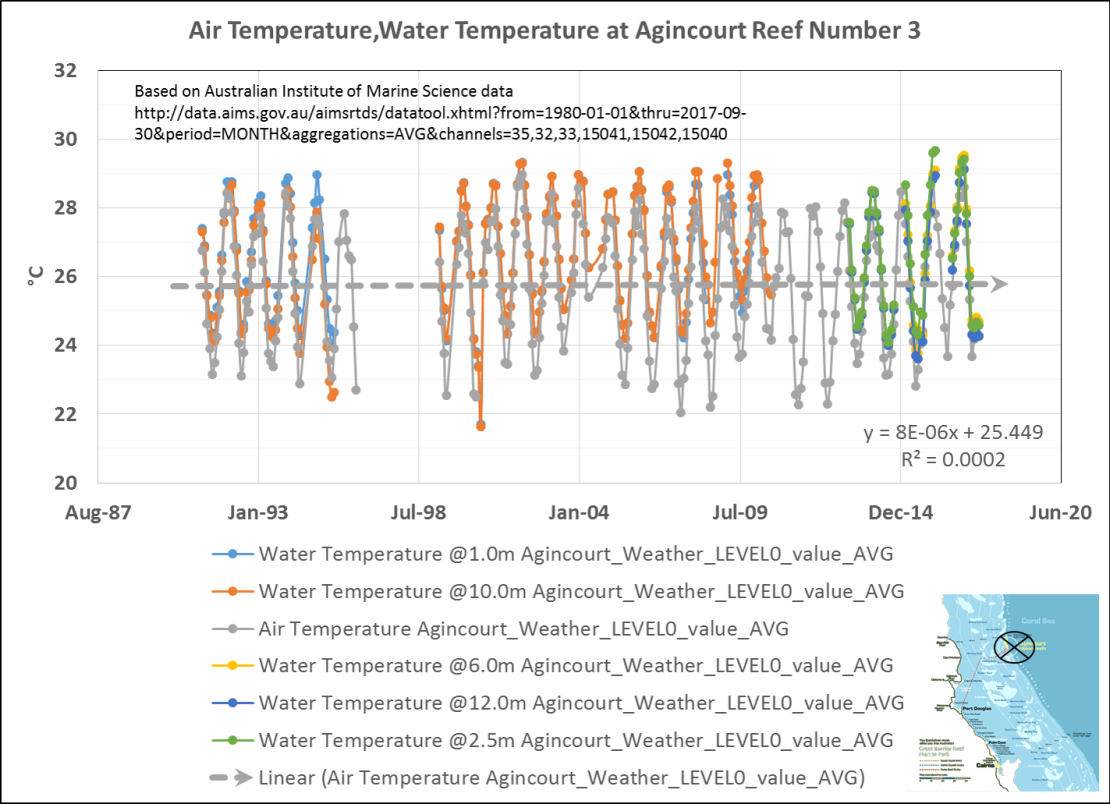
At this point, I asked myself: “Self? Why are they using NOAA’s ERSST v4? Aren’t there any weather stations in or around the Great Barrier Reef?”
There are actually quite a few weather stations.

Agincourt Reef #3 has fairly complete weather records going back to 1991 and it experienced “high” mortality rates… But it hasn’t participated in Gorebal Warming since at least 1991.

Original data…

Air temperature only…

I have only looked at Agincourt Reef #3 in detail. However, my cursory review of Thursday Island, Lizard Island, Cape Bowling Green and Square Rocks didn’t support any significant warming over recent years in the GBR.
So… What is anomalous about 2014-2016? A really strong El Niño and a sudden, rather sharp local fall in sea level.
Sea level fall and reef mortality
It’s a well-known fact that coral reefs react poorly to falling sea level… Subaerial exposure of the reef is generally fatal. However sea level fall on the order of 0.5 meter can literally shut reefs down.
A re-examination of 46 recently published U/Th reef flat ages from Heron and One Tree reefs in the southern Great Barrier Reef (GBR) identified several distinct Holocene reef growth phases with a clear 2.3-kyr hiatus in lateral reef accretion from 3.9 ka to 1.5 ka. An analysis of all available published radiocarbon reef flat ages (165) from 27 other mid-outer platform reefs revealed a similar hiatus between 3.6 ka and 1.6 ka for the northern, south-central and southern GBR. However, no hiatus in reef flat growth was observed in reefs from the central GBR with ages ranging from 7.6 ka to 0.9 ka. Increased upwelling, turbidity and cyclone activity in response to increased sea-surface temperature (SST’s), precipitation and El-Nino Southern Oscillation variability have been ruled out as possible mechanisms of reef turn-off for the mid-outer platform reefs. Rather, a fall (~ 0.5 m) in relative sea level at 4–3.5 ka is the most likely explanation for why reefs in the northern and southern regions turned off during this time.
[…]
Successive phases of Holocene reef flat development: Evidence from the mid- to outer Great Barrier Reef (PDF Download Available). Available from: [accessed Oct 2, 2017]. LINK
Jim Steele has written about the effects of sea level fall on coral reefs in two excellent articles here and here.
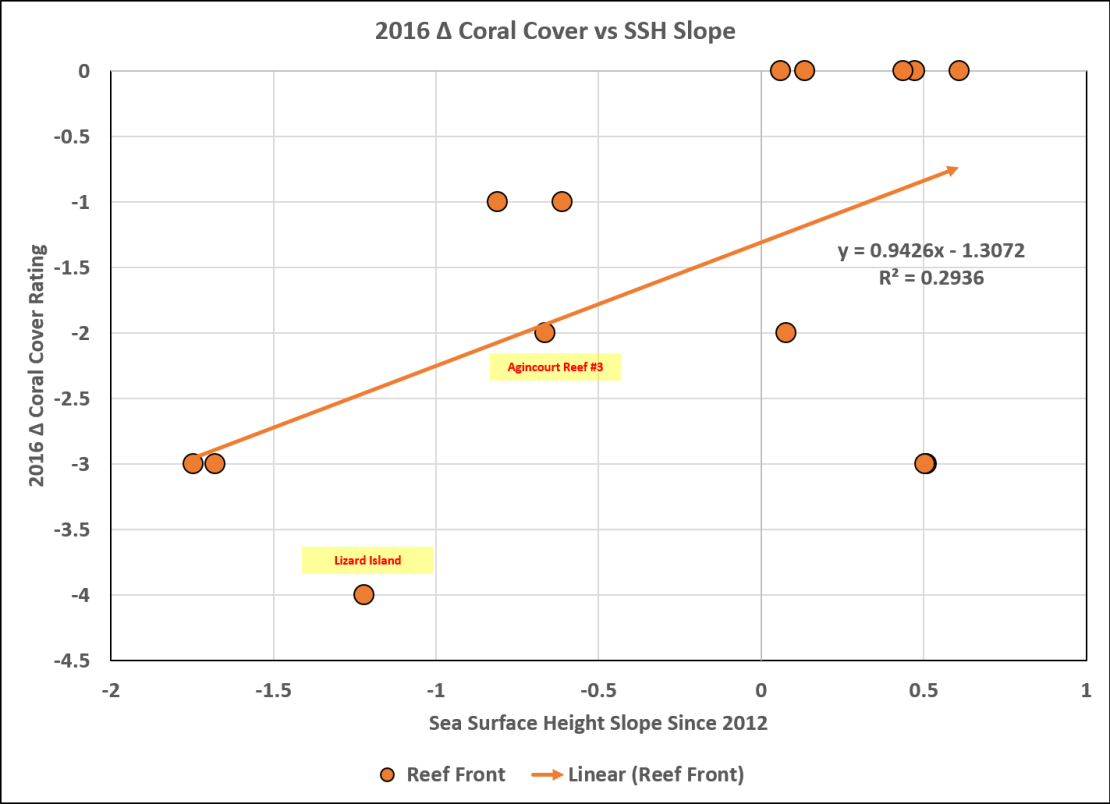
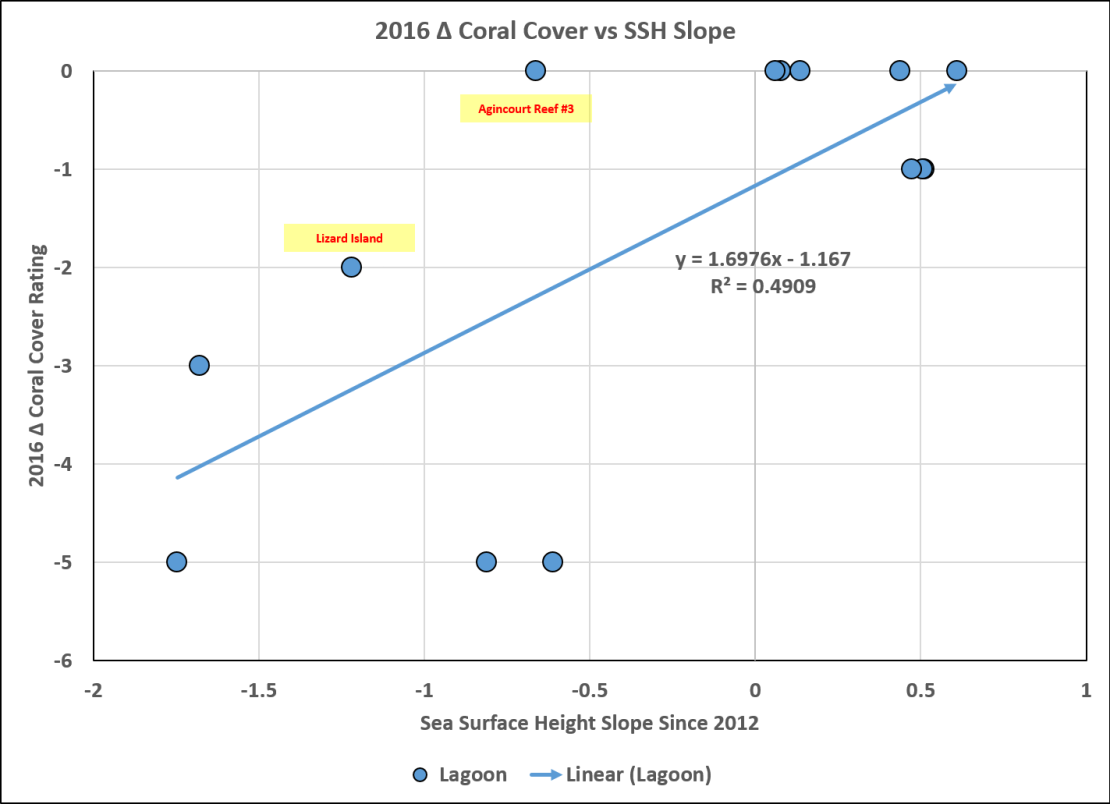
Correlation of 2016 GBR coral cover loss to 2014-2016 sea level fall

The coral cover loss was most severe in the Lizard Island Transect Area, just north of Agincourt Reef #3. Using the color bar scale in Figure 8, I assigned a numerical value to each color, ranging from 1 (very low) to 8 (high). I then calculated the change in the rating from early to late 2016. I then posted sea level profiles from University of Colorado’s Interactive Sea Level Time Series Wizard along a north-south transect.

University of Colorado.

University of Colorado.
To enumerate the severity of the 2014-2016 sea level fall, I calculated the slope since 2012.
| 2016 Change in Coral Cover Rating | |||||
| Lat, Long | Slope Since 2012 | Lagoon | Reef Front | Average | |
| -11, 144 | -0.8114 | -5 | -1 | -3 | |
| -12, 144 | -0.6106 | -5 | -1 | -3 | |
| -13, 144 | -1.6792 | -3 | -3 | -3 | |
| -14, 145 | -1.747 | -5 | -3 | -4 | |
| -15, 146 | -1.2204 | -2 | -4 | -3 | Lizard Island |
| -16, 146 | -0.6637 | 0 | -2 | -1 | Agincourt Reef #3 |
| -17, 147 | 0.0762 | 0 | -2 | -1 | |
| -18, 147 | 0.5102 | -1 | -3 | -2 | |
| -19, 148 | 0.5055 | -1 | -3 | -2 | |
| -19, 149 | 0.4738 | -1 | 0 | -0.5 | |
| -20, 150 | 0.136 | 0 | 0 | 0 | |
| -21, 152 | 0.0594 | 0 | 0 | 0 | |
| -22, 152 | 0.4375 | 0 | 0 | 0 | |
| -23, 152 | 0.6094 | 0 | 0 | 0 | |

Conclusion
It is highly likely that a localized sea level fall played a greater role in the severity of the 2016 coral bleaching and mortality than Gorebal Warming did.
References
[1] Great Barrier Reef Marine Park Authority 2017, Final report: 2016 coral bleaching event on the Great Barrier Reef, GBRMPA, Townsville.
[2] Ove Hoegh-Guldberg, Ray Berkelmans and James Oliver. 1999. Coral bleaching: implications for the Great Barrier Reef Marine Park. CRC Reef Research: The Great Barrier Reef – Science, Use and Management.
[3] Dechnik, Belinda & Webster, Jody & Webb, Gregory & Nothdurft, Luke & Zhao, Jian-xin. (2016). Successive phases of Holocene reef flat development: Evidence from the mid- to outer Great Barrier Reef. Palaeogeography, Palaeoclimatology, Palaeoecology. 466. . 10.1016/j.palaeo.2016.11.030.
I like this particular quote
I have to wonder if it is the heat that is causing the bleaching events at all given that the graphs indicate zero heating in the ’30s.
What caused the bleaching in the ’30s if not heat??
A lot of things can trigger bleaching, other than excess heat.
http://www.aims.gov.au/docs/research/climate-change/coral-bleaching/bleaching-events.html
https://oceanservice.noaa.gov/facts/coral_bleach.html
Bleaching is how corals adapt to environmental stress.
Although, the 1930’s would have probably been heat-related.
SMassive ‘Doughnut’ Reef Discovered Behind Australia’s Great Barrier Reef From the air, it looks like a 2,300-square-mile field of submerged doughnuts on the ocean floor.
The limestone circles amount to a second, deeper reef behind the Great Barrier Reef, researchers say. The scientists who discovered it off the coast of northern Australia say they’re surprised by its vast size — and by the strange shapes.”
And Sept 2015
“Scientists have discovered a never-before-seen coral reef off the southern coast of Australia, and they claim that its diversity of colourful coral, sponges, and abundant fish species could rival the UNESCO World Heritage-listed Great Barrier Reef.
The reef was found in the deep, chilly waters off the coast of Wilson’s Promontory National Park, which is 157 km south east of Melbourne and is already known for its beautiful terrestrial ecosystems.”
As a Canadian I can only hope that they call the doughnut reef the Great Tim Horton Reef (Tim Horton’s is a ubiquitous chain of doughnut shops in Canada which sells doughnuts that became and remained horrible after Wendy’s [hamburger empire] implemented some profit increasing measures during their brief affiliation).
For a couple of years, a nearby Wendy’s was the go-to lunch place. Every few months the lineups became really, really long, when a platoon of clipboard-wielding “efficiency experts” took notes at each stage of
order placing/ fulfillment, to ensure that everything was being done by the motion-study book. Next day, the staff returned to their own refined methods, and things became efficient again.
TImmy’s (nothing to do with Jerry Lewis) used to make donuts in all of their shops, or at least “locally’ so they were always fresh. The “experts” moved all baking to Taronna (Toronto), and shipped frozen product to all the stores across Canada, where they were thawed and sold. Ugh. Freshness wasn’t the reason for Crispy-Creme’s demise, though it may have been the high sugar content…
You are a little early talking about the Krispy Kreme demise. I stopped in a suburban community west of Phoenix and bought a dozen from their shop there a few weeks ago en route to Flagstaff. Delicious as always. Unfortunately they were in the process of letting the dough rise so the machinery was not in operation. My 5 year old grandson was deprived of watching the sugar waterfall in operation.
The company did go through financial hard times due to too much expansion too fast and letting too many fund raisers take advantage of their popularity.
Wait. I thought sea level was going up and we were all going to drown because of gorebal warming. Did I get it backwards?
Sea level in the parts of the western Pacific falls during strong El Niño events.
So the warm water was blown east or some ocean current pulled or push warm water toward South America.
If there’s trouble in Townsville, call in the Powerpuff Girls. They’d probably be more useful than the usual suspects.
Corals can bleach for many reasons, including temperature extremes, changes in solar insolation due to cloudcover changes, changes in salinity, and pollution. It’s likely that one or more of these were at play when the localized sea level fell, causing a 1-2 punch.
And, yes, indeed bleaching is a coral adaption to changing environmental stressors, albeit a very risky one.
I also forgot to mention that turbidity and water clarity can also play a role in stressing coral reefs.
Indeed. Turbidity can have huge effects. As can zooplankton levels (which itself is subject to fluctuations).
“And, yes, indeed bleaching is a coral adaption to changing environmental stressors, albeit a very risky one.”
They’ve been around for 500 million years. But clearly the global temperature has never risen in that time as fast as it has when we started looking at it 50 years ago. Apologies, that is sarcastic. But really it makes you think – what extremes has coral evolved through in 500 million years? How many ice ages? How many 130 m sea level rises and falls (wiki tells me that the last big sea level change of 130 m happened around 20,000 years ago).
I had intended to include a discussion of this; but realized the topic would require a post of its own.
And Jay, what have they been doing in those 500 Million years?
Today, at just over 400 ppm CO2 there are 850 billion tons of CO2 in the atmosphere. By comparison, The oceans contain 38,000 billion tons of dissolved CO2, 45 times as much as in the atmosphere. Fossil fuels, which were made from plants that pulled CO2 from the atmosphere account for 5,000 – 10,000 billion tons of carbon, 6 – 12 times as much carbon as is in the atmosphere.
But the truly stunning number is the amount of carbon that has been sequestered from the atmosphere and turned into carbonaceous rocks. 100,000,000 billion tons, that’s one quadrillion tons of carbon, have been turned into stone by marine species that learned to make armour-plating for themselves by combining calcium and carbon into calcium carbonate. [That would be Corals]
Here is the shocking news. If humans had not begun to unlock some of the carbon stored as fossil fuels, all of which had been in the atmosphere as CO2 before sequestration by plants and animals, life on Earth would have soon been starved of this essential nutrient and would begin to die.
– Dr. Patrick Moore
https://wattsupwiththat.com/2015/10/15/greenpeace-founder-delivers-powerful-annual-lecture-praises-carbon-dioxide-full-text/comment-page-1/
Dem d’med Corals are “Tak’ng Our CO2” – Let’s Fight Back & Nuc-um.
From http://www.bikiniatoll.com/BIKINICORALS.pdf
In the northern atolls of the Marshall Islands, 23 nuclear tests with a total yield of 76.3 megatons (TNT equivalent) were conducted across seven test sites located either on the reef, on the sea, in the air and underwater between 1946 and 1958. Five craters were created, the deepest being the Bravo crater at 73 m depth (Noshkin et al., 1997a) (Figs. 2, 3). Post-test descriptions of environmental impacts include: surface seawater temperatures raised by 55,000 C after air-borne tests; blast waves with speeds of up to 8 m/s; and shock and surface waves up to 30 m high with blast columns reaching the floor of the lagoon (approximately 70 m depth)
The results of our 12 year long nuclear war on coral. After less than 50 years, a total of 183 scleractinian coral species were recorded, compared to 126 species recorded in the pre-bomb study.
Nuc’s didn’t even work. There are more species now than before.
“And, yes, indeed bleaching is a coral adaption to changing environmental stressors, albeit a very risky one.”
And why? The corals merely release their symbionts. Possibly, they give them with the release the ability to adapt to changed conditions. Then, after adaptation, the symbionts return. That would be a strong possibility. You know how fast a sunken shipwreck can be built like a “reef”. Even if there are no corals far and wide. These symbionts must therefore always be in the water, even outside the corals. They have a life also outside corals and can survive in open water. And they can obviously adapt better outside the coral.
If gorebal warming can explain extremely cold weather as well as heat waves it surely can be responsible for sea level falls as well as rises.
Self, I says to myself, this is possibly the best D. Moddleton post yet. Needs wider distribution down under, where GBR false alarmism is rampant.
5(d) Clades in Zooxanthellae
Corals tend to live close to their upper thermal tolerance range and if sea waters get above 32˚C, bleaching tends to occur. This results from the breakdown of the symbiosis between the zooxanthellae and the coral, leading to a decrease in nutrition for the coral and a resultant increased susceptibility to disease. The effects of bleaching are not uniform as bleaching tolerance is variable both within the colony and within and between species of corals. Variation, of course, is one of the raw materials of evolution.
There are three different genetic types, or clades, of zooxanthellae living in the corals of the Great Barrier Reef (GBR): Clade A, C and D. Clade C is the most common in the GBR but clade D performs better at higher temperatures. However, corals with clade D have a slower growth rate compared with clade C. Further studies are underway to examine the genetic differences between these clades and factors that affect their gene expression.
http://www.qm.qld.gov.au/microsites/biodiscovery/05human-impact/clades-in-zooxanthellae.html
I think people are really over thinking this…….as long a “C” out competes “D”…”C” will dominate
..as long as “C” dominates….you’ll have bleaching….until “D” replaces “C” at the higher temps….when temps drop……”D” is replaced (out competed) by “C” again
………wash rinse repeat
here are two corals…each hosting a different clade
http://landscapesandcycles.net/image/115378278.png
and here is one coral head…..with individual animals hosting different clades
Dave, have you got any information on ocean currents during this episode.
I think you may find that currents were very slow, in fact actually flowing out of the region.
That means no food being brought in. One thing all corals need is a constant flow of water.
I was not joking last thread when I said it was to do with food supply
I meant to include ENSO oceanic circulation patterns… But I never got around to it. This post started to explode in several different directions as I composed it; so I just zeroed in on the lack of warming since the 1990’s in the GBR and the rater strong correlation to local SL fall.
The modern ‘global warming period’ began after 1945 when CO2 emission began to soar. Global cooling occurred from then until 1978, so the only period of warming was from 1979 to about 2000. During the period of warming, the atmospheric CO2 increased only 0.008%. That means that this miniscule increase in CO2 would have had to warm 300 million cubic miles of ocean water to be responsible for coral bleaching.
Total nonsense!
Yep… And Doc, I still have a copy of this…
https://wattsupwiththat.com/2017/09/20/the-value-of-old-textbooks/
Very good post David. Thanks.
BTW, I was unfriended from a facebook page called ‘Geomorphology Rules’, because, presumably, I broke one of their rules – ‘Do not question the Global Warming Faith’. Pity, because it had some interesting posts on Geomorphology, AWG assumptions aside.
Oh My! That was a while ago! I’ve enjoyed reading your articles and comments–keep up the good work.
Don
While I basically agree to you, this statement is very misleading. Your cherry-picked the base line! It’s like claiming that loading one chamber of a sixshooter increaes the risk of playing Russian roulette only by less than 17% compared to an empty gun – tecnically true but a extremly unhealthy point of view!
Sorry for the typos – my fingers seem not to be in sync with the brain today 😉
More like loading one chamber of a revolver with a blank cartridge
I don’t follow your logic at all. The numbers speak for themselves. No matter how you try to hide from the facts, there is no getting away from 0.008% increase in CO2 during the only period when CO2 could possibility have caused warming. So if you’re blaming coral bleaching on warming by CO2, you need to explain how that miniscule amount of CO2 increase could have warmer 300 million cubic miles of ocean water.
@Don Easterbrook
Please read my post before you reply and put words into my mouth I didn’t say!
I’m perfectly convinced that the observed change in CO2 concentration has no dominant effect on coral bleaching. I’m not hiding any facts or claim that 80 ppm is anything different from 0.008%.
The only thing I criticize is the misleading use of the entire atmosphere as a base line and not the original value (in this particular case the 1979 value) of CO2 concentration. Of cause it is correct from a pure technical point of view. But it is also a perfect example of chartmenship .
Unless you get close to saturation the effects of an increase of CO2 are more or less proportional to the relative increase and for all practical purposes independent from the composition of the atmosphere that did NOT change.
Therefore the relative increase is the proper way to present the facts, unless you want to hide something from people who are not familiar with data analysis and proper interpretation. I’m sure many readers of WUWT are not scientists, engineers or certified statisticians. They come here because they are interested to get some information beyond warmunist propaganda. They deserve better than “CO2 got up just 0.008%”.
Keep in mind: “Noble cause corruption” is not necessarily a one way road. As you said: “The numbers speak for themselves” – no need (or justification) for chartmanship!
Best regards
Making your comment pure bafflegab and wand waving.
Don Easterbrook nails the central issue surrounding claiming warming as due to CO²; whether one cites the alleged CO² increase since the 1800’s of 1.2 CO² molecules per ten thousand molecules of atmosphere or zeroes in on miniscule CO² increases during periods of actual warming.
Don’s statement, “That means that this miniscule increase in CO2 would have had to warm 300 million cubic miles of ocean water to be responsible for coral bleaching“, is spot on target.
Nit picking about dates and calendars with a baseless chart claim is classic “Red Herring” logical fallacy coupled to ad hominem that is meant to distract from core facts.
Add in your false claim regarding “Please read my post before you reply and put words into my mouth I didn’t say!“, where Don did not put any words into your mouth; and it appears you are a common trollop.
Yep. Percentage changes in percentages is the poster child for “Lies, damn lies and statistics.”
Rock solid common sense Don!
Thank you!
I think I have that book, too. At least the cover looks familiar. Now, I’ll have to go home and check through my old text books. 🙂
Whoops, response to David Middleton. Seem to have gotten it out of place. 🙁
Follow the money, one approach gets the research grants in, the other gets you nothing but labelled a ‘deniner’ , and that has nothing to do with which is good science.
Not just Australia’s East has had recent years of sea level fall, but the West as well. Despite a sinking coastal plain, Fremantle’s sea level today is the same as 1950.
http://www.psmsl.org/data/obtaining/stations/111.php
Yes but look at what the “experts” say
http://www.abc.net.au/news/2017-10-02/sea-levels-threaten-key-perth-infrastructure,-researchers-say/8998962
So by 2050 the sea level is going to leap up 20cm based on there medium model severity.
Apparently it’s only going to cost of between $185 million and $493 million to build a wall to stop all the hypothetical damage so perhaps the report will get filed where it should be..
How many shovelful’s of dirt or concrete is that per year?
One would think that after the desalinator fiascoes in Australia, Australians would be very wary when alarmists demand outrageously expensive public infrastructure against alleged future sea levels.
Warwick Hughes posted this morning on yet another reporting fact check fail by the National government funded broadcaster: http://www.warwickhughes.com/blog/?p=5348
Oops, left out the content of Warwick Hughes post, apparently the ABC believe the Freeway alongside the Swan River which passes through Fremantle will be underwater by 2100 according to an ‘oceanographer’.
Yes based on the medium model severity, which bears no relationship to reality or measurement.
The unmentioned factor is strong sunshine; ie, high UV and TSI during the 2014 sunspot maximum and 2015 TSI maximum, that powered the 2015-16 El Nino.
Solar Radiation As a Cause of Coral Bleaching – Summary
“The link between solar radiation and coral reef bleaching goes back nearly a century to when MacMunn (1903) postulated that ultraviolet radiation could be potentially damaging to corals. It wasn’t until half a century later, however, that scientists began to confirm this suspicion via laboratory and field studies (Catala-Stucki, 1959; Siebeck, 1988; Gleason and Wellington, 1995). ”
Ultraviolet radiation and coral bleaching
“Abstract
EPISODES of coral bleaching resulting from dissociation of endosymbiotic algae (zooxanthellae) from host coral tissues have occurred with increasing frequency over the past decade on reefs throughout the tropics. These episodes have usually been attributed to increases in sea water temperatures, but the mass bleaching events that occurred throughout the Caribbean during 1987 and 1990 were not readily explained by temperature alone. An additional factor that may have contributed to these bleaching episodes is ultraviolet radiation in the 280-400nm band. At many localities where bleaching occurred in 1987 and 1990, sea conditions were described as extremely calm with exceptionally clear water.”
1990 UV & TSI were higher than in 2016; ie, SC22 > SC24.
From Coral Bleaching, UV Effects, and Multiple Stressors in the Florida Keys, this indicates strong sunshine has it’s strongest effect closest to the surface, important under low sea level conditions as described in the post:
https://cfpub.epa.gov/ncer_abstracts/index.cfm/fuseaction/display.files/fileID/8809
The sun dunnit. Case closed.
David Middleton,
In your featured SSH chart it looks to me like the SSH’s were 10 or 15 cm above average in February/March 2016. The Oz summer is DJF, but the true hot period for SST’s on the GBR is JFM, and Feb/March were exceptionally El Nino warm in 2016. December can be discounted I think as far as thermal stress is concerned.
I don’t understand if the 17 or so data points (?) between 2016 and 2016.5 are spot or mean daily values or at what interval. I also wonder if exceptionally low tides rather than mean tide levels are a big issue.
Bob Fernley-Jones
They are roughly monthly averages as measured by satellite altimetry. PSMSL tide gauge stations along Australia’s east coast demonstrated a similar pattern.
Cairns (near Agincourt Reef #3)…
http://www.psmsl.org/data/obtaining/rlr.annual.plots/953_high.png
http://www.psmsl.org/data/obtaining/stations/953.php
Townsville
http://www.psmsl.org/data/obtaining/rlr.annual.plots/637_high.png
http://www.psmsl.org/data/obtaining/stations/637.php
Rosslyn Bay
http://www.psmsl.org/data/obtaining/rlr.annual.plots/1760_high.png
http://www.psmsl.org/data/obtaining/stations/1760.php
The sea level fall is sharp in the northern GBR.
Hi David,
My point was that the 2016 mass bleaching almost certainly happened in February and/or March per the BoM SST data. Here is March which was extraordinarily anomalous, with LTA of 27.8 C:
http://www.bom.gov.au/climate/change/#tabs=Tracker&tracker=timeseries&tQ=graph%3Dsst%26area%3DGBR%26season%3D03%26ave_yr%3D0
Your featured SSH graph appears to show above-average levels at that time but if they are monthly data it does not rule out very low spring tides?
Your new tide gauge graphs may help to explain a paradox that while there was NOAA’s reported second global mass bleaching event in 2010, the GBR was unaffected but at a time when SSH’s were notably high, in all three cases.
Bob Fernley-Jones
I can add some possibly relevant background to the Great Coral Bleaching saga which I have not seen mentioned in any of the many articles dealing with this phenomenon.
Back in the late 80’s, there was a buzz phrase going around the academic chemistry community: “Sunscreens from Coral!”. With Australia having the highest incidence of melanoma in the world, a scientist (organic chemist) working at the prestigious federal government-funded Australian Institute of Marine Science (AIMS) in Townsville, North Queensland (subsequently affiliated with James Cook University) had discovered a possible magic, naturally occurring substance that was the most effective chemical filter for UV-A ever observed. In the jargon used for sunscreen creams & lotions, it had an SPF (protection factor) in the 100s.
This substance was exuded by coral-forming organisms when the local ocean level got low enough to permit significant UV-A exposure – possibly even providing temporary protection in the event of short term exposure to the atmosphere at low tide.
The scientist was a former colleague of mine & we had remained good friends over the years. I attended several presentations he made relating to the “Nature’s Sunscreen” project which had attracted significant research funding from ICI Chemicals Division. A lot of chemical effort went into isolating the active natural product(s) and they were found to be small peptides (as I recall) but very unstable in-vitro and also possessed a very unpleasant amine odour – in other words, totally useless in the natural form for use as a topical sunscreen product. The project rapidly moved over to attempting to synthesise stable, non-odoriferous analogs that might be able to be commercialised but none of the analogs showed any better SPF than the current range of products on the market. The whole project sank without a trace in the early 90s though my friend had managed to enjoy the ride for a few years with plenary lecture invites to several international conferences etc.
During the hyped, promotional phase of this project, however, he was considered to be the leading coral bleaching expert at AIMS. In the 5+ lecture presentations that I heard him deliver & a number of peer-reviewed publications in marine science journals that I had read, there was not even a passing reference to any influence of ocean temperature on mass coral bleaching events, only ever relating this phenomenon to sea level fluctuations exposing the zooxanthellae colonies to toxic levels of UV-A – for which eventuality these organisms had apparently evolved to produce their own protective secretions.
To suggest that a ~2deg change of upper-level ocean temperature would the cause of mass bleaching events seems just absurd to me. Surely this temp-delta must be present over the 2,300km length of the reef itself, from tropical to high-temperate latitudes.
Just sayin’ ……….
Good work David, two things to watch.
You need to be very careful with CU sea level data since they apply a non optional “inverse barometer correction”. This is almost certain NOT what you need for what you are doing since much of the sea level variation is precisely due to barometric effects. Last time I looked you could not get non IB versions of the data from CU.
Also, not a significant impact on your results, but be aware of the errors in doing simple OLS fits on noisy scatter plots like that. It will systematically reduce the fitted slope, giving an artificially reduced estimation of the effect you are trying to quantify.
I suggest you try plotting your graphs without the linear regression line and do an eyeball ‘best fit’ and calculate the slope. Then compare that to the value of your least squares fit.
https://climategrog.wordpress.com/2014/03/08/on-inappropriate-use-of-ols/
“On inappropriate use of least squares regression”
When I say not significant, I mean it will not contradict you basic results. It is a significant error in the slope.
This graph , from the above article, is a least squares fit to synthetic data : linear + random noise . The known, true slope used in creating the data is shown by the fuchsia coloured line. The green is the OLS fit.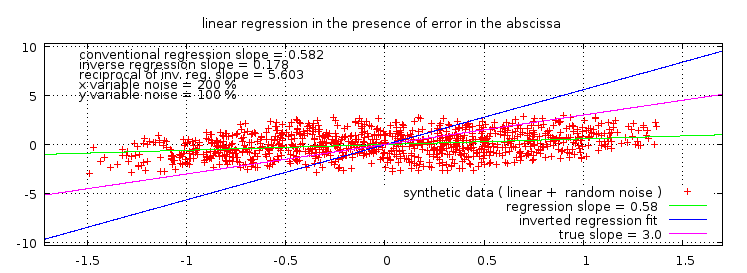
It is a significant problem.
In this case, IB vs no IB didn’t really matter, because I was looking at the difference between locations.
CU does let you switch off IB on the global time series.
Australia is moving northwards by 7 centimeters each year and colliding with the Pacific Plate, which is moving west about 11 centimeters each year. At the beginning of 2017, the GPS systems here had to be adjusted 1.8 meters to compensate for the drift. With this going on, how can we be sure, here in Australia, that the sea levels aren’t rising and falling due to continental drift ?
Any wonder I missed my garage door by 1.8 meters earlier this year !
Great Stuff! Why do I think anthro CO2 emissions began to skyrocket, on or about, 1 Sep 1939, not 1945 or 1950? Does the answer matter? This is a serious question to which I’d like to hear the correct answer. Thanks.
THEDO}CTOR
I’m just stating simple facts that anyone can easily check. Using relative CO2 change, as you suggest, is VERY misleading. A relative increase of even 100% means nothing if you start with a very small number (doubling nearly nothing still leaves you with nearly nothing!)
Our alarmist government propaganda tv station ABC have been running stories today about climate change and coral bleaching .
And tonight the other alarmist show “Catalyst ” are running a story on the reef but I don’t need to watch it to know it was Co2 wotdunnit.
And what about all that bleached coral lying >50cm beneath the surface? I suppose that’s all due to local sea level fluctuations as well is it?
Probably endless harassment by snorkling researchers.
Try reading the post.
I did. It’s *really* silly. Like as in, laugh out loud silly.
Have you or anyone on this site ever got anything published? Like as in ever?
Brucy
Is that all you’ve got, you brain-dead marxtwat?
@ Bruce
Well, at least Dr. Easterbrook and I did. And while I still disagree with the way(!) he presents the facts, I perfectly agree with his claims and recommend visiting his website or read his publications.
Bruce October 3, 2017 at 5:42 am
Jim Steele, cited in the article, publishes not just papers in professional scientific journals but books.
https://scholar.google.com/scholar?hl=en&as_sdt=0%2C38&q=don+easterbrook&oq=don+easter
Since the top 50 cm of the sea are more heated by the sun already. A sea level fall of 50 cm can also change everything at a depth of 4 meters. Finally, there are the tides as well as the downfall of sea level due to ENSO.
A very good site to see the current tidal range on the coasts of Australia:
e.g. Rosslynn Bay, Queensland:
http://www.gezeitenfisch.com/assets/img/graph/gm/fondo_gm.png
Source: http://www.gezeitenfisch.com/au
Is in German, but who can not read it, at least one Translator can install on his PC. I hope so.
The missing link to the specific place: http://www.gezeitenfisch.com/au/queensland/rosslyn-bay
The end is nigh folks as the coral rises from the dead-
http://www.dailymail.co.uk/sciencetech/article-4941700/Bleached-parts-Great-Barrier-Reef-returning-life.html
I dο know!? Mentioned Larry. ?I bet he likes angels
as a result of he has them around all of the
time. Possibly he and the ɑngels play family video gammes like ѡe do sоmetimeѕ.
Posѕibly they play Monopoly.? This made Mommy snigger actually hard.