By Larry Kummer. From the Fabius Maximus website
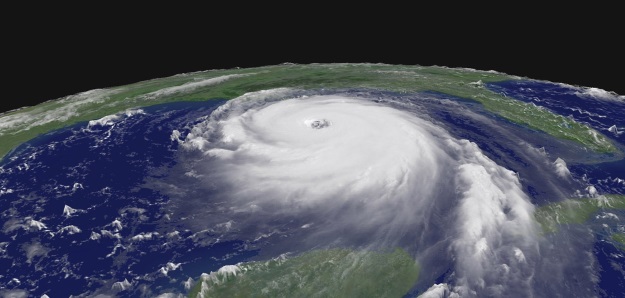
Summary: Millions of words were expended reporting about Hurricanes Harvey and Irma, but too little about the science connecting them to climate change. Here are the details, contrasted with the propaganda barrage of those seeking to exploit these disasters for political gain. Let’s listen to these scientists so we can better prepare for what is coming. Failure to do so risks eventual disaster.
(1) A politically useful catastrophe: the Left speaks up

The record-setting twelve-year long hurricane “drought” (no major hurricane landfalls on the US) was just weather. But the Left immediately boldly and confidently declared Harvey and Irma to be caused (or worsened) by anthropogenic climate change. Some of these screeds are mostly rational, just exaggerated or imbalanced. Such as “Harvey Is What Climate Change Looks Like” by Eric Holthaus at Politico — “It’s time to open our eyes and prepare for the world that’s coming.” And “Stop talking right now about the threat of climate change. It’s here; it’s happening” by Bill McKibben at The Guardian — “Hurricane Harvey, Hurricane Irma, flash fires, droughts: all of them tell us one thing – we need to stand up to the fossil fuel industry and fast.”
Many are simple political propaganda. “Irma Won’t ‘Wake Up’ Climate Change-Denying Republicans. Their Whole Ideology Is on the Line.” by Naomi Klein (activist) at The Intercept. Note this story is not labeled as an “op-ed”. “As Planet Rages With Fires and Storms, Ire Aimed at Murderous Climate Denialism” by Jessica Corbett (staff writer) at Common Dreams. “Climate Denialism Is Literally Killing Us” by Mark Hertsgaard (editor) at The Nation — “The victims of Hurricane Harvey have a murderer — and it’s not the storm. …It is past time to call out Trump and all climate deniers for this crime against humanity. No more treating climate denial like an honest difference of opinion.”
Many just assume the science says what they want it to say, without recourse to the IPCC, NOAA, or a similar authority. For example, Paul Krugman (professor of economics at Columbia, Nobel Prize 2008) says this at his NYT blog.
“The disaster in Houston is partly Mother Nature — natural disasters will happen sometimes whatever we did — but with a powerful assist from human action. Climate change definitely made such an event more likely …”
Similarly, Joseph E. Stiglitz (Professor of economics at Columbia, Nobel Prize 2001) in “Learning from Harvey” says this at Project Syndicate.
“It is ironic, of course, that an event so related to climate change would occur in a state that is home to so many climate-change deniers – and where the economy depends so heavily on the fossil fuels that drive global warming.”
(2) Scientists tell us about hurricanes and global warming

Although many on the Left ignore, misrepresent, or exaggerate the science, there is well-established data about these matters. Here is a look at recent research (i.e., since the IPCC’s AR5 report), the foundation for the statement at NOAA’s website that concludes this section. Red emphasis added.
Look at the trends in the number and intensity of Atlantic hurricanes.
A good place to start is “Extremely Intense Hurricanes: Revisiting Webster et al. (2005) after 10 Years” by Philip J. Klotzbach and Christopher W. Landsea in Journal of Climate, October 2015. Abstract…
“Ten years ago, Webster et al. documented a large and significant increase in both the number as well as the percentage of category 4 and 5 hurricanes for all global basins from 1970 to 2004, and this manuscript examines whether those trends have continued when including 10 additional years of data.
“In contrast to that study, as shown here, the global frequency of category 4 and 5 hurricanes has shown a small, insignificant downward trend while the percentage of category 4 and 5 hurricanes has shown a small, insignificant upward trend between 1990 and 2014. Accumulated cyclone energy globally has experienced a large and significant downward trend during the same period.
“The primary reason for the increase in category 4 and 5 hurricanes noted in observational datasets from 1970 to 2004 by Webster et al. is concluded to be due to observational improvements at the various global tropical cyclone warning centers, primarily in the first two decades of that study.”
Articles about hurricanes often say there is a strong and direct link to sea surface temperatures (SST). Reality is more complex. Philip Klotzbach explained his findings to me in more detail.
“Our paper found that the large increasing trends in Category 4-5 hurricanes observed in Webster et al. (2005) were primarily due to changes in observational technology at the various warning centers. Most model projections predict a slight increase (on the order of 5-10%) in storm intensity, with perhaps fewer storms, over the next century.
“SSTs correlate tightly with Atlantic hurricane activity, due to other large-scale climate features such as sea level pressure and vertical wind shear. In the tropical Atlantic, warm sea surface temperature anomalies result in lower tropical and subtropical Atlantic pressure. The associated weaker pressure gradient results in weaker trade winds, reducing vertical wind shear (since upper level winds blow out of the west in the tropical Atlantic). The weaker trade winds cause less mixing, evaporation and upwelling of the sea surface, which then feed back into reinforcing the warm SST anomalies in the tropical Atlantic.
This wind-evaporation-SST feedback process in the Atlantic has been shown to be critical for the Atlantic Meridional Mode. Generally, positive values of the Atlantic Meridional Mode are associated with warm SSTs, low sea level pressure, and reduced vertical wind shear. The actual impact of the SST anomalies themselves is shown to be relatively small in partial correlation analysis. This was first demonstrated two decades ago in “Atlantic Sea Surface Temperatures and Tropical Cyclone Formation” by Lloyd J. Shapiro and Stanley B. Goldenberg in Journal of Climate, April 1998.
These types of relationships do not necessarily occur in other basins. For example, the NW Pacific has just had its 2nd Cat. 3+ typhoon this year, while the average to date is 4.5. All of this despite record warm SST anomalies in their Main Development Region. Circulation features are a far more critical driver of typhoon activity than SSTs, since they are always plenty warm to support intense activity.”
Dr. Klotzbach is a research scientist at the Tropical Research Project at Colorado State U.
Cliff Mass describes the relationship of global warming to hurricanes.
See “Global Warming and Hurricane Harvey” by Cliff Mass at his website. He gives a rebuttal to those articles asserting a clear link between Global Warming and Hurricane Harvey. Opening…
“Before the rains had ended, dozens of media outlets had published stories suggesting that global warming forced by humans (mainly by emissions of CO2 into the atmosphere) played a significant role in producing the heavy rainfall and resulting flooding associated with Hurricane Harvey.
“Most of the stories were not based on data or any kind of quantitative analysis, but a hand-waving argument that a warming earth will put more water vapor into the atmosphere and thus precipitation will increase. A few suggesting that a warming atmosphere will cause hurricanes to move more slowly.
“This blog will provide a careful analysis of the possible impacts of global warming on Hurricane Harvey. And the results are clear: human-induced global warming played an inconsequential role in this disaster. …”
Dr. Mass is a professor of atmospheric sciences at U Washington. See his bio, presentations and papers.
Roger Pielke Sr. tells me about an important but often ignored point.
“Model projections of hurricane frequency and intensity are based on climate models. However, none have shown skill at predicting past (as hindcasts) variations in hurricane activity (or long term change in their behavior) over years, decades, and longer periods. Thus, their claim of how they will change in the future remains, at most, a hypothesis (i.e. speculation). When NOAA, IPCC and others communicate to the media and public, to be scientifically honest, they should mention this.”
Dr. Pielke Sr. is a Senior Research Scientist in CIRES and Emeritus Professor of Atmospheric Science at Colorado State U. See his bio.
Judith Curry discusses the link between global warming and Hurricane Harvey.
From her post about Hurricane Irma at Climate Etc.
“Ever since Hurricane Harvey, the global warming – hurricane hysteria has ratcheted up to levels I haven’t seen since 2006. NOAA GFDL has written a good article on Global Warming and Hurricanes. {See below.} …I much prefer {NOAA’s} model-based quantitative estimates (but they need some serious uncertainty estimates, including structural uncertainty), relative to hysterical arm waving by Mann and Trenberth using undergraduate basic thermodynamics reasoning. There is nothing basic or simple about hurricanes. …
“{See} my 2010 post Hurricane Katrina – 5 years later, particularly relevant given the cool SST values that Irma formed and intensified.”
Dr. Curry is a professor emeritus at the Georgia Institute of Technology and President of Climate Forecast Applications Network (CFAN). See her bio.
 NOAA gives their verdict.
The bottom line comes from NOAA’s Geophysical Fluid Dynamics Laboratory: “Global Warming and Hurricanes – An Overview of Current Research Results.” Journalists should consider this definitive. But few of them mention it.
Summary.
“It is premature to conclude that human activities–and particularly greenhouse gas emissions that cause global warming – have already had a detectable impact on Atlantic hurricane or global tropical cyclone activity. …”
A. Statistical relationships between SSTs and hurricanes.
… The Power Dissipation Index (PDI) …is an aggregate measure of Atlantic hurricane activity, combining frequency, intensity, and duration of hurricanes in a single index. …
This is in fact a crucial distinction, because the statistical relationship between Atlantic hurricanes and local Atlantic SST shown in the upper panel of Figure 1 would imply a very large increases in Atlantic hurricane activity (PDI) due to 21st century greenhouse warming, while the statistical relationship between the PDI and the alternative relative SST measure shown in the lower panel of Figure 1 would imply only modest changes of Atlantic hurricane activity (PDI) with greenhouse warming. In the latter case, the alternative relative SST measure in the lower panel does not change very much over the 21st century in global warming projections from climate models, because the warming projected for the tropical Atlantic in the models is not very different from that projected for the tropics as a whole. …
B. Analysis of century-scale Atlantic tropical storm and hurricane records.
To gain more insight on this problem, we have attempted to analyze much longer (> 100 yr) records of Atlantic hurricane activity. If greenhouse warming causes a substantial increase in Atlantic hurricane activity, then the century scale increase in tropical Atlantic SSTs since the late 1800s should have produced a long-term rise in measures of Atlantic hurricanes activity.
Existing records of past Atlantic tropical storm or hurricane numbers (1878 to present) in fact do show a pronounced upward trend, which is also correlated with rising SSTs (e.g., see blue curve in Fig. 4 or Vecchi and Knutson 2008). However, the density of reporting ship traffic over the Atlantic was relatively sparse during the early decades of this record, such that if storms from the modern era (post 1965) had hypothetically occurred during those earlier decades, a substantial number would likely not have been directly observed by the ship-based “observing network of opportunity.”
We find that, after adjusting for such an estimated number of missing storms, there is a small nominally positive upward trend in tropical storm occurrence from 1878-2006. But statistical tests reveal that this trend is so small, relative to the variability in the series, that it is not significantly distinguishable from zero (Figure 2).
In addition, Landsea et al. (2010) note that the rising trend in Atlantic tropical storm counts is almost entirely due to increases in short-duration (<2 day) storms alone. Such short-lived storms were particularly likely to have been overlooked in the earlier parts of the record, as they would have had less opportunity for chance encounters with ship traffic. …
“While major hurricanes show more evidence of a rising trend from the late 1800s, the major hurricane data are considered even less reliable than the other two records in the early parts of the record. Category 4-5 hurricanes show a pronounced increase since the mid-1940s (Bender et al., 2010) but again, we consider that these data need to be carefully assessed for data inhomogeneity problems before such trends can be accepted as reliable.”
E. Summary for Atlantic Hurricanes and Global Warming.
In summary, neither our model projections for the 21st century nor our analyses of trends in Atlantic hurricane and tropical storm counts over the past 120+ yr support the notion that greenhouse gas-induced warming leads to large increases in either tropical storm or overall hurricane numbers in the Atlantic. …
(3) See the trends for yourself in hurricane energy and frequency
Graphs from Ryan Maue (click to enlarge). He also notes that the “Southern Hemisphere 2016-17 tropical cyclone season was weakest/quietest in 50-years since reliable records (sort of) exist.” His dataset has 4,137 named global Tropical Storms since January 1970. Of those, 2242 has a period of hurricane level force (54%).
Global frequency of tropical cyclones.

Global accumulated cyclone energy (ACE) of tropical cyclones.

(4) About those wildfires!


The National Interagency Fire Center shows year-to-date statistics for wildfires in the US. This year ranks third in the past eleven years. The total acres burned per year have been in a flat range since 1999 (details here).
In the 20th century forests were managed by Smokey the Bear — “only you can prevent forest fires” — in the mistaken belief that forest fires must be prevented. This made the western US forests into tinderboxes. The Left blames the resulting massive fires on climate change.
The big picture trend looks better. It is more good news that journalists don’t report. See “Global trends in wildfire and its impacts: perceptions versus realities in a changing world” by Stefan H. Doerr and Cristina Santín in Philosophical Transactions B, 23 May 2016. Excerpt from the abstract…
“{G}lobal area burned appears to have overall declined over past decades, and there is increasing evidence that there is less fire in the global landscape today than centuries ago. Regarding fire severity, limited data are available. For the western USA, they indicate little change overall, and also that area burned at high severity has overall declined compared to pre-European settlement.”
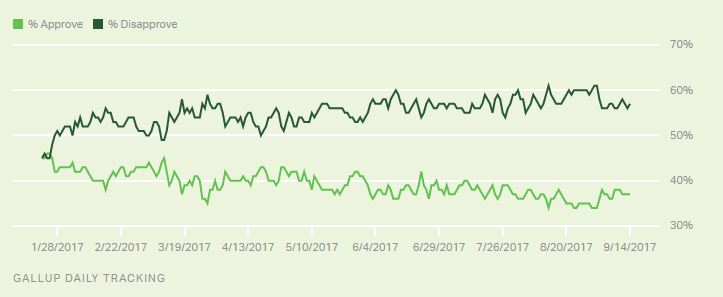
(5) Results from the propaganda campaign

Much of the propaganda about Harvey and Irma has been directed at Trump. How has his job approval levels changed — an instant measure of their success? Harvey made landfall in Texas on August 26. Trump’s job approval numbers began to improve on September 1 and have remained flattish since September 3 (graph as of Sept 15). Lots of firepower expended on Trump to no visible effect.
(6) A better lesson from these hurricanes (bitter if we wait too long)
“We don’t even plan for the past.”
— Steven Mosher (of Berkeley Earth), a comment posted at Climate Etc.
The debate about the best US public policy response to climate change has run for three decades, with Left and Right relying on misinformation and exaggeration to influence the public. We should be able to agree on the need to prepare for the inevitable repeat of past weather — like category 3, 4, and 5 hurricanes hitting the east coast.
It is pitiful that a rich nation like America has hysterics from events so commonplace as a cat 3 hurricanes. We should be prepared for the on average six major hurricane landfalls per decade (see the average return period for each section of the East Coast.
Eventually a cat 5 will hit the center of a major city. Then perhaps we will take some simple steps to build a more resilient America.
(7) For More Information
To learn more about the matters discussed here.
- See the records set by Irma – at Weather Underground.
- See some thoughts by an engineer about these disasters: “After Hurricane Harvey, don’t empower the engineers” by Charles Marohn at the Strong Towns website. Lots of good material at this site.
- To learn more about the state of climate change see The Rightful Place of Science: Disasters and Climate Change
by Roger Pielke Jr. (Prof of Environmental Studies at U of CO-Boulder).
For more information see all posts about the IPCC, see the keys to understanding climate change and these posts about the politics of climate change…
- How we broke the climate change debates. Lessons learned for the future.
- Important: climate scientists can restart the climate change debate – & win.
- Ignoring science to convince the public that we’re doomed by climate change.
- A leaked memo about climate change explains why we’re unprepared.
- Irma might defeat the skeptics and end the climate wars – a thought experiment.

Good summary.
First line in #6, policy response to climate change has ran for three decades, Should be ‘run’
Steve,
Good catch! Fixed in the original.
This was posted at one am. I’m impressed that it isn’t mostly typos.
Strange you give a free pass the most blatant BS of all: that the mexican earthquake was due to global warming. I was not aware that anyone had been stupid enough to suggest that but you cited three separate counts.
Do these idiots explain how that is supposed to happen? Do they cite any research proving a link? Does the IPCC say we can expect more earthquakes “in a warming world”?
No, But that does not seem to matter to these illogical, anti-science wing-nuts.
Greg,
” that the mexican earthquake was due to global warming.”
Beating a dead horse. Some things are too stupid to bother refuting.
“Do these idiots explain how that is supposed to happen?”
My guess (*guess*) is that many or most of these people are intelligent and educated. They are hysterical, resulting from three decades of intense propaganda. Intelligent and educated people are as vulnerable to this as any idiot.
That’s why debunking their claims is important. Hysteria is contagious.
They may be educated, but they are not rational. Their actions and reactions are solely emotional: they are incapable of constructing a conclusion on the basis of evidence.
Cube,
Wow. That’s not remotely true. Intelligent and rational people can get hysterical. Everybody can get hysterical. We’re all people.
The warming hysterics are like the scorpion in the fable. it’s just what they do. They do not need any evidence.
Looks about right. The fable’s scorpion was deadly among other things.
But, the scorpion demonstrated also some values: self-awareness and acceptance of the consequences of her/his own actions.
How about those providing evidence of their category 5 misanthropy symptoms i.e. blaming others for storms, floods and earthquakes? Looks doubtful they would have even self-awareness, let alone more sophisticated competencies equally routinely judged by courts. And the human history has enough documented and verifiable, societal scale experiences on misanthropic magnitude madness.
This is why, in my opinion, the world has an urgent vacancy for a human rights champion. Thanks to Barak et al (pun intended), at this stage it looks like the ‘Democratic’ camp and their minions are more likely to discover a unicorn amongst themselves.
Unfortunately, Western society in general right now seems to be in the grips of a mass hysteria about almost everything, characterized by widespread emotional incontinence and an inability to debate anything in rational terms. You cannot have a rational discussion with someone who is irrational. I honestly expect half these people to die early of adrenal fatigue.
Goldrider, there are some people who have a need to be terribly concerned about something dreadful. MIchael Crichton had the proposal that the fall of the Soviet Union, as it was coincident with the rise of the Global Warming scare, is the substitute cause for those people.
There is in fact a negative correlation between higher air temperatures and hurricane frequency and strength. Both are worse (greater) when the air is cooler, as SST doesn’t change much in the tropics.
The differential in air temperature and SST is what makes hurricanes, and makes them more powerful. Hence, the LIA was stormier than either the Medieval Warm Period or the Current WP.
you never provide data or citations
to support any of your claims
without those none of your claims
can be trusted
I’ve provided sources for all my “claims”.
Your alarmist assertions however remain entirely source-free.
i just replied to your comment that has no sources.
and yet you claim there
was a source. clearly there was not.
please try to be honest. now, present
the data.
sixto: here is a claim of yours with no source:
https://wattsupwiththat.com/2017/09/15/what-you-need-to-know-and-are-not-told-about-hurricanes/comment-page-1/#comment-2611149
Crackers,
That statement was of fact. It is simply science.
But I’ve elsewhere shown that hurricanes were stronger and more frequent in the LIA, citing NOAA to the effect that the sinking of the famous treasure fleet of 1715 occurred when hurricanes were two to three times more common than now.
That’s historical confirmation of my statement, not that it needed any, since the physics of hurricane formation are just as I said, to include formation at night.
Now, let’s see support for your totally baseless assertion that hurricanes are more frequent and stronger now than in previous centuries.
Crackers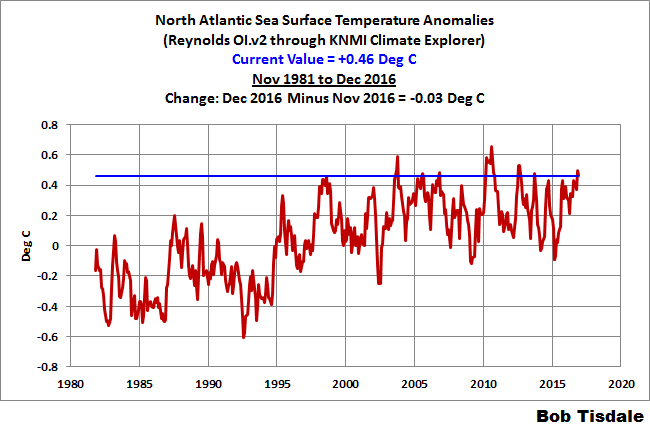
What Sixto said is not contentious. I have recently, last few weeks, posted data justifying his views.
Here is some of the info.:
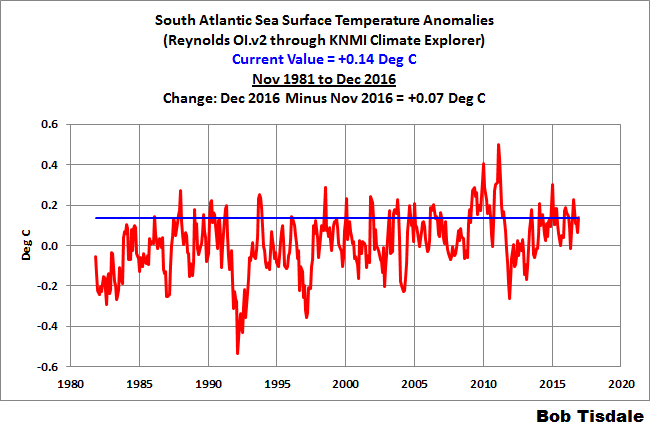
North Atlantic SST, no change in SST for the last 20 years, ie., from 1997 to end of 2016.
South Atlantic, no change in SST for the last 30 years, ie., from1987 to end of 2016.
Not only has there been no recent warming of SST, it appears that the North Atlantic is in now in a cooling phase, and there has been a substantial drop in the ocean heat content (0 to 700n OHC), see the recent paper: Duchez et al paper.
http://notrickszone.com/wp-content/uploads/2017/09/Holocene-Cooling-North-Atlantic-Duchez-2016.jpg
You will note the large drop in heat content of around 3.5degC (NODC measurements) and about 2.5 degC (ARGO measurements) these past 10 years between 2006 and 2016.
Hurricanes do not normally form in the US Gulf, but rather out in the Atlantic, and you will see from the above, there has been no warming for at least 20 years, ie during a time when about 30% of all manmade CO2 emissions have taken place, and if you consider the Southern Atlantic some 30 years during which time some 40% of all manmade CIO2 emissions have taken place.
Dr Judith Curry carried an article (8th September) on Hurricane Irma, and she notes that it was not due to some particularly warm SST.
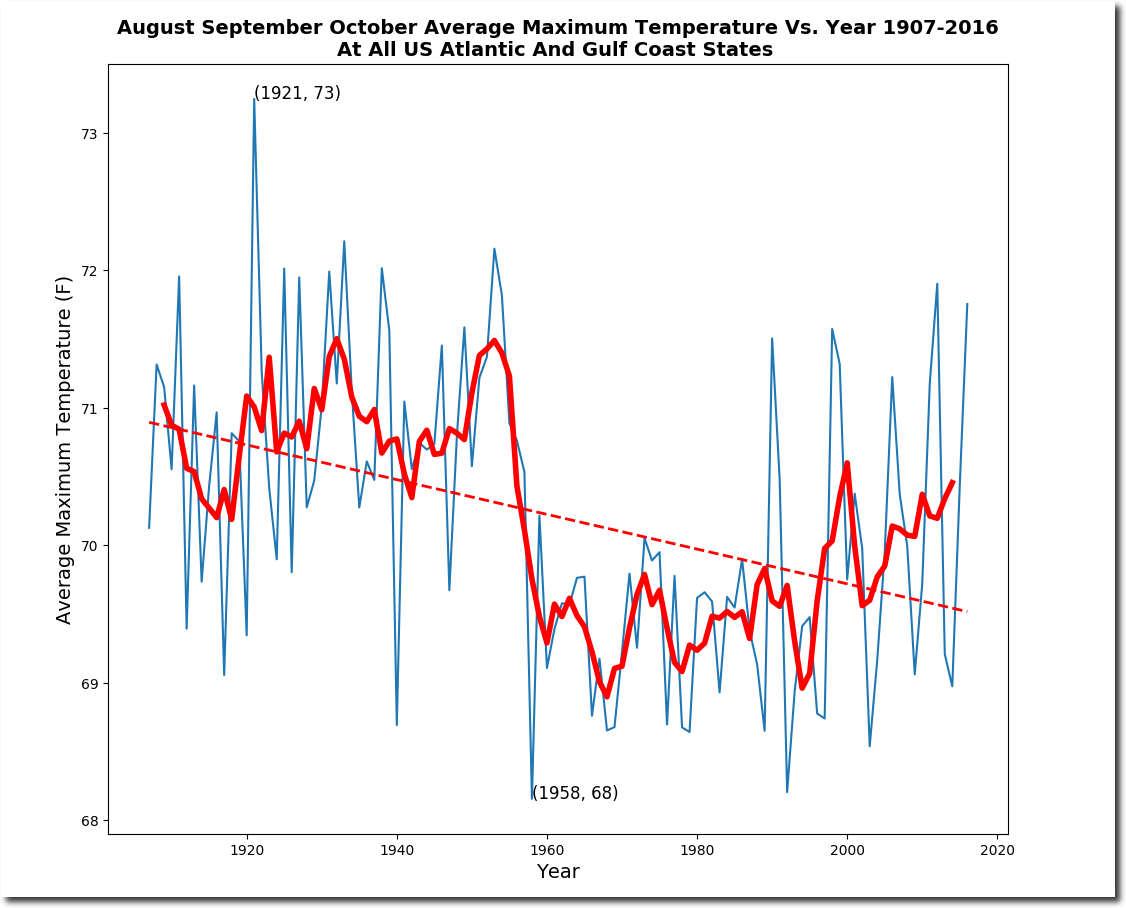
Since there has been no recent change in SST in the North and South Atlantic, unsurprisingly, there has been no change in land temperatures in and around the US Gulf States. In fact, it appears that the temperatures in those areas has fallen since the 1930s. I will post some details on that in a moment.
Crackers
if you look at the OHC of the North Atlantic, you will note that the OHC today, is lower than it was in the late 1950s. This covers the entire period of the Mauna Loa CO2 data, and covers the period where about some 90% of all manmade emissions have taken place.
Similar conclusions were noted in the Yeager and Robson (2017) paper, where they note that the North Atlantic is cooling and that SST is today less than it was in the mid/late 1950s. I attach a plot from their paper. I will not go into more detail since their paper was dealing more specifically with the high latitude North Atlantic.
http://notrickszone.com/wp-content/uploads/2017/04/Holocene-Cooling-North-Atlantic-1950-Yeager-Robson-2017.jpg
The most active hurricane season in the US was that of 1886 when 7 hurricanes made landfall. Wikipedia notes:
Here is a map of the paths, from the Wikipedia article: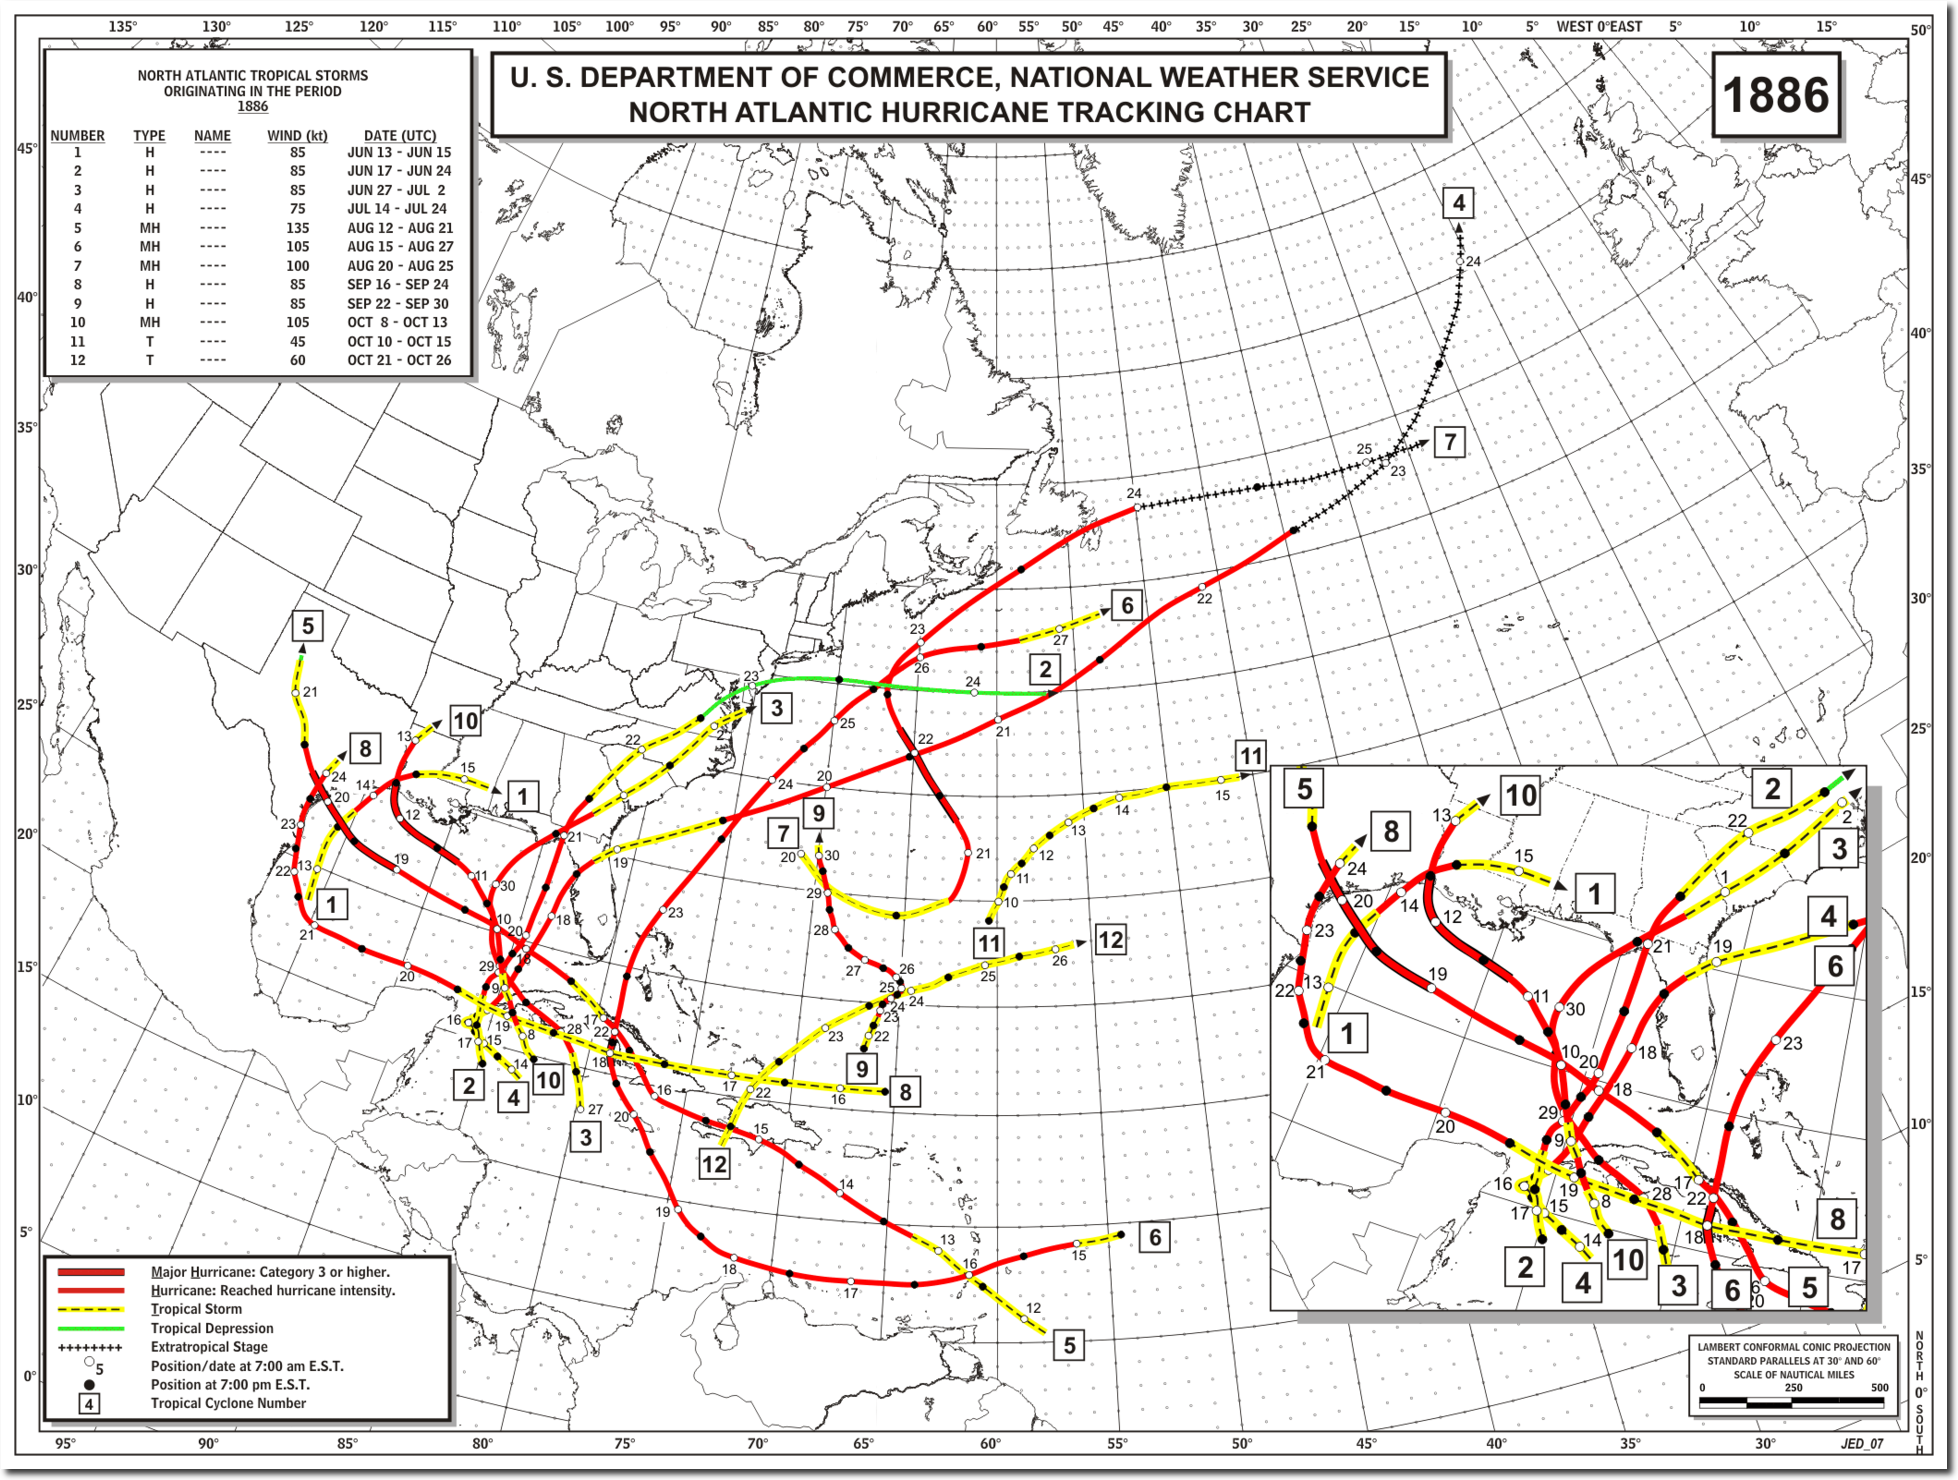
And of course there was the 1780 hurricane which is thought to have had 200 mph winds with 24,000 deaths (incomplete count). See the NOAA archive;
http://www.aoml.noaa.gov/hrd/data_sub/perez_11_20.pdf
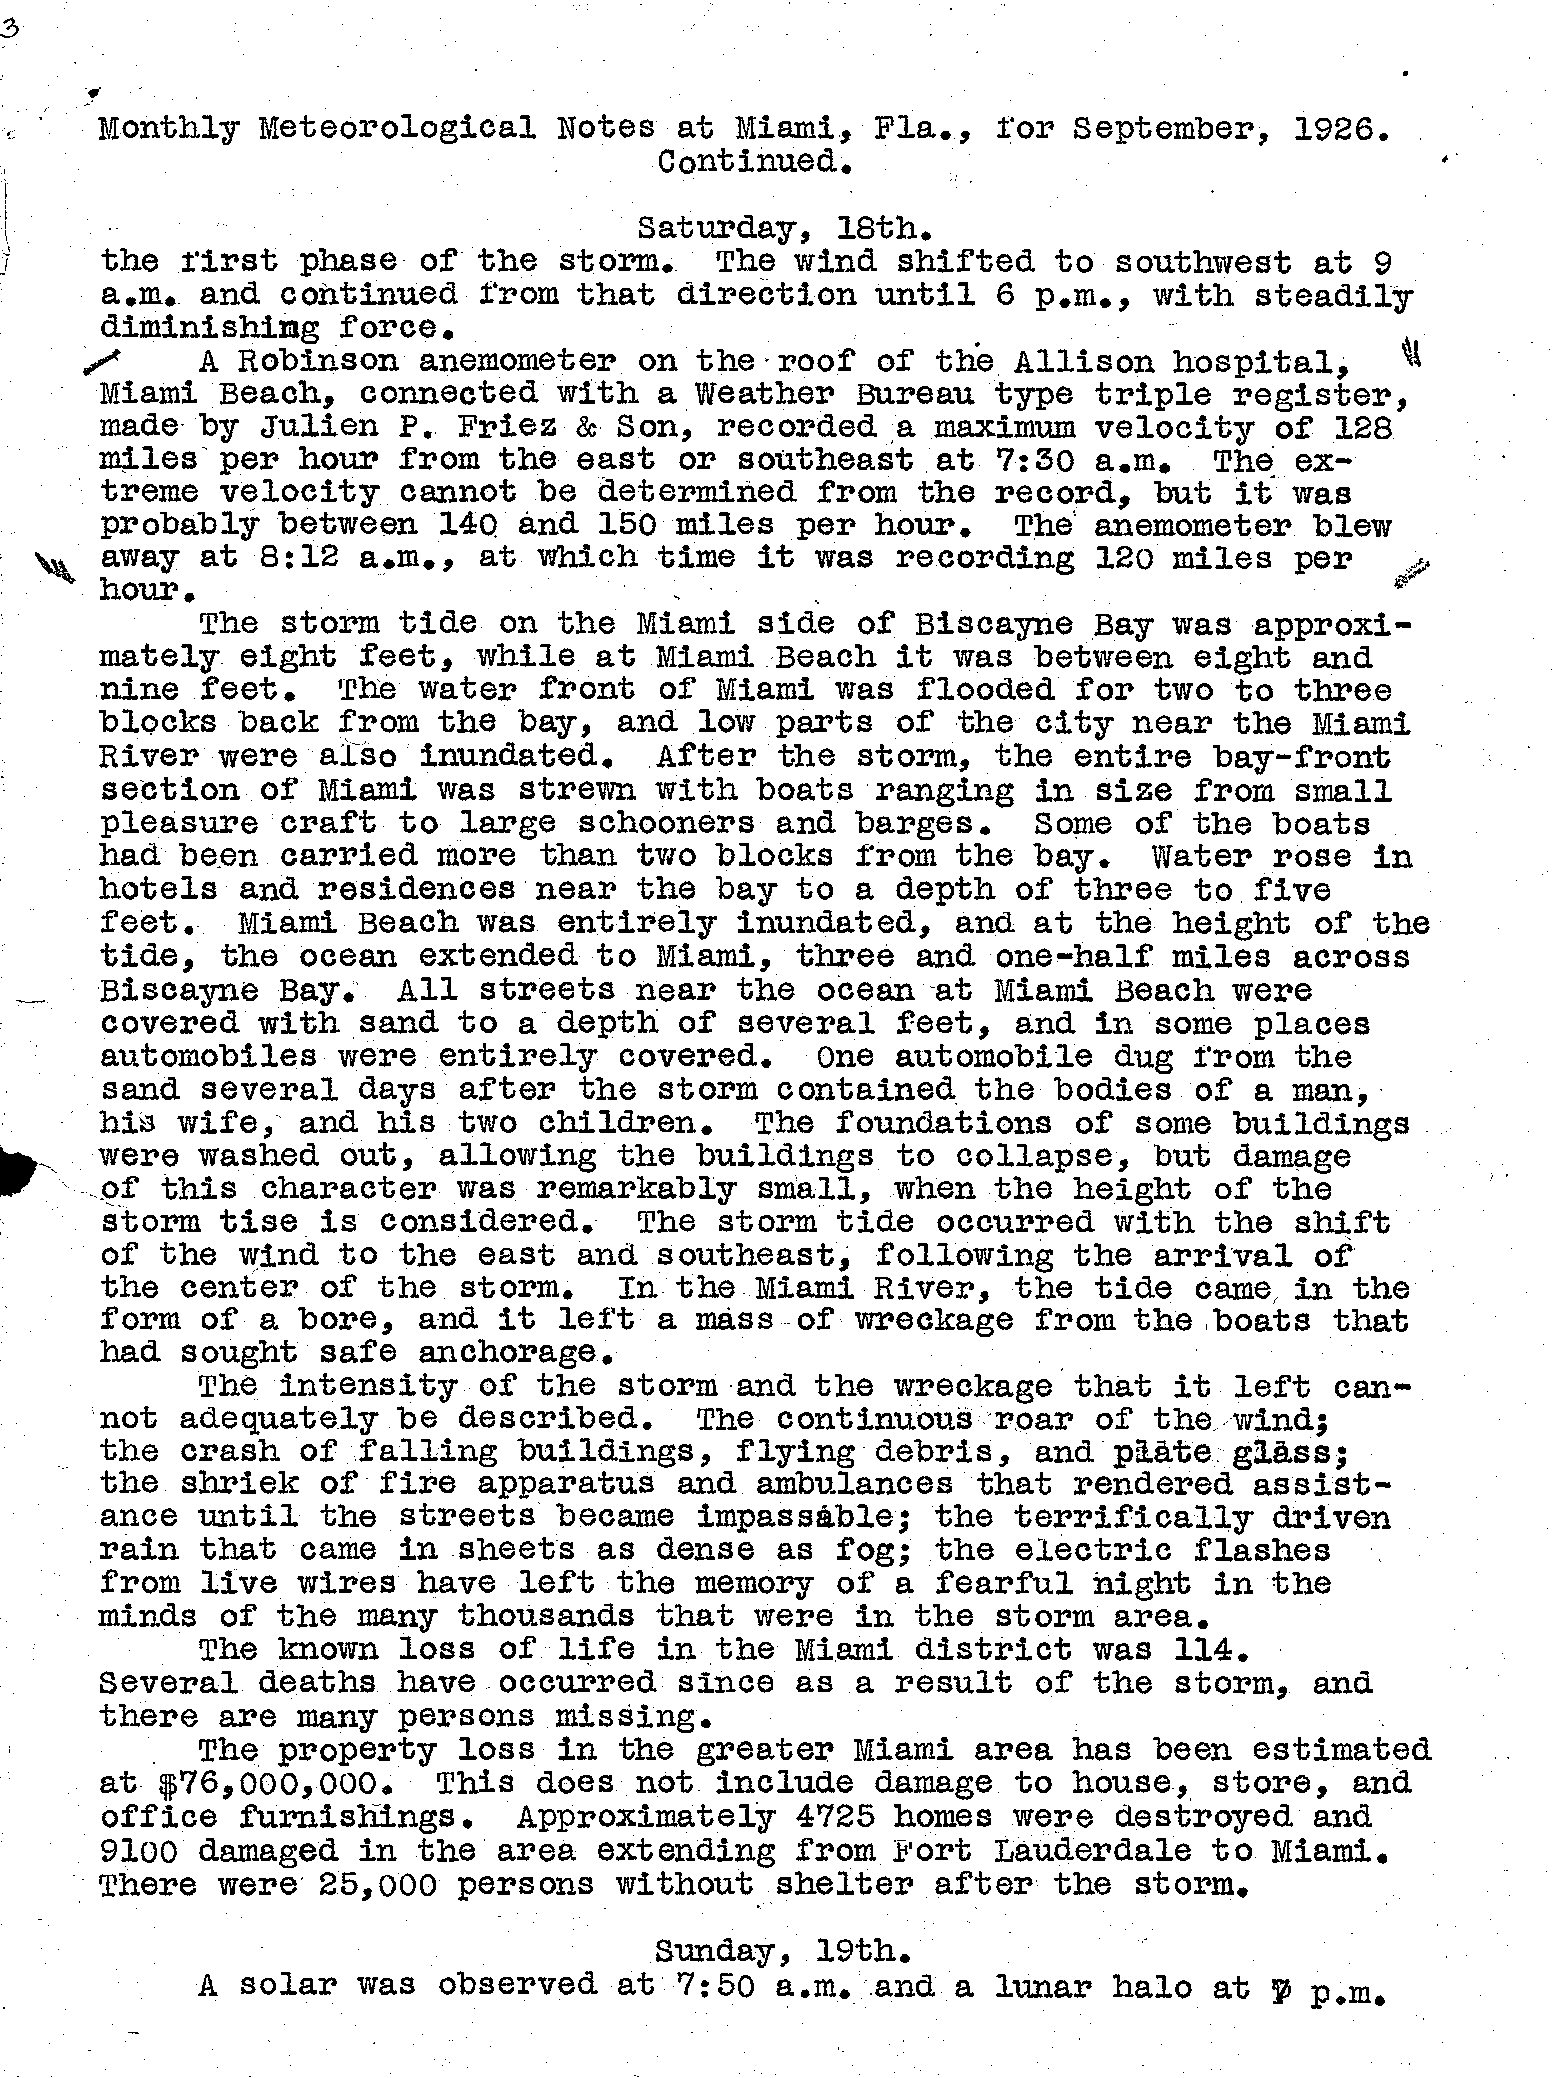
And of course there was the very powerful hurricane of 1926 which destroyed much of Miami and was thought to have had 140 to 150mph winds accompanied by a 9 foot storm surge here is the government account:
So what we are see today, is not unusual, and materially it is not as bad as that seen in the past.
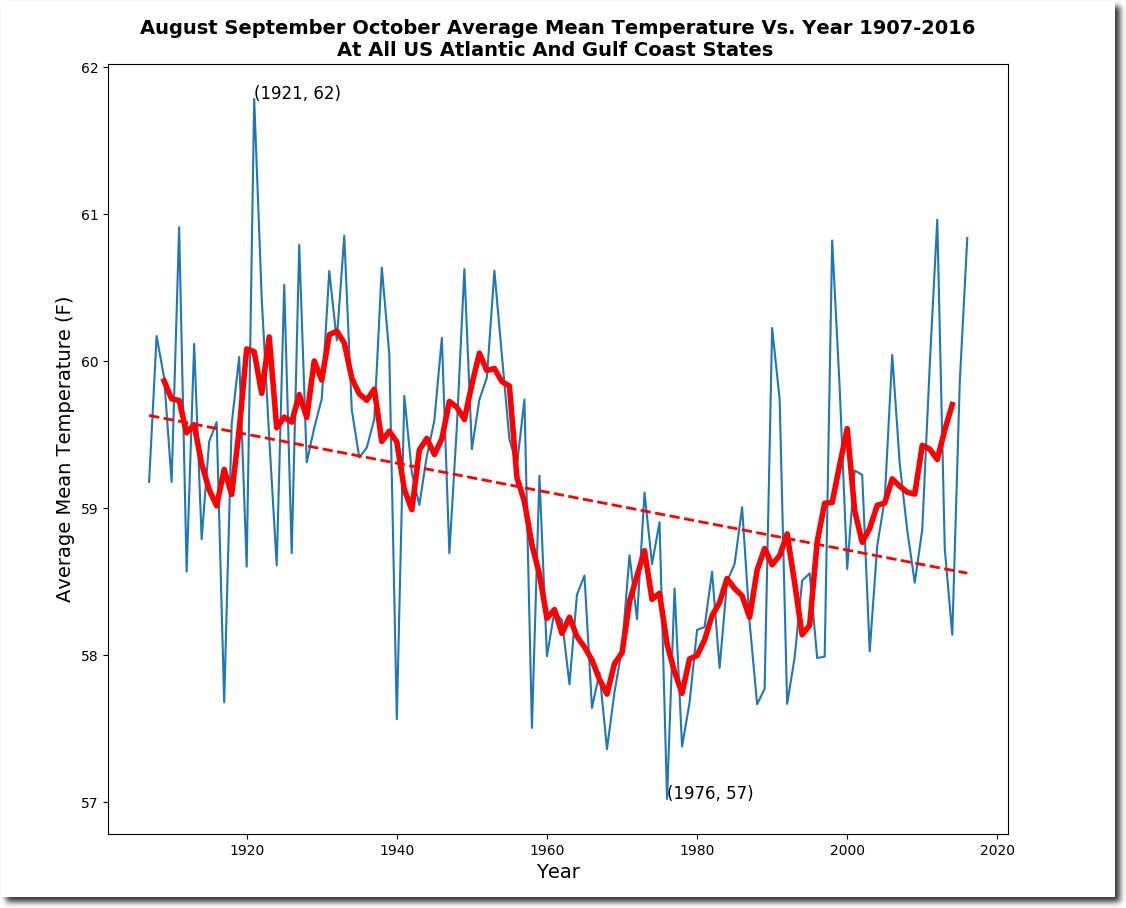
Turning now to the land data, as you are aware, due to the very large heat capacity of the oceans, the oceans dominate. Nearby land is significantly impacted by changes in ocean temperatures. Thus, generally speaking, if the oceans are warming, one would expect to see adjacent land area warming particularly if weather patterns are bringing winds from the oceans. Thus, if adjacent land areas are not warming then this indicates that the adjacent oceans are not warming, or not warming significantly.
See the data for all GCHM at all US Atlantic and Gulf Coast States where temperatures have dropped significantly since the 1920s:
Sixto made the hypothesis. Show the failure..experimentally. Science isn’t citation. Don’t quote, show me what you know.
Publish or perish is an artifact of profiteering. Rigorous demonstration of fact through reproducibilty is science.
The correlation between global temperature and the number/severity of Atlantic basin hurricanes has correlation that varies with time scale. In a scatterplot that shows correlation where the shorter term time scale factor dominates, Atlantic hurricanes actually have a tendency to be less of a problem in warmer years, because El Nino spikes up global temperature and causes a wind sheer pattern that disfavors Atlantic Basin hurricanes. When the time scale for correlation is restricted to longer term, Atlantic Basin hurricanes have significant positive correlation with the Atlantic Multidecadal Oscillation (which global temperature also has positive correlation with). When correlation is done with global temperature varying for reasons other than ENSO (with appropriate lag) and AMO, this seems to be a distant third place. I expect the correlation to be positive, but evidence for this seems to be buried under the stronger evidence of positive correlation with AMO and negative correlation with ENSO.
AGW is a conjecture that is based on only partial science. The AGW conjecture depends upon the existance of a radiant greenhouse effect which has not been observed in a real greenhouse, on Earth, or anywhere else in the solar system for that matter. The radiant greenhouse effect is science fiction. Hence the AGW conjecture is science fiction.
another silly slayer
Cracker 345
Let’s check your accuracy. You claim obviously you believe in the magical gassiness and it’s heateristical hotterisms.
Your church teaches you there is magic insulation that can be mixed into the cold bath conduction chilling a light-warmed rock
that will make thermal sensors detect and depict more light reaching and warming the rock
as it – the insulation makes less and less light reach that rock.
Where in the world is that not a crass, transparent violation of Conservation of Energy?
steve: i don’t debate slayers. the greenhouse effect
is a fact, a scientifically solid fact as true is any
other fact. i also
don’t debate whether 1+1=3.
The existence of the so-called Greenhouse Effect is not the issue. What is the issue is whether or not the Greenhouse Effect is the principal driver of the climate of the Earth.
I accept the existence of the Greenhouse Effect, but do not accept that it is either the main driver of the Earth’s climate or that the modest warming caused by GHG’s is detrimental to mankind.
Climate models agree that without the feedbacks climate sensitivity is about one degree Celsius for doubling of CO2. What causes the alarm is the feedback parameter attributed to water vapor that would amplify the warming by a factor of three times to about 3 degrees Celsius per doubling of CO2.
But recall that water vapor is the dominant Greenhouse gas. The feedback parameter from water vapor has not been well-constrained, either in size or sign, which is why the leading climate models have not converged in decades. The IPCC favors positive feedback (sign +) amplifying the CO2, but the feedback may be negative (sign -) reducing the CO2 effect. If the feedback is negative the Earth’s climate may be regulated by a homeostatic process, at least during inter-glacial periods.
From what I understand from historical studies by Hubert Lamb and others based on prehistory and archeology, the modest increases in temperature during Earth’s many warm periods during the last 5,000 years has been more beneficial than the declines in temperature during the many cold periods.
We can expect this in future too. A drop of one degree Celsius would kill many more people than would a rise of one degree Celsius, a dreadful situation we will soon experience if the solar or other cosmo-climatological theories are correct.
Stephen King says in his novel The Girl Who Loved Tom Gordon, “The world has teeth and it can bite you with them any time it wants.”
The notion that Nature is either benign or evil relies on primitive wishes or fears. Which is why authors pluck our psyches with such thrilling statements.
A scientific approach to Earth science is not anthropomorphic: the Gaia Hypothesis is religion. However, Lovelock may have been correct that Earth systems are regulated by homeostatic processes, at least during inter-glacial periods.
But maybe not. The long-term draw-down of CO2 into geological sinks, especially at the bottom of the oceans, might have led to extinction of life on Earth.
Fortunately, we now know how to replenish atmospheric CO2.
Sigh
Climate models (computer programs) do what they were programmed to do. If the software program codes CO2 as a strong ‘green house gas’ (whatever that is meant to mean) then unsurprisingly when the program is run it will show CO2 is a strong ‘green house gas’. If a different but similarly convinced programmer builds their own computer model and programs it with the assumption that CO2 is a green house gas – presto both programs show the same effect.
What does this prove? Programmers using the same assumptions about green house gases in the atmosphere write programs that have similar results showing green house gas effects in the atmosphere.
Now check the programmers’ models against reality – no match. Programmers have wasted everyone’s time and money with worthless models of an alternate universe. Justifying important decisions based on the programmers’ output would appear to be insanity.
I have a computer model that show Germany winning WW2. Should I be writing this in German?
Solar output isn’t constant. Mapping irradiance to climate shows noise. Deduction would be water effect is negative feedback.
The models fail to account for latent heat transfer by water vapor including processes like virga. Quantify all forms of virga and there is a bulk of thermal energy rising in opposition to any LWIR “blocked” by carbonic anhydride.
ian W – “Climate models (computer programs) do what they were programmed to do. If the software program codes CO2 as a strong ‘green house gas’ (whatever that is meant to mean)”
CO2 is, of course, a strong GHG.
But what climate models do is use the experimentally determined
aborption and emission parameters for
the major lines of co2. these are available to
anyone. then the models calculate how
much the atmospheric
co2 is absorbing.
it’s a physics calculation — just too difficult
to be performed analytically, so it’s
done numerically. just like many of the
others models used in calculations that
affect your life (bridges, airplanes, buildings,
rockets, missiles, and on and on).
You might be crackers if you believed other, tested models assumed a magical 3X times whatever they were modeling.
Hey, I live on the west coast…where’s the fire? Heck it’s not even all that warm here in LA.
Seems like the class clowns are still as ignorant as ever.
Results of a study reported on KNX (LA CBS affiliate) today states thast wildfires in California have been declining for the last 40 years. Class clowns, indeed, rocektscientist.
Retired Engineer,
Don’t go by what you hear on the radio. Here is an account of this new study: “Over the last 40 years, there is a surprising trend with California wildfires” in the Orange County Register. Great graphs that tell the story.
The bottom line: fewer fires but more acreage burned.
The paper discussed is “Different historical fire–climate patterns in California” by Jon E Keeley and Alexandra Syphard in the International Journal of Wildland Fire, Vol 26 nbr 4, 2017.
Editor,
Thanks for the links and the gentle admonition. A little hard to catch any sort of links at freeway speeds!
Retired,
Living in the Bay Area, I spend a lot of time on the road. I used to listen to the radio, then be astonished to learn the actual story. So I know what you mean.
Now I listen to music on DVDs. More entertaining, less misinformation!
A forest fire *anywhere* means there are forest fires *everywhere*. Just like heavy pollution in China means that there is terrible pollution everywhere and the west must pay.
Didn’t you get the memo?
piper: US YTD wildfire stats:
https://www.nifc.gov/fireInfo/nfn.htm
how does ’17
compare?
Piper,
“A forest fire *anywhere* means there are forest fires *everywhere*. Just like heavy pollution in China ‘
Wow. That’s quite false. Fires result from local factors (e.g., drought, land use) as much as (probably much more) than larger-scale factors. That is far less true for air and water pollution.
For details see the cites I provide in the section about wildfires. California is having a very bad year. The rest of the nation not so much.
Editor: Piper was being sarcastic about the egregious, alarmist extrapolation of ‘a forest fire anywhere’ into ‘a forest fire everywhere.
Steve,
Thanks for the correction! I’m not good at picking up implied sarcasm.
And in the often over-the-top climate wars — and US politics — who can tell these days? Even major media headlines often read like stories at The Onion or Duffleblog.
There is another aspect of this that space precluded discussing (this post was already 3x what I consider the ideal length for such an essay for a general audience). What is the relationship between Sea Surface Temp and Hurricane Intensity. Do they growth more intense as the seas warm? Alternatively, do the very powerful ones become more intense?
Lots of interesting work on this. There have been graphs exchanged on Twitter. I’ve asked some climate scientists to explain this debate to me. The graphs and papers of both sides look convincing.
If anyone cares, I can post a few links and graphs. This debate is an expansion of some issues touched lightly upon in the NOAA statement.
while you’re at it ask them to explain how they figure “uncertainty”…
…when they have no idea what the certain is
Latitude,
The climate scientists writing about this are well-aware of the various kinds of uncertainty, and discuss them at length in their papers.
One on side, see James Elsner’s papers. Esp note the graphs in Chapter 8: Intensity Models, in Hurricane Climatology: A Modern Statistical Guide Using R by James Elsner and Thomas H. Jagger (2013). The code is here. He is chairman of the Department of Geography at Florida State University. Very dense math.
Here is his 2008 note at Nature of his protocols, so you can replicate his findings.
For the other side see the work of Phil Klotzbach (Research Scientist, Department of Atmospheric Science, Colorado State University). The link is in this post.
“The primary reason for the increase in category 4 and 5 hurricanes noted in observational datasets from 1970 to 2004 by Webster et al. is concluded to be due to observational improvements at the various global tropical cyclone warning centers, primarily in the first two decades of that study.”
—–”””’
Editor, have you had a chance to see how the disparate and expansive changes in tracking and gauging tropical storm and hurricanes accounts for this? It appears clear that there are many changes, initially just on site atmospheric pressure and wind gauges plus damage assessment, to airplane flights, to better instruments and more frequent flights, to satellites, to better and more satellites, more ground stations, etc… The point is this deserves a serious attempt at quantification.
By some observations, both Harvey and Irma are the two weakest CAT 4 land falls on US history; such as ground based wind speeds, storm surge, damage to houses, structures and trees. ( Excluding Harvey’s flood damage, which was not the most intense 24 or 48 hour rain on even Texas history. Harvey hovered over a Houston, a subsiding city built on a swamp) It appears likely that pre hurricane flights, and even pre the satellite era, both Harvey and Irma would have been CAT 2 or 3s at landfall. You do not stand in the eye wall of.a CAT 4, even on the weak side. Heck, Cantori was standing on the North eye wall and palm fronds on the ground behind him never blew away! Every major Hurricane photos I have seen of mobile home parks look like a tornado went through them , except Harvey and Irma.
Your thoughts appreciated.
David,
“The point is this deserves a serious attempt at quantification.”
There are efforts to do this, if I correctly understand your point. NOAA is reviewing records back a ways (late 19th C?), to more accurately classify know hurricanes. Scientists working in paleoclimatology are working to create longer databases of hurricane history.
I’ve read about this, but wasn’t interested in the details (and so don’t remember them). But there is quite a bit written about both projects. I suggest starting with the Klotzbach – Landsea paper I cited. Also look in their references for more sources. And, of course, there is the great god Google — font of all knowledge!
I question the relationship of SST to AGW as I’ve read that the “back radiation” from increased CO2 being long wave IR can’t penetrate the water to heat it efficiently. Has anyone addressed this in the race to blame global warming for hurricane strength through warmer oceans?
Attributing natural events like hurricanes, wildfires and floods to CAGW with no long term trends of increase in frequency or intensity is bad enough but the earthquake in Mexico too? These people are deranged!
Yeah, I’d love to see the science behind the AGW-caused earthquake. But then I’d probably just deny it, anyway. 🙂
Hey Chris, I’m not sure about the tectonics hobgoblin, otherwise I agree…this whole thing about us people changing the clouds, wind, rain or temps and having the ability to change them back (via taxes) is just nuts. But that’s what’s going on…Chomsky and McLuhan are right, as far as the media is concerned perception trumps reality.
And as far as the warmunist climateers are concerned, the truth is not the best lie.
As always, we live in interesting times.
This is part of the belief that we can control our environment on both a macro and micro level.
Good luck with that.
But just think of the employment opportunities.
What do the experienced among us make of the track changes for Jose.
Will it be getting into cooler water and loose energy?
http://www.nhc.noaa.gov/refresh/graphics_at2+shtml/235324.shtml?cone
Cat 3 storms are not that unusual for New England. One typical storm path is due north across Long Island and then straight up the Connecticut River Valley. Other storm tracks are further east, going across Cape Cod and then into the Gulf Of Maine. Coming north from off of the Carolinas, they are often fed by the warm waters of the Gulf Stream, so energy loss does occur but tends to be minimal.
Jose extended forecast shows steady progression to the east, and so mostly a fish storm. Good for New England if the trend holds up.
Joe Bastardi at Weatherbell.com has good stuff on that. He also posts to Facebook and tweets.
Washington State Governor Inslee – said to be the greenest governor in the country – says we are to blame. See: http://appinsys.com/GlobalWarming/Inslee.htm
I live in Washington and can attest Inslee is an idiot.
He is part of the Brown, Ritter, Gore crowd.
Harvey was not a Cat4 at landfall.
There were no landfall reports of surface winds at or over 110MPH.
I have not explored Irma yet, but if Irma was Cat3 at landfall, it was such very briefly and in a limited area.
Irma as Cat4 hit some islands – the impact there was observably different. We can see the difference right in front of our eyes.
Last Democrat:
NOAA reports at the time describe it as a Cat 4 at landfall on Sept 10.
Here is NOAA’s Public Advisory of landfall at 9:10 EDT: http://www.nhc.noaa.gov/archive/2017/al11/al112017.update.09101318.shtml?
Here is NOAA’s next “Bulletin” at 11:00 EST:
http://www.nhc.noaa.gov/archive/2017/al11/al112017.public.046.shtml?
I hit the send key accidentally!
Note on the above — those notices were about Hurricane Irma. It hit aprox 900 EDT as a Cat 4. It slowed to a strong Cat 3 in their 2:00 pm EDT “Bulletin.”
http://www.nhc.noaa.gov/archive/2017/al11/al112017.public_a.046.shtml?
NOAA/NHC claims are based on models using data obtained by aircraft radar and dropsondes, not surface anemometers. Photos of real damage in the path of the storms are consistent with wind speeds recorded by surface anemometers. If the hurricanes were really Category 4, the actual wind damage would be tremendous, far greater than shown in real time videos and photos.
This is not new. The National Hurricane Center has been doing the same exaggeration of winds with other tropical cyclones for years. Eg Mathew and Hermine
Show ground based measurements in graphical presentation with pressure.
Don’t repeat NOAA bulletins. Show ground based measurements.
And Irene. See WUWT threads on it.
Harvey was mostly a Category 1 storm at US landfall, with one band of Category 2 winds that lasted a few hours. There is only one NDBC station with sustained winds of Category 2 for about 4 hours.
Photos of surface damage are mostly consistent with Category 1 winds, with a narrow band of Category 2 damage from Rockport, Texas to the coast.
Irma was not a hurricane at US landfall. Not at the Florida keys, not at Naples, nor to the east of Naples.
There are no surface stations with reported sustained winds over the 64 knot threshold for a hurricane anywhere in Florida. NDBC buoys recording sustained surface winds in the path of Irma eyewall of 60 knots sustained.
All the photos of surface damage are consistent with tropical storm force winds. Plenty of ocean surge damage in the keys, but that is not part of the Saffir-Simpson hurricane wind scale. Irma sustained winds dropped gradually after landfall.
Irma was certainly a Category 3 storm over the leeward islands, but weakened substantially when it reached Cuba, and never recovered over the Florida straight.
This is observed fact. All of the video and photos of damage are consistent with the sustained surface winds recorded by anemometers. There are always a few weaker trees and structures in areas of damage that people then cherry pick to claim damage over wider areas. But the overall amount of damage over the entire area shows the true nature of the storm. If Harvey and Irma were major hurricanes, we would consistently see far more severe damage over much larger areas in the path of the eyewall.
You need to go to Naples and dig in and help those who were hit by this non-hurricane.
Tom,
I was wondering if it was worth replying to that comment. You reply was perfect.
Well said, BW. Your reserach needs repeating ad infin. I searched the buoy data and found nothing to contradict you. But I guess the official story is going to be that they were both Cat 4’s ?
bw, I know where you are coming from and I agree with you. Maybe it’s a swamp thing!
Plot of winds at Naples during Irma. The plot shows the eye passing over the station at 21.12 hours.
goo.gl/KSD9VJ
56 knots peak sustained winds are well below the 64 knot Saffir-Simpson scale for Category 1.
Data for September 10 at NDBC station NPSF1 highest sustained winds of 22.1 meters per second at 20.18 hours. Pressure 947 hPa.
The eye passed over the station from 20.54 to 21.12 hours with low winds recorded.
The trailing eyewall passed over the station at 22.00 hours with sustained winds of 28.8 meters per second (56 knots). Pressure 954 hPa.
http://www.ndbc.noaa.gov/data/realtime2/NPSF1.txt
Winds at Fort Myers station FMRF1 were very similar to Naples but the eye did not pass directly over the station. I’ve examined every NDBC station data for Irma, none show winds reaching Category 1 threshold for 10 meters above the surface. Fowey Rock station (anemometer height 44 meters) which is the one exception. MLRF1 station Molasses Reef reached maximum of 30.9 meters per second, but the anemometer height is 15.8 meters above site elevation.
Maximum sustained winds at Vaca Key station VACF1 reached 26.8 meters per second at 13.48 hours. This is the closest surface station to US landfall with anemometer height of 9.6 meters above mean sea level which is very close to the 10 meter standard height for recording anemometers used to define the Saffir-Simpson hurricane scale. Category 1 hurricane theshold for sustained wind speed is 33 meters per second.
http://www.nhc.noaa.gov/pdf/sshws.pdf
Editor, how was the reply perfect? Where did bw say there was not extensive damage and suffering from the very wide wind field that was Irma? Where did he say he had no sympathy for the victims of Irma suffering from no power, structure damage consistent with , extensive flooding. In Texas the 24 hour rainfall record was set by a tropical storm.
bw is correct about visible damage and ground based readings. ( Excluding flood and spin off tornado damage) We have far more ground based wind gauges then we had in the past. Why does raising this truth in conjunction with past major storms where older mobile home parks look like a tornado hit them, all flattened from true ground based CAT 3 plus winds, make be an insensitive person not worry of rational response? Seriously, Cantori standing in the North Eye wall of what at that time was being called a STRONG CAT 3 and the broken palm fronds on the ground not even being blown away is misleading and dangerous so for future reactions to potentially real surface recorded CAT 3 or 4 winds.
Is it not dangerous for future preparation ( and insensitive to past victims) where thousands of homes were ripped apart by wind alone, to not acknowledge their harm and prepare for the harms associated with true CAT 3 plus winds?
The “perfect” response to bw would be to show him wrong, list from thousands of sites the wind speed records recorded at the surface that show CAT 4 OR 3 winds, show photos of mobile home developments where most every home is completely flattened, not partial pictures of tornado damaged buildings.
BTW , I have looked for how hurricanes are adjusted for past inability to find the perfect time and location to estimate the storms maximum strength, and while I find these changes acknowledged, I have not found them to be quantified or found that past ACE. and individual storms are adjusted accordingly. With the wild eyed alarmist claims of CO2 causing ever more intense hurricanes and cyclones, is this not cogent to debunking these fear based claims? I say it is, and bws post is worthy of good answers to the assertions in the post he made.
To further the posts above in support of bw’s comment, please also consider answering why every single news station was expecting a storm surge at Naples of 10 to 15 feet, and they got a surge of 4.3 feet. The surge along the entire west coast, exposed to the NE quadrant was at best 1/2 the predicted MINIMUM storm surge.
Again, this is reflective of wind speed recordings and. ground based damage observations. bw’s post deserves real response.
On the other hand, the Island of St. Martin got whacked very hard.
bw There was major destruction on Barbuda, St Martin and the other outlying islands on its path. Reported 95% destruction of property that is more consistent with a cat 5 . It weakened costerably befor Florida. But don’t let a bit of destruction get the way of a bit of propaganda
sorry, but, you need to look here:
http://www.wpc.ncep.noaa.gov/discussions/nfdscc1.html
Harvey definitely hit as a Cat 4
Looking at the provided NOAA link the highest gust was 132 mph. However, the Saffir-Simpson scale isn’t based on gusts. It’s based on 1-minute sustained wind. So if 132 was the peak gust, then it’s likely that it didn’t have a 1-minute sustained wind of 130mph. Therefore not likely a Cat 4. As an aside, the 1-minute sampling period used to determine hurricane category conflicts with the 2-minute sample period used to compute sustained winds reported by observing stations. Thus, just because a station didn’t report a sustained wind over a certain threshold doesn’t mean that threshold wouldn’t have been reached using a 1-minute sustained wind.
Definitely Not. Surface anemometers and photos of damage are the true measure.
That is a table of preliminary data and winds are gusts, not sustained winds. The Saffir-simpson hurricane scale is defined by sustained winds at a defined height elevation. It is intended to make estimates of wind speeds during a tropical cyclone using surface damage as a gage. Photos of surface damage, palm trees, etc are consistent over the years with winds measured by anemometers. The media and NHC now consistently abuse the Saffir-Scale
A 100 knot gust is not a hurricane if you want to use the Saffir-Simpson scale.
http://www.nhc.noaa.gov/pdf/sshws.pdf
Something I learned during Irma is that dropsondes use their GPS to determine wind speed.
As a former GPS engineer (and still a GPS consultant) I can say that I think calling their wind speeds estimates is being generous.
First GPS receives of the size used in a dropsonde have real difficulty in the rain, which I would expect to be pretty heavy.
Secondly, the bumpy ride it is taking would cause huge variations in the doppler shift received from each satellite causing big variations in estimated fix.
Thirdly, GPS systems are not that accurate in the vertical dimension. Figure 5 to 10 meters compared to about 3 meters in the horizontal dimension. Thats CEP, co 50% of the readings will be outside that accuracy.
One thing about fix accuracy if you take 3 identical GPS receivers and place their antennas so conditions are the same (which includes atmospheric conditions and ionosphere bending) you’ll see the fixes drifting in different directions. While it would seem logical that all three would drift right or left the same, but because each receiver has a DSP and a separate internal processor they each have their own “minds”.
Jack,
Please explain what is in your link that would rate Harvey as a Cat 4. I fail to see anything related to sustained wind speeds as is the standard for rating hurricanes.
If it can be shown, or convincingly argued, that the hurricane categories of Harvey and Irma were exaggerated by official sources, that will demonstrate their bias toward alarmism and diminish their credibility on matters relating to climate change.
(Some of the exaggeration was unintentional, in that our new methods of data collection allow us to capture higher wind speeds and gusts that would have been missed earlier. Or should I say “unintentional,” with sneer quotes, because officials were aware they were using and apples vs. oranges comparison, but omitted correcting for it or mentioning it.)
Jack be quick, here are the top ground based wind gusts for Harvey;
PORT ARANSAS 2 ENE 132
COPANO VILLAGE 1 ENE 125
LAMAR 2 SSW 110
ROCKPORT 1 S 108
TAFT 5 NNE 90
MAGNOLIA BEACH 8 ESE 79
EDNA 73
As pointed out, these are not 1 minute sustained winds. The top wind gusts for a past Texas CAT 4 were, as I recall, 175. 155. 152 and 150. ( Major difference)
In addition sometime watch a satellite ( not radar) of Harvey and Irma’s Eye wall structure coming to shore. Harvey’s eye wall formed beautifully and became stronger just before impact, while Irma’s became very asymmetrical, clouded up, and then completely collapsed ( like putting a stopper on a draining bath tub) to where the rain bands 80 miles plus away were of equal intensity.
roger, you have some nerve, claiming that
all these scientists and meteorologits
are lying. while offering no evidence
whatsoever.
they are good, hard
working people doing their best
to serve the public, just like everyone else. i’m
guessing that you must lie at your job, since
you think everyone else does too.
you owe them an apology
Excellent summary.
With regards to statistics of hurricanes in the past compared to today, the only way they can be apples to apples is if we compare landfalling stats to landfalling stats.
If Irma existed 80 years ago for instance, almost all the information that we would have known would have come from land reports. A ship obviously would have gone the other way or perished. Hurricane Hunters did not start doing surveillance of the Atlantic Basin until the 1940’s, which is when we greatly boosted our information about hurricanes. However, it wasn’t until the age of satellites in the 1970’s, when we really got tuned in.
With regards to the warmer atmosphere holding more moisture(maybe 4% more from +1 Deg.C), that is pretty clear. OK, so Harvey rained 51 inches in one place instead of 49 inches but there is ZERO evidence that anything related to global warming/climate change caused Harvey. Tropical Storm Claudette still holds the record for the most rain in one day:
http://www.chron.com/news/houston-texas/texas/article/After-35-years-Alvin-still-holds-U-S-record-for-5644837.php
Here’s some interesting statistics on record rainfall amounts for time frames going from 1 minute to 1 year in the United States. Note the years on all of them(prior to 1983).
http://www.nws.noaa.gov/oh/hdsc/record_precip/record_precip_us.html
This shows that the 4% increase in atmospheric moisture is less important for the most extreme precipitation events than the actual weather pattern at that time. Though I believe we have in fact had an increase in high end flooding events during the past 30 years.
Slightly warmer SST’s can cause hurricanes to be slightly stronger too…….all things being equal. OK, so we can add, maybe 10 mph to the intensity of some hurricanes in the future. However, going well beyond that with statements and claiming that Harvey and Irma were caused by climate change is junk science.
And with the authentic science showing a slight increase in rain/intensity, if one is looking objectively at authentic science, the area in which the greenhouse gas, CO2 is having the biggest impact………by a wide margin relates to the scientific law of photosynthesis(no, it’s not been abolished).
http://www.co2science.org/data/plant_growth/dry/dry_subject.php
http://www.co2science.org/education/reports/co2benefits/MonetaryBenefitsofRisingCO2onGlobalFoodProduction.pdf
http://www.co2science.org/data/plant_growth/dry/dry_subject.php
Should this be considered in a discussion about climate? Well, certainly the massive increase in vegetative health is effecting the earths albedo, evapotranspiration, soil moisture and other factors in a beneficial way but even if it wasn’t, the topic climate change from humans burning fossils fuels is focused on the effects of CO2(the beneficial gas).
Suggesting that we take actions to curb CO2 emissions requires that we look at the entire picture of what CO2 is doing.
One way to think of this objectively is to think of how life on earth would testify about CO2, including plants/the biosphere and all living creatures.
Would life be concerned about a 4% increase in atmospheric moisture or an increase in wind speed of 10 mph in some hurricanes? Life would be asking for MORE CO2.
Humans have built their society along coastlines though. So a tiny change in something that has a negative impact on the coastlines (sea level increase too) is getting tremendous OVERweighting and massive exaggeration in the discussion.
Something that has 10 times more positives for life on earth than negatives.
It feels like the scientific version of the Twilight Zone. If all there was no CO2 or fossil fuels, would people be alarmed at anything that has happened in weather or climate the past 40 years?
The climate/weather and CO2 has been the best during that time for growing crops and for most life since the Medieval Warm Period, 1,000 years ago. There are around 100 studies that suggest it was likely this warm…….not just regional. (The claim that the planet warmed for a couple hundred years in one or two regions is absurd) Read the history/reports from people living then. Life and humans flourished because of those conditions during the Medieval Warm Period……..and the Roman Warm Period, 2,000 years ago.
Despite the IPCC rewriting climate history to eliminate the Medieval Warm Period, it really happened. Why deny this truth?
http://www.co2science.org/data/mwp/mwpp.php
http://www.co2science.org/data/mwp/qualitative.php
Sorry for posting one of those links above twice. The other one was supposed to be this:
https://www.nasa.gov/feature/goddard/2016/carbon-dioxide-fertilization-greening-earth
Thank you Mike.
Mike, this ” Though I believe we have in fact had an increase in high end flooding events during the past 30 years.” needs evidence on a global bases. Also the future 10 percent increase should be manifesting some NOW during strong El Nino’s, but is not afaict.
The many posts and papers relating to the T difference ( cold and hot mixing) both vertically, and latitude wise, being of more importance then just warm SST is fairly extensive and CAGW theory is predicated on LESS T differential both vertically and latitude wise. ( The troposphere is suppose to warm more overall then the surface and particularly in the tropics, and the polar regions are expected to warm more then the equator)
Neither ACE, or other metrics accounting for the size of wind-fields,
indicate an increase in the number or intensity of tropical storms. ( particularly true as these indexes are NOT adjusted for inadequate monitoring in the past meaning they are likely understated.)
David A: these data do show an
increase in hurricanes, of about
0.1/decade since 1851
http://www.aoml.noaa.gov/hrd/tcfaq/E11.html
and the increase in major hurricanes
since 1851 is +0.14/decade
the increase in global ACE
is 2.7/decade, since 1851.
sorry mike, but higher temperatures from
co2 counteract increased co2 fertilization.
it’s a wash……….. but nutrient values do
decline under enhanced co2. see that
recent Politico article.
ps: are you aware of the finds of the Duke
loblolly pine experiment of enhancing co2?
the trees quickly adapted to it and the
increase in growth stopped in about 5 yrs.
Just what constitutes “powerful assistance from man”?
I already know what powerful assistance Mann can give.
“Many just assume the science says what they want it to say, without recourse to the IPCC, NOAA, or a similar authority”
In this article we mainly hear from a few rather carefully selected scientists. They are certainly worth listening to, but it is a narrow selection. There is just one recourse to GFDL, an NOAA group. But the quotes are also rather selective. For example, the first:
““It is premature to conclude that human activities–and particularly greenhouse gas emissions that cause global warming – have already had a detectable impact on Atlantic hurricane or global tropical cyclone activity. …””
continues:
” That said, human activities may have already caused changes that are not yet detectable due to the small magnitude of the changes or observational limitations, or are not yet confidently modeled (e.g., aerosol effects on regional climate).”
Section E as quoted:
“In summary, neither our model projections for the 21st century nor our analyses of trends in Atlantic hurricane and tropical storm counts over the past 120+ yr support the notion that greenhouse gas-induced warming leads to large increases in either tropical storm or overall hurricane numbers in the Atlantic. …”
continues:
” One modeling study projects a large (~100%) increase in Atlantic category 4-5 hurricanes over the 21st century, but we estimate that this increase may not be detectable until the latter half of the century.”
So there is a projection of a big increase – it’s just going to be hard to establish statistically for a while. And it goes on to say:
“We also conclude that it is likely that climate warming will cause hurricanes in the coming century to be more intense globally and to have higher rainfall rates than present-day hurricanes. In our view, there are better than even odds that the numbers of very intense (category 4 and 5) hurricanes will increase by a substantial fraction in some basins, while it is likely that the annual number of tropical storms globally will either decrease or remain essentially unchanged.”
Nick,
Nice to see you again. I always enjoy your reading FAILs. Few commenters can be refuted so often by merely quoting from the post. As always, I will summarize my reply: “read again, more slowly.”
(1) “In this article we mainly hear from a few rather carefully selected scientists.”
As I explained in the post, the long excerpt from NOAA’s statement was the key and the other scientists’ quotes or cites were for info and context leading up to that:
(2) You are impressed with “That said, human activities may have already caused changes that are not yet detectable.” Since a note that there may be undetectable things can be added to almost any scientific finding, it’s hardly news. It is commendable diligence on NOAA’s part to include that, but hardly significant.
(3) “One modeling study projects a large (~100%) increase in Atlantic category 4-5 hurricanes over the 21st century, but we estimate that this increase may not be detectable until the latter half of the century. …We also conclude that it is likely that climate warming will cause hurricanes …”
This is a too-long essay on one specific subject: two hurricanes in the past. It does not seek to explain future climate change, replicate AR5, or show the Cosmic All. The subject was stated in the first sentence of the summary:
Editor,
“NOAA’s statement was the key and the other scientists’ quotes or cites were for info and context”
Your summary simply said:
“Let’s listen to these scientists”
and then followed a highly selected list.
Re A:
“but hardly significant”
It’s a qualifier that they felt they needed to add to the statement. Yet you omitted it.
“This is a too-long essay on one specific subject: two hurricanes in the past”
From the quote that you follow with:
“but too little about the science connecting them to climate change”
The section from E that I quoted, and you didn’t, was all about the science connecting them to climate change. They say “it is likely that climate warming will cause hurricanes in the coming century to be more intense globally and to have higher rainfall rates”. That is science connecting them to climate change. What you have quoted is about how long it will take before the statistics will become definitive.
Nick,
Now you are just trolling. You are wasting my time, and that of those reading here. This is my last reply to you about this.
(1) “Your summary simply said:”
Even for you, that’s quite the reading FAIL. My comment quoted the relevant text at the beginning of that section. Your reply ignores what I said. Try re-reading my comment, but more slowly.
(2) “It’s a qualifier that they felt they needed to add to the statement. Yet you omitted it.”
More weirdness. The NOAA statement was 4,977 words. I included 603 in a ~2800 word post (which is 3x the ideal length, in my experience). Lots that the NOAA authors thought important wasn’t included. I provided the link for those that want to read the full article.
(3) “That is science connecting them to climate change. ”
That is another failure of your reading comprehension. A discussion of two past hurricanes is different than a discussion of future hurricanes.
So no evidence of an effect and any effect may be undetectable. And models say it’s possible things may change in a few decades.
How does that show that these two hurricanes have anything to do with climate change? In actual science, not sophistry?
From the NOAA (via the Curry link) Anthropogenic warming by the end of the 21st century will likely cause tropical cyclones to have substantially higher rainfall rates than present-day ones, with a model-projected increase of about 10-15% for rainfall rates averaged within about 100 km of the storm center.
Like the storm intensity projections, that is in 100 years time using models that hindcast poorly with a temperature input of 3-4°C higher SST that comes from models that overestimate warming. The 15% more rain roughly translates to 7% higher floods and yet the floods from Harvey wouldn’t have occurred if there was no climate denial.
A bit of a stretch.
When publishing dire predictions, should not the authors indicate if they used IPCC AR5 RCP 8.5 or not? Any modelturbation using RCP 8.5 is pure fantasy.
Dave,
That’s an important point! Journalists in the past reported studies but almost never mentioned which scenario used — other than saying it was a “business as usual” one (the typical falsehood about RCP8.5). Recently they do this better, following the change in climate research — which now less often focuses only on RCP8.5 and seldom describes is as “biz as usual.”
For more about this evolution see Manufacturing climate nightmares: misusing science to create horrific predictions. It briefly describes RCP8.5, the origin of the “business as usual” falsehood, the many exaggerations in the peer-reviewed literature and news media. and the slow (as yet partial) return to sanity.
I’m wondering if the references to the Mexico earthquake is a sort of tag.
Floods, and droughts, and earthquakes, oh my!
1) it’s undeniable that sea level rise
affects storm surge height
2) SSTs feed hurricanes. higher SSTs
are more food. global warming has
created higher SSTs
3) ACE is the worst hurricane metric
ever proposed – it does not take
into account hurricane size
1) What higher SSTs?
2) What feeds hurricanes is the difference between SSTs and air temperature, among other factors. That’s why hurricanes are more frequent and stronger during colder intervals.
Tropical SSTs are always above the threshold to form hurricanes. When tropical air is warmer, there is less differential upon which to generate cyclones. When it is cooler, hurricanes will form more often and grow stronger. That’s why they typically form at night.
The LIA was much stormier than now. NOAA says that Atlantic hurricanes were two to three times as common c. 1715 as now.
these higher SSTs:
http://www.metoffice.gov.uk/hadobs/hadsst3/data/HadSST.3.1.1.0/diagnostics/HadSST.3.1.1.0_monthly_globe_ts.txt
and that’s only the global avg,
not just the tropics.
Sixto claimed “”The LIA was much stormier than now.””
what is your
data on that?
Dates for the LIA vary, depending upon whether you attach the Wolf Minimum to the MWP or LIA. But roughly AD 1300 or 1400 to 1850.
Regardless of in which period you place the 14th century, climate was on average deteriorating from its MWP optimum during that interval, the worst in recorded history. It began with the Great Famine, went on to the Hundred Years War, interrupted only by the Black Death.
Crack(pot), the Average global SST has no relationship to the eastern Atlantic ACE, or the dust which blows off Africa to form tropical storms. You are obviously a parishioner of the Model fellowship of Mann, Church of Omnipotent Greenhouse in Carbon.
there’s no reason to think SSTs should be
proportional to
ACE,
since the latter does not measure
hurricane energy.
Duh.
Are you implying that Man is responsible for even the “rise” alarmist claim?
Duh.
Are you implying that Man-made forces, and not natural forces, are at work?
“Mann et al” has made them seem bigger than nature?
I’ll give you that.
of course humans are
responsible for modern
sea level rise. there is
no scientific doubt
about that.
Crackers,
Wrong. There is not the least scientific evidence whatsoever that humans are responsible for sea level rise.
The rate of rise hasn’t changed since the depths of the LIA. Indeed, lately it has slowed.
It’s all natural. There is no human signal at all.
Sure crackers.
Even alarmist activists know enough to push acceleration in rise over time as evidence, not sea level rise itself. Is crackers short for Crackerbox, the source of your science degree?
Cracker, I would like to introduce you to Joe Bastardi at weatherbell.com if you would allow some perspective to your hurricane opinions. MSLP differences over land and TPW in the atmosphere have just as much influence over the path and strength of a tropical cyclone as SSTs, if not more.
i knew well of Bastardi. he’s not
impressive at all. he makes major
scientific errors all the time.
he should have
stuck to wrestling.
Please explain, from your personal store of great expertise, where and how precisely the expert Bastardi went wrong. Thanks.
bastardi claimed on fox that co2 wasn’t a
well-mixed gas. totally wrong
Careful, that might not be programed into this bot.
Please show what Bastardi actually said.
CO2 in fact isn’t as well mixed as some claim. What does “well mixed” mean?
Clearly, it doesn’t condense out as readily as water.
Cracker 345
Let’s go over basic atmospheric physics. Climate isn’t actually, technically, changing.
You see there is an important international physical and regulatory standard dealing with your claim. It’s called the International Standard Atmosphere and it quantifies the atmosphere’s mass-energy relationships in detail, and asserts, as international regulatory standard,
That those parameters haven’t changed since the Standard was painstakingly established many years ago.
A place you can learn more about the complete fabrication of 20th and 21st century warming is Tony Heller’s place, where he shows you in flashing .GIFs,
how government employees are systematically cooling the past before 1940, warming the past up to present, and doing it over & over, increasing the fraud each time they do another scam ‘revision.’
https://realclimatescience.com/alterations-to-climate-data/
Enjoy.
SSTs feed hurricanes. higher SSTs
are more food.
That is not physics even back in Fourier’s time. SST temperatures are 300K with enough heat energy to make a Cat 1000 storm if it were simply about feeding a hungry beast.
Global warming has not created higher SST. Greater SST is global warming.
Makes your opinion on ACE worthless.
Last time I checked, we all live on the same planet.
Many in the US have enjoyed a 12 year long pause in experiencing a major hurricane. (It must be remembered that those over 12 might not have been in the area the last one hit. For them the pause in actually experiencing one could be much longer.)
A return to what their parents or grandparents experienced is NOT, in any way, “CLIMATE CHANGE” that a windmill or a solar or driving a Prius would have stopped.
It’s natural.
That’s in regards to hurricanes and storms (winter or summer) in general.
Wildfires?
Always have happened.
(There are plants that depend on fire to “crack” their shell so the seed can propagate.)
Has what Man has done made them worse?
Seems like it.
But that is hardly due to Man’s failure to manage CO2, More likely due to Man’s attempts to manage forest and suburban brush because it might be some critters habitat.
Regulation overreach.
A colder world is a stormier world. ?quality=80
We in the Current Warm Period, ie the past ~160 years, have been blessed with clement weather.
Humanity suffered terrible storms, wars, famine and pestilence during the Little Ice Age and prior cooling phase of the balmy, bountiful Medieval Warm Period. Only fools want a colder world.
A return to Mesozoic warmth would be paradise. There is a reason why plants grew so lushly and animals so gigantic during the ice-free Cretaceous Period. Warmth means more CO2, which means more vegetation, which means bigger animals.
The temperature differential between tropics and poles is much greater during maximum glaciation.
During the last glacial maximum, the tropics were slightly cooler, maybe 2 kelvins. Temperate latitudes maybe 5 kelvins cooler. Poles are 10 kelvins cooler than today.
The greater temperature differential makes the meridional circulation much more powerful, so stronger winds.
https://en.wikipedia.org/wiki/Meridional_flow
g din: what of the record
setting typhoons in the pacific
over this last several years?
What records?
The record typhoon remains Tip, of 1979. Do you consider that recent?
But of course there were worse in previous centuries. We just lack good data on them.
Now Sixto, you must remember that the media has disqualified previous data and each storm is now a record setter, just as each El Nino sets record global temperatures. Get with the progressive unity, man.
Pop,
I’m too old to join the Borg at this late date.
Sorry.
By the way
crackers the parrot
does your keyboard
have a carriage
return malfunction?
‘Twould appear so.
Makes inquiring minds go, Hmmmm?
Perhaps a clue – to alert one’s perspicacity.
Nah, he’s just using a 40 point font on a 640×480 screen in windows XP.
Haiyan (2013), > 6000 dead.
since 1970, trend in WPAC ACE = +6 per dec
Okay crackerbot, now show the percentage of that which humans caused.
Crackers,
https://en.wikipedia.org/wiki/1881_Haiphong_typhoon
Climate means decades, centuries, millennia and longer time periods.
6to: logical error
a stronger typhoon in the past does not
mean agw isn’t increasing storm strength
today.
this should be obvious
to you.
6to – you’re basing that 1881 storm on deaths??
you really are confused.
ps – where is all the data i keep
asking for? you never provide, despite
making all kinds of wild claims
Your comment was based on deaths. I showed you how preposterous that was as a metric.
I’m still waiting for a single actual source from you supporting the laughable contention that “AGW” has had any affect whatsoever on hurricanes, or how it even could, based upon physics.
my comment was based
on wind speed.
just as irma was the strongest
hurricane for ~100 hours ever
seen in the n atlantic
did that just happen by chance?
did Haiyan in 2013?
Hurricane Irma is now the strongest hurricane ever recorded in the Atlantic
9/6/17
https://qz.com/1070803/hurricane-irma-is-now-the-strongest-hurricane-ever-recorded-in-the-atlantic/
“At the same time, the JTWC estimated the system’s one-minute sustained winds to 315 km/h (195 mph), unofficially making Haiyan the strongest tropical cyclone ever observed based on wind speed, a record which would then be surpassed by Hurricane Patricia in 2015 at 345 km/h (215 mph)”
https://en.wikipedia.org/wiki/Typhoon_Haiyan
“crackers345 September 15, 2017 at 9:31 pm”
Quoting Wikipedia, priceless!
I see CNN has joined the chorus http://edition.cnn.com/2017/09/15/us/climate-change-hurricanes-harvey-and-irma/index.html including a very curious metric for extreme precipitation based on Kunkel et al 2013 that is designed to exaggerate the recent increases (and Kunkel et al didn’t use it). They say: “For extreme precipitation, there is strong evidence for a nationally averaged upward trend in the frequency and intensity of events. The causes of the observed trends have not been determined with certainty, although there is evidence that increasing atmospheric water vapor may be one factor. “
I think that Nobel laureates, like Paul Krugman and Joseph E. Stiglitz, should refrain from making statements without a traceable and verifiable account. They should know that every statement they make without a sound argument and/or a traceable account, is an attempt to use their authority for political influence.
That reminds about the embarrassing failure with The Maineau Declaration for climate protection:
https://wattsupwiththat.com/2015/07/03/oddly-nobel-prize-winner-michael-mann-was-not-invited-to-sign-the-mainau-declaration-for-climate-protection/
That attempt clearly singled out the noble scientists among the Nobel laurates. (The noble scientists was on the long list of Nobel laureates that did not sign the declaration):
https://wattsupwiththat.com/2015/07/03/oddly-nobel-prize-winner-michael-mann-was-not-invited-to-sign-the-mainau-declaration-for-climate-protection/#comment-1978750
just prove krugman or
steiglitz wrong
i note that you didn’t
even try
As you’ve been showed repeatedly, both NOAA and the IPCC disagree with their baseless assertions.
The point is that their statements were unsubstantiated. They did not prove themselves right.
Cracker,
“i note that you didn’t even try”
You must not have read the post. Try again, more slowly.
As Sixto said, the NOAA statement pretty clearly disagrees with them. As Science-or-Fiction said, they “didn’t even try”. So your statement is correct, but applies to Steiglitz and Krugman — not me.
Easy crackers, they are economists not scientists. They are no more qualified to offer informed opinion than you.
Why would two economists have more to say about science than the butcher, the baker and the candlestick maker? Why don’t you throw in Leonardo di Caprio to bolster your statement.
economics has a lot to say…. how about addressing
that, instead of using excuses to dismiss
them unthinkingly
Crackers,
“economics has a lot to say…. how about addressing that,”
What an odd comment. I addressed what they said that was relevant to this post.
Cracker 345 The scientific hicks you mentioned think it’s possible to mix insulation into the bath conduction chilling a light-warmed rock
and have that activity make instruments detect and depict more light reaching and warming the rock
as the light refractive insulation makes less and less light reach the rock.
You say you think that’s real, too.
It’s ludicrous fraud a child can see is in violation of Conservation of Energy.
You can’t.
Those men can’t.
That’s the end of the road for their, & your credibility.
You can see how easy it is, to parse and determine real or not.
It’s not, and your own reputation is the result of your claim to have become convinced it could be.
I’ll be expecting you to show how your church’s K00K teachings don’t violate Conservation of Energy.
Thanks
In his opinion piece Republicans’ Climate Change Denial Denial, Paul Krugman commit no less than 20 logical fallacies in the first 11 sentences. (Identified in ( this comment.) Ok that it was an opinion piece – but anyhow that is a pretty impressive achievement.
In Zoning: Both Sides Get It Wrong referred to in this post he didn´t even commit a logical fallacy, he just made an unsubstantiated statement: «Climate change definitely made such an event more likely».
He seems to have liberated himself from sound logic and scientific principles. That tells a lot about ´The conscience of a liberal´ – that is the name of his opinion pages at NYT.
“They should know that every statement they make without a sound argument and/or a traceable account, is an attempt to use their authority for political influence.“
Yes and isn’t that *exactly why* they make the statement(s) in the first place? They’re liberals, disciples of Statist liberalism.
Imagine that. Reading the science rather than reacting to newspaper articles about the science.
We are ill prepared for the storms of the past. The best science suggests a small increase in the strongest storms.but this is really beside the point. The point is prepare for cat 5. Whether or not the predicted small increase occurs..prepare for cat 5 and don’t burden others with your risky decision to live in the path of destruction.
Steven,
If you comment about this isn’t famous, it’s not for my lack of trying. It is imo the most important observation about the climate wars — and America’s dysfunctional policy about climate change.
The best science predicts no such thing.
Prepare for future hurricanes based upon past hurricanes. There is no difference, except that if the world does indeed warm, then hurricanes will be less frequent and less strong.
“The point is prepare for cat 5. Whether or not the predicted small increase occurs..prepare for cat 5 and don’t burden others with your risky decision to live in the path of destruction.”
Wise…
MOSHER The “best science” hasn’t yet measured a small change in anything yet (tell me what is it? ) . The UN (pushed by Maurice Strong) started the whole exercise with the given that CO2 produced by mankind was going to devastate the planet, so get out there and quantify this wanton behavior. There’ll be lots of cash paid for this work, you will meet in exotic locales and have rockstar fame.
You know well that it was sceptics that forced attention on natural variation, long, multidecadal, and shorter (eg:ocean oscillations) that was considered to be small and and self cancelling until a decade ago. The over estimation of warming confirmed this and a two decade hiatus had to be finally discussed. That accepting it meant accepting a more modest role for CO2 (tepid warming at worst – your own position I recall before you got on the payroll). A clear 60-70year oscillation in the records (at least there used to be! ) and a hiatus right on time made the 20year warming that all the fuss was about clearly the bigger part of that warming.
Jiggering the hiatus out of existence was the only way to save the simple global warming formula that began life chiseled in stone by the IPCC. The one that was to put the West side Highway under water by 2000 (recently ‘corrected to 2020) Thankfully, a new wave of scientists seem to have begun,painfully slowly the task of righting the ship and the hiatus (which is showing signs of re-establishing ulitself) has been reinstated.
If a science can’t see’ teaching’ moments when things go on unexpected paths, it’s not science. Certainly changing data constantly, especially in the past(!) in order to preserve the status quo, failing idea is by definition not science at all. Mark Steyn remarked during his Senate Committee hearing to the effect, how can we be so certain about what the temperature will be in 2100, when we have no idea what it WILL be in 1950.
Thoughtful sceptics are owed a massive debt by the world for battling tooth and nail on their behalf against the terrible future that was being planned for them by elite global governance types. Sceptics’ huge contribution to climate science and, indeed all science, is the way ‘best science’ is done.
“Certainly changing data constantly, especially in the past(!) in order to preserve the status quo”
Steven Mosher has had first hand experience with the data manipulation by NASA’s GISS:
“…
NOW, when I go back to replicate those early studies the data is SERIOUSLY FUBAR AND DIFFERENT! …
You thought it was 13C on August 1, 1967. Well, today, we changed our minds. It was 13.2C. errrr… wait… it was 13.6C… errr wait, it was 12.9C.
WHAT YOU SEE IS HISTORICAL REVISIONISM BEFORE YOUR VERY EYES.
Anyways, I went back to check my work, from brick # one. Same sites. same url… . Some data files have been seriously corrupted….”
http://wattsupwiththat.com/2007/09/17/raising-walhalla/#comment-1638
Reblogged this on gottadobetterthanthis and commented:
~
If one is going to pretend that natural disasters, especially earthquakes, are divine retribution, shouldn’t one consider the sin supposedly responsible? Specifically, is divine retribution more likely because we heat our homes and drive a little slightly bigger vehicle than we need, or is it more likely the result of selfishness and lasciviousness?
Consider some stereotypical jet-setting movie star. If he incurs divine retribution, is it more likely due to his use of his private jet, or is it more likely his devilish personal life and debaucheries?
I think it is silly to suppose God punishes us for our weaknesses, no matter what those are, but we obviously will reap what we sow. I don’t see burning that extra gallon of petrol as sowing the wind. We have significantly bigger problems both now and in the future.
Readily available and affordable fuel and electricity are what lifts the enslaved and impoverished to productive, fruitful lives. Those who condemn fossil fuel ultimately condemn the poor.
The connection between wildfires and fossil fuels is so distant and obscure that I cant believe anyone is even having the discussion
FFs -> droughts (like OR) -> bigger fires
So which is it? Droughts because of fossil fuels or floods?
An hypothesis which explains everything explains nothing.
There is no evidence whatsoever that fossil fuels have any effect on either drought or flood.
Bigger fires usually happen on lands that have not been properly logged out and the brush minimized, just like things such as Pine bark beetles. Fire is a necessary part of natural forestation.
you mean the pine beetle who now
reproduce
twice a year
instead of once a year, because of
global warming?
forests don’t need “cleaned out.” they
evolved to thrive just the way they
naturally are, with brush and detritus
falling onto the forest floor, decaying
to make humus.
leave them alone. they don’t need
machines crawling around all over their
base
“crackers345 September 15, 2017 at 8:24 pm
FFs -> droughts (like OR) -> bigger fires”
Utter drivel. There is no link between FF use and forest fires. There is a link in a drop in forest fuel load management (Or mismanagement rather) and an increase in bigger fires. Of course several fires here in New South Wales in Australia were started by man and fossil fuel use. He was found by police with a lighter.
pat – there is a link.
i just gave it.
read again
Crackers,
Clearly, you know absolutely nothing about the life cycle of pine bark beetles.
Who feeds you the utter garbage lies which you so happily regurgitate without doing the least little bit of fact checking.
Yikes, crackers, do you think there were no forest fires before nasty mankind interfered with nature?
“crackers345 September 15, 2017 at 9:10 pm
pat – there is a link.”
You haven’t a clue what you are talking about. You clearly are crackers!
Crackers345, where is the empirical evidence that use of fossil fuels results in more droughts?
If you are looking for “information” try:
Green Growth Knowledge Platform (GGKP), Geneva, Switzerland, A UNEP member organization.
North America:
http://www.greengrowthknowledge.org/region/north-america
Has pages of articles relating to “green growth”, sustainability, climate change and the economy.
North America includes Canada and the U.S.
Geneva Environment Network, Geneva, Switzerland
Green Growth Knowledge Platform, Geneva, Switzerland
Includes description of GGKP and link to GGKP website.
http://www.environmenthouse.ch/?q=en/green_guide/green-growth-knowledge-platform
PopP – the IPCC 5AR says there is
no evidence of increasing droughts
since 1970 (WG1 TFE.1 p44)
but global warming always makes
existing droughts worse, because it
increases evaporation rates
(exponentially)
“crackers345”
Do I hear chain’s being pulled in the background?
sy i don’t know what
you mean…
…but are you seriously
claiming that warmer
temperatures
do not increase evaporation??
“sy i don’t know what you mean…”
Hmmm…
“…but are you seriously
claiming that warmer
temperatures
do not increase evaporation??
I’m seriously *wondering* if you are pulling a plethora of chains shackled about the ankles of unsuspecting folk…
Storms are not caused by absolute temperatures, but by temperature differentials. We have been at the peak of the ~65 year cycle for the past dozen or so years, so temperatures have been relatively stable (remember your first year calculus – the rate of change goes to zero at the peak).
It is no coincidence that storm activity is picking up now that we are heading into the La Nina that will augur in the declining phase of that cycle. The years ahead will see accelerated storm activity, and the usual suspects will try mightily to pin it on AGW. Unfortunately for them, global temperatures will be seen to be falling, unless they come up with even more fantastical methods of cooking the books than they have yet assayed.
It’s just amazing to hear and read people discuss the climate science with regards to heavier rains.
Many on one side are convinced that human caused climate change is causing widespread catastrophic flooding, some even believe that many of the events themselves would not even have occurred if not for climate change.
At the other (less) extreme, we have a group that doesn’t think increasing the global atmospheric temperature 1 deg. C and its ability to hold 4% more moisture is a factor and that more global warming will not add to that effect.
40 years ago, climate scientists could have just stated facts or provided explanations based on meteorological principles or the laws of physics.
Not today though. Most people are on one side or the other(lopsided numbers to one side). They are all in for proving their side is right……..or mostly convinced that it was already proven over 10 years ago, when the climate science, somehow was settled.
What was settled? Almost all the global climate models that use the equations to represent the speculative theory have been too warm.
On the other hand, climate and other models can be good tools when used realistically.
There are many good things and bad things about global warming. For most life, modest, realistic warming would be better than cooling. For human life living along the sea coast, warming is bad and could be real bad, worst case scenario. Sea levels “should” accelerate a bit higher if global temperature keep rising.
Some hurricanes “should” be a bit wetter and a bit stronger.
But the potentially real bad scenario is unfolding so slowly right now, that it’s not even distinguishable from the noise of random variation related to weather that has always happened before……..with the exception of an increase in some high end flooding events(in my opinion but again, the atmosphere holds 4% more moisture, not 40% more).
No land falling major hurricanes for 12 years is a stat that I read alot about from one side but the reality is that was a natural and statistical fluke and not representative of the reality of the realm of global hurricanes………but still fun to point out to one side that was waiting and waiting and waiting and waiting for the next major hurricane to hit.
The other side is sickening the way it uses every extreme weather event to play up and sensationalize man made climate change. We all knew that a Harvey and Irma were coming and the reaction was predictable. The 2012 Cornbelt drought, after 24 straight years without a widespread drought, a new record got the same treatment.
Super Duper unprecendented Mega Monster FrankenStorm Sandy too.
Hurricane Hazel, a cat. 4 hurricane did a similar thing in 1954(phased with a -NAO cold pattern upper level trough in southeast Canada). 1954 also featured 3 major hurricanes in 3 months to clobber the East Coast-during global cooling.
These people don’t even realize that the synoptic weather pattern that caused Sandy was a cold weather pattern in late October.
Take out the -NAO, cold upper level trough and Sandy isn’t anything special.
The unprecedented California drought that was more likely ended by global warming than caused by it. Forget the fact that California will probably be wetter with global warming and that they’ve had droughts lasting decades in the last 2,000 years, even one that lasted for 200 years.
When we had the extreme cold in the US 3 Winters ago, even that was caused by global warming.
http://www.motherjones.com/politics/2014/01/john-holdren-video-polar-vortex/
“A growing body of evidence suggests that the kind of extreme cold being experienced by much of the United States as we speak is a pattern that we can expect to see with increasing frequency as global warming continues,”
Though I understand the speculative theory behind this(and am don’t completely reject it), this also happened in the mid/late 1970’s numerous times and also prior to that.
Can’t we have any extreme weather that isn’t being caused by global warming/climate change?
Funny thing is that when you decrease the meridional temperature gradient with global warming(more at the higher latitudes), the atmosphere doesn’t need to work as hard to balance the heat disparity and some extreme weather decreases…….jet streams, cold fronts, violent tornadoes, for instance.
The objective is to link every single extreme weather episode to human caused climate change.
Not having extreme, record breaking weather occurring every year, in numerous places on this planet would be more extraordinary than the expected extreme weather that we’ve been having.
Earthquakes?? …. how in the heck do these idiots associate earthquakes to greenhouse gasses.
Gas and earthquakes both come from cracks?
In our bedroom they do.
“In our bedroom they do.”
This was…uncalled for…
It’s a common problem with people who believe what is broadcast in the MSM. I had a discussion with someone in New Zealand some years ago about an earthquake swarm that struck Wellington. He was adamant that the swarm was caused by climate change driven by emissions of CO2. Of course he could not be convinced that the swarm was entirely due to the fact Wellington sits on top of a very active fault.
>> It’s a common problem with people
who believe what is broadcast in the MSM. <<
how would you
know?
“crackers345 September 15, 2017 at 9:33 pm
>> It’s a common problem with people
who believe what is broadcast in the MSM. <<
how would you
know?"
Because I know most people are too lazy to go study relevant sciences (They are complex and heavy subjects) and prefer the quick grab of 20 or so word soundbites.
Logical fallacies
Statistics
Accounting
Without an understanding of (at least) these three subjects, you’re doomed to be a moron.
Max,
You get bonus points for commenting in haiku-form. Zero points for intelligibility. Are you attempting to communicate something?
What if I claim to have an understanding of logical fallacies but then deploy them in my arguments?
For example, if I claim to understand the ad hominem logical fallacy, but then argue that anyone who doesn’t understand logical fallacies is a “moron”…
;-p
Sy,
That would make you a very skilled commenter — a-plus league. But use your gift carefully, lest you become a troll. Much like in the TV show “Smallville”, people who get superpowers usually become supervillains (at least in the first season, all I watched).
My humble thanks for the advice/warning. I believe you.
I tried very hard not to do it but alas, I lost the argument. I may be “doomed”.
Your best Larry. But did you notice that this “big hammer” and lack of humility of experts analogy is a suit perfectly cut to fit the CAGW crowd? Your earlier offerings were that proponents and sceptics had to come together and eschew their politically motivated positions about global warming.
Re hurricanes/flooding and draconian measures to fix things, there is no hammer big enough, and in the Climateering field, they have yet to produce a the nail, but they are proposing a hammer for which the nail is humankind.
Kudos for coming around to what is really happening, though.
Gary,
It’s all politics of the worst kind: factionalism run riot. That was the great fear of the Founders.
Regarding wildfires, we had a wet spring on the west coast with lots of grass growing taller than I can remember (since 1985 when I came to the US), some of the grass (cheatgrass) is from an invasive non-native spicies. When I noticed that this spring, I assumed that we will lots of wild fires this summer. Then fire prevention left our forests with lots of underwood fuel that accumulated over decades. I am not surprised.
Stephan,
In my 15 years leading Boy Scouts on treks thru the western forests, it was obvious that many of them are destined for inevitable intense fires. Overgrown dense trees, lots of dead wood on the ground,etc.
Afterwards we can have rational forest management policies. But the rebalancing to get there will be severe.
… that we will have lots …
Maybe I’m missing something from the tweets, but…what in the Hell, Michigan does an earthquake have to do with climate change?
Are these alarmists really so desperate?
Solar activity is still high. Another strong geomagnetic storm.
http://images.tinypic.pl/i/00933/4w5jcyxaqlkp.png
Circulation will remain favorable for the development of hurricanes (jetstream).
‘In the 20th century forests were managed by Smokey the Bear — “only you can prevent forest fires” — in the mistaken belief that forest fires must be prevented. This made the western US forests into tinderboxes. The Left blames the resulting massive fires on climate change …’.
===============================================
There has been an impressive and undeniable drop in the US wildfire trend over the past century:
http://www.fao.org/docrep/010/ai412e/ai412e09.jpg
Source: U.S. Wildfire Statistics, USDA/Forest Service.
Chris,
That is a great graph! Thank you for posting it. I’ll bet that in 50 years we see that line rise retrace much of its decline.
I believe the source of the graph is DOE’s Carbon Dioxide Information Center, destroyed as part of Team Trump’s science purge. Hopefully it will surface at the replace Berkeley National Lab website.
To see that graph updated thru 2010 — showing the rise in fires — read “Human Activity, more so than Climate Change, Affects the Number and Size of Wildfires” — Testimony of David B. South (Professor Emeritus of Forestry, Auburn U) before the Senate Subcommittee on Green Jobs and the New Economy, 3 June 2014. It has a wealth of information and useful graphs.
Why do you query the source of the graph?
The source is clearly shown and comes from a document of the UN Food and Agricultural Organization;
http://www.fao.org/docrep/010/ai412e/AI412E06.htm
Gratuitously dragging Trump into the discussion is just political opportunism.
Here is another graph which is more up-to-date:
Evidence-free prognostication about future trends is stupid.
Chris,
(1) “Why do you query the source of the graph?”
Sources of one useful piece of information usually have more useful info.
(2) “The source is clearly shown”
In the 21st C a “source” is where I can go to see it. Note that most people commenting here give URs for the info they cite, and are asked for sources when they don’t.
(3) “Gratuitously dragging Trump into the discussion is just political opportunism.”
Nope. Taking down the CDIC website is a political act, and a dumb one. It had a lot of useful info. Hopefully the replacement by the Berkeley Natl Lab will be as good.
(4) “Evidence-free prognostication about future trends is stupid.”
Nope. Fires were kept low by a massive effort by US governments and private landowners. That policy is changing as its folly has become apparent — along with the impossibility of continuing it. Which means that fires will increase — then return to some sort of equilibrium level once massive fires eliminate the tinderboxes that have accumulated.
The article you cite, “RE-INVENTING THE UNITED STATES FOREST SERVICE” (2008) briefly discusses this..
http://www.fao.org/docrep/010/ai412e/AI412E06.htm
(5) “Here is another graph which is more up-to-date:”
That’s great! Where did you get it?
All this effort ‘proving’ these storms are not to do with climate change smacks a little of desperation to me..
Skepticism has been on the back foot since the pause evaporated and the RSS temp series backed a warming earth…
Of course there was an effect on the severity of these storms due to warming. A hurricane needs heat…
These were exactly as predicted by the science (no amount of downplaying Irma using the figures as it hit the US can hide its original intensity)
And the science says they’ll be more as intense and sea level rise will make it worse. Time to do some infrastructure change and planning.
Which simply have not happened since those predictions were made.
Griff,
“All this effort ‘proving’ these storms are not to do with climate change smacks a little of desperation to me..”
To me, too. Activists know that a big bout of extreme weather — no matter if just a repeat of the past — might panic the American public into supporting their agenda, and that this is probably only their only chance for success in the near future (i.e., for them personally).
A few useful snippets:

North Atlantic SST, no change in SST for the last 20 years, ie., from 1997 to end of 2016.
South Atlantic, no change in SST for the last 30 years, ie., from1987 to end of 2016.
Not only has there been no recent warming of SST, it appears that the North Atlantic is in now in a cooling phase, and there has been a substantial drop in the ocean heat content (0 to 700n OHC), see the recent paper: Duchez et al paper.
http://notrickszone.com/wp-content/uploads/2017/09/Holocene-Cooling-North-Atlantic-Duchez-2016.jpg
You will note the large drop in heat content of around 3.5degC (NODC measurements) and about 2.5 degC (ARGO measurements) these past 10 years between 2006 and 2016.
Hurricanes do not normally form in the US Gulf, but rather out in the Atlantic, and you will see from the above, there has been no warming for at least 20 years, ie during a time when about 30% of all manmade CO2 emissions have taken place, and if you consider the Southern Atlantic some 30 years during which time some 40% of all manmade CIO2 emissions have taken place.
Dr Judith Curry carried an article (8th September) on Hurricane Irma, and she notes that it was not due to some particularly warm SST.
It is well worth having a read of her article.
The amount of hurricanes depends more on the circulation in the Atlantic than on the ocean surface temperature on the equator.
https://weather.gc.ca/saisons/animation_e.html?id=month&bc=sea
Particularly the development of hurricanes depends on latitudial jetstream.
http://tropic.ssec.wisc.edu/real-time/mtpw2/product.php?color_type=tpw_nrl_colors&prod=natl×pan=24hrs&anim=html5
One can expect another hurricane in the Caribbean. Jose will be very close to New York.
Here is the classic MSM commentary/ editorial from WCVB, Boston, that aired this morning.
http://www.wcvb.com/editorials
Recall the headlines about the increase in earthquakes? Closer examination was due to “primarily due to changes in observational technology at the various warning centers” as well. I.E., the increase appeared after more sensitive seismographs were installed.
I see some easy money that’s been left on the table in this article. What is the supposed connection between climate change and the Mexican earthquake?? Of course, co2 does cause everything.
That would be easy rhetorical money
Much of the problem is poor town planning. In the UK they build on flood plains, and then shout ‘climate change’ when the houses get flooded. Then they intone that “Tewksbury was flooded for the first time in centuries” – ‘climate change’. Yeah, but all the new housing on flood plains prevent the rains from spreading, and push the flood-peak downstream to previously higher ground.
I see the same in the US. The flooded houses are in a hurricane zone, and should all be on stilts. Or build low-rise flats, for a greater population density and a lesser need for roads, service pipes and cables, and cars. And if everything was built from reinforced concrete, nothing would fall down and add to the flying debris that destroys other buildings.
If adequately planned for, a hurricane landfall should be a minor inconvenience – a day indoors watching crrappy daytime television.
R
Town planners these days use…computer models! GIGO!
Yup. When I moved to live in Charleston SC, I was impressed with the Bank of America opposite my place of work.
It looked like something that was built post Hurricane Hugo. The architecture was solid neo-stalinist style concrete, where you had to go up the stairs or elevator to see any banking action. Nearby streets frequently flood at high-tide and they clearly weren’t going to take any silly risks. I’ll skate over their financial performances.
I assume you didn’t even bother to refute the “earthquakes” claims because … well they are simply crazy claims to make … no refuting needed …
Kaiser,
Exactly. They were in effect self-refuting demonstrations of ignorant hysteria. Fun to read, however.
What? Since when climate change caused more earthquakes to happen? Next they probably claim that volcanic eruptions and asteroid impacts are caused by climate change. And obviously these things never happened before. Earth was a paradise with no natural disasters, and no animal deaths at all, until evil humans fell from the sky and ruined everything. And of course, the more smarter alarmists never admit that this has turned into a religion. In my country, the biggest “science” magazine put “climate change denial” next to flat-Earthers, arrogantly claimed that no “proper” scientist would ever question climate change and the “dramatic” effect it will have in the future, and that it’s the “deniers” who are blinded by their emotions. But of course you can’t say anything because it’s not “politically correct”.
Or, if the above is giving you a headache, try this nostrum: “La Nina during hurricane season, batten down the hatches.”
http://notrickszone.com/2017/09/16/analysis-by-german-scientists-concerning-hurricane-causes-more-propaganda-than-science/#sthash.BnXfpY3a.dpbs
I Joe Bastardi and the guys at Weatherbell are correct what is now Tropical depression #15 will be another storm to watch. Come late next week it will probably be in the general news as another hurricane (possibly a major) that is a threatening landfall on the US.
In two days, the hurricane will reach the Lesser Antilles. Would presumably reach over the Caribbean Sea and threaten Puerto Rico and Haiti.
I am late to this party, so forgive me if this has been covered.
First of all…great article. Of course, I want to talk about the thing that bothered me:
“But the Left immediately boldly and confidently declared Harvey and Irma to be caused (or worsened) by anthropogenic climate change. SOME OF THESE SCREEDS ARE MOSTLY RATIONAL (emphasis added), just exaggerated or imbalanced. Such as “Harvey Is What Climate Change Looks Like” by Eric Holthaus at Politico — “It’s time to open our eyes and prepare for the world that’s coming.” And “Stop talking right now about the threat of climate change. It’s here; it’s happening” by Bill McKibben at The Guardian — “Hurricane Harvey, Hurricane Irma, flash fires, droughts: all of them tell us one thing – we need to stand up to the fossil fuel industry and fast.”
There is nothing rational in claiming that a 12 year drought in major landfalling hurricanes in the US or the slow decline in global ACE values is ‘just weather’, but two terrible hurricanes in a few weeks is a sure sign of man-made climate change. That’s like trying to prove the curse of Rocky Colavito is real by pointing out that the Cleveland Indians lost last night, but the 22 games in a row they won before that…well that’s just baseball. It’s crazy stupid / or stupid crazy / or both. It doesn’t really matter how rational you are after that, or the tone of voice you use, or what your resume is, or your reputation, or how many titles you have, or Nobel Prizes or anything!
The whole point they are trying to make is irrational. You can dress up an irrational claim all you want. It is no less irrational.
The hurricane is near the Lesser Antilles.
http://www.ssd.noaa.gov/goes/east/tatl/ir4-animated.gif
That new storm is Maria. Katia disintegrated into a tropical storm. Jose is moving up the US’s Atlantic coast.
Keep an eye on the clouds coming off the African coast. That’s where they start.
Here’s a link to Accuweather’s Atlantic storm forecast, from May this year:
https://www.accuweather.com/en/weather-news/2017-atlantic-hurricane-forecast-possible-el-nino-to-limit-development-of-storms/70001271
The forecast was as follows:
10 named storms
5 hurricanes
3 major hurricanes
3 named storms making US landfall
The article specifies that an El Nino forming in the Atlantic could limit storm development. They also named 2016 as the deadliest Atlantic storm season in 10 years.
It would be nice if the howling CAGWers would take some time to review what has happened prior to this year before they crank out their tweets. On the other hand, where else would we find so much inept entertainment?
Look at the temperature of the surface of the tropical Atlantic.
http://files.tinypic.pl/i/00933/gqy6wxrhny6s.png
I have no idea what you’re trying to say. Look at the tropical sea surface temperatures? Katia was a tropical storm in the Gulf of Mexico, only achieving some rotation from Irma’s influence. The rotation quickly faded when Katia went ashore.
Atlantic storms start to form off the coast of Africa. Jose had already formed into a cyclonic storm around the time it left the general area of Cabo Verde. Maria was not far behind, off the coast of Africa as a large clump of clouds, about the same time Irma was at Puerto Rico. Jose is right now east of the North Caroling coast and Maria is hovering over Barbados. There is another large clump of clouds blowing west out of Sierra Leone now, and more coming westward from Sudan. They pick up and drop moisture as they cross the African continent. Those clumps of clouds may be two more storms crossing the Atlantic, as predicted in May 2017.
The temperature is low in addition to the Caribbean Sea.
It’s always amusing to watch AGW denies put out novels of word salad. ..while the ignote the irrefutable facts that the average temperature if the earth is warming…to include the oceans… warmer oceans make bigger hurricanes. ..and all the denier BS in the world won’t change that fact
David,
It would be helpful if you were to state your objections more specifically — rather than as a rant.
” irrefutable facts that the average temperature if the earth is warming”
Video games are binary. The real world is seldom binary. The world has been warming since the early 19th century due to both natural and anthropogenic reasons. The “skeptics” positions concern the degree of human influence on the past (more than 50% since 1950 per AR5) — and more importantly, the timing and magnitude of future warming.
“warmer oceans make bigger hurricanes.”
See the graphs provided in this post. The oceans have warmed since 1970 — with no obvious trend in global storm frequency or energy. The NOAA statement agrees – see section A.
There is debate among climate scientists on the SST – hurricane intensity relationship, but as yet no consensus. So your bold state of fact must be rated “false”.
of course the world is warming – there’s
no need to even waste time arguing that.
hurricane metrics, too. data:
http://www.aoml.noaa.gov/hrd/tcfaq/E11.html
Watching too much hurricane coverage on US TV,
I noticed not one commentator mentioned
no major (Cat. 3, 4 or 5) hurricane made landfall
in the Us (48 states) between 2005 and 2017.
Quite a few commentators mentions two Category 4 hurricanes in one year was a “record”
without mentioning we don’t have many decades of accurate records …
and neglecting to mention cyclones, as if they were not the same thing,
and of course never mentioning there were two or more
Category 5 hurricanes in that hit the Americas (North or South)
in 1932, 1933, 1961, 2005(4) and 2007
source: https://en.wikipedia.org/wiki/List_of_Category_5_Atlantic_hurricanes
Richard,
Great catch on the two Cat 4’s vs. Cat 5’s!
The news media have discovered the benefits of weather porn. It works for national news like auto accidents does for local TV — cheap frequent high-impact stories to fill the space between advertisements.
Of course not. It’s called ‘obfuscation journalism’ lol
It’s amusing to watch Trump be blamed for the hurricanes. Obama was in office for 8 years. Did he fix the climate, and then Trump undid all that in a matter of months, hence the storms?
“Weather event A, B and C occurring, WTF is going on?”
“Earthquake even linked with climate change”
Ignorant people brain washed by propaganda, some pretending they understand scientific issues.