Subtitle: A Bit of Gathering Into Groups Gives Good Results
by: Roger Sowell (1)

Background: Much discussion, and much misinformation, is had over the price of electricity in the US, and many other areas of the world. The discussions sometimes end up as diatribes against renewable energy sources such as wind and solar. The article below is an attempt to begin to bring some facts into the discussion, using actual data from the US Energy Information Agency, the EIA. This is from an article from about a year ago on my main blog, SowellsLawBlog. The take-away points are: 1) there is an almost perfect inverse relationship between price and consumption, and 2) the fact that California prices are below the trend line. That is true even though California has substantial renewable energy statewide, a figure that passed 25 percent in 2015.
Discussion
It is not often that one creates a graph using actual data and discovers an almost perfect linear relationship. It is even more rare to have a software package calculate the least-squares trend line and obtain a correlation coefficient, R-squared, of 0.99 or higher. Yet, that is exactly what occurred for data from calendar year 2014 for US residential annual electricity consumption per customer, and average price per kWh. The graph and simple statistics are shown below, then a discussion. Note the R-squared value of 0.9997, indicating an almost perfect correlation.
 |
| Figure 1. Data from US Energy Information Agency, by state
Shows 39 states, excludes 10 states with lowest prices and Hawaii |
This article follows another SLB article that ascribes the relatively higher price for residential electricity in California compared to the US average to mild climate and large population. (see link to “Why California Electricity Costs More than US Average; Mild Climate and Large Population Contribute to Prices”) Conventional wisdom is very wrong in blaming solar power and wind power for the higher California prices.
With the data ready at hand from US Energy Information Agency files from their website, it was a simple matter to sort the data for each state by annual average residential price in cents/kWh. Being previously aware that low residential prices tend to correspond to high electricity consumption, and vice-versa, inspection of the data for 2014 confirmed that relationship. However, when the data is grouped into quintiles, a convenient grouping as there are 50 US states with ten members in each quintile, an almost perfect straight line resulted, as shown in Figure 1 above. However, there are only four data points in Figure 1. This is discussed below.
The R-squared of 0.9997 resulted when only the four quintiles with highest prices are graphed, that is, the quintile with lowest prices was excluded. Also, Hawaii is excluded as a high-priced outlier. More on that in a moment.
The data for each quintile is shown in table form below.
Quint kWh/y Cents/kWh
1 13,528 9.67
2 12,178 10.78
3 11,445 11.89
4 10,550 13.15
5 7,311 17.58
Next is shown in Figure 2 the graph of all five quintiles for 49 states – Hawaii is excluded as being a-typical and an outlier. This graph has only a slightly lower correlation coefficient, R-squared of 0.9931.
 |
| Figure 2. Showing 49 states (excludes Hawaii) |
The conclusion that can be drawn is that there is indeed a correlation, and a very good correlation, between average price for residential electricity and the quantity of electricity consumed on an annual basis by each utility customer. California is in the fifth quintile for high price but low consumption (16.2 cents/kWh and 6,741 kWh/yr/customer). Other states with California in the fifth quintile are almost all in the North East sector, Massachusetts, Vermont, Rhode Island, New York, Maine, New Jersey, and Connecticut. Example states at the other extreme, in the first quintile are Louisiana, Arkansas, and Oklahoma – all hot, humid, and consuming 14,000 kWh/yr/customer on average, more than double that of California.
In fairness, it should be noted that the high correlation coefficient only results when the quintiles are graphed. For all 49 states individually, again excluding Hawaii as an outlier, a much lower correlation coefficient results, of R-squared 0.546.
The graph shown below as Figure 3 is a repeat of Figure 2 above, with the highest (in red) and lowest (in green) states shown, as their average price’s deviation from the national trend line. California, the green circle at top left, is 2 cents below the trend. Other states substantially below the trend include Maine, Colorado, Illinois, Utah and Montana. Those states with the highest deviation above the trend are Alabama, South Carolina, Tennessee, Mississippi, Connecticut, Louisiana, Maryland, and Texas.
 |
| Figure 3 – Showing individual states
with greatest deviation from trend as colored circles |
Footnotes
(1) Roger Sowell is an attorney in Science and Technology Law. Since earning a BS in Chemical Engineering in 1977, he has performed a great many engineering consulting assignments worldwide for independent and major energy companies, chemical companies, and governments. Cumulative benefits to clients from his consulting advice exceeds US$1.3 billion. Increased revenues to clients are at least five times that amount. He regularly makes public speeches to professional engineering groups and lay audiences. He is a regular speaker on a variety of topics to engineering students at University of California campuses – UCLA and UC-Irvine. He is a founding member of Chemical Engineers for Climate Realism, a “red-team” style think-tank for experienced chemical engineers in Southern California. He is also a Council Member with the Gerson Lehrman Group that provides advice to entities on Wall Street. He publishes SowellsLawBlog; which at present has more than 450 articles on technical and legal topics. His widely-heralded Truth About Nuclear Power series of 30 articles has garnered more than 25,000 views to date. Recently (2016), he was requested to defend climate-change skeptics against an action under the United States RICO statutes.
I think you have the axes reversed. Usage should be a function of price, not vice versa.
And the deviations are in usage, not in price. As you said, the prevailing temperature has a big effect on the usage and explains the deviations from the curve (except for CT which has ridiculously high electric prices). California has lower usage than it’s price would imply because most of the residents live near the coast where the temperature tends to be mild year round.
Let me also add that you should have plotted Hawaii in figure 3 to show just how far off it is.
This is a convention in economics. Demand curves slope downward and to the right.
Except for Lois Vuitton handbags.
Ok, generally, :). Luxury goods, Giffen goods, superior goods all have upwardly sloped demand curves.
Yea, Alfred Marshall put the dependent variable on the wrong axis in Principles of Economics 1890 and it was standardized as convention in every successive econ textbook to date. It was also the first textbook to introduce a formula for price elasticity which the article tries to provide rough evidence close to one for electricity (Price Elasticity is % change Q / % change P). Other estimates have it at 0.2 in short run and 0.7 in long run. Electricity also has a high income elasticity. The price elasticity of coal and natural gas are very high (as expected since lots of substitutes) and very low for fuel oil.
http://energy.ky.gov/Programs/Data%20Analysis%20%20Electricity%20Model/Gatton%20CBER%20Final%20Report%2010302011.pdf
Reverse the X and Y axis as should be. The plot will still go down to the right.
“Usage should be a function of price, not vice versa.”
You are making assumptions about what determines households’ usage. If it’s too cold or too hot, people usually do what they need to survive and manage the budget elsewhere.
Simple economics usually tends to provide better prices when you buy large quantities unless there are mandated penalties to deter consumption.
In this context it seems immaterial which way the graph is plotted.
statistically, the abscissa ( x axis ) should be used for the controlled variable, or the one with least error/uncertainty. Since the price is a known fixed quantity for each state that would put it on the x axis , were it not for the unwarranted “quintile” fiddling which puts uncertainty into each data point since it is now itself a statistic , not a datum.
No, the price-demand curve is always plotted with price on the y-axis & consumption on the x-axis.
More importantly, energy consumption is a nearly completely inelastic curve. People have to heat & cool their homes, no matter the price. Since the curve shows a drop in demand, this strongly suggests that the consumers are switching to alternative sources for power, such as natural gas.
Hot, humid locales are relatively insensitive to price; Momma wants A/C, momma gets A/C. Unmarrieds may not understand such universal facts of life.
Playing with numbers doesn’t change anyone’s mind. Renewables are ridiculously expensive, no matter the rhetorical gymnastics used to posit otherwise.
Correlation vs Causation. Maybe high prices cause low consumption? If so, the greenies might now be saying, “Mission Accomplished”. Is it OK to say that?
I was wondering about the correlation and causation thing too.

What Sowell is saying is that the low average usage per household causes the high prices.
But if that is true, then how does one explain that prices are going down in places like Texas, but going up in California? Shouldn’t the same downward forces that are operative in Texas also be operative in California?
Also, how does one explain that the same phenomenon (lower prices in Texas and higher prices in California) is occurring with industrial power too?
Easy, just “exclude 10 lowest states and Hawaii.” Why would anyone think that throwing away over 20% of your samples would be a problem?
The Law of Supply and Demand: price links the supply – demand relationship. It is a dependent variable. The linear curve shown in the graph ‘proves’ that, as price climbs, demand decreases but that can only happen if other energy sources are available to pick up the slack (and at the a price which can make a profit).
Given a constant demand – ie everyone uses the same amount of energy – increase in the price of electricity will force the use of other energy sources.
Drive by comment:
I’ve only glanced at the article and replies, but I think price per kWH is regulated the public utilities commissions, not competition. If as a general rule they say the more you use the lower the unit price, then over the U.S. you’ll get that downsloping curve. No magic involved.
WA state, where I live, has an average cost of 7.68 cents per kWh due to our massive use of hydroelectric power, a renewable source…we get lots of rain and snow melt.
“…we get lots of rain and snow melt.”
You are obviously NOT speaking of Stevens County, WA. Not a drop since the first week of June!
Correlation using only 39 or 49 states, when splitting them into quintiles, is spurious. That is shown by using no quartile splitting – much lower correlation. And, including Hawaii drives the correlation much lower still. So, arguing which causes which is ridiculous.
I remember in the 60s that the hem-line indicator showed that when women’s hemlines rose, so did the Dow Index, and when hemlines fell, so did the Dow. It may be interesting, but it isn’t worth much, especially when the prices are limited by regulators’ whims and demand is controlled by climate and local poverty/affluence.
Seems to me that this process would also work quite well with a set of random number pairs.
Yup, my thoughts exactly. Elucidates nothing.
This DOES NOT show 39 states, it shows four data points. WUWT ?
Does this mean that it shows 39 states conveniently grouped into four groups which make an convenient straight line to support the headline claim.
This is pure econometric chartism.
So how about you show us what the data ACTUALLY looks like and let us make up our own minds?
The first graph should one with 49 dots !
or rather 50 , there is no excuse to remove the outliers either.
Don’t even seem to find a link to the data. Obfuscation and data mangling worthy of a climatologist.
Torture the data enough and it will confess
Chicken or egg?
It’s notable that the highest usage of electricity is in states that have high temperatures and high humidity in the summer. Air-conditioning is crucial to their citizens well-being and business productivity and it no doubt drives a lot of the consumption. Politically, then, there’s good reason to keep electricity prices as low as possible. So, in that case perhaps, consumption drives price.
AC use is predominantly electric. This is true at all size examples, from the smallest window AC to huge systems that handle climate control in factories and sky scrapers.
Heating on the other hand is more often dominated by natural gas at all but the smallest examples. So while colder climes may show less ELECTRICITY use, that doesn’t necessarily mean less ENERGY use.
Food for thought.
~¿~
Most homes in the US have no access to natural gas.
That is why I have suggested piping gas to every home as a jobs project and money saver.
Any usage of electric for things like heating, hot water, clothes drying and cooking, wastes energy in large amounts.
Bottled propane is substituted in the places with no gas, but it is a poor substitute price-wise.
The poor’s monthly electric bill is still very low compared to that of more voluminous users.
For John Haddock, re August 12, 2017 at 6:06 am
“Chicken or egg?
It’s notable that the highest usage of electricity is in states that have high temperatures and high humidity in the summer. Air-conditioning is crucial to their citizens well-being and business productivity and it no doubt drives a lot of the consumption. Politically, then, there’s good reason to keep electricity prices as low as possible. So, in that case perhaps, consumption drives price.”
The linked article in the main post (http://sowellslawblog.blogspot.com/2016/07/why-california-electricity-costs-more.html) goes into the detail on this.
As some others have noted in these comments, most commodities have a price-consumption trend where low prices stimulate purchases. Electricity in a grid setting is not like that.
Electrical grids are different. This is a very simplified overview of a most complex subject that has 50 variations, state by state.
In general, the electrical utility is highly regulated by government. There are federal and state laws. The electrical grid is charged with always providing safe, reliable, and cost-effective power. Many states now add an environmental requirement, some on the low-carbon bandwagon. Others actually mandate a fuel-diversity requirement. Some outlaw nuclear. Others don’t. (California has some odd rules, perhaps I can get into those as well).
Where the trouble starts is with that “reliable” requirement. In practice, that means that the power must be there all day, every day, including when the demand for electricity is the greatest. In some states, the highest demand is on a hot, humid summer day when air conditioners are running full out. Other states have winter peaking season.
(California is definitely in the summer peaking category. Any day now, we will be setting the peak demand. It is seldom on a weekend, though, but next week is a good candidate.)
The utility must pay for and install adequate resources not only to generate power during the peak demand, but to transmit the power at high voltage, then distribute the power to customers at much lower voltage. Thus, the three categories of utility assets: generation, transmission, and distribution.
For a state like, say Louisiana, or Tennessee, or Alabama, with hot and humid climate nearly year-round, the grid pumps out electricity with less variation in production compared to a dry, mild climate state like California. The utility seeks a rate structure form the governing Utility Commission to pay for all those assets, and the variable cost to run them. Where Louisiana, Tennessee, and Alabama obtain the price per kWh, they don’t need a high number because they sell so much power per month.
In great contrast, a state with low average consumption, like California (but also Maine, Vermont, and Rhode Island), must have a higher price per kWh to pay for all those assets.
That is why, as this post shows clearly, there is a very strong correlation between consumption and price. It has nothing to do with handbags, shoes, or other truly market-competitive products. An electrical grid is in the regulated utility category. Standard economics simply do not apply.
Excerpt from my blog article with link above:
California residential electricity prices are where they are, and where they should be, due to a number of factors. The most important factor is the state has a large population, 38 million people with 15 million residential customers as of 2014, but has very low electricity consumption per customer. The low consumption per customer is due to the mild climate with low humidity. Or, as the EIA states, “In most of the more densely populated areas of the state, the climate is dry and relatively mild. More than two-fifths of state households report that they do not have or do not use air conditioning, and almost one-seventh do not have or do not use space heating. Residential energy use per person in California is lower than in every other state except Hawaii.” Things have changed, but only slightly, since EIA wrote that, as Maine has barely edged out California for second place in residential electricity use per customer (again, excluding Hawaii as an outlier.)
The second important factor, after the mild, dry climate, is the large infrastructure for transmission and distribution that must be built over mountainous areas within the state. In contrast to the nearest state in size and population, Texas, California has many more mountainous areas where transmission and distribution costs are much greater.
Combined, a low per-customer electricity use and large, costly network or grid requires that each kWh sold command a higher price to pay for the grid’s assets. The utilities are allowed approximately 10 percent return on capital employed, so a smaller volume of electricity sold (kWh/mo) must command a higher price (cents per kWh).
Finally, the 16 cents/kWh and 562 kWh/month for California, on average, yields a lower electric bill for the average customer compared to the US average. The average bill for a California customer is only $91 per month, compared to the average for the US at $114 per month.
The 2014 data for all states and DC are shown below, in kWh/month: (Note, US average is 911.3 kWh/month) Again, these are for residential consumption, not industry and not commercial and not transportation)
State kWh/mo
HI 506.4
ME 549.4
CA 561.8 <====
VT 568.5
RI 583.0
NY 591.0
AK 605.1
MA 614.9
NH 619.4
NM 633.4
MI 653.6
NJ 669.7
CO 687.4
WI 694.4
DC 721.5
CT 729.7
IL 745.2
UT 746.7
MN 809.6
MT 853.8
PA 853.9
WY 863.2
IA 891.4
NV 894.2
OH 901.3
US 911.3 <=====
KS 928.0
OR 929.5
DE 949.8
ID 982.1
WA 1,005.5
IN 1,008.6
AZ 1,012.7
NE 1,022.4
MD 1,024.9
SD 1,045.6
FL 1,092.3
MO 1,094.8
NC 1,135.7
OK 1,137.7
AR 1,142.6
GA 1,151.5
WV 1,158.0
TX 1,158.1
VA 1,171.5
KY 1,177.3
SC 1,186.6
ND 1,239.6
MS 1,247.9
AL 1,264.7
TN 1,285.8
LA 1,291.4
Because of politicized green policies, electric prices are higher than would otherwise prevail, no matter their absolute price levels.
If I was paying 17.58¢/kWh, I would use a helluva lot less electricity than I actually use at 11¢/kWh.
That’s the “price mechanism” in the law of supply and demand…
http://www.economicsonline.co.uk/Micro_graphs/Signalling.png
A similar correlation probably exists between per capita electricity generation and price per kWh by State.
I wouldn’t be shocked if there was a strong correlation between automobile model prices and unit sales… And I’d bet that McDonald’s sells more hamburgers than Ruth’s Chris sells steaks.
I don’t doubt that Roger’s correlation has some validity, despite the over-smoothing. He just has the cause and effect reversed.
“the cause and effect reversed”, very good observation, one I did not think of immediately. With lower prices, people will use more, energy intensive businesses will relocate to less expensive jurisdictions, etc. Demand will follow the least expensive supply.
(at first I thought you were comparing burgers vs. steaks to electrons vs. electrons, haha)
Assuming the burgers are all-beef, they’re just different cuts from the same animal.
Ya David, we know you’re just making up all that ‘supply and demand’ nonsense. I mean, if any of that was true then Communism would fail every time it was implemented.
…oh wait.
>¿<
DOH! Was supposed to go on the next chain.
Next time I go to Ruth’s Chris, I’ll ask for a McDonald’s Hamburger. Or when my wife asks if she looks ‘nice’, I’ll say, “it’s like beef, just different cuts from the same animal”.
(Jokes of course)
“Over 100 billion served” vs $53 T-bone steaks (just the steak, the sides are extra).
An extreme, if silly, example of supply & demand.
I don’t have time to examine Roger’s analysis, but here is an alternative hypo.
Natural gas prices in the USA have fallen sharply in the last decade due to improvements in shale fracking technology.
Much of the USA’s power is generated from natural gas.
Ergo, the decline in electricity prices is primarily due to much cheaper natural gas.
[BTW, grid-connected wind power is uneconomic, anti-environmental nonsense.]
Jevon’s paradox.
David is lying (again) and wrong (again). I will explain later.
That’s a bald-faced lie.
Moderator – this is not the first time that Kit has made unsubstantiated and aggressive accusations.
I find David’s comments worthwhile – Kit’s, not so much.
David Middleton,
No. The cause and effect are correct.
See my comment above to John Haddock, August 12, 2017 at 9:06 am.
WRT regulated power systems, no new, lower cost suppliers can enter the market on any reasonable time frame. Governmental whim rules those markets; such markets do not adhere to traditional economic formulations. No economic comparisons can be made between such dissimilar regulated modes. We just need focus on the additional “green” costs to each system.
Dave,
An independent group of economists had this to say about the costs for CA to meet it’s RES:
https://www.ethree.com/wp-content/uploads/2017/01/Advisory_Panel_Report_on_the_CA_RPS_Study_FINAL_1-2014.pdf
“Higher RPS requirements at the 50-percent level would likely additionally increase electricity rates in 2030 by a wide range, compared to the expected rates based roughly on current policies and plans: the estimated increases were from 9 percent to 23 percent, depending upon the scenario under base case assumptions. The range was 3 percent to 36 percent under different sensitivity analyses, depending upon scenarios that changed combinations of variables. These estimated rate increases in 2030 were above and beyond the already-higher rates assumed to occur by then in the base case (which are estimated to be 47-percent higher than today’s rates).”
Thanks, kakatoa!
Just remember: Such studies of future conditions are idealized and optimized to focus on the paymaster’s preferred solutions. Based on actual renewables’ costs to date, the future doesn’t look as rosy as government documents might postulate.
Dave,
I concur- cost estimates can be a tad to a lot off. I see that the city of San Jose is #1 in the country for meeting sustainable development goals;
http://unsdsn.org/wp-content/uploads/2017/08/US-Cities-SDG-Index-2017.pdf
They didn’t win the top position for the “AFFORDABLE and clean energy” goal. I found it rather odd that the “affordable” part of the goal isn’t measured at all……………………….
While I am sure there are many factors effecting cost such as geography, resources (Hydro), renewable mix and management (mismanagement), it does make sense that more usage means lower prices. Having underutilized infrastructure just drives up cost per kw. Better to export power than not to produce it.
I have seen this for myself here in Ontario Canada, they increased rates due to lower usage (at least that was the excuse). So we save power but we pay more?
Good point. California has an abundance of excess, often idle, capacity due to their ridiculous renewable portfolio standard and gross mismanagement.
https://energyathaas.wordpress.com/2017/02/21/breaking-news-california-electricity-prices-are-high/
Key quotes:
“California has this tradition of astonishingly bad decisions,” said McCullough, the energy consultant. “They build and charge the ratepayers. There’s nothing dishonest about it. There’s nothing complicated. It’s just bad planning.”
Some of the excess capacity, he noted, is in preparation for the retirement of older, inefficient power plants over the next several years. The state is building many new plants to try to meet California environmental standards requiring 50% clean energy by 2030, he said.
Some??? More like 80% of the excess capacity is due to the RPS…
https://energyathaas.wordpress.com/2017/02/21/breaking-news-california-electricity-prices-are-high/
I will be SO GLAD when the SunCell* hits production, meaning that POWER production can be put into the hands of an actual CONSUMER of said energy and OUT of the hands of state “regulators” and associated cronies who do NOT look out for business’ (and consumer’s) best interest …
(* Yes, Deloris, final development on utility-scale production-models continues apace behind closed doors on this tech in the trillion-dollar ‘power’ market.)
Too much of that excess capacity being built is in renewables. It’s so bad the wind generators are starting to spoil landscapes that make it worthwhile to spend money there. I used to drive from Yuma to San Diego to enjoy the mountains as a relief from the desert heat. Now the view is littered with annoying wind turbines by the hundreds. They just keep adding more and more. At what point will instability take the entire grid down for San Diego and vicinity.
Yes, if you save power you pay more—the grid still has to be maintained and the power plants staffed, etc, no matter how much electricity is used. In Wyoming, the cost per kwh did not increase, but the base rates did. That’s one reason why conservation is a hard sell. Less costs more.
Same thing happens with electric cars. They don’t pay gas tax but still drive on the roads. The roads have to be maintained. So there’s talk of adding a road use fee for electric cars.
“That’s one reason why conservation is a hard sell. Less costs more.”
Agreed, in a free market, as demand reduces, companies would go out of business restoring the balance of too much overhead. As many utilities are government regulated/owned, with “jobs for life” and full pensions, the only way to cover all these costs is to raise rates and artificially keep the lights on.
Duncan said:
California, however, seems to have the opposite problem.
It connects into other people’s grids, destabilizing them too with the intermittency of its wind and solar, just like Germany does to its neighbors’ grids.
California’s Growing Imported Electricity Problem
https://www.forbes.com/sites/judeclemente/2016/04/03/californias-growing-imported-electricity-problem/#166ae0544693
Are you familiar with stepped rates, Roger? You pay less for the first portion of electricity consumed. At some point sufficient consumption causes the rate to increase for the next portion and it may increase again for a later portion. Usually most energy is consumed at the cheap rate and less is consumed at the more expensive rates for these plans.
That could be what you’re seeing. I think your analysis is far too simple to be useful.
eg
It is well known that industrial customers pay less per unit than residential. I guess I’m not seeing the big revelation here.
Roger, this has nothing to do with industrial. Residential rates are: tier 1 = $.16/kWh, 0 to 387 kWh/mo.; tier 2= $.25/kWh, 388 to 1548 kWh/mo; tier 3 = $.031/kWh, >1548. For me, I’ve in Eastern California, that makes my annual average cost per kWh $.19/kWh.
Much of what you say could be true, but some statements are unsupported by the data you presented here.
1. “Conventional wisdom is very wrong in blaming solar power and wind power for the higher California prices.”
If you make the claim here, present the data here. Graph cost of production vs. consumer price for each type of production.
2. “Also, Hawaii is excluded as a high-priced outlier.”
If Hawaii is consistently high-priced then it isn’t a statistical outlier. Example: I pop popcorn in a tall, open pot. Most of the kernels remain within the pot confines, but occasional kernels from random positions on the bottom clear the pot’s rim. Those are outliers. But if I see several high flyers coming from one section then it’s statistcally significant data which might be telling me something about heat distribution.
Did Hawaiian prices peak for a brief time due to an unusual heat wave or unxpected generator outage, or is it always expensive? The first would be an outlier, the second is usefuil data
3. “California, the green circle at top left, is 2 cents below the trend.”
So what? It’s also @3.75 (30% higher) above the average, as best I can eyeball from your graph.
4. “California is in the fifth quintile for high price but low consumption (16.2 cents/kWh and 6,741 kWh/yr/customer). Other states with California in the fifth quintile are almost all in the North East sector, Massachusetts, Vermont, Rhode Island, New York, Maine, New Jersey, and Connecticut. Example states at the other extreme, in the first quintile are Louisiana, Arkansas, and Oklahoma – all hot, humid, and consuming 14,000 kWh/yr/customer on average, more than double that of California.”
Now you’re confusing me. Most folks would expect discretionary usage of a commodity (air conditioning to cooler indoor temperatures than necessary for survival) to increase as the commodity becomes cheaper to buy. You seem to be suggesting that electricity prices are lower because the South is hot and humid.
Or you could be suggesting that producers drop their unit price in favor of volume sales. To prove that, you need to graph the difference between production cost and consumer price vs. usage.
California’s high electricity rates are due to the burden of state regulations that jack up rates and discourage investment, including renewable power mandates that increase rates overall by 5-7% per year. And the burden falls harder on those without solar rooftops because they cumulatively pay $1.3 billion per year to subsidize those who do have them.
Our local utility decided we needed to be hardened for hurricanes, needed more money for that…..went up $.01 based on usage….usage went down…had to go up another $.03…..usage went down again…ended up having to go up $.05 to break even (back to where they started)…..there’s a law suit pending
A couple of factors affecting CA’s consumption vs price ratio are:
1) the tens of thousands of residential solar generating customers who consume very little and get paid retail rates for their power. Since utilities cannot recoup grid costs from these people those costs are passed onto everyone else . So consumption per customer goes down, but costs go up. These extra costs per latest data ($1.3 billion/year) are about 4% of total spent ($33.5 billion).
2) low individual power usage in CA due to the mild climate. I read about one customer whose July bill for her 3800 sq ft house was about $100. In such a scenario rates have to go up to cover grid costs.
re: “have to go up to cover grid costs.”
I WISH people would use the RIGHT term, that being “transmission and distribution assets.”
Don’t know how my comment ended under yours Latitude. So sorry.
The article seems an attempt to refute the hypothesis that a high renewable generating capacity drives up prices, however by not addressing that specific issue it has not provided any support for refutation. As far as the near perfect correlation, this same type of data manipulation was done many years ago to try and prove a relationship (implying causation) between saturated fat consumption in diet and heart disease by country (the Keys seven country study). It led to decades of very bad advice regarding recommended diets that is only now unraveling as we realize this mistake may be partly at the root of the current epidemic of obesity and diabetes. Allowing oneself th latitude to group results whatever way you choose and then to exclude whichever results you determine to be outliers is a sure way to get a spurious correlation, but not a good way to find actionable truths.
I tried a different grouping. Instead of four quartiles, I used two halves. R-squared came out at exactly 1. So for 2 groups we get 1, for 4 we get 0.99, fot 24 we get ~0.5, and for the full 50 we would get a lower number again. So maybe grouping isn’t a valid way of doing it, because it is a greater reflection of # of groups than it is of the data.
Some time ago Willis, I think, put up a chart of electricity price vs renewables-pct by state, and there was quite a strong correlation – a higher renewables-pct correlated with a higher price. Combining that result with the data in this article shows that higher renewables-pct ==> higher price ==> lower per capita consumption. And that means that renewables are a national disaster. Thanks, Roger, for your article. It clarifies things quite nicely.
Indeed. A national anthropogenic disaster.
The crash-test dummies are out there.
The empirical test of all this is clear for all to see.
(The warmists of course hate the thought of observational tests of anything but that’s their problem.)
The test is simply this.
Will increasing renewable generation in a grid make electricity cheaper?
Will increasing renewable generation in a grid be stable and reliable and not export problems to neighboring states?
No amount of condescending and intimidatory diatribe from establishment mouthpieces will be able to conceal this simple test of the arrogant claims of the warmista for renewables.
To date its a fail.
This result would occur if the majority of people have limited income. Note each average consumer pays just over $1300/yr. in EVERY bin. I can’t see why this is a cheery result to you. It shows that the poor in high electric price regions are made to suffer with the most meagre level of consumption that they can squeeze by with. It is an illustration of Willis’s and others’ point that “saving the planet is all on the shoulders of the poorest of us. Please go back to your blog and put the correct interpretations on it and stop going forth to talk to all these unsuspecting folk about how wonderful these renewables all are.
I consider it negligent and worse to speak and write to inform and convince the public using a discipline you are not an expert in and didn’t seek advice on.
re: “I consider it negligent and worse to speak and write to inform and convince the public using a discipline you are not an expert in and didn’t seek advice on.”
Hmm … shades of Michael Mann and his use of ‘shady’, “home-brewed” stats, methods w/o consulting statisticians too…
I agree totally with you. I live in Southern Arizona. Over the last ten years my electricity usage has been pretty much the same. My electricity bill has gone up about a third. Every summer I watch those with low income around me struggle to pay the electric bill. APS has gotten harsher about non-payment. If you get your electricity turned off it can require a $250 deposit and full payment of your debt to them to the tune of $400 to $600. There are a growing number of homes with children here without electricity about the time it hits 110 degrees. Federal and state programs do not have enough money to assist most of these people.
Green socialism 101.
Consumption follows price.
Change in price causes change in consumption.
Price is the independent variable. Consumption is the dependent variable.
By convention the X-axis on scatterplots is the independent variable.
The Y-axis is the dependent variable.
The scatterplot should have Price on the X-axis (horizontal) and Consumption on the Y-axis (vertical)
Other way around. Price is the ordinate (y axis).
No. The OP chart is wrong. As I clearly stated, price is the independent variable, it SHOULD BE on the X-axis.
The dependent variable is Consumption, it SHOULD BE the Y-axis data.
https://pmstudycircle.com/2014/08/what-is-a-scatter-diagram-correlation-chart/
The independent variable SHOULD BE on the X-axis, which is the horizontal.
In this case, the price is the independent variable.
The dependent variable SHOULD BE on the Y-axis (vertical) which is the consumption variable.
Basic statistical analysis and hypothesis testing always uses this convention.
http://mathbench.umd.edu/modules/visualization_graph/page02.htm
In economics this would be called a demand curve. Here is a simple explanation. Scroll down to the curves.
http://economicsonline.co.uk/Competitive_markets/Demand_curves.html
“A Bit of Gathering Into Groups Gives Good Results.” Actually, a bit of gathering into groups gives any results desired. That’s the oldest statistical trick.
If you torture the data hard enough, you can get it to confess to any crime you want it to confess to.
Economy of shared responsibility. This is similar to Obamacare where millions pay the penalty and subsidize medical insurance reform, and millions more fall between expanded Medicaid and affordable medical insurance.
I doubt the validity of the arguments and numbers because I miss the list of items that are included/excluded from determining the electricity cost. Dozens of factors compose the billed price. In CT, the extreme shown, the wholesale price is 2 c/kWh. Even that price has hidden items not related to the actual cost each power-plant spends on maintenance, fuel, and debt servicing, the latter also consisting of items that may vary.
Definitely subsidies already extracted from the consumer’s hide won’t be shown in the price on his bill. Indeed what is the subsidy per kWh on average (renewables will have to be estimated at, say, 15% nameplate). That would louse up the beautiful linear graph.
OT: wind fraud news
Massachusetts couple charged with renewable fraud.
https://www.bostonglobe.com/metro/2017/08/11/acton-couple-charged-with-fraud-allegedly-received-more-than-clean-energy-grants/OhJLQ9FAlFzCicsSCID3ML/story.html
KiOR renewable fuels fraud…
http://www.clarionledger.com/story/news/politics/2017/07/30/texas-company-kior-hoodwinked-mississippi-75-m-documents-show/511059001/
An interesting and I think oversimplified argument on electric prices v. consumption. There are two elements to utility prices, a need to maintain the lines and the system as a whole, and a variable charge based on actual consumption.
California’s pricing has high residential power consumers in effect subsidizing the low use customers, as there is a stepped pricing scheme on rates. I do not see how to disentangle the stepped pricing from pricing affecting consumption overall.
re: “here are two elements to utility prices, a need to maintain the lines and the system as a whole, and a variable charge based on actual consumption.”
Since about 2011 our T & D company (ONCOR) has been granted the right by the Texas PUC to ‘bill through’ the electricity retailer to the final (residential) customer a “Delivery Charge.” I think a portion of this also includes the COST of transmission lines et al from wind farms in west Texas, accounting for some of the increased cost of electricity we now see in Texas …
An artful use of advocacy statistics….
Forrest,
I agree with your assertion of ‘attempts at misdirection’. My concern is John and Jane Doe read such crony socialism marketing pieces and accept the authors conclusions as ‘economic facts’.
PS: Some real interesting entertainment on P & T’s ‘Fool Us’ show.
Correlation is not Causation.
Being in the part of the power industry that must be prepared to meet demand, the cause of changes in demand are well know.
It is the weather stupid, it is the economy stupid.
“That’s the “price mechanism” in the law of supply and demand…”
Does not apply on hot summer days and cold winter nights.
David is not going sell his big house, he is going to set the thermostat the same place I do. Where it makes the wife happy.
What David does is spend less eating out. Demand for electricity is inflexible when it comes to price. When the bill comes in he blames the power company and not his big house.
I have listened to folks with a 5000 square foot house whine about their utility bill with a $4 cup of coffee they bought at the Starbuck drive with the engine of of the luxury SUV idling.
Roger S, David M, and risvtan are lying idiots. They write about stuff they have no experience doing. Think about it. How can you tell the truth if you do not know what it is? That of course make you an idiot.
Electric rates are controlled by state regulators not short term cost of producing power. The rates are adjusted after utilities show that things have changed.
Industries that use large amounts of power are sensitive to increase power costs. Eight years of Clinton anti-coal, anti-nuke, and anti-exploring for natural gas policies drove many industrial jobs to places like China.
Demand for electricity went down at the same fracking provide a large increase in supply of natural gas. Cutting the delivered cost of natural gas in half is a huge factor in the average cost of power. Production tax credits for wind is a minor factor.
California is a different market. It has a mild climate, heavy industry has been driven away, and the tax structure for making electricity with natural gas is disguised wealth transfer.
California also imports a third of the power they use and lots of natural gas to make the electricity in state. If it were a foreign country, surrounding states would not be forced to sell cheap energy and could use it to keep their industry and jobs.
I presume the theme of this piece is that prices are mostly (or entiely) dependent upon average
consumer consumption, and that type of production (renewable, etc) is irrelevant.
The problem is that the nearly perfect correlation is based on data points that are very few and lump
together data points, for no apparent reason than to get a “perfect” correlation. The giant drop from 100% explanation of one variable by another drops precipitously to 50% when the proper correlation rho is calculated. He conveniently drops “outliers” at that.
The article misleadingly states that California in 2015 produced 25% of their power from “renewables.” But half of that “renewable power” came from hydro and geothermal, neither of which has any functional relationship with wind and solar, as both are dispatchable.Wind and solar provided only 12% of California’s generated power, and only 5% for the U.S. as a whole, much of it
concentrated in just a few states. California also does not generate anywhere near the amount of power they consume.The state must import a large portion of their power. So it is certain that their consumption of renewable power is less than 12% and could be as low as 7 or 8%. Generally, It is
difficult to determine the price effects of wind and solar power because of these factors : 1) it is a relatively small amount of total power and therefore its effect cannot be very great, and
2) wind and solar power is paid for to a large extent by govt subsidies, and therefore its costs do not show up in the consumer’s electric bill – or here in the prices. One also has to calculate the side effect costs (backup or duplicative capacity that non-dispatchable power generators like wind and solar require). Most cost analyses of wind and solar that I’ve seen are biased and simplistic calculations made by wind enthusiasts or wind turbine manufacturers.
As to the article’s main finding : that average individual consumption and price are inversely propostional, I have to wonder why anyone thinks that this relationship is newsworthy. Of course there is always going to to be a significant relationship between price and consumption.
It’s called the effect of mass production and has been around for hundreds of years. Examine the cost profile of an electric grid. There are costs concerning the transportation of power to the individual customer , which seldom have any strong relationship to consumption. Look at the costs of running a power station – there are fixed costs that are also independent of station capacity – human operators, taxes, building maintenance, etc. Billing costs are the same regardless of consumption amount. All those costs must be paid for by the electric consumer. While the fuel costs for each consumer are largely dependent upon the amount of power he uses, practically nothing else is. Simple math tells you that a customer base on grid X that uses less average power than a customer base on grid Y will have to pay more per unit of power than someone on the other grid. That’s simply a reflection that the costs per unit of power on the lower avg grid are higher – they almost have to be, since they have to amortize all those non-fuel costs to a smaller number of power units.
In sum, there are plenty of cost and price differences that remain unexplained
by the (not-so-perfect) avg consumption-price relationship. And dealing with
wind and solar has to take account of their massive govt subsidy’s effect on prices.
Mr. Sowell,
Two questions. 1) Are the costs in your article the cost of electricity alone, or the cost of electricity plus delivery charge, plus tax, plus fees, plus…? I pay 6.58 cents per KW for just the electricity where I live, plus about four cents to deliver it through the grid and pay the taxes. 2) Are the costs in your article inclusive of subsidies to the user or generator of the sources of electricity consumed; i.e. the cost paid by taxpayers, local and Federal, regardless of consumption.
It seems to me that these various components of the cost of delivered electricity must be sorted out if one is interested in comparing the cost of generation technologies.
SunCell used to be named Black Light Power. It has been around for decades. If they had the invention they claimed, they would be worth more than Google, Facebook, and Amazon combined. But there appears to be a dearth of products.
https://en.wikipedia.org/wiki/Brilliant_Light_Power
re: jim2 August 12, 2017 at 9:19 am
No. You are largely mistaken.
Please review the REAL history IF you are going to post on this subject as posting un- and ill-informed idiocy from Wikipedia is NOT acceptable (LOOK at the idiocy wiki has on the subject of CLIMATE CHANGE for instance.)..
PLEASE become a little more educated on this subject and history from an individual who has taken the time to study and examine this subject over the course of BrLP’s existence.
Part 1 –
Part 2 –
Okay, final word – let’s NOT clutter up this thread with any more on this subject.
I’ve followed black light power for decades. You don’t have a clue what you are talking about.
re: jim2 August 12, 2017 at 10:18 am
Back at you, but I will assert you are wholly mistaken and NOT in possession of one single fact let alone ANY current info on this matter. It would behoove you greatly to come up to speed on this matter loo; rather than looking pretty damn foolish as at present.
Subject closed.
Black Light Matters.
If this is real, why aren’t there products that are flyinig off the shelves. There aren’t any. What a crock!
“Agreed, in a free market, as demand reduces, companies would go out of business restoring the balance of too much overhead. As many utilities are government regulated/owned, with “jobs for life” and full pensions, the only way to cover all these costs is to raise rates and artificially keep the lights on.”
So Duncan let me ask you a few questions before I label you pond scum.
If you make a mistake at work could it kill you or a co-worker? How many 24 shifts have you pulled to provide a vital services for your family and neighbors? How many prejobs briefs have you been part of because of high temperature, pressures, voltage, noise, or radiation?
There are no jobs for life at utilities. When you job is gone so are you. It is not too hard to find a new job because whims like Duncan need to buy coffee at Starbucks and there are not too many of those next to power plants.
Of course the new job means selling your house and moving the family, or working a temp job away from the family. As an adult, I have lived more than 30 places. Which is why I know about a lot of places.
Governments do not run power companies in the US. Some are investor owned and some are public power. All answer to a board of directors who worry about costs. The two times I had to leave a power plant because the job went away was public power mismanagement.
I suspect Duncan is one of those folks who think maintaining equipment and right of ways is ‘too much’ overhead. Then he wonders why power is not restored at his convenience. One of the root causes of the last two major is state regulators lot allowing cost of trimming trees.
Finally, what rates are you paying and how much electricity are you using? It is amazing how whiners do not know what they are about.
Clearly some states do a better job than others. California and New York come to mind. Power cost hare higher because large amounts are imported. Of course these states are generally screwed up with bloated public employee payrolls.
Kitty, you need to chill-out, you’re being a d*ck. I’m a technologist, a mechanical designer and previously engineered equipment (like Caterpillar excavators), now a Project Manager. My equipment currently is provided to utilities through the likes of Siemens and Mitsubishi. Yes, I have/do make life or death decisions so operators/people on the ground don’t get killed and I have to meet all ASME (piping and pressure vessel), ESA, UL, OHSA, CSA, etc codes. Equipment I engineer/design is critical service for mining and power generation. If it does not work the lights go out and potential of ten’s of thousands of dollars in back charges per hour. I have been to a many power plant and mining operation (USA, Canada & South America). I’ve seen both great operations and the Pig’s Trough’s.
BTW – I don’t like Starbucks’s, in Canada we drink Tim Horton’s. Starbucks is over priced and I don’t like saying “Venti” when I want a small coffee. I usually drink instant coffee in a reusable thermos, it’s cheap and I don’t have to sit in line to get it.
So get off your egotistical ‘better then everyone else trip’, your not impressing anyone.
So Duncan you are Canadian. You have no operational experience in the power industry US or otherwise. However, you have visited a few places.
Apparently your visits did not help you understand the difference between sitting in an office and standing beside operating equipment.
When you slander a whole industry, maybe you not tell some in that industry to chill out. Maybe you should go back and look at what you wrote.
Kitty, like I said, you are being a d*ick. You think, just because you are ‘turning wrenches’ you somehow are better then everyone else. As a PM, it is about the team, nothing gets done without YOU, ME and everyone else involved in the solution. Your mode of thinking is to divide, short sighted, either on this side of the fence or the other. Until you accept everyone is not you, you might take that Chip off your shoulder. For example, who makes sure your pay (before you retired) is deposited into your account? Some dude sitting in an office, this is what makes the world go around (you and me). “And standing beside operating equipment”, build it and tested all the time. Nothing like a 40ft Grinding Mill rotating just feet from your head, makes a person feel small.
“When you slander a whole industry,” – that’s a Strawman Argument, never said that. You just ‘feel’ that way because I pointed out the truth and it hurts. The power generation industry in general is not governed by supply and demand principals and tends to have a disproportionate amount of ‘capital security’ that most (if not all) industries could only wish they had. Suck it up buttercup, enjoy that pension, better than most.
For DHR, re August 12, 2017 at 8:50 am
The EIA residential electricity prices are based on the following: (basically says everything: capital charges, energy charges, taxes (but not income taxes) ) It’s pretty much what the customer pays in the monthly bill.
“Average price of electricity to ultimate consumers represents the cost per unit of electricity sold and is calculated by dividing electric revenue from ultimate consumers by the corresponding sales of electricity. The average price of electricity to ultimate consumers is calculated for all consumers and for each end-use sector.
The electric revenue used to calculate the average price of electricity to ultimate consumers is the operating revenue reported by the electric utility. Operating revenue includes energy charges, demand charges, consumer service charges, environmental surcharges, fuel adjustments, and other miscellaneous charges. Electric utility operating revenues also include State and Federal income taxes and taxes other than income taxes paid by the utility.”
source: https://www.eia.gov/electricity/monthly/pdf/technotes.pdf
“in the first quintile are Louisiana, Arkansas, and Oklahoma – all hot, humid, and consuming 14,000 kWh/yr/customer on average, more than double that of California.”
Roger do you think there is a causation to that correlation? We live part year in Louisiana. All the households of our families, even the young ones, have moderately large houses by California standards.
So people can afford houses and use power from AEP (American Electric Power). Since housing is affordable, there are no long commutes from cities thus saving on gasoline.
I think there are a lot of young families in California who would love to get into a single family dwellings.
What is wrong with California is people like Roger.
My dad used to tell me “If it sounds too good to be true … it is.” On my planet, having looked at heaps of data, this includes Roger’s claim of an “R-squared value of 0.9997, indicating an almost perfect correlation”. When I get a correlation like that, huge red flags go up.

So I went and got the Excel spreadsheet from the EIA, and plotted it up. I left out Hawaii because they have to ship in all their fuel by sea, making it a very expensive outlier.
So as usual, Roger Sowell doesn’t have a clue what he’s talking about.
Oh, yeah … the R^2 is not 0.9997. It’s 0.53.
I’ll do the quantiles thing next, but his underlying claim is simply not true.
w.
PS—I’ve provided the link to the spreadsheet above, so anyone can check my work.
Thanks Willis, that is exactly what I wanted to do but Roger did not have idea to put a link to his source, and I did not fance wasting time searching for something fitting his vague description.
Thanks, Greg. Yeah, I looked for a link to the data in Roger’s post but of course, he didn’t put one in … another red flag.
However, Google is indeed my friend, so I searched on “US EIA energy consumption price” which quickly got me to the EIA site.
Lots of good info there …
w.
Still without Hawaii which is off the page.
Greg August 12, 2017 at 12:27 pm
Thanks, Greg. Hawaii’s an outlier because they have to ship in all their fuel, so it’s not apples to apples comparison.
w.
“they have to ship in all their fuel”
…
Except for the 17% they don’t have to ship in: https://en.wikipedia.org/wiki/File:Hawaii_Electricity_Generation_Sources_Pie_Chart.svg
So about 50% of the variation can be described as people using more power when it is cheap.
So when CA gets big into expensive renewables and carbon taxes, they get to sit in the top left corner, in accordance with the national behaviour patterns. The warmists get to feel warm and fuzzy and Roger Sewel’s conclusion goes up in a cloud of PM2.5
WE, given the pronounced “L shape” to the distribution, R is a really bad measure of the relationship. My math skills suck, so I do not know what statistic is appropriate, but Pearson’s R is not it.
R is a measure of the degree of correspondence between the suggested linear relationship and the data. It is a good and valid, indicating this is poor model, NOT a “perfect fit”.
Pearson’s R is a measure of the linear relationship between two variables. A good, predictable relationship that described a very narrow curve would not be well described by R
The R statistic has nothing to do with what fn you chose to fit. It is a measure of similarity. The linear model was Roger’s choice , nothing to do with R.
Thanks, Willis. Exposes Roger’s deceptions.
Willis, if you multiply Rogers ‘gathered’ bins average prices by corresponding average consumption, you find that the average American in each bin is paying about $1300 a year for power, probably indicating that something below that is all poor people can pay for electricity at the limit.
As you’ve noted from time to time it’s the poor that are suffering the saving of the planet the most. Why such a graph would be so cheery put forward is beyond me.
But you left in states with refineries and very low cost fuel transportation?
Hawaii ships in their wind and sun? Either wind and sun is too expensive to use even in Hawaii or they use a significant amount and still have a prohibitive price?
More wind puffery.

California annual total generation:
California imports:
Is “unspecified power” environmentally friendly?
Further thoughts. I’m doing the quantile analysis, but it gives a curious result in that he’s using quantiles of averages with radically different populations. This gives curious results. Usage, for example, is sales divided by customers.
But if you do usage quintiles, things get wonky. I’ll come back to this, but I gotta go to work now.
w.
So very interesting to read all the negative comments. Sheesh, people!
And it is truly hilarious for one commenter to provide a chart with different data from a different year to “prove” me wrong. For the record, when I did this article back in 2016, the most current data on the EIA website was for 2014, the data shown in this article,
It is also quite amusing for all those bent out of shape over dependent and independent variables, as related to electricity price and electrical consumption. Which is dependent, they ask? Which is independent?
The independent variable, by definition (and no, you don’t get to pick your own definition!) is the variable that one can adjust, can manipulate, or over which one has direct control. The dependent variable, by definition, is the variable that moves in response to a change in the independent variable. We who are chemical engineers use these definitions to ensure the design and operation of thousands of chemical plants, and oil refineries, and the internal power plants that are in most of them, actually run safely and reliably 24/7.
We are not about to change those definitions on the whims of others. Not a chance.
So, in electricity discussions, which is the independent variable? One can only change how much electricity one uses, by running the A/C, the electric appliances, and any other electrical loads in the home. One cannot run down to the local utility and change the electric power rates. That, then, settles the matter with consumption as the independent variable.
For those who argue the graphs in this article have the axes reversed: No, they don’t. Convention places the independent variable on the x-axis (that’s the one that runs from side to side, for F. Gardener and his ilk).
The point, to but it quite bluntly, is that electricity prices are, on average, an inverse function of usage. That statement has significance to those who know statistics, and process control. The very high correlation shows that there is almost zero room for anything else to have an impact on the dependent variable, average price per kWh.
If one wanted to decrease the average price of electricity in the state where one is a consumer, one way would be for the majority of people to use more and more and more electricity. The utility must then reduce its rates, the billing rate of $/kWh, else it takes in too much money and has too great a return on the assets. Note that almost nobody does this. In the short term, the electrical bill would go up. In the long term, it might go up or down, depending on the rate changes.
Instead, utilities, and states themselves, encourage conservation. By having consumers using less and less electricity, the utilities must then increase the rates to maintain their return on assets.
Next, for those who apparently cannot read, I quote from the above article on the correlation coefficient for all 49 states individually:
“For all 49 states individually, again excluding Hawaii as an outlier, a much lower correlation coefficient results, of R-squared 0.546.” Again, this is for the data from EIA for the full year, 2014.
Next, for those who whine about not me knowing that electricity has tiered pricing in California. Of course I am aware, having lived here for decades. Also have written articles on this. What (apparently, many) people do not know or understand is the reason in California for the tiered pricing structure. To quote my SLB article from June, 2016:
“The state (California) has a multiple tier system for power pricing based on the kWh used each month. The rate structures have changed over the years. The complex, and a bit un-fair system has caused a new and improved system to be developed by the California Public Utility Commission. The CPUC website for the improved system, and the process to develop that system, is at “California Residential Electric Rate Redesign”
Below is a portion of the Rate Redesign website statement:
“In 2001 during the energy crisis, California passed legislation that froze volumetric electricity rates for a large portion of residential electricity usage (i.e., usage less than 130% of the baseline energy allowance or customer tiers 1 and 2). As utilities’ costs increased over the years, because tiers 1 and 2 were frozen by law, increases could only be borne by those customers consuming above 130% of baseline levels (or customers in tiers 3 and 4). As a result, the difference between the lowest and highest tiers has become very large, and rates for tiers 3 and 4 to more than double those for tiers 1 and 2.
In June 2012, the CPUC opened a Rulemaking to examine existing residential electric rate design, with the intention of ensuring that rates are both equitable and affordable for the foreseeable future, including for low-income customers.”
Note that the state freezing the lowest tier rates was a move toward helping those with the lowest incomes. I fully support such a move. Politicians do, too, as the poor have a disproportionate impact on votes. Not only do the poor vote, but measures to help the poor garner wide voting support from those who are a bit more affluent.
And, it must be noted that, by increasing the rates for high consumers (Tier 3 and 4) the state is penalizing those who choose to purchase a large home with high energy requirements. Or, those who simply run up large electrical loads so they can complain.
And last, for the commenter that placed a graph of electricity rates over the years, complaining that California went up while Texas went down: totally beside the point of this article. This article is about the price difference within one year span over all the states, not change over time.
To repeat: electricity rates are an inverse function of average usage. If one had either of the opposite outcomes, high rates with high usage, the utility would be making an outrageous return on investment. If one had low rates with low usage, the utility could not afford to stay in business.
Non-dispatchable sources with “must take” rules drive up prices.
Since you do not show the true correlation of the data or even plot it that statement is a knowing misrepresentation.
I guess that is the difference between a scientist and a lawyer. A lawyer’s job it to prove his case by any means possible in an adversarial way. It’s all about winning one’s case, not getting to the truth. That is someone else’s job.
The argument about independent variable is a false one. You do not have a controlled experiment or a control process where on variable can be freely set, independently. He you have two mutually dependent variables which are also affected by host of other uncontrolled and unexamined factors.
You are simply insisting on your definition of which variable is driving to other in order to come to the conclusion you wish to support.
You start with that assumption and then claim to have proved when the same thing comes out the other end. Pretty much the way climatology has been functioning for the last 3 decades.
That’s not really true. Consumers can and do control electric power rates – by not electing tax-and-spend politicians that impose high regulatory burdens and taxes that cause rates to rise. All of the states in the higher costs portion of your graph are those kinds of states. They also all have some form of renewables mandates that also raise rates.
Roger: You are following the traditional practice of putting price on the vertical axis and demand on the horizontal axis. However, economists do not do this because price is a dependent variable controlled by demand.
In some areas of science we have the privilege of being able to do well controlled experiments were only one variable is changed and the results of that change can be measured. Economics is not science and economists to not determine cause and effects from such graphs. Economists use multiple linear regressions that include all important variables and attempt to measure the elasticity of the demand for electricity: How much will a 1% increase in price reduce demand? There is a large literature on this subject, which disagrees with your deceptive graph which predicts about 1% drop in consumption for a 1% increase price.
Roger wrote: “electricity rates are an inverse function of average usage. If one had either of the opposite outcomes, high rates with high usage, the utility would be making an outrageous return on investment. If one had low rates with low usage, the utility could not afford to stay in business.”
More idiocy. Generators of electricity have fixed costs (mostly a return on invested capital) and variable costs that are paid by customers through a distributor (who adds the cost of the distribution network and collecting money from customers). In a sensible world, peak demand is met by plants with low invested capital, which has to be paid for in a month or two of operations. These cheap plants use fuel less efficiently, but these fuel costs only need to be paid for a month or two a year. Base load demand is met by plants with the lowest fuel cost (which is being charged 100% of the time) and therefore the highest capital cost (which can be spread over the whole year). You idiots in California demanded that peak demand be met by high efficiency CC-gas plants, which more than double the cost of meeting peak demand. And you insist on adding renewables with high capital cost and low fixed costs. Those characteristics make them most suitable for meeting base load demand, but they aren’t dispatchable. They need to be backed up by f a dispatchable generator, which capital costs must be paid whether or not renewables are meeting demand. Some day you will reach the point – if you haven’t already, that no one will want to buy solar power around noon on sunny days and no one will want to buy wind power on windy days – because of the law of supply and demand. Germany has reached that point with wind; Honolulu with solar. That is why your prices will really get out of control.
Roger wrote: “Note that the state freezing the lowest tier rates was a move toward helping those with the lowest incomes. I fully support such a move. Politicians do, too, as the poor have a disproportionate impact on votes. Not only do the poor vote, but measures to help the poor garner wide voting support from those who are a bit more affluent.”
What BS! Do you voluntarily patronized businesses that charge you a higher price for a product than another customer because you are an affluent attorney? You would be outraged and shop somewhere else. However, electricity is a publicly controlled monopoly in California, and the socialists in charge FORCE you pay a higher rate. Someday the initiative process will let CA voters decide this issue for themselves. Then we will see how much public support really exists for tiered pricing.
Messy thinking of elitists (my definition: those “betters” who know what’s best for the rest of us and at the same time have little touch with their would be ‘subjects’ ), your bias favoring what the greens have done with the power system to save the planet at great cost to the poorest, and the unattractive superior, condescending attitude of the elite that you display is the ‘tell’ . The danger to you isn’t that the great unwashed won’t like you, but worse – that it makes your thinking simply wrong. Here is why:
You did not notice that annual power bills for the average American across your entire data set is some $1300 for EACH ONE of your bins that’s why you have a straight line. This shows that there isn’t a lot of independence in the hands of poorer Americans (66% make 41000 or less; half make 29,000 or less.) to choose how much power they would like to use. Power used to be cheap but it has been made much more expensive deliberately with the stated objectives of the neoмагх¡sтs/UN/ EU/Davos grp. Remember Pres O telling us our energy prices will “necessarily” skyrocket. I won’t go into quotes from Maurice Strong, MS Figures, and others who conceived and foist this ugly stuff on us, you must know them and approve. It has become a luxury good for the poorest, who in your bins are earning a lot less than the princely sum of 30k/yr.
Now, it’s true that the more filet magnon you buy, the cheaper it is (within tight limits) . Or if you buy Mumms Cordon Bleu Brut by the case… these fit your idea of quantity choices effect on price and the independence factor is a discount but not a big one. You remain a price taker – the tiers and other shmeers are the lesser factor. Ask the people in South Australia how this works in their favor. I have much more but suffice it to say that you don’t know that you are a let them eat cake type, an elites. To help you have an insight into your wrong thinking, how does it sound to you when we say that Al Gore with his multi mansions can choose to use as much electricity as he wants and the good thing is he gets it cheaper than the poor folks.
And it is truly hilarious for you to reply that people are not getting exactly same data yet you STILL have not provided a link or proper reference to the data you DID use. Neither here in comments, as an update to your article or on your own web site.
Like Willis said , another red flag.
A little late in reading this entry, but if R.S’s conclusion is right, it would make no difference whatsoever what year’s data is used, unless he wants to argue that consumers have changed how they decide to use electricity. Why would the graph be different depending on the year if usage/cost were so perfectly correlated?
Exactly, which is why Willis did not make an issue about using 2016 which is what is currently presented instead of 2014 which the author chose not to provide a source for.
The objection is disingenuous.
Roger: Looking at Willis’s plot, isn’t the correct question: Why have CT. MA, AK, RI, NH. NY, VT, CA, NJ, ME, MI and WI failed to provide their citizens with electricity at a cost below 14 cents a kWh?
Alaska is an expensive place to do business. We can excuse them and Hawaii. What about the other 11?
Once you get away from these outliers, there is almost no correlation between price and consumption.
Some of the poorest states in the nation (MI, AL, LA) have the highest consumption, demonstrating that demand from electricity isn’t very elastic. People with less money to spend are not purchasing less electricity.
High distribution costs associated with low population density isn’t a critical factor: WY, MN, NE and other low density states aren’t outliers.
What excuse do these states have for charging their poorest citizens ridiculously high prices for electricity? Are the prices paid by the poorest citizens is these states are subsided by ordinary citizens?
The states with the most expensive electricity have one thing in common. They are run by Democrats for the last few decades. WA and OR are big exceptions, but they have lots of cheap hydroelectric. IL is the only big democratic state with moderate electricity prices and little hydro.
Illinois – The democrats have not found a way to ruin our electricity production, despite wasting millions on bird blenders. We are blessed with nuclear power production, much like WA and OR have hydro.
From EIA:
Frank there are programs to help the poor out with energy costs kind of like food stamps or Medicaid.
When my mother was dying of cancer, the city picked up her heating and electric bills. Not at first because she was a registered Republican and therefore must be rich. Able body union workers on strike were also getting bills paid by the city.
I must say I became unglued when I found out my mom had no heat. I let it be know I was coming home on emergency leave. This nuclear trained officer knew how to disable heating systems and make houses glow ion the dark. I would start with the mayor and work my way down.
Roger: Any excuse for the gross deception exposed by Willis’s plot and your Figure 1?
Roger, you said:
“And it is truly hilarious for one commenter to provide a chart with different data from a different year to “prove” me wrong. For the record, when I did this article back in 2016, the most current data on the EIA website was for 2014, the data shown in this article,”
If the data from the next year is completely different, something is wrong, and it is nearly certain your assertions are inaccurate.
I have found you informative over the years, but often by learning from your mistakes.
The “too good to be true” flag was unmissable. Interestingly, I had to reread before I noticed Roger pointed out that he had to manipulate the data to get what he was claiming. All data considered (except Hawaii), he admitted, made things unimpressive.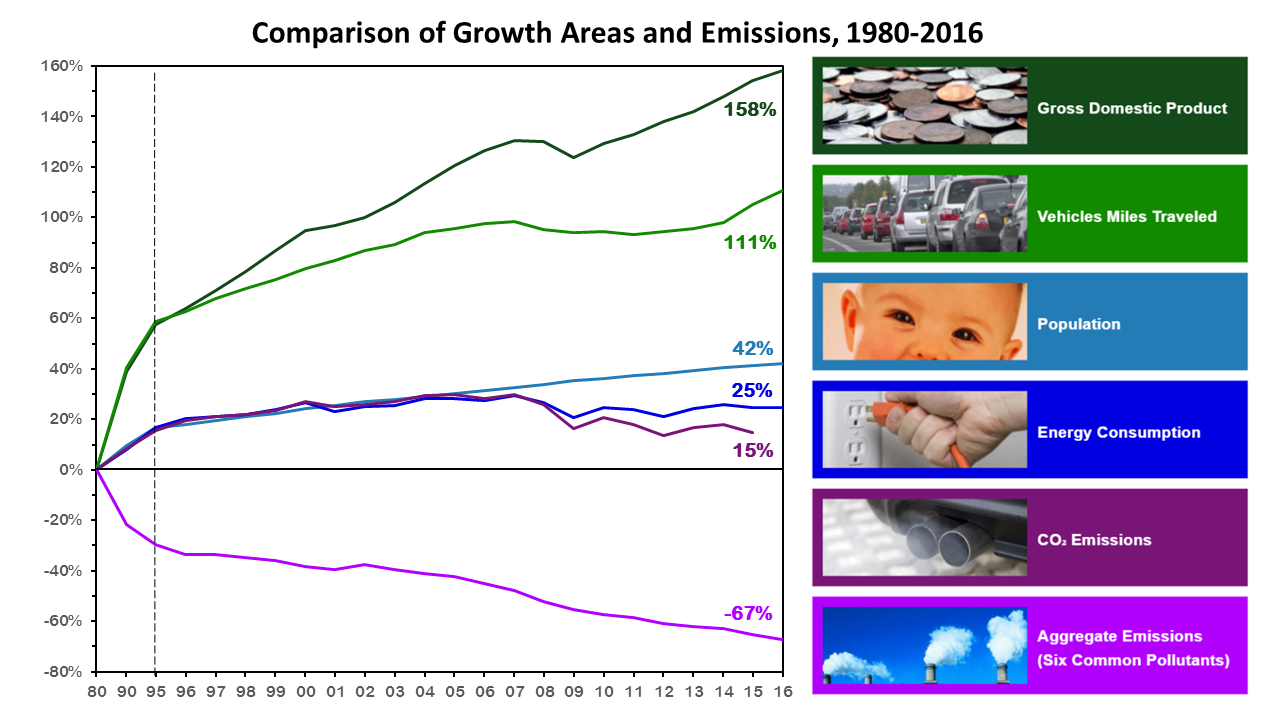
As the EPA’s graph has shown since I first noticed it decades ago, consumption follows GDP. Miles driven tracked GDP closely until government interference somewhat decoupled the two. Gasoline prices hardly affected driving, ever. Overall economy did, though.
The situation for energy is not a lot different. The government meddling and regulating matter more than expectable factors.
Oh, and don’t miss the fact that the air has gotten cleaner practically every year since 1970. Air pollution is an imaginary problem at the national level. Our air, as a nation, is cleaner than it was a century ago. Coal has not been a problem in that regard for a very long time.
Re: “Conventional wisdom is very wrong in blaming solar power and wind power for the higher California prices.” and (in his linked blog article) “The reason for the higher price is low electricity consumption in a mild climate, by a very large number of customers…”
No. Electricity prices are set by regulators, on a cost-plus basis. So higher costs result in higher prices. Solar and wind have high costs, so they cause high prices.
Neither mild climate nor large State population cause California’s high electricity prices.
Louisiana has a mild climate, but very low electricity prices. North Dakota has a harsh, cold climate, and also has low electricity prices. What they have in common certainly is not climate! What they have in common is fossil fuel production.
Re: “The conclusion that can be drawn is that there is indeed… a very good correlation, between average price for residential electricity and the quantity of electricity consumed on an annual basis by each utility customer.”
Right, but the (inverse) causation runs mostly in the opposite direction from what you seem to think, Roger.
Reduced consumption can sometimes cause slightly higher average prices, because with low consumption the fixed costs of the distribution grid must be spread across smaller number of kW-hrs. However, that may be offset by the reduced necessity to use expensive, inefficient, last-resort power sources during periods of peak demand.
The observed inverse correlation is mainly because higher electricity prices cause reduced consumption, particularly in the long term.
There are two fatal flaws in this argument. The first is the assumption that correlation proves causation. It doesn’t and other evidence is required to confirm such a claim. The second is the use of a small sample. Believe it or not, the USA is not the whole world. I suspect that if this study had included all of the developed world, this apparent correlation would disappear in a puff of smoke. Here in the UK we have just had a 15% hike in electricity prices and it is directly attributable to the subsidies paid to offshore wind farms and the cost of their connection infrastructure, which are coming on line at a rapid pace.
“If I was paying 17.58¢/kWh, I would use a helluva lot less electricity than I actually use at 11¢/kWh.”
So Allen you think this is a worthwhile comment and think David M is being truthful?
If David had said I used to pay 5c/kwh and now I am paying 11c/kwh. This how much I reduced my usage and these are the things I did …..
Well then I might I might think David is credible.
Allen if you were a skeptical thinker, you might be wondering why David M needs price incentives to do the right thing. Why would a reasonable person use more energy than they need just because it is cheap?
I have always had relatively low energy bills by doing all the cheap practical things. While my personal ethics about using energy are not something I demand of other people, I am really skeptical of claims of lifestyle changes based on price incentives.
“Kit has made unsubstantiated and aggressive accusations.”
Allen the lies are obvious. I call people liars because the lies are told so often the people like you believe them. It is not an accusation, it is pointing a fact.
In my line of work, you did not get fired for making a mistake. You get fired for lying about it. I have told people they were lying. Very aggressively but behind closed doors.
There are a few here who write convincingly about all kinds of subjects. It would be nice if those people would stick subjects where they at least have some experience. If you lie about making electricity, wait for it…..
The fact that someone retired doesn’t understand supply and demand curves just goes to show that the lack of even basic economics instruction in high school is not a recent problem.
After 40 years in the power including working in the control room of nuke plants cold winters nights and hot days, I understand the difference between theory and reality.
Power demand is insensitive to price signals.
In a free market things cost approximately the same in all states. Any differences should be in transportation costs and state taxes. It would be interesting to see e.g. automobile cost vs state.
To be a little more explicit, the reason electricity costs are so high in California is because of the requirement that x amount of energy must come from renewable sources which are much more expensive than coal or natural gas. Plotting energy cost versus energy consumption has almost no significance — people use the amount of energy they need almost independent of cost.
Jim Butts wrote, “people use the amount of energy they need almost independent of cost.”
Only in the short term, Jim.
Short term elasticity of demand for energy is low, but long term elasticity of demand is pretty high. When gasoline becomes expensive you still have to commute to work, and you won’t scrap your SUV because of sticker shock at the pump, but when you replace your vehicle in a few years you’ll shop for something that gets better mileage. When electricity becomes expensive you won’t stop taking hot showers or tear down your poorly-insulated house, but when you replace your water heater you’ll get a more efficient one, and when you remodel your house you’ll spring for the extra insulation.
I double that Dave, you get A+ for ECON101 on price elasticity (and normally only 40% of my college students understand this short versus long run aspect of elasticity on exams), see my comments above, also lots of empirical papers have price elasticity estimates, one I yanked and linked to has some short and long run estimates.
Yep, I think Dave pins it there, and it is the long term relationship which shows in the annual data, not what we do in a heat wave or a cold snap in winter.
“To be a little more explicit, the reason electricity costs are so high in California is because of the requirement that x amount of energy must come from renewable sources which are much more expensive than coal or natural gas. Plotting energy cost versus energy consumption has almost no significance — people use the amount of energy they need almost independent of cost.”
Jim, 90% of californias solar capacity was installed after 2010. This fact applies equally to the overall renewable capacity in california. If renewables is pushing up the cost of electricity in the state the per capita cost of electricity should graph out as a flat line from 1990 to 2010 and rise rapidly after 2010.
I have lived in california during that entire time period. My utility bill has stayed almost flat the entire time. My electricity bill did go up in 2015 mainly due to new chevy volt. but Overall I am pay a lot less for gas (I have only fill ed up the gas tank about 4 times this year). I have not yet seen any graph showing the cost of electricity increasing with renewable installed capacity and I certainly don’t see that in my own utility bill.
Also if we look at Texas they have also installed a lot of wind capacity since 2010. So if renewables rase utility costs to the customer you should also see a dramatic price increase starting in 2010. Again I have never see a graph showing that. In fact many people still compare texas to california and claim renewables cause electricity prices to increase. There is no correlation between electricity cost and the installed capacity of renewables in either state.
Its not just renewables, its also related actions. If the States govt is full of the faithfull (Ca and South Australia) they overcommitt and also start demolishing fossil and nuclear plants, and start relying on imported power when renewables inevitably tail off.
Jim you are wrong. Power prices where high in California before renewable energy. I was there.
There was a time when power prices were low in California. Los Angles Water and Power got 75% from out of state coal plants with no pollution controls. S, David Freeman took care of that just after he closed the nuke plant in Sacramento where I worked.
Price influencing consumers in Australia
https://cleantechnica.com/2017/08/13/tesla-powerwall-high-electricity-prices-driving-australians-energy-storage/
Again Griff please refrain from commenting on things you know nothing about reading some article from some political sales pitch article. What is the driver for the uptake is SA is going to have massive shortage problems for the next 2 years and so is offering massive incentives.
https://www.solarchoice.net.au/blog/news/how-south-australian-government-supporting-renewables-energy-storage-290316
If you have the initial money to invest it’s a pretty good deal … if you don’t well bad luck chump.
Like all your stupid articles, you cherry pick positives.
I will make a prediction the sales figures will continue an upward trend so long as the power grid remains as fragile as it has been dragged and the tax payers can afford to keep paying the incentives. When those two things change the sales will drop to a very small number where they started historically.
Roger,
Many of us in Australia cannot construct graphs like shown in your feature piece. This is because the price paid for electricity is affected by voluntary rebates and multi-tier price schemes for peak versus non-peak and different transition points in different geographies. The result is a rubbery price probably incapable of correlation coefficients like you quote because price is a combination of many variables, some not related to consumption.
Do you have this complication in your data?
Correlation coefficients between two nominated variables have no meaning if there is no causal relation between them. You need to state the absolute errors involved in your figures rot consumption and price. You need to quantify factors such as the quality of electricity from time to time such as whether there are voltage drops in commercial supplies as loads peak, and whether electricity from various sources has the same relation to price that you postulate overall, with a dubious use of r squared for publicity more than for rigour.
Lawyer views can be more arm waving than scientists like. Cheers. Geoff
Cherry 🍒 picking of correlations by greens
In the field of ionizing radiation biology and epidemiology, related to nuclear safety, there is a strong negative correlation between rates of cancer incidence and background levels of radiation dose received by the public, in the USA. Yes – negative. States and regions with higher background radiation have lower cancer mortality. This has been shown for decades by epidemiologists such as Cohen and Jaworowski.
However the radiation epidemiology community have rejected the conclusion from this that low levels of radiation are protective against cancer. Instead they argue that there are many other factors such as socioeconomic ones which confound a causal conclusion about radiation and carcinogenesis. To the extent that what they call “ecological studies” which just correlate parameters A and B between regions, are practically outlawed in epidemiology. They favour much more tightly controlled cohort studies.
And they’re probably right – by far the biggest determinant of health and lifespan is socioeconomic. More money and more social connections add decades to your life. By contrast radiation is an exceptionally weak carcinogen and is among a host of rusk factors that might shorten or lengthen one’s life bu hours, days or weeks.
Now contrast this rejection of correlative ecological studies in the radiation field, with the wonderland of climate “science”. Here correlation is ALWAYS causation. Every possible bad thing that has happened, or has been computer modeled to virtually happen, has been attributed a climate warming causation simply because the naturally chaotically oscillating climate happens by chance to have been warming over the last century following the LIA. No-one in the climate community has any hesitation in ascribing climate causation to anything and everything.
So the same progressive green community advances its pseudoscientific agenda by diametrically opposite arguments in different fields, taking advantage of the fact that scientists and decisions-makers in one field are usually sterile of knowledge in any other field.
In radiation biology, to help kill nuclear power, correlation is NEVER causation.
In climate science, to kill right wing capitalism, correlation is ALWAYS causation.
(And it’s all done in the best POSSIBLE taste!)
Low level radiation external to the body, or even internal to the body for brief periods, is not a problem (or even the issue). The problem is when highly radioactive hot particles of certain man-made isotopes enter the body for extended periods, either through immediate contact (eg, plutonium in lungs, iodine-131 in thyroid) or by incorporation into cellular tissue (eg, strontium-90 in bone, cesium-137 in muscle). Try inhaling or ingesting a 1 quadrillion becquerels per kilogram hot particle (insanely radioactive), like some found in dirt and dust samples taken in Japan, and see how that enhances your health.
Low ionizing radiation dose is is like low levels of smoke (second hand smoke). They both have a weak or negative correlation with mortality. And the reason may be that we have evolved in the presence of both– radioactive decay of unstable isotopes, cosmic rays, campfires, —–.
ICISIL, Jim
Low level radiation below a few tens of mSv is indeed either harmless or slightly beneficial, although the “hot particle” scenario outlined by ICISIL is a valid one. I collaborated with radiation scientists in Kiev, Ukraine in the 90’s, on behalf of a UK university, to develop SSNTD (solid state nuclear track detector) based methods for detecting and characterising such Pu, Am hot particles. This method is in use to this day in Chernobyl remediation.
The LNT (linear no threshold) hypothesis behind “conservative” (and nuclear energy bankrupting) radiation protection practices is patently false, a few seconds search of the radiobiological literature with Google scholar or pubmed will reveal dozens of highly repeatable studies in which low level (low LET) radiation decreases cancer incidence and increases lifespan in mice and rats. There is a threshold below which there is no radiation harm. This reduces the number of virtual deaths from radioactivity contamination events (e.g. Chernobyl, Fukushima) from tens/hundreds of thousands to nearly zero. LNT creates these “deaths” statistically out of thin air and is a powerful political weapon against nuclear and it has almost succeeded in killing off the industry.
However the negative correlation between cancer deaths and background radiation levels such as Cohen reported in the USA, is mainly because areas of natural beauty in the mountains etc. tend to (a) have higher levels of background radiation and (b) be inhabited by richer (thus healthier) people.
The best epidemiological study of radiation carcinogenesis was the US shipyards study. Here two shipyards were compared in which the socioeconomic characteristics of the workforces were very similar, the only difference being that one was a nuclear shipyard and the other not. Almost the perfect, textbook epidemiological controlled cohort study. Its only “failing” was it’s politically incorrect result. There was a very clear threshold of a few tens of mSv, above which there was elevated cancer incidence (only in the single, highest dose group), below which there was not. For this reason the study and its results were suppressed by the scientific community where antinuclear activism holds sway. Have you heard of this study? Thought not (but you’re not to blame).
I have heard of the study and was also the radiation safety officer a nuclear ship during shipyard availability.
The best way to reduce paper work is avoid exposure.
Roger is an anti-nuke. His only experience in the power industry is being a self proclaimed critic. There is a lot of that in California.
Anti-nukes are often advocates of other things but never accomplish anything.
The same companies that are good at building and operating nukes are good with coal too. Also wind and solar too.
I am one of those all of the above people. Do it right, the first time.
I am anti-clown. The engineer that sat next me at the nuke plant near Detroit was famous for going to the meeting dresses as Bozo. He looked at upper management and told them he wanted the rest of the clowns to feel more comfortable.
The problem with the wind and solar clowns is that they put stuff where it will not work. Making power is about good engineering not bad politics.