By Andy May
Javier has posted three new essays on the Bray climate and solar cycle on Judith Curry’s web site. Part A is here, part B is here and Part C is here. In these posts, he lays out the evidence, in some detail, for the climate cycle and the associated solar cycle. Here I will summarize the results of his analysis and explain why it matters. The Bray solar and climate cycle are arguably the most important climate/solar cycle of the Holocene Epoch.
The Bray cycle is about 2450 years from beginning to end and the Bray Lows, which are the coldest portion of the cycle, are the most important events. The Bray lows are easily seen in glacial advances around the world (Bray, 1968), foraminifera fossil records, archaeological records, and lake sediment records. They are less evident in ice core records from Greenland and Antarctica. Figure 1 shows the Bray Lows of the Holocene as blue bars, labeled B5 to B1.

Figure 1
The yellow bars are some of the Eddy cycle lows (~980 years). The black rectangles show the location of major grand solar minima clusters (GSM). We call the warm period from 8000 BC to 3500BC the Holocene Climatic Optimum and the cooling period from 3500 BC to the end of the Little Ice Age (LIA) in the late 19th century the Neoglacial. The blue curve on the plot is my global Holocene temperature reconstruction (see here) and the gray curve is a Holocene Greenland temperature reconstruction described in Kobashi, et al., 2017.

Figure 2 (Sunspot reconstruction source: Solanki, et al., 2004)
Figure 2 is the Holocene sunspot reconstruction published in Nature by Solanki, et al. in 2004. Besides the sunspot records there are other data supporting a 2450-year solar cycle that are in phase with the 2450-year climate cycle. The radiocarbon evidence is discussed in Vasiliev and Dergachev (2001) and O’Brien, et al. (1995) discuss the ice core evidence for the cycle. Other evidence is discussed here. The Bray lows in figure 2 are the same as those in figure 1, but the bars are smaller to allow all the Eddy cycle lows to be displayed. The more severe colder periods with extended periods of minimal solar activity occur when Bray lows and Eddy lows occur at about the same time. However, the sun is not the only natural cause of climate change. Ocean cycles or oscillations, often called “natural variability” can occur on millennial time scales as well. The evidence for these long-term oscillations is discussed in Debret, et al. (2009).
The 20th century had an above average number of sunspots, suggesting an above average level of solar activity, certainly higher than the Little Ice Age. Solanki and Krivova (2003) looked at the influence of TSI (total solar irradiance), total UV solar irradiance, and cosmic ray flux on the Earth’s climate. They concluded that if only these three solar influences affect our climate that the sun could have caused the global warming until 1970, but from 1970 to 2000 the sun probably contributed less than 30% of the warming using a conservative solar reconstruction by Frohlich and Lean (1998). Using a different reconstruction by Willson (1997), the sun may have contributed as much as 50% of the warming. Even though we now have satellite measurements of solar radiation variability, these records are inconsistent with one another leading to multiple reasonable interpretations of long-term and short-term trends in TSI and solar activity. Thus, estimates of solar forcing and the impact of the sun on our climate vary from 30% to nearly 100%, see the discussion on this topic here. All we really know is that solar activity is high today and increased during the 20th century, thus it probably contributed to the recent warming, but the amount of the contribution is still unknown.
As Javier writes:
“Given the strength of the correlation between past cycles of climate change, and cycles in the production and deposition of cosmogenic isotopes, like the Bray cycle, the solar-climate relationship is accepted in paleoclimatology as non-controversial. Sixteen of twenty-eight (57%) of the articles whose climatic evidence has been reviewed here explicitly state that changes in solar forcing are likely to be the cause of the observed climatic changes, and only one explicitly rules them out. Then, why is the solar-climate relationship so controversial outside of the paleoclimatology field?”
There are two main reasons given by Javier’s opponents for why they think solar variability cannot be important in climate change. The first is that the cosmogenic isotopes, 14C and 10Be, used as a proxy for solar activity in pre-instrumental times, are, themselves, affected by climate. Therefore, it is stated, that they are invalid as solar proxies and cannot be compared to a climatic record. But, this criticism does not explain why the proxies compare so well to sunspot records over the past 400 years (see figure 3). The climate of the last 400 years is highly variable and yet 14C and 10Be compare extremely well to the sunspot record. Another way to test the validity of 14C and 10Be is to compare their records to auroral records which are related to solar activity, but not to climate. Here we also see excellent agreement. In figure three, from Javier’s essay, auroral frequency is plotted in 3b and the cosmogenic isotope solar modulation function is plotted in 3a and both are compared to the International Sunspot Record in black and the Hoyt and Schatten sun-spot number in gray in 3c. The pink bars identify de Vries lows (spaced at 210 years) and the gray bars identify grand solar minima. The grand solar minima are labeled with their names. The de Vries 210-year solar cycle is modulated by the Bray cycle such that it is more severe in Bray lows (Hood and Jirikowic, 1990) like the Little Ice Age. If the Bray cycle were of terrestrial origin, then we should not be able to see it modulate the solar de Vries cycle in solar records, but we do see it in figure 3 in the sunspot record and in the auroral frequency record.

Figure 3 (source: Javier, here)
Many researchers have identified a climate cycle or oscillation of about 1500 years (Kern et al., 2012 and Darby, et al. 2012), but it does not show up in cosmogenic records. If the cosmogenic isotopes are reflecting terrestrial climate, as opposed to solar activity, why do they not show the 1500-year climate cycle that most believe is related to ocean oscillations? It is difficult to argue that the climate is contaminating some cosmogenic isotope records, but not others.
The second common objection is that observations of our sun show it to be extraordinarily constant, with the total solar irradiation (TSI) varying over a small and insignificant range every 11 years. This conclusion assumes that any solar climatic effect must be due to changes in TSI and the critics claim there is no evidence for this, thus, they conclude the sun has no impact on climate change. As Javier points out this is a non-sequitur fallacy. There is evidence that the sun is the cause of the Bray cycle, if the mechanism is not a change in TSI, it could be a change in UV radiation, which can vary as much as 100% in one 11-year solar cycle, or some other solar cause such as variability in the Sun’s magnetic field strength.
Solar UV radiation helps create ozone and affects the temperature profile in the stratosphere. Thus, variations in solar UV can change the stratospheric temperature profile and density. The density changes change stratospheric pressure and the geopotential height of the tropopause. Ozone is not distributed equally around the world and the distribution can affect surface weather patterns (Labitzke, 2001). There are also other solar changes that might affect climate, such as the solar magnetic field strength, but we will not discuss these mechanisms here.
Another problem with the assertion that solar activity variability is insignificant is that the long-term sunspot record strongly suggests that there is a secular long-term trend of increasing solar activity as we come out of the Little Ice Age. The Bray cycle modulates the ~210-year de Vries cycle as can be seen in Figure 4. The amplitude of the Gleissberg centennial cycle (~103 years, Tan, 2011) and its half-way point are shown by the orange line. This cycle is also shown by the red curve, which increases from left to right. The ~210-year de Vries cycle lows (also increasing from left to right) are shown in blue. Since solar activity, during the de Vries lows and the centennial lows, is increasing with time, the de Vries lows become less noticeable. The increased activity in the lows makes them harder to detect. Thus, it is expected that the next de Vries low, around 2100, will be barely noticed.
This modulation of the shorter cycles might have created a secular warming trend coming out of the Little Ice Age. This long-term trend is not accounted for in current climate models, thus the impact of the trend, if any, is assigned, erroneously, to human influence.

Figure 4 (source: Javier, here)
I’ve prepared a poster, meant to be printed on 11″x17″ or A3 paper that contains much of the information in the first four figures for the entire Holocene. Click on figure 5 below to download it.

Figure 5 (link to download poster, prints best on 11″x17″ or A3 paper and larger)
The top graph in figure 5 is my Northern Hemisphere temperature reconstruction (see here). The second graph is a plot of a Holocene sunspot reconstruction by Solanki, et al. (2017), overlain with the Bray and Eddy cycle lows and the grand solar minima. The third graph shows my global reconstruction (see here) and the Kobashi, et al. (2017) Holocene Greenland reconstruction. I’ve added some historical notes to provide some temporal perspective. Sea level change, satellite temperatures and some surface temperature records are shown along the bottom of the poster.
The Equator-to-pole-temperature-gradient
When the world cools at solar lows, the equator-to-pole-temperature-gradient (EPTG) increases. As the solar minimum approaches, the atmosphere reorganizes as the polar cells expand and the Hadley cells contract. The effect is that the polar temperatures extend farther south (in the Northern Hemisphere, north in the southern hemisphere) and as the cold air moves toward the equator the temperature gradient increases. This does not have to happen in both hemispheres at the same time or with the same severity and, probably, most of the time it doesn’t. The effects on the North Atlantic are particularly severe since the reorganization of the atmosphere causes the NAO (North Atlantic Oscillation) to be in nearly a perpetually negative state due to a weakened polar vortex and an expanding polar cell. Because the cooling does not occur across the globe at the same time or with the same severity, many observers have erroneously concluded that Bray lows are regional and not global.
The connection between solar variability and climate change is so obvious, it is hard to explain why so many scientists deny it. In the 20th century solar activity increased and the sun became very active by historical standards and all direct measurements of the sun’s activity are from this period or later. However, during the Maunder minimum virtually all solar activity stopped and the world became very cold as a result. Javier quotes the following from John Eddy, 1976, this is the last sentence in his 1976 paper in Science entitled “The Maunder Minimum:”
“The reality of the Maunder Minimum and its implications of basic solar change may be but one more defeat in our long and losing battle to keep the sun perfect, or, if not perfect, constant, and if inconstant, regular. Why we think the sun should be any of these when other stars are not is more a question for social [science] than for physical science”
The EPTG defines the state of the world climate on a scale between Extreme Hothouse and Severe Icehouse as can be seen in figure 5 from Javier’s essay, originally from Scotese here. The term Icehouse means a time when a thick permanent icecap cover either the North Pole or the South Pole as we see today. The term hothouse refers to a time when both poles are ice free and tropical plants are growing at both poles.

Figure 6 (source: Scotese, here)
The pole-to-pole temperature curves represent the average global temperatures shown on the right of the figure, currently we are in the severe icehouse state because of the very cold temperatures in Antarctica. We lie between curves 6 and 7 on the left side of figure 6, and today´s global mean temperature is ~ 14.5°C.

Figure 7 (source: Scotese here)
In figure 7, Dr. Christopher Scotese has used available geological evidence to determine the climatic state of the Earth over time. The “normal” climate of the Earth is cooling greenhouse to warming hothouse with an average temperature of about 20°C, at this temperature there are no permanent ice caps and life thrives at the poles. Icehouse conditions, such as we live in today, are relatively rare in Earth’s history and have occurred only four times since complex life evolved in the Cambrian. In these periods, the temperature curve in figure 7 moves into the blue area. The three main cold periods are in the late Ordovician, the late Carboniferous and early Permian, and now. There is a fourth at the end of the Cretaceous, caused by a large bolide impact that ended the Cretaceous, but it was short lived. The cool period at the boundary between the Jurassic and the Cretaceous is not thought to have reached icehouse conditions. Dr. Scotese has shown the impact of a 5°C increase in temperature (the IPCC worst case scenario) from todays temperature (labeled 2016) of 14.5°C at the right end of the graph. As you can see 5°C only takes us back to the Earth’s average temperature for the Phanerozoic. This final point is hypothetical only. It is hard to see, but the preindustrial temperature of 13.8°C is identified in figure 7 as well, recent warming to 14.5°C is hardly noticeable at this scale.
The abbreviations in figure 7 are: PETM – the Paleocene-Eocene Thermal Maximum, EEOC – Early Eocene Climatic Optimum, MECO – Mid-Eocene Climatic Optimum, EOT – Eocene-Oligocene Transition, MMCO – Mid-Miocene Climatic Optimum, LGM – Last Glacial Maximum. The PETM was an unusually warm period 50 million years ago when palm trees grew in the Antarctic and Arctic. During the EOT, the permanent Antarctic ice cap began to grow, it was complete by 12 Mya and expanded dramatically 5 Mya. There was no permanent Arctic ice cap 20 Mya and it grew in fits and starts until reaching a maximum around 19,000 years ago during the last glacial maximum.
Conclusions
The 2450-year Bray climate cycle is linked to a solar cycle of the same length. The cycle is related to wind patterns, changes in ocean currents, precipitation and global average temperature. The cycle appears to act on climate through changes in the stratospheric ozone content and pressures. The stratospheric pressure changes affect Tropospheric weather patterns. Evidence suggests that lows in the Bray cycle cause contraction of the Tropospheric Hadley cells and expansion of the polar cells, increasing the Equator-to-Pole temperature gradient. This results in decreasing global temperatures and changing wind and precipitation patterns. The North Atlantic region is affected most by these changes at Bray lows because they cause the North Atlantic oscillation to enter a persistent negative phase. This intensifies winter climatic effects, explaining why the Little Ice Age was more severe in this region than in the rest of the world.
The world is currently within the Quaternary Ice Age and nearly as cold as it has ever been. The normal average temperature of the world is around 20°C, some 5°C warmer than today. To keep recent warming in perspective, it is important to understand that even if the worse predictions of the IPCC were to occur, we would only be returning to the average temperature of the last 560 million years.
Thanks for this.
I hope that Dr. Scotese included the hypothetical, at best, “Post-Anthropogenic Warming” of 5.4 degrees C only as a sop to research grant paymasters.
Good post. Javier really should try to determine what solar frequency or frequencies varies with the proposed cycle, and how to directly measure it, as TSI apparently does not correlate well.
No he should not. If on-the-ground temperature measures do not show a correlation, why would it matter that one can find a wriggle in an elephant’s trunk?
https://publications.mpi-cbg.de/Mayer_2010_4314.pdf
Agreed, they “cycles” here are merely in the eye of the beholder. People who draw bars on fuzzy graphs are usually presenting non-existent peaks and troughs.
The other hallmark of false cycles is they ignore the ones where it does not work and there is no cycle.
Plus these “cycles” allegedly only toughs , not peaks and the amount of signal which can be accounted for by these wiggles is only few percent. Frankly it is very unscientific and mostly wishful thinking.
@ Greg
“Agreed, they “cycles” here are merely in the eye of the beholder”
It is a literal fact that “beauty is only in the eyes of the beholder”
And it is oftentimes an impossible task for said “beholder” to consciously explain his/her mental attraction to said “beauty”.
And the reason for that is, the prerequisites for determining said “beauty” are nurtured (learned) environmental data/info that is directly accessible to only one’s subconscious mind and whatever it was per se “programmed” to recognize as “beauty” …… is therefore beauty.
Just (consciously) ask yourself why you think things are “beauty” and others are not.
Generate two random strings of data, one noisy and the other with an 11 year filter, and correlations can be found. Wriggle matching is not science. It’s low hanging fruit by biased individuals looking for a match. Lack of plausible mechanism is why octogenerians are not considered to be the main driver of Gleissberg Cycles. Simply stating a perceived correlation without understanding the statistical limitations of wriggle matching two strings of data, one noisy the other not so much, is simply terrible work.
Please, take a graduate level statistics class! It’s worth every penny and will keep you from chasing fairies.
Pamela,
The sun is a variable star. Why should it not demonstrate cycles of longer than 11 or 22 years, extending back at least millions of years?
Strong evidence for the influence of solar cycles on a Late Miocene lake system revealed by biotic and abiotic proxies
https://www.ncbi.nlm.nih.gov/pmc/articles/PMC3617729/
As Andy notes, paleoclimatologists, ie real scientists, unlike so-called “climate scientists” recognize longer cycles. Even some solar scientists do, too.
While I prefer to stick closely to the current ongoing reconstruction of solar measures championed by Dr. Svalgaard, it is instructive to see what other solar experts are doing just so I do not make the mistake of not pursuing robust evidence. I provide a link below to a study not done by Leif.
So, yes our Sun is variable, but in rather predictive ways. It has a floor in which it appears to not sink below, and its variations appear cyclical for the purposes of human existance. There are other types of stars that are of course more variable than our Sun but who cares. As for our Sun, the premis of a “solar constant” remains. So I repeat my argument. Comparing noisy data to oscillating data is filled with type 1 errors: Finding correlation when there is actually none that are meaningful to the climate warming debate.
Conclusion: Javier has found a rotten egg, not the proverbial golden goose.
http://www.geogr.msu.ru/structure/labs/geos/personal/fedorov/Fedorov_AV_2012.pdf
No one said it “should not”. The question is whether it does and what proof there is.
Apparently you’re unaware that Dr. Svalgaard and his colleagues recognize the reality of the Gleissberg cycle of cycles, as indeed the conclusion that it exists is unavoidable.
Greg August 8, 2017 at 4:05 pm
The evidence of longer solar cycles is overwhelming.
Pamela,
Study relying on the IHV of Svalgaard, et al:
Signature of Hale and Gleissberg solar cycles in the geomagnetic activity
http://ruby.fgcu.edu/courses/twimberley/envirophilo/signature.pdf
Evidence for solar variability is just that and only that. If correlation can be found to measured effects or a mechanism for the variations put forth, then we have an hypothesis to be examined. The extension to absolute cause and effect cannot proceed until the variation is proved.
We barely even know the facts about past climate and thanks to clowns like Mike Mann we are actually getting stupider as time goes on. They are telling us that we will soon be falling over dead from temperatures that are no different from 1975!
Javier has written:
http://euanmearns.com/periodicities-in-solar-variability-and-climate-change-a-simple-model/
“The 87-year Gleissberg cycle also displays a high variability, and has been confirmed independently in aurora records since the fifth century AD (Feynman & Fougere, 1984), and in large solar proton events analysis (McCracken et al., 2001). The Gleissberg cycle is reported to affect the hydroclimate as this periodicity is frequently found in lacustrine varved sediments and flood records (Czymzik, et al. 2016). In Central Europe, flooding events appear to increase at the lows of the Gleissberg cycle.”
Joan Feynman, sister of Richard, has been active in this field, as indicated by the above citation.
Here is Dr. Svalgaard, et al. on the topic:
http://www.leif.org/research/On%20solar%20cycle%20predictions%20and%20reconstructions.pdf
Gloateus seems to think I dismiss the Gleissberg Cycle. Show us where I have dismissed it. I only commented that simple or tortured correlation with other cycles or trends does not verify a Gleissberg Cycle causation for climate trends. Read more carefully as I see you are blinded by your bias.
Pamela,
You asserted that there was no evidence for longer solar cycles, in that all were just wiggle-fitting statistical garbage.
I showed repeatedly that even the solar scientist with whose opinions you have fallen in love recognizes the Gleissberg cycle. How then can you so cavalierly dismiss longer cycles out of hand, when there is so much physical evidence for them?
Gloateus
August 8, 2017 at 2:35 pm
Pamela,
The sun is a variable star. Why should it not demonstrate cycles of longer than 11 or 22 years, extending back at least millions of years?
——————————————–
Fair enough question.
First, the 11 or 22 year cycles are established and primary demostrated in the observational data that go back some 2 or three centuries, and at the present when other data considered still in that case these cycles are validated by observational data.
Using other data apart from the observational data it shows that an application of methods to filter out and polish these data from the climate signal is required, even when short term data like the data for the last century are used…….where actually the climate signal is fairly well established too.
So exploring for a long term cycle (sun), it requires that the data used must be cleared and polished from the climate signal either in the case of the sun having or not an effect on the climate, so to speak.
otherwise the whole venture is simply a wild goose chase, where conclusions and results can be interpreted to the ones liking and ones preference or ones given position.
Now the only way to cheat these is by showing a strong correlation of the climate signal to an assumed long term Sun signal,which happens to be in this case not validated otherwise, where the correlation stands at the point of claiming that the Sun variation in question caused the climate change,
A rather circular logic and circular reasoning, worse than a simple goose chase.
So the “identified” signal in the data automatically is considered as a long term cyclic Sun signal, which must have caused the climate change.
So from a given signal (not really validated as due to the Sun) correlation of the data with climate signal, a determination of the Sun being the cause of climate change is reached and established, with no any other significant grounds , and from there on voila, any problem with the data being polluted by the climate signal does not matter and becomes insignificant, because you see, in long term the climate signal actually is the sun signal in the given data.
More or less that is what I think this blog post is all about, phony logical approaches…..circular reasoning, as always the case with these two guys……
You see I am not saying or claiming that there is no Sun long term cycles.
I do not know, and personally am not much interested at this point…..not yet, as there as far as I can tell, no much whatsoever between Sun variations, either long or short term, as far as climate and climate change concerned
cheers
Gloateus still asserts I do not think there is a longer term cycle and has failed to quote my words to that affect. My reference to the Gleissberg Cycle not being caused by octogenerians was a reference as to why the approximate 100 year minimum sunspot cycle has not been wriggle matched to implausible causes. It clearly was not an assertion that the Gleissberg Cycle does not exist. Though to be sure, there isn’t much of a data string of observations to support it as a theory yet.
Besides, this is an open peer review of the posted examination of research into the proposed Bray climate/solar cycle. Casting spurious and unsupported accusations is possibly a deflection tactic away from what is now understood to be a poorly reasoned post.
whiten – August 9, 2017 at 6:28 am
Beautifully stated, Whiten, especially given the fact all solar activity can only be described as being “randomly repeatable” within a given sized “window”, …….. with the “window’s” dimension being determined by the likes or whims of the viewer/investigator/researcher.
An “11 year solar cycle” that is “randomly repeatable” every nine (9) to twelve (12) years is not a “true cycle” and should not be used for making “specific” claims about past or future events.
The only “solar cycle” (excluding the Milankovitch Cycles) that directly effects the earth that is and has been steady, consistent, repeatable and measurable for thousands of years is the “seasonal solar cycle”, otherwise known as the “changing of the equinoxes” in the respective hemispheres.
And ps, Whiten, I consider your above noted statement ….. 100% appropriate for describing a majority of the claims concerning the evolutionary causes of the unique physical features of the member of the Family of Great Apes known as humans (Homo sapiens sapiens).
Their use of circular logic and circular reasoning to justify their “junk science” evolutionary claims and assertions really irks me to hi heaven.
Pamela,
I was going to let Andy answer you since he is a lot nicer than me and you are getting a little too personal for my taste, but since he seems busy I’ll have a go. As a groupie of Dr. Svalgaard I didn’t expect you to be fair, but I was expecting that before critizicing the articles you would read them or at least peruse them to see what kind of evidence they contain.
I have studied statistics at the University and used them professionally in experimental science ever since. It is my experience that the more statistics you need to demonstrate something the least likely, it is that it is real. If an essay comes out positive 19 tries out of 20 the statistics won’t tell you anything you already don’t know. If it comes out positive 14 tries out of 20, then you are in need of statistics. Probably that’s why Mark Twain used to say “There are lies, damned lies, and statistics.”
So now you think you can deal with the article saying that two random strings of data are likely to present correlations. What a fallacy to say something true that has nothing to do with the situation. We are dealing here with dozens of independent climate proxies obtained by different techniques and measuring completely different phenomena, from pollen to glacier advances, from cave speleothems to benthic foraminifera. And four different solar proxies that show a high level of agreement over the common periods. Now start to calculate the chances that all are going to show the same periodicity in phase.
Even more interesting are proxies assortments. Two studies use multiple proxies. Random noise gets squashed if you average enough proxies. That the cycle is displayed by them is a serious indication that it is real.
And the last and more important indication is that the collection of proxies that display the periodicity construct a coherent view of the regional climate phenomena most affected by the Bray climatic cycle. And you know what? It is the same regional climate phenomena that solar experts are finding affected by solar activity right now in atmospheric studies using observations, reanalysis, and models. What are the chances of that?
This type of global disqualification of the dozens of studies that find the Bray periodicity is characteristic of somebody that has his mind made up on the issue. And you know I can always learn more statistics, but it is doubtful that people with a closed mind will be able to open it up.
The following study speaks to the risk of finding spurious correlations between noisy and periodic data strings. I stand by my criticism. You have a long way to go before periodic solar and noisy climate robust cause and effect conclusions can even be intertained. As it stands, you haven’t a leg to stand on.
https://www.ncbi.nlm.nih.gov/pmc/articles/PMC4820721/
Pamela Gray, the article you site is a typical straw man argument. They set up what they intended to disprove and then, surprise! They disproved it. As Javier noted, the many lines of evidence, glacial terminations, forams, auroral records, cosmogenic isotope ratios, lake sediment cores, peat bog pollen records. ice core records, etc., etc. all agree on these cycles. To make your case, random statistical tests will not be conclusive. You need to show why at least some of these records are invalid. The cycles show up in too many different records and they match historical and archeological records too well. They exist, we need to find out why and work on the mechanisms. Javier has a good idea on the mechanism, but more work is needed to nail it down.
Then post data for every chart that you have personally checked.
Andy May,
Statisticians regularly employ random data to verify or substantiate suggested correlations or trends in data. If the hypothesized cycle can be found in random data, which by definition has no correlation, cycle or trend, something is wrong with the proposed theory. I would call that the opposite of a straw man argument. The paper provided by Pamela was extremely well written and the tests well designed by authors that have readily apparent expertise in this type of statistical signal analysis.
Javier,
I wish people wouldn’t just make up stuff about statistics. There are many different nuances to statistics that a couple of University classes won’t familiarize you with (especially stochastic variability analysis which is what this study is attempting). That’s why statistics and data science are fields unto themselves. Per your example, if I flipped a coin 20 times and got 19 tails, you claim that would tell me everything I need to know and I evaluate no further ? What would it indicate, pray tell ? Just making that decision (that I don’t need to know anything else based on “experience”) introduces huge human biases. Given that a neutral system (which coin tossing is expected to be) would on average result in 10 heads and 10 tails, the result of 19 tails begs for more statistics not less as you propose. 14 tails out of 20 is much closer to what would typically occur, and really isn’t of much interest, so you would recommend use of “more” statistics in that case, why ? To tease out some trend that doesn’t actually exist or is not statistically significant ? In the 1st example, maybe if we looked at the sequence, like if the first flip was heads and the next 19 tails, a causation phenomenon could be revealed. Maybe the coin landed on sticky stuff resulting in a bias in the weight of the coin from then on out.
Your comments that the use of random data to test a hypothesis of correlation is a “fallacy” shows your understanding of statistical analysis methods is not at all broad. Also your assumption that with multiple proxies, random noise would be cancelled out, thus proving said point, is not a convincing one. Statisticians know that data can have noise without it being anywhere near random. This type of correlated noise does not “cancel out”. Measurement of Earth processes by nature, or definition, will have variation (noise) that is tied to phenomena other than what is being studied and will introduce cyclical biases that do not come out in the wash by averaging. Rather, they are additive and if overlooked, a proposed cause and effect relationship just doesn’t hold up to statistical scrutiny and can’t be considered valid.
Running 5000 RW series and finding one that looks like a specified proxy results is not ‘proof’ that the proxy was caused by a RW series. It certainly is not any kind of disproof that the underlying proxy was caused or influenced by one or many confounding and concurrent deterministic processes.
Steven Mosher, the references discussing the evidence Javier and I cite are all linked in our posts and in the bibliographies we have posted, I shouldn’t have to recreate the bibliography here. Turner, et al. have such a narrow focus that it doesn’t address what Javier and I are writing about. They only address the shorter cycles (40 years to 400 years or so) which have weak statistics and tend to be weak themselves as they are modulated by the more powerful longer cycles. Then they limit themselves only to peat records, which are important, but only one of dozens of proxies. The paper really is irrelevant to what Javier and I have written. It always surprises me that we get such emotionally charged feedback on this topic, which is not controversial at all in the geological and archaeological communities.
I agree with Andy, the Turner et al., 2016 article is not representative and shows a significant bias.
They have gone to choose peat bog water table records, that are notoriously noisy and prone to spurious results, particularly in the low frequencies they concentrate, and to make matters worse they have chosen 90% of their records from a single type of proxy, testate amoeba, that is particularly noisy and unreliable. So it was not a study set to find out the reliability of climate proxies at the solar frequencies, but set to establish the unreliability by carefully choosing the proxies. On demand science to push CO2 hypothesis by poo-pooing alternative hypotheses.
Even then, they are only able to prove that the lower frequencies (<500 years) are affected by random noise. They find little effect for the 2500 year frequencies. A 2500 year biological cycle was first identified by Scandinavian botanists from pollen analysis in peat bogs, as you would know if you have read my articles.
The only thing that Turner et al., 2016 demonstrate is that peat bog water table records by testate amoeba are unreliable to establish <500 years periodicities. Something anybody knowledgeable of the field knew beforehand and that is the reason that subject was chosen. Any conclusions regarding longer periodicities or different proxies are unsupported by the evidence presented. Science on demand to push the dominant hypothesis of climate control by CO2 is a widespread problem, but has little to do with the issues at hand.
I would immediately throw to the garbage bin any article that has the term "climate sceptics" in it. Particularly if in the abstract as is the case of Turner et al., 2016.
Pamela Gray
August 8, 2017 at 6:19 pm
“….. the risk of finding spurious correlations……”
Pamela, you are falling for the “trick”. 🙂
The correlation in the main stand, the main correlation in long term is not spurious, maybe a little bit stretched, yes, but never the less good enough,
Is a correlation of two signals from different data, which actually confirm each other, as both happens to be climate signals actually, but Jav does play the trick by considering one of them as Sun imposed signal, because of the intent and methodology initially used in that kind of data, but actually that data is shown to be so much effected by the climate signal, where the main signal there found actually is more a climate signal than any thing else.
Hopefully at least I am understood at this point, and actually addressing your point as it may have being meant……by you.
cheers
Highcloud,
You can’t reject an entire subfield of science just because it doesn’t meet the standards of a different subfield. The difficult and special nature of climate proxy data is not being taken into account.
My knowledge of statistics is irrelevant here as I haven’t done ANY work on the issues discussed. The knowledge of statistics of the authors, referees, and editors is. It is difficult to imagine that several dozens articles that I have cited are all statistically inadequate. It is one of these bogus claims that are raised when someone is opposed to one idea and wants to shoot it down. I am the messenger here. The idea that solar variability has a disproportionate effect on climate and has left traces of cycles in the paleoclimate record cannot be shot down.
I’d like to meet that person that got 19 tails out of 20 throws at the first try. Do you happen to know him/her?
Only because there is no such thing as a digitally produced set of random numbers.
I have saved most if not all of Xavier’s articles (posted on WUWT and Climate etc) in my references files.
If the average temperature of the world over the ages is 5 degrees C above its present value…
then that 2 degree C tipping point is TOTAL BULLCRAP !
And , IMHO…it is.
There’s really one reason. Solar variability cannot be important in climate change because that contradicts CAGW.
I don’t recall anyone saying they “think solar variability cannot be important ” in criticising his articles. But since you don’t quote what you are trying to argue against we will never know.
Most criticise his methods and the ( lack of ) evidence of whether there is a detectable cycle.
The motivation appears to be : if I can establish there is a solar signal, the sun is going quiet and things will cool down and that piss off the warmists.
It seems like strongly motivated attempts to establish a desired result. ie basically what the AGW bed-wetters have been playing at. That is why it is not well received.
Andy cites the two main reasons, both of which have been advanced here.
Dr. Svalgaard has advanced the first argument, ie that cosmogenic isotopes can’t be used, for the reasons Andy mentions.
The other reason, ie that the sun’s output is too constant to account for climate change, has also been used by Dr. S and others here.
…and you have issues with the veracity and indeed robustness of that critique???
Greg, many have stated solar variability is not important. It is a key conclusion of the IPCC’s AR5 report.
And that shows how absurd those critics are. There are no new data nor new analysis in my articles, so my methods are non existent. I am just presenting and putting together results from different scientific articles to offer a coherent view.
So by criticizing something that does not exist (my methods), the critics are really showing that their problem is their bias.
Regarding the evidence, it has been deemed adequate for publication by expert reviewers, and has not been questioned after publication, and that is good enough for me. In science you accept published data unless you have evidence that there is something wrong with it. Rejecting data because it doesn’t fit your hypothesis is not acceptable.
Pamela Gray August 8, 2017 at 4:57 pm
Absolutely. Andy’s analysis destroys both bogus arguments.
Javier, There is no data PEROID in anything you post.
A guy like Greg wants to check your work. If your work is just cutiing and pasting graphs, then its not worth much.
A guy like greg will want the data.. the numbers. the files of numbers you checked.
Merely summarizing various papers is like a wikipedia version of science.
Stephen Mosher, review papers and posts, which are summaries of previous work are common in the literature as you should know. Javier and I are doing this because many climate scientists are oriented toward the physical sciences and engineering and have no training or understanding of earth science or paleoclimatology. Due to this lack of training they often miss the forest for the trees. We should not have to do this, you guys should have already studied paleoclimatology since you are trying to predict climate centuries in the future. But, it is what it is and someone needs to point out and present the decades of research done by very qualified earth scientists and published in journals like Nature and Science that have been done on past climate changes. Why what we write is still controversial given the hundreds of well known papers that Javier and I have cited is beyond my understanding. I understand looking for the physical mechanism for climate change is important, but understand basic climate change over many millennia is also important and too often ignored. Both are necessary and important fields of study.
Steven,
I couldn’t care less what you or Greg want, or your or Greg’s opinion on my articles.
If you don’t trust my representation of published evidence go to the original articles.
I am not taking requests for unpaid work currently.
You’re fighting a phantom foe. No one here said solar variability is not important. But if you talk to a scientist specializing in radiation, who knows how the energy of the sun is reflected and absorbed at different wavelengths through the various levels of the atmosphere, he will tell you that increases in solar output don’t directly result in increased earth surface temperature. The effect of a hotter sun could be completely negated by more ice, sand, high clouds, or other reflective surface to bounce the radiation back out to the cold stratosphere. The same is true if there were fewer heat modifying gas particles in the lower atmosphere to hold the heat near Earth’s surface, or less ocean water to absorb heat. Meaning no the sun isn’t the dominant factor because it’s effect is highly modified by a number of variables. And the fact that the stratosphere (atmospheric layer closer to the sun) is cooling as we experience higher surface temperatures indicates the sun is not the entity adding heat to the system now. An atmospheric radiation scientist is a climate scientist and a “real” scientist. He can calculate what the effect of increased solar output, in Watts/m2, would be at the Earth’s surface, and if it is enough in itself to heat the planet up by 2° or 5° or whatever under the cyclical conditions at hand (it’s not). The “so called scientist” accusation does nothing for your argument, and is so uninspiring. Yawn.
Not sure who you are replying to, but other real climate scientists are investigating mechanisms other than TSI by which solar variability impacts the climate, and they have made very good progress in the past decade and a half. A good introduction could be:
Gray, Lesley J., et al. “Solar influences on climate.” Reviews of Geophysics 48.4 (2010).
http://onlinelibrary.wiley.com/doi/10.1029/2009RG000282/full
So it will be a question of what scientists are right, as it always is.
Well then ,that’s settled ,we don’t need the sun to heat the earth ,so lets take it away ,shut it down if we can as we don’t appear to need it.&let us see what happens to our ‘heat ‘.Where will it come from? .Will it suddenly be produced from all these other’ modifying factors’???
Careful not to play by their rules……..
…and yet the author has so far not been able to detail a plausible mechanism for his supposed connection. So pray tell, what is the “obvious” mechanism the author preceives to be at play here?
Pamela, Javier is not proposing a mechanism. But, the correlation between the Bray climate cycle and the solar cycle of the same length and phase is obvious. The actual mechanism has not been found yet, to be sure.
Part C deals with a possible mechanism. Read it.
“There is evidence that the sun is the cause of the Bray cycle, if the mechanism is not a change in TSI, it could be a change in UV radiation, which can vary as much as 100% in one 11-year solar cycle, or some other solar cause such as variability in the Sun’s magnetic field strength.”
the argument is it could be unicorns.
Latitude-height cross section of zonal mean zonal wind in the Southern Hemisphere
The contour interval is 5 m/s.
http://ds.data.jma.go.jp/tcc/tcc/products/clisys/STRAT/gif/zu_sh.gif
Latitude-height cross section of zonal mean temperature in the Southern Hemisphere
The contour interval is 5 °C.
http://ds.data.jma.go.jp/tcc/tcc/products/clisys/STRAT/gif/zt_sh.gif
In his part C Javier says this:
“Solar activity goes to minimum values at the SGM and the changes in the stratospheric ozone, temperature and geopotential height induce an atmospheric reorganization characterized by the weakening of the stratospheric polar vortex, the progressive expansion of the polar cells and the contraction of the Hadley cells, and as a result a steepening of the EPTG that increases the amount of heat lost by the planet. This reversible process of atmospheric reorganization is cumulative and proceeds very slowly. This explains why the 18th century, with a solar activity level similar to the 20th century had a different climate. The 20th century expansion of the Hadley cells and reduction of the EPTG were built upon the levels reached over the previous two centuries.”
That is the mechanism that I have been proposing for the past seven years save that Javier thinks that a quiet sun steepens the gradient of EPTG rather than actually reducing the gradient so that the tropospheric polar air masses are no longer pushed so far poleward and can start to break out towards the equator in more meridional jet stream patterns.
The concept is a bit counterintuitive but let me try to explain.
An active sun reduces ozone above the poles which cools the polar stratosphere, the tropopause rises and the rate at which air descends through the polar vortex in the stratosphere increases (colder air being denser and heavier) which represents a strengthening of the stratospheric polar vortex but at the same time the colder air allows the height of the tropopause to RISE. The rise in the tropopause height above the poles alters the EPTG so that the global air circulation can shift poleward producing more zonal jet stream tracks, less global cloudiness, more sunlight into the oceans and a warming planet.
The process is reversed when the sun is inactive.
I think Javier has confused the stratospheric polar vortex which is descending air above the pole with the tropospheric polar vortex which is rising, buoyant air flowing around the pole.
At a time of quiet sun the descending stratospheric polar vortex weakens and the reduced downward flow introduces warmer air above the tropopause (by virtue of increased ozone production in the mesosphere and upper stratosphere-which has been observed) so that the polar tropopause is then pushed DOWNWARD and the tropospheric polar vortex which flows around the pole is pushed more towards the equator and begins to flow in a more meridional fashion with increased global cloudiness.
The opposite when the sun is active.
Javier is getting close to the reality but is not quite there yet 🙂
To summarise:
i) An active sun reduces ozone above the poles so as to cool the descending air in the stratospheric polar vortex which strengthens that vortex but the colder air in the straosphere allows the tropopause to rise above the poles and the global air circulation systems shift poleward with reduced global cloudiness, more sun into the oceans and warming.
ii) The opposite if (i).
That explains why stratospheric warmings are observed to occur more often when the sun is quiet with a consequent increase in the frequency of outbreaks of polar air flowing towards the equator as was seen in the UK in December 2010.
Such stratospheric warmings have long been associated with equatorward outbreaks of polar surface air.
Steven, this might be a little bit over your head, but the solar effect on the stratosphere is found to be biggest in the northern hemisphere mid-late winter. The agreement is very good with the perturbation of the solar vortex and the frequency and occurrence of winter blocking days over the Atlantic. This is all published. The proposed mechanism for such selective effect on climate from small changes in solar output is:
Planetary-scale Rossby waves (planetary waves) are forced in part by land-sea contrasts and surface topography. These waves propagate vertically and meridionally into the winter stratosphere, but are evanescent in the mean easterly winds of the summer hemisphere. The NH has much greater land-sea contrast and larger mountain ranges than the SH, resulting in larger amplitude tropospheric planetary waves. Consequently the northern winter stratosphere tends to be much more disturbed by planetary waves than the southern winter stratosphere. Large-amplitude waves can rapidly disrupt the northern polar vortex, even in midwinter, replacing westerly winds with easterly winds at high latitudes and causing the polar stratosphere to dramatically warm. In the NH the planetary waves are just large enough for midwinter sudden warmings to occur some years but not others. Thus the northern stratosphere is sensitive to the effects of vertically propagating planetary waves, resulting in large interannual variability in the strength of the polar vortex. It appears that this sensitivity to the upward and equatorward propagation of planetary waves allows the equatorial QBO to influence the polar stratosphere by modulating the flux of wave activity.
From Baldwin et al., 2001 review on the Quasi-Biennial Oscillation.
I have not yet introduced the QBO in my series, but I will. In the meantime you can educate yourself or continue dreaming with unicorns.
Steven Mosher and Pamela Gray: The lack of a solid, simple physical mechanism does not invalidate a correlation. The whole of geology is based on correlations, the correlations are often established decades before the mechanisms are uncovered. Case in point, regular cycles in sediments were recognized over one-hundred years ago. Some were on ocean margins. Yet the mechanism for them was not uncovered until Peter Vail and Robert Mitchum showed us all that sea level changed over time causing the oceans to encroach onto land and recede in a rhythmic way, eustatic sea level change. Seeing and mapping the pattern and correlating it to other patterns is at the root of the geosciences. You surely are not denying the usefulness of geology and the other earth sciences are you? Continental drift was discovered by correlation in the 1920’s, plate tectonics (the mechanism) was not uncovered until the 1970’s. There are many examples.
Recognize the value of Javier’s work pulling all of this disparate data together. Once he is done, discovering the mechanism will be easier. And, in the meantime, he is showing how silly the idea that CO2 controls the climate is.
The ignorance of earth science among the climate science community is much larger than I would have thought.
Figure 7 is not even close.
What is wrong with figure 7? This is Dr. Scotese’s latest reconstruction.
Did you get his data and check his methods, or just steal the chart
Careful, Mosh. You’re starting to sound like some of the numbskull commenters you often criticize.
Claiming the chart was stolen is a numbskull comment. Mosher, you haven’t contributed one thing to this thread with your comments. If you can’t do better than that, why don’t you just keep quiet. Who needs your snide remarks?
My main issue with the graph is his inclusion of a projected “post anthropogenic warming” on a reconstruction of Phanerozoic temperature. I also don’t like the inclusion of acute climate diversions like the K-T impact winter on what is otherwise a very low resolution reconstruction.
Robert W. Turner,
Dr. Scotese has written a monograph on the Phanerozoic reconstruction, the title is “Some Thoughts on Global Climate Change: The Transition from Icehouse to Hothouse.” Link:
https://www.academia.edu/12082909/Some_thoughts_on_Global_Climate_Change_The_Transition_from_Icehouse_to_Hothouse
I refer you to it for the details, but I can summarize some points here. The pdf has an extensive bibliography that warrants some exploration as well as many notes on the details that went into the reconstruction. I kind of agree with your that the addition of “post anthropogenic warming” was a bad idea. Dr. Scotese doesn’t really say why he added that in the text that I saw. He should probably take it out.
As for the KT Impact winter, there is a lot of geological evidence supporting that event. He kind of has to include it.
Read especially the footnotes, which begin on page 42, they are very informative. Footnote 3: “The current icehouse world is thought to be especially severe because both poles are covered by ice.” Normally only one pole is glaciated.
“auroral records which are related to solar activity, but not to climate”
The most persistent negative NAO period of the Dalton Minimum 1807-1817 had no aurora sightings for most of those years. Page 11:
https://sci-hub.cc/10.1029/92RG01571
“The effect is that the polar temperatures extend farther south (in the Northern Hemisphere, north in the southern hemisphere) and as the cold air moves toward the equator the temperature gradient increases.”
Increased negative NAO drives a warm AMO, and increases warm humid atmospheric incursions into the Arctic. How could the temperature gradient increase when the Arctic is warming faster than the rest of the hemisphere?
The warm AMO is due to a reduced contribution from fresh cold subpolar gyre waters caused by the reduction in westerlies. The NAC gets warmer but carries less water. At the same time the atmosphere is getting cold. This contrast causes increased winter snow precipitation over the Arctic. As the Arctic gets colder, but the Tropics feel less effect the temperature gradient increases. The bibliography for this is in the articles.
As the Dalton minimum, one has to be careful when extracting conclusions. It was not a solar grand minimum and a big part of the climate effects felt at the time where due to the very unusual volcanic activity.
“As the Arctic gets colder..”
Not during a warm AMO it won’t. The warm AMO is primarily driven by negative NAO states, and a warm AMO warms the Arctic every time. So negative NAO regimes warm the AMO and Arctic and reduce the pole to equator temperature gradient, as we have seen since 1995.
“At the same time the atmosphere is getting cold.”
What during a warm AMO?
“As the Dalton minimum, one has to be careful when extracting conclusions. It was not a solar grand minimum and a big part of the climate effects felt at the time where due to the very unusual volcanic activity.”
It was a solar minimum, and it would take a warm AMO to drive the sea ice loss 1815-1817. Such eruptions don’t have a negative effect on NW Europe winter temperatures, if anything the big eruptions tend to follow the colder winters.
This has all been modeled and studied mainly for the Maunder period. During a deep solar minimum the warming associated to the AMO is small and localized, while the cooling associated to the NAO is large and distributed. The end result from a global perspective is an increase in the meridional temperature gradient.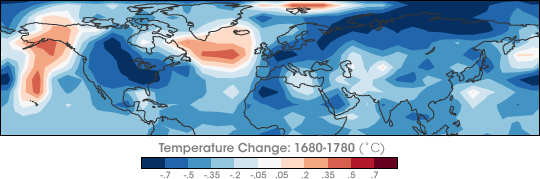
“The impact of the solar minimum is clear in this image, which shows the temperature difference between 1680, a year at the center of the Maunder Minimum, and 1780, a year of normal solar activity, as calculated by a general circulation model. Deep blue across eastern and central North America and northern Eurasia illustrates where the drop in temperature was the greatest. Nearly all other land areas were also cooler in 1680, as indicated by the varying shades of blue. The few regions that appear to have been warmer in 1680 are Alaska and the eastern Pacific Ocean (left), the North Atlantic Ocean south of Greenland (left of center), and north of Iceland (top center).
When the model started with the decreased solar energy and returned temperatures that matched the paleoclimate record, Shindell and his colleagues knew that the model was showing how the Maunder Minimum could have caused the extreme drop in temperatures. The model showed that the drop in temperature was related to ozone in the stratosphere, the layer of the atmosphere that is between 10 and 50 kilometers from the Earth’s surface. Ozone is created when high-energy ultraviolet light from the Sun interacts with oxygen. During the Maunder Minimum, the Sun emitted less strong ultraviolet light, and so less ozone formed. The decrease in ozone affected planetary waves, the giant wiggles in the jet stream that we are used to seeing on television weather reports.
The change to the planetary waves kicked the North Atlantic Oscillation (NAO)—the balance between a permanent low-pressure system near Greenland and a permanent high-pressure system to its south—into a negative phase. When the NAO is negative, both pressure systems are relatively weak. Under these conditions, winter storms crossing the Atlantic generally head eastward toward Europe, which experiences a more severe winter. (When the NAO is positive, winter storms track farther north, making winters in Europe milder.) The model results, shown above, illustrate that the NAO was more negative on average during the Maunder Minimum, and Europe remained unusually cold. These results matched the paleoclimate record.”
https://earthobservatory.nasa.gov/IOTD/view.php?id=7122
For a more clear image on the effect on the meridional temperature gradient see figure 3 from:
https://www.semanticscholar.org/paper/Modelling-the-Late-Maunder-Minimum-with-a-3-dimens-Fischer-Bruns-Cubasch/0514e31c6882949fef366a9594eae85b5a478b38/figure/1
from:
Modelling the Late Maunder Minimum with a 3-dimensional OAGCM1
http://www.hvonstorch.de/klima/pdf/ifb.2003.pdf
I don’t think what we have seen recently can be compared with what happens during a deep solar minimum.
“as calculated by a general circulation model”
Looks like GIGO, negative NAO drives a warm Greenland. Even in summer persistent negative NAO can drive strong Greenland and Arctic warming events, like in summer 2012.
“I don’t think what we have seen recently can be compared with what happens during a deep solar minimum.”
I don’t see why not, Greenland was very warm around 1200 BC and 2200 BC.
The inverted response by Greenland to reduced solar forcing is well known. I explained it myself to Leif Svalgaard on one occasion. But Greenland is not the Arctic.
Takuro Kobashi is one of the leading experts on Greenland past climate. I think you should start by reading:
Kobashi, T., et al. “Causes of Greenland temperature variability over the past 4000 yr: implications for northern hemispheric temperature changes.” Climate of the Past 9.5 (2013): 2299.
http://www.clim-past.net/9/2299/2013/cp-9-2299-2013.pdf
Where he explains the difference between Greenland and Northern High latitudes temperature reconstructions, and in his NHL reconstruction the cooling at solar grand minima is obvious. You only have to look at the temperatures during the Wolf/Spörer/Maunder cluster.
Now if models don’t convince you, proxy reconstructions don’t convince you, and published articles don’t convince you we will leave this discussion for the next grand solar minimum, when we can discuss it with instrumental data.
“Therefore, it can be expected that stronger (weaker)
solar activity induces warming (cooling) in NH temperature,
and relative cooling (warming) in Greenland through positive
(negative) NAO.”
Which is at odds with Greenland being colder in the LIA.
And Kobashi claims the 20th century Greenland warming is largely greenhouse gas driven, despite rising GHG’s being modeled to increase positive NAO in IPCC circulation models.
What a mess.
No I cannot agree that a warm AMO cools the Arctic or cools the atmosphere, both are irrational.
You are grasping at straws to defend your postulate of the pole to equator gradient increasing due to low solar. Which is fully at odds with the fact that negative NAO/AO increases heat transport to the Arctic, both atmospheric and oceanic.
Curiously, the Kobashi reference given by Javier characterizes the relationship of Greenland summit temperatures to those in other global grid boxes as follows:
Thus if Greenland’s response to solar forcing is inverted, so is that in many other NH regions. That’s a strikingly peculiar feature for a globe whose long-term temperature variations ostensibly are largely “solar related.”
I fear that that the long-known see-saw of WINTER temperatures between Greenland and Northern Europe (http://journals.ametsoc.org/doi/abs/10.1175/1520-0493%281978%29106%3C0296%3ATSIWTB%3E2.0.CO%3B2) has been blown up into something far beyond its reach.
Javier says: “But Greenland is not the Arctic.”
But you already know that a warm AMO drives a warm Arctic:
https://wattsupwiththat.com/2016/10/07/evidence-that-multidecadal-arctic-sea-ice-has-turned-the-corner/
“…but from 1970 to 2000 the sun probably contributed less than 30% of the warming using a conservative solar reconstruction by Frohlich and Lean (1998). Using a different reconstruction by Willson (1997), the sun may have contributed as much as 50% of the warming. Even though we now have satellite measurements of solar radiation variability, these records are inconsistent with one another leading to multiple reasonable interpretations of long-term and short-term trends in TSI and solar activity. Thus, estimates of solar forcing and the impact of the sun on our climate vary from 30% to nearly 100%…”
The ‘nearly 100%’ is correct, when insolation is attributed as the exclusive top ocean layer heat source.
TSI was at a century level peak post 1980, driving temperatures up to recent historical levels.
http://lasp.colorado.edu/home/sorce/data/tsi-data/>TSI is the main and obvious solar influence on warming and cooling. The increased trend in solar activity since the Dalton minimum [Maunder too] is responsible for the increase in ocean heat content, sea surface temperature, sea level, and other climactic changes since then, including extreme events.
Below is the most recent historical TSI reconstruction. Some of the older cycles before 1885 will soon be re-evaluated and changed [higher] to http://arxiv.org/abs/1601.05397>incorporate the v2 SSNs.
http://lasp.colorado.edu/home/sorce/files/2011/09/TIM_TSI_Reconstruction-1.png
*******
Greg said
“The motivation appears to be : if I can establish there is a solar signal, the sun is going quiet and things will cool down and that piss off the warmists.
It seems like strongly motivated attempts to establish a desired result. ie basically what the AGW bed-wetters have been playing at. That is why it is not well received.”
My own unpublished solar research was and is a patient step-by-step approach without a predetermined outcome, driven by curiosity, not a desired result as accused, that did establish many results, the main one being the solar signal is linear and lagged, time dependent, and layered. That this research points to meager cooling that does piss off some types is one “fruit” of the research. Do the feelings of wrong-headed scientists trump the truth? I was also personally highly motivated, which helped. How could that be a problem? Thus far acceptance is happening as expected, considering entrenched ideologies.
Thanks Bob Weber. The differences from year to year in W/m2 are small, but cumulative. Over thousands of years, the fraction of the extra energy absorbed by the oceans grows and it makes huge difference. So for the IPCC models to ignore these changes is a crime. See figure 1 here: https://andymaypetrophysicist.com/detection-and-attribution-of-man-made-climate-change/
NAT is their assume natural variability, “Internal variability” is what they call the ocean cycles.
Many people, including me, agree with you that solar variability may account for most, if not all, long term climate change. Define “long term?” How long is that, we need more data to figure that out.
Prior to Javier’s work there were already a number of established climatologists who accepted a similar effect on the global air circulation during the course of a single solar cycle. However, those scientists always saw such changes as a short term phenomenon which averaged out across a single cycle leaving human influences on climate in control over the longer term.
Javier is now proposing a long term climate effect across many solar cycles which is exactly what I have been pointing out for ten years now and I have gone further in saying that when one realises that there is a consequent change in global albedo/cloudiness through changes in jet stream behaviour then ALL observed climate variations outside the Milankovitch cycles can be accounted for.
Furthermore, I have proposed a simple solar induced stratospheric ozone based mechanism which affects the gradient of tropopause height between equator and poles so as to produce the observed changes in global air circulation.
Javier’s emphasis on the EPTG is absolutely correct and simply mirrors what I have been telling you all for years past.
And yet on the ground temperature measures do not show a correlation to your ozone changes. Which is to say that even if you are correct (and I don’t think you are because the energy isn’t there in the extrinsic mechanisms you propose in face of a very powerful intrinsically variable planet in its own right), it don’t matter. The cause and effect is too small.
Pamela,
When ozone was decreasing the jets moved poleward and became more zonal with less clouds and a warming world.
Now that ozone has been recovering whilst the sun has been quieter, the jets are more meridional with more clouds and the warming has stopped.
The observed changes in cloudiness are sufficient in scale to cause the observed climate variations.
Therefore you are incorrect on both counts.
Peer reviewed link please.
The last resort of someone who has nothing to contribute.
“However, those scientists always saw such changes as a short term phenomenon which averaged out across a single cycle leaving human influences on climate in control over the longer term.”
Denying that the Sun had much to do with stark changes in the NAO through a single cycle in a solar minimum, and blaming it on volcanoes instead, despite a zero correlation between large tropical eruptions and negative winter NAO.
Volcanic effects mixed into a variable atmosphere is a sticky wicket. Global eruptions that keep pulsing sulfuric acid into the stratosphere can significantly dim solar irradiance for immediate temperature change. What is less well known is the affect on oceanic solar recharge which presumably could have longer term ENSO effects and may depend on which stadial/interstadial slope the eruption is timed to.
The solar dimming would drive El Nino conditions in the shorter term.
I do not claim any work. I am not a climate scientist. I am an interested reader of scientific works, capable of integrating multiple coherent results.
The problem is that most opponents of solar variability effect on climate are just venting their own ignorance. They haven’t read the relevant works. They reject entire fields because of an article. They demand an easy fact-like answer when science doesn’t work that way. They criticize articles they haven’t read. They are not aware they are doing worse than what they criticize.
Javier,
I think you underestimate the significance of your ‘integration of multiple coherent results’.
Such integration is ‘work’ in my view.
I am not a climate scientist but I have had a profound interest in weather and climate for some 60 years and have been a member of the Royal Meteorological Society since 1968.
I believe that you are broadly correct in your writings.
Stephen,
If I am broadly correct is because the scientists in charge of researching these issues are broadly correct, which is what should be expected.
My only goal is to make this scientific research available to anyone interested. This includes some scientists that concentrated on their work are not doing enough reading of what has been previously published.
Anybody that requires confirmation, clarification, or data should go to the originally published works, that are fully referenced.
Javier,
You go beyond what the other scientists referred to by you have said by proposing that the solar effects are dominant and are spread across multiple solar cycles.
The scientists in charge of researching these issues have never gone that far.
Stephen Wilde, thanks for your comments. Javier does suggest that solar effects may dominate climate change, but he is not alone in this thinking. There is one reference in the text of this post to an article by Willy Soon and the Connolly’s that suggests the same thing in a slightly different way. See here for a summary: https://andymaypetrophysicist.com/a-short-summary-of-soon-connolly-and-connolly/
Thanks.
There is only one way that it can work given that the polar vortex in the stratosphere is descending air not rising air.
If ozone were to increase uniformly around the globe when the sun is active as per the establishment view then the air coming down through the stratospheric polar vortex would warm, the tropopause above the poles would fall and the air circulation pattern would be forced equatorward when the sun is ACTIVE which is not what we see.
There is no doubt that ozone does increase in the lower stratosphere and above the equator when the sun is active but the effect must be reversed above the poles otherwise similar increases in ozone over the poles would force the tropopause down above the poles and prevent the fall in tropopause height above the equator from shifting the climate zones poleward and thereby offsetting the effect over the equator and the global air circulation would not shift at all, or very little.
It has been observed that ozone above 45km does indeed show an opposite response to solar activity to that seen below 45km.
Thus I must be correct.
The observed latitudinal shifting of the climate zones and the consequent changes in global cloudiness can only occur if the sign of the ozone response higher up above the poles is opposite to that occurring lower down and above the equator.
The reason that the two must be in opposition so that the net polar and equatorial effects are complementing rather than opposing one another is due to the fact that warmed stratospheric air due to more ozone above the equator involves a rising leg of the circulation in the stratosphere (the Brewer Dobson circulation) whereas cooled stratospheric air due to less ozone above the poles involves a descending leg of the circulation in the stratosphere.
The result is a seesaw effect whereby there are large changes in the gradient of tropopause height between equator and poles which is precisely Javier’s and Willie Soon’s point.
If it were not so then the polar effect would offset the equatorial effect but it quite simply and obviously does not.
I agree that the relevant interplay is tricky to envisage but I urge you all to think it through very carefully.
I can envisage no other practical solution to the conundrum presented by real world observations and my hypothesis does indeed tally with all that we observe.
Ozone distribution on the top of the stratosphere and in the lower zones over the southern polar circle.
http://www.cpc.ncep.noaa.gov/products/stratosphere/strat_a_f/gif_files/gfs_t01_sh_f00.png
http://www.cpc.ncep.noaa.gov/products/stratosphere/strat_a_f/gif_files/gfs_t50_sh_f00.png
Well I must be going senile.
I see graphs with unlabelled curves, references to yellow boxes that dont exist, and no obvious trends in anything, with a text that appears to refer to data other than that being shown.
Is this a test to see how gullible people are to swallowing bull dung as long as it sounds scientific?
Yes, you are. 🙂
You could try reading around the subject.
Leo, this is a summary of many posts. The most important of the previous posts are referenced in the first sentence. If you want more detail read the three posts by Javier. It is not “bull dung.”
Shindell’s 2010 paper says this:
“6.4. Climate Change
[164] Finally, the role of solar variability in climate change has received much public attention because reliable estimates of solar influence are needed to limit uncertainty in the importance of human activity as a potential explanation for global warming. Extensive climate model studies have indicated that the models can only reproduce the late twentieth century warming when anthropogenic forcing is included, in addition to the solar and volcanic forcings [IPCC, 2007]. The change in solar radiative forcing since 1750 was estimated in the IPCC [2007] report to be 0.12 W m−2, corresponding to an increase in TSI of 0.69 W m−2. A value of 0.24 W m−2 solar radiative forcing difference from Maunder Minimum to the present is currently considered to be more appropriate. Despite these uncertainties in solar radiative forcing, they are nevertheless much smaller than the estimated radiative forcing due to anthropogenic changes, and the predicted SC-related surface temperature change is small relative to anthropogenic changes.
[165] One thing that is very clear from this review is that enormous progress has been achieved in our knowledge and understanding over the past few decades. The topic has emerged from its beginnings of almost purely investigation of statistical relationships that were subject to substantial criticism to become a solid scientific field that involves both solar physicists and climate scientists. Indeed, even 20 years ago it would have been very unlikely that the collection of scientific fields represented by the authors of this paper would have collaborated on such a review.”
In reaching that tentative conclusion Shindell et al fail to realise that changing the length of the lines of air mass mixing around the globe by altering jet stream tracks is sufficient to alter global albedo/cloudiness enough to account for 100% of climate variability outside the Malkovitch cycles.
There have been a number of articles posted on this site concerning the effects of cloudiness changes.
Sorry, Milankovitch.
Try again. You posit the Sun is the ultimate cause of climate variation. Oceanic/Atmospheric teleconnections along with the basic water cycle produce clouds and make them go away. Your contention is that this sticky wicket is not intrinsic to Earth but is governed by a variable Sun. Steven, you are up against a multitude of confounding factors by failing to decisively rule out intrinsic drivers. It can’t be 50/50.
My contention is that the climate at any given time is a consequence of a top down solar effect and a bottom up oceanic effect so you are wrong again.
Sorry Pam, but if you cannot clearly get the fact that the Sun is the ultimate cause of climate variation then no one can help you.
The Sun holds 98.9% of the entire mass of our solar system, and as for your ‘intrinsic drivers,’ well, unless you are forecasting climate and weather (which you are not) then you should not be concerned with intrinsic drivers whatsoever.
My contention is that until you quit looking elsewhere for that mechanism (it is right in the skies darling) then you are not going to understand anything (much less factors) by continuing to ignore the obvious.
“during the Maunder minimum virtually all solar activity stopped”
If the sun had gone dark, I’m pretty sure people would have noticed and written about it.
I think you are correct, adding that when the sea levels drop, the oceans no longer transfer heat to the poles efficiently, increasing the temperature gradient keeping the hemispheres ice locked and the mid latitudes much warmer increasing cloud production. The effect on abledo do to increased ice content in the northern and southern latitudes and increased clouds along the equator reduced the total amount of energy being stored in the system and hench a steady state glacation.
Sorry that was supposed to be a response to Dr Deanster below.
IMUO ….. the article presents a lot of good stuff, but it suffers the same issue as the CAGW theory. It is the same for all previous article on a solar relationship to climate as well. The issue, everyone wants to roll out their physics, their explanation of detail before a “system” has been derived. CAGW people want us to believe that CO2 is the control knob based on a bunch of, IMO, irrelevant radiative physics, but as with this solar approach, they come up with physics and such first, and then try and create a system out of it.
The problem with climate science is that it adopted watts as the measure, and thus does not distinguish between specific interactions that make up the whole. I’ve never seen from anyone is a solar model that combines the different electromagnetic spectrums of solar interacting with the specific target and its impact on the system. For example, it is only short wave radiation that can penetrate and warm the depths of the ocean. UV interacts with the stratosphere. IR is heat and drives winds, about 50% coming to us from the sun directly, and the remaining 50% the result of energy transformation at the surface and in the depths of the ocean.
To my uninformed mind, the entire system is a combination of a roticery water chicken and a Sterling engine. The fuel for the engine is SW radiation heating the oceans. The regulator for the short wave is ALL clouds and particles in the atmosphere. Since water can store energy, the equilibrium equation is irrelevant, as energy can be sequestered or released and need never exist in any kind of equilibrium. Further, the sheer heat capacity of the ocean is so vast, a mathematical boiling point could never occur at the current heat supply rate. The combined IR from the roticery water chicken effect and release from the ocean is the work force, pushing the energy from the hot zone between 30N 30S to the cold zone north and south of 60N 60S. UV interacting with the stratosphere along with the ice at the poles act as insulators, with UV acting on the incoming end and the ice caps relating to the amount of heat in the system. When the system heats up, the cap melts to allow cooling. When it cools down, the ice prevents a loss of heat. The angle of incidence makes solar input to poles irrelevant, and thus the only important thing to observe is the energy primarily between the 30s and to a lesser extent the 60s. As for GHGs …. they are a reaction designs to cool the system, not warm it. Hence as the system warms up, increased evaporation (and release of CO2) leads to increased heat transfer away from the ocean (the heat port of the engine).
The overall temperature of the system is meaningless and for all practical purposes stay within a range capable by the energy received by the sun. Its the gradients that are important. Lots of them interacting affecting various regional temps in different ways across time.
And that’s my opinion, …. and in true CAGW fashion …. it is fact until someone disproves it. LOL!
See above
Dr. Deanster, I agree, good summary. in 1979, Newell and Dopplick published a paper making some of the same points. They noted (and it has not been disproved to my knowledge) that the temperature of the Earth is evaporatively buffered by the oceans and cannot exceed 30C. See here: http://journals.ametsoc.org/doi/pdf/10.1175/1520-0450(1979)018%3C0822%3AQCTPIO%3E2.0.CO%3B2
Rebuttals to the various cycle-skeptics:
Greg: “[Their] “cycles” here are merely in the eye of the beholder. People who draw bars on fuzzy graphs are usually presenting non-existent peaks and troughs.”
I am assuming you are referring to the Bray cycle here. You are ignoring the definitive statistical evidence supporting the cycle. Bray found a chi-square statistic of 28.6 (P<0.001). Usoskin’s Pearson’s coefficient was significant at the 10E-5 level. See the discussion here: https://wattsupwiththat.com/2016/11/24/the-bray-hallstatt-cycle/
The above answer also applies to Pamela Gray’s “Generate two random strings of data…” nonsense comment.
Pamela, Fedorov’s paper is a very good one, but has no relevance in this discussion. Many of your comments have no relevance, I get the impression you are throwing out comments at random. Many make no sense. Javier has ask if you read the post, did you? Your comments suggest you didn’t or you did not understand it.
There is no “solar constant,” the Sun is a variable star and it varies in intensity with time as all variable stars do. The magnetic field strength varies, TSI varies, many aspects vary. The question is how much and over what periods of time. In the following comment, you seem to want it to vary and not vary, you seem to be advocating both at the same time:
“So, yes our Sun is variable, but in rather predictive ways. It has a floor in which it appears to not sink below, and its variations appear cyclical for the purposes of human existence. There are other types of stars that are of course more variable than our Sun but who cares. As for our Sun, the premise of a “solar constant” remains.”
Which is it, constant or variable? If you can predict the Sun’s behaviour, over what period of time? If you can predict TSI, over what period of time?
Whiten: “More or less that is what I think this blog post is all about, phony logical approaches … circular reasoning, as always the case with these two guys……”
You will need to identify any circular reasoning that Javier and I have used. I don’t see any. The solar cycles are identified with cosmogenic isotopes, aurora records and sunspot reconstructions. The climate cycles are identified with ice core data, foraminifera records of various types, tree rings, peat bog recorded, historical records, archeological records, and glacial advance records and lake sediment records. Where is the circular reasoning?
Most of these comments seem to be an emotional reaction, either against me or Javier or maybe earth science in general, I’m not sure, I don’t know any of you personally, but from a scientific perspective your comments are mostly nonsense. In any case, the correlation techniques used in determining the longer term solar and climate cycles are all valid and peer reviewed in hundreds of papers, many published in Nature and Science (see Javier’s posts linked at the top of this post). These geoscience techniques are observational in nature, but form the foundation of the sciences of geology and archeology. The references are all in the past posts by Javier and myself, they are easy to find. The strongest statistics fall around the ~2450-year Bray climate cycle and the related solar cycle of the same length, these cycles are well established and you will have to work very hard to disprove their existence.
The main point I want to make is that these very well-established cycles were a primary cause of the Little Ice Age, one of the coldest periods in Earth’s history. We are now recovering from this climatic low and attributing natural warming out of such a low to man’s CO2 emissions is nonsense.
Folks, I was disappointed that at the onset, they mention cosmic rays, and then never return to cosmic rays again. Sun magnetism, mostly as per sunspots creates a shield for earth that blocks cosmic rays. Cosmic rays nucleate clouds.
So when the sun is quiet (like now) more cosmic come in, creating more clouds, reflecting more sun, and creating a cooling trend. Given thermal mass and ocean oscillations, particularly the Pacific Decadel Oscillation, a lag of 30 to 40 years is “normal”.
stock: The cosmic ray effect on climate is still a viable idea, but it needs more work and support before I completely buy into it.
Good to have an open mind.
Recent study from some high faluting university just this year “discovered” what many of us have know for a long time. Cosmic nucleates clouds. Actually Krill nucleate clouds, also, really, and radiation kills krill via absorption into Chitin.
well
right again
Javier and Stephen are saying what I find to be true analyzing my own data on minima.
In short, my data say that there is no man made climate change. Minima are not pushed up unnaturally by man. It is going down ever so slightly by a natural curve with 100% correlation.
The nature of the curve I found is consistent with a [current] 87-88 years Gleissberg cycle.
The only point where we seem to differ is the ozone. It is not only ozone being formed TOA. Above the oceans peroxides are formed preferentially to ozone, doing exactly the same thing as ozone: protect us.
Therefore, there never was an ozone hole…
Also we have N-oxides being formed TOA.
low magnetic activity of the sun =.> more energetic particles able to escape – chi-square distribution of energy from the sun shifts [ but the surface underneath the distribution stays more or less the same]
=> more ozone, more peroxides and more N-O formed TOA..
You know the rest …. or not.
I have spent a bit of time looking for a current reference to the 2400 year climate cycle (aka Bray Cycle) and can’t find one. I found old ones but current solar reconstructions put these papers into old theories trumped by new theories round files. So I am going to pull a W. on the proponents of the post. Find your best article 2013 or better that uses current climate and solar reconstructions/proxies and show us the 2400 year cycle. Why do I insist on a current date? Robustness factor.
Andy and Javier’s work from 2016 and 2017 doesn’t count in your book?
What’s wrong with the Hallstatt Cycle paper from 2012?
https://www.ncbi.nlm.nih.gov/pmc/articles/PMC3617729/
And its Gleissberg Cycle follow-on from 2013?
https://www.ncbi.nlm.nih.gov/pmc/articles/PMC3568686/
Pretty hot for a geoscientist, to whom no offense.
http://usp-br1.academia.edu/AndreaKKern
A lot of work on the Hallstatt cycle has been done in Russia, such as this 2016 paper:
https://link.springer.com/article/10.1134/S0016793216040150
Andy and Javier are in good company, colluding with Russians!
PS:
It took very little time to find these and other recent references.
Pamela: Javier’s posts, linked at the top of my post, are the best and most up-to-date. I recommend them. Also this one, by both of us: https://wattsupwiththat.com/2016/11/24/the-bray-hallstatt-cycle/
Of course, you will need to read the references. The statistical work by Usoskin (2016) and Steinhilber (2012) might be of special interest.
Must I repeat? I requested that you, “Find your best article 2013 or better that uses current climate and solar reconstructions/proxies and show us the 2400 year cycle. Why do I insist on a current date? Robustness factor.” Please provide a link to a peer reviewed journal abstract or paper, not your own. Saying there are hundreds does not fulfill the request.
Solar activity with Bray (aka Hallstatt) periodicity:
McCracken, K. G., et al. “A phenomenological study of the cosmic ray variations over the past 9400 years, and their implications regarding solar activity and the solar dynamo.” Solar Physics 286.2 (2013): 609-627.
With 4 of the best well known scientists working on solar activity reconstruction: McCracken, Beer, Steinhilber, and Abreu.
Usoskin, I. G., et al. “Solar activity during the Holocene: the Hallstatt cycle and its consequence for grand minima and maxima.” Astronomy & Astrophysics 587 (2016): A150.
https://www.aanda.org/articles/aa/full_html/2016/03/aa27295-15/aa27295-15.html
Usoskin is another one very well known scientist working on solar activity reconstruction
Climate main periodicities (1000, 1500, and 2400) the last one being the Bray cycle:
Khider, D., C. S. Jackson, and L. D. Stott. “Assessing millennial‐scale variability during the Holocene: A perspective from the western tropical Pacific.” Paleoceanography 29.3 (2014): 143-159.
http://onlinelibrary.wiley.com/doi/10.1002/2013PA002534/full
You don’t think Usoskin over-paramaterized his method? I do. He took out everything but the kitchen sink and probably added spurious signals in the process. The result? This is not observational data, it is reanalyzed and partially modeled data. Not a strong case for the cycle but a good one for the elephant’s trunk.
“We used records of the 14C and 10Be cosmogenic isotopes, current numerical models of the isotope production and transport in Earth’s atmosphere, and available geomagnetic field reconstructions, including a new reconstruction relying on an updated archeo- and paleointensity database. The obtained series were analyzed using the singular spectrum analysis (SSA) method to study the millennial-scale trends.”
Khider et al couldn’t come up with a driver. So no solar/climate thing there you can hang your hat on.
Holy ghost! McCraken and the barycenter!! Not touching that one.
Typical tactic. I’ve seen it before. After requesting the articles you declare they don’t fit your criteria so they can be safely ignored. I really, really hope you are not a scientist. I don’t know why I still bother. I really don’t give a hoot about what you believe.
Khider et al., 2014 provide the periodicities as requested. Now are we moving the goal posts? Do they have to provide definite proof of solar variability effect on climate to your complete satisfaction? Impossible requests are a tell tale of fallacious argumentation.
Pamela Gray, I think we have answered all of your questions adequately. You have clearly shown you have no interest in the science, have made up your mind, and cannot be swayed by data or logic. I don’t know what sort of problem you have, but there is nothing we can do to help you. Give it a rest and go bother someone else.
Look fellas, I know good research when I see it (and have published my own research in a major journal-granted it was a one hit wonder), but I don’t see good research here. Nor do I see your references as being solidly behind your premise. I am afraid it is you that shows your lack of research acumen. I remain unconvinced.
Usoskin et al. provide a truly rare example in paleoclimatology of using incisive signal analysis methods to examine their proxy data. They write of Figure 7:
Yet, when one examines Figure 7, it becomes clear that this high, in-phase coherence extends scarcely beyond ONE CYCLE of such periods. Overall, it resembles not at all the wavelet coherence of pairs of records that are strongly causally connected! Those invariably show a CONSISTENTLY HIGH coherence and a STABLY FIXED phase instead of variable values over the entire span of record.
One can only conclude that the authors are novices in interpreting the results of advanced, rigorous analysis.
Dergachev, V. A., Raspopov, O. M., & Vasiliev, S. S. (2000). Long-term variability of solar activity during the Holocene. In The Solar Cycle and Terrestrial Climate, Solar and Space weather (Vol. 463, p. 489).
Link
Same data, different analysis, same result. These authors use an assortment of statistical techniques.
This is silly. This analysis has been done dozens of times for the past 50 years and it always returns the same result. Yet the wisecracks at the blogosphere coming from different backgrounds and with no experience in the type of data being analyzed think they know better, and can rewrite science in a blog.
Dergachev et al. analyze only the radiocarbon data, but provide no results on its coherence with Beryllium isotopes, as done by Usoskin et al. What’s ultimately silly is strident literature reviewers who have never done the science who fail to grasp the analytic basis of the criticism being made. And then they try to cover their glaring fundamental lapses by projecting the critics as mere “wisecracks at the blogosphere coming from different backgrounds and with no experience in the type of data being analyzed.” Try looking in the mirror some time.
Perhaps because intensive reading of the literature provides for a more ample view of the different methodology used by multiples authors over a very long period of time yielding consistent results. Something that completely escapes those criticizing a single work and rejecting the evidence and conclusions of many. At least I give a lot more credit to the scientists that dedicate years to research the issues about which they write, over my own casual interest. Just the opposite of commenters that think they know better just by dedicating 15 minutes to the question.
Unfortunately, little presented here constitutes a truly “ample view of the different methodology used by multiples authors over a very long period of time yielding consistent results.” Rather than clear and convincing scientific evidence–which speaks for itself–there’s a mélange of ambitious contentions based on mere scraps of evidence all-too-tendentiously interpreted.
There very well may be relatively broad-band climate variations in the ~2.5 kyr range that may be solar related. But that attribution is by no means convincingly established here. My comments merely point to the tip of the iceberg of glaring inconsistencies endemic in the paleo literature. They are indeed apparent within minutes to those professionally experienced in analyzing geophysical data. But those who lack such experience mistake the quickness of that recognition for the duration of “dedicating [time] to the question,” I certainly make short shrift of that…
Please learn to try harder Pamela Gray.
Here you go, and the aka ‘Bray Cycle’ is actually the ‘Hallstatt Cycle’ for your information.
https://andymaypetrophysicist.com/the-bray-hallstatt-cycle/
Andy May: Bray climate cycle and the solar cycle of the same length and phase is obvious.
Any two independent (of each other) but autocorrelated (within each) series will likely display an obvious correlation. Consequently, obvious correlation of two (quasi-) periodic sequences is not sufficient evidence that they are causally related. For another reference, check out “Analysis of Neural Data” by R.E. Kass, Uri Eden, and Emery N. Brown, pp 322-323.
Matt: I agree that the fact that they have the same wavelength and are perfectly in phase does not prove they are related. For that, a mechanism will need to be uncovered and many people, including Javier, are working on that. That said, the fact that they have the same wavelength and they are perfectly in phase, does mean that they should not be ignored as the IPCC has done. It is one of the most serious flaws in their AR5 report, in my opinion.
Andy May: the fact that they have the same wavelength and they are perfectly in phase, does mean that they should not be ignored as the IPCC has done.
I previously wrote that this research on possible solar effects is a statistical limbo: methods and data to date have high type 1 error rates and high type 2 error rates for mechanisms of plausible effect sizes (that is, effects of the same order of magnitude as the hypothesized effect of CO2 doubling).
Type 1 errors are the most egregious. These errors make us believe that snake oil will cure cancer. Solar and CO2 believers jump on this bandwagon without batting an eye. Look it’s the Sun! No! Look over there it’s CO2! Irritates the hell out of me. Rule out intrinsic factors first. If you can. Since we haven’t even explored most of the oceans, let alone taken sufficient samples, this very large storage battery cannot be ruled out. Yet both solar and CO2 folks just keep skipping down their primrose path, selling their snake oil. Irritates me!
Pamela,
Who advocates a solar influence on climate while d@nying the effects of oceans? I’ve never seen this advocated. Rather, the sun’s heating of the oceans over time, with the heat stored therein and moved around is the usual thing.
Why are you so angry over such a strawman, non-argument?
Andy and Javier themselves, for example, specifically mention the effect of even small variations in solar output on the oceans, accumulated over time.
The time integral of TSI, combined with the much bigger variations in the high energy end of spectrum, necessarily affect climate.
Amen! Drawing vertical lines through time-aligned graphs and looking for similar phases in broad-band signals is an exercise more of subjective perception than of objective analysis. The widespread lack of proven signal analysis methods in paleoclimatology is dismaying.
Thanks Gloateus. There are literally hundreds of papers on the Bray climate and solar cycles. And many that Javier and I haven’t found yet, I’m sure. It is a very powerful cycle and shows up in nearly all or maybe all climate proxy records that are long enough to see it. You are correct, Andrea Kern is hot.