In honor of Google’s latest diversity kerfuffle, I continue with my diversity initiative on WUWT with a guest post by Nick Stokes.~ctm
By Nick Stokes,
There is an often expressed belief at WUWT that temperature data is manipulated or fabricated by the providers. This persists despite the fact that, for example, the 2015 GWPF investigation went nowhere, and the earlier BEST investigation ended up complementing the main data sources. In this post, I would like to walk through the process whereby, in Australia, the raw station data is immediately posted on line, then aggregated by month, submitted via CLIMAT forms to WMO, then transferred to the GHCN monthly unadjusted global dataset. This can then be used directly in computing a global anomaly average. The main providers insert a homogenization step, the merits of which I don’t propose to canvass here. The essential points that you can compute the average without that step, and the results are little different.
The accusations of data corruption got a workout with the recent kerfuffle over a low temperature reading on a very cold morning at Goulburn, NSW in July, so I’ll start with the Bureau of Meteorology online automatic weather station data. I counted recently a total of 712 such stations, for which data is posted online every half hour, within ten minutes of being measured. You can find the data by states – here is NSW. You can find other states from the bar at the top, under “latest observations”. Here is a map of the stations in NSW in this table:

For context, I have marked with green the stations of Goulburn and Thredbo top which had temperatures of below -10C flagged on that very cold morning in July. On that BoM table, you can see stations listed like this (switching now to Victoria):

I switched because I am now following a post from Moyhu here, and I want a GHCN station which I could follow through. But it is the same format for all stations. This data is from 4 December 2016, and I have highlighted in green the min/max data that will flow through (unchanged except for possible quality control flagging) to GHCN unadjusted. It shows for Melbourne Airport, the most recent temperature (22.4) at 7pm, various other data, and then the min and max, along with time recorded. The min is incomplete; it showed the latest 7pm temperature, but would no doubt be lower by 9am the next day, which is the cut-off. The max probably wouldn’t change. You can see the headings by linking to the page here.
If you click on the station name, it brings up a full table of the half-hourly readings for the last three days, in this style:

Apologies for jumping forward to now (7 Aug), but I didn’t record this back in December. It shows the headings relevant to the above too; the top line is present (a few minutes ago), going back. Now you can see that this has to be automated; no-one is hovering over this stream of data with an eraser. If you click on the “Recent months”, it brings up the following table (an extract here, and we’re back in Dec 2016):

That was taken at the same time (just after 7pm, 4 Dec), and you’ll see that it shows the minimum attributed to Sunday 4th (before 9am), at 9.1, but not yet the max. If you look below that table you’ll see a list of the last 13 months linked, for which you can bring up the complete table. Here is what that Dec 2016 table now looks like:

…
The max of 31.7 is there; the min went down to 15.7. The other data hasn’t changed. Further down on that page, as it appears now, are the summary statistics for the month:

At the end of Dec 2016, that was transmitted to the WMO as a CLIMAT form, which you can see summarized at the Ogimet site

…

You can see that the min and max are transmitted unchanged. The mean of the two has also been calculated and is marked in brown. If you want further authenticity, that site will show you the code that the met office transmitted.
Finally, the CLIMAT form is transcribed into the GHCN unadjusted file, which you can see here. It’s a big file, and you have to gunzip and untar. You can also get a file for max and min. Then you have a text file, which, if you search for 501948660002016TAVG (which includes the Melb code) you see this line:
![]()
There is the 19.5 (multiplied by 100, as GHCN does). The other numbers will appear in the GHCN TMAX and TMIN files.
You can even go through to the adjusted file, and, guess, what, it is still unchanged. That is because homogenization rarely modifies recent data. But older data may be. GHCN unadjusted does not change, except if the source notifies an error. There are quality controls, which don’t change numbers, but may flag them.
There have been endless articles at WUWT about individual site adjustments, but no-one has tried to calculate the whole picture of the effect of adjustment. With the unadjusted vs adjusted files, it is possible to do that. I have been calculating a global anomaly every month, using the unadjusted GHCN data with ERSST. The June result is here; there is an overview page here, with links to the methods and code. This post compares the result of unadjusted vs adjusted GHCN; the difference is small. Here from it is a plot from 1900 to start 2015 showing TempLS (my program) unadjusted (blue) vs adjusted (green) and GISS (brown), 12 month running man. It’s an active plot, so you can see more details at the linked site.

If you want more convenient access to the station data, I have a portal page here. The heading line looks like this:
![]()
The BoM AWS link takes you to this page, listing all station names with links to their current month data page. BoM also posts the metadata for all their stations, and that link takes you to this page, which lists all stations (not just AWS, and including closed stations) with links to metadata. The GHCN Stations button links to this page, which links to the NOAA summary page for each GHCN station by name, or if you click the radio buttons, to station annual data in various formats.
Summary
I have shown, for Australia (BoM) at least, that you can follow the unadjusted temperature data right through from within a few minutes of measurement to its incorporation into the global unadjusted GHCN, which is then homogenized for global averages. Of course, I can only show one example of how it goes through without change, but the path is there, and transparent. Those who are inclined to doubt should try to find cases where it is modified.
The entire point of all this anal temperature focus is that alarmists try to draw a line between reportedly increasing temperatures and global warming. Since this theory is fundamentally flawed it’s all just a bunch of sound and fury signifying nothing.
And now for something completely different.
The fundamental premise of the atmospheric radiative greenhouse theory is that the earth without an atmosphere is 33 C colder than with. (255 K cold, 288 K warm)
This is incorrect.
Any object in the path of the sun’s expanding photosphere, 1,368 W/m^2 at the earth’s average orbital distance, i.e. the moon, the international space station, satellites, will be exposed to an equivalent radiative temperature of 394 K, 121 C, 250 F. That’s hot, sort of.
So, what would the earth be like without an atmosphere?
At 394 K the oceans would boil away removing the giga-tons of pressure that keeps the molten core in place which then pushes through the thin ocean floor flooding the surface with dark magma, reducing albedo and increasing BB emissivity. With no atmosphere, a steady rain of meteorites would pulverize the surface to dust same as the moon. No clouds, no vegetation, no snow, no ice and a completely different albedo, certainly not the current 30%. The earth would be much like the moon with a similar albedo (0.12) and large swings in surface temperature from lit to dark sides. An albedo of 0.12 produces a radiative balance of 1,203 W/m^2 and an equilibrium temperature of 382 K, 109 C, 228 F. The naked earth would be hotter by 94 C not colder by 33 C.
The earth’s atmosphere and albedo do not keep the earth warm, they keep it cool.
http://writerbeat.com/articles/14306-Greenhouse—We-don-t-need-no-stinkin-greenhouse-Warning-science-ahead-
http://writerbeat.com/articles/15582-To-be-33C-or-not-to-be-33C
http://writerbeat.com/articles/16255-Atmospheric-Layers-and-Thermodynamic-Ping-Pong
Nicholas:
Why do you continue to spam unrelated threads with drivel that only serves to display your complete ignorance?
The moon, even though it has significantly lower Bond albedo (solar reflectivity) than the earth does, has an average surface temperature of 196K (-77C), far lower than the earth’s average of 288K (+15C).
You are comparing a supposed peak temperature for the moon of 382K (one that is actually never reached anywhere on the moon, even on the equator at “noon” — where it actually only reaches about 365K) with earth average temperature. Apples and oranges.
Ten-year-olds understand the difference, and understand why half of the earth or moon is not exposed to the sun at any given time (it’s called night!). Why can’t you???
But the moon has no atmosphere, has no oceans and has a different speed of rotation.
It is by no means a like for like comparator.
Nicholas:
Why do you continue to spam unrelated threads with drivel that only serves to display your complete ignorance?
The moon, even though it has significantly lower Bond albedo (solar reflectivity) than the earth does, has an average surface temperature of 196K (-77C), far lower than the earth’s average of 288K (+15C).
You are comparing a supposed peak temperature for the moon of 382K (one that is actually never reached anywhere on the moon, even on the equator at “noon” — where it actually only reaches about 365K) with earth average temperature. Apples and oranges.
Ten-year-olds understand the difference, and understand why half of the earth or moon is not exposed to the sun at any given time (it’s called night!). Why can’t you???
[Pasted in the wrong comment above. Moderator — feel free to delete above repeated comment.]
Richard:
It was Nicholas who brought up the comparison, wrongly claiming that the moon was hotter than the earth.
He also wrongly attributes claims about the greenhouse effect to concern just the presence of an atmosphere, which means he doesn’t understand the claims at all.
Nikolov and Zeller, much beloved by Nicholas and his ilk, claim that since the moon is SO MUCH colder than the earth, the GHE cannot be responsible for the difference.
Which is it?
https://springerplus.springeropen.com/articles/10.1186/2193-1801-3-723
The genesis of RGHE theory is the incorrect notion that the atmosphere warms the surface. Explaining the mechanism behind this erroneous notion demands RGHE theory and some truly contorted physics, thermo and heat transfer, energy out of nowhere, cold to hot w/o work, perpetual motion.
Is space cold or hot? There are no molecules in space so our common definitions of hot/cold/heat/energy don’t apply.
The temperatures of objects in space, e.g. the earth, moon, space station, mars, Venus, etc. are determined by the radiation flowing past them. In the case of the earth, the solar irradiance of 1,368 W/m^2 has a Stefan Boltzmann black body equivalent temperature of 394 K. That’s hot. Sort of.
But an object’s albedo reflects away some of that energy and reduces that temperature.
The earth’s albedo reflects away 30% of the sun’s 1,368 W/m^2 energy leaving 70% or 958 W/m^2 to “warm” the earth and at an S-B BB equivalent temperature of 361 K, 33 C colder than the earth with no atmosphere or albedo.
The earth’s albedo/atmosphere doesn’t keep the earth warm, it keeps the earth cool.
****************
https://science.nasa.gov/science-news/science-at-nasa/2001/ast21mar_1/
“The first design consideration for thermal control is insulation — to keep
heat in for warmth and to keep it out for cooling.”
“Here on Earth, environmental heat is transferred in the air primarily by
conduction (collisions between individual air molecules) and convection
(the circulation or bulk motion of air).”
Oops! WHAT?! Did they forget to mention RGHE “theory?” Global warming? Climate change? Bad scientists!
Oh, wait. These must be engineers who actually USE science
“This is why you can insulate your house basically using the air trapped
inside your insulation,” said Andrew Hong, an engineer and thermal
control specialist at NASA’s Johnson Space Center. “Air is a poor
conductor of heat, and the fibers of home insulation that hold the air still
minimize convection.”
“”In space there is no air for conduction or convection,” he added. Space
is a radiation-dominated environment. Objects heat up by absorbing
sunlight and they cool off by emitting infrared energy, a form of
radiation which is invisible to the human eye.”
Uhh, that’s in SPACE NOT on EARTH where radiation rules.
“Without thermal controls, the temperature of the orbiting Space
Station’s Sun-facing side would soar to 250 degrees F (121 C), while
thermometers on the dark side would plunge to minus 250 degrees F
(-157 C). There might be a comfortable spot somewhere in the middle of
the Station, but searching for it wouldn’t be much fun!”
121 C plus 273 C = 394 K Ta-dahhh!!!!!
Shiny insulation keeps the ISS COOL!!!! Just like the earth’s albedo/atmosphere keeps the earth COOL!!! NOT hot like RGHE’s BOGUS “Theory.”
Nicholas:
You just continue your wearisome practice of copying and pasting the same tired nonsense, and never responding to any critiques of your posts. I don’t think you’re capable of reasoned technical argument — it seems to be beyond you. This type of behavior has gotten many people banned before.
Excellent exposition.
Yes, and I notice a couple of interesting things on the 1900-2015 chart.
1. The rise in temp from around 1970 to now is around 1.5 per century
2. The rise from around 1910-1945 visually appears to be the same
3. The rise over the whole period is under 1.0 degree per century.
I won’t get into whether the trends were ‘tampered with’ but this record at least makes me ask, “What’s the big deal over the rising temperature trends?”
Nick
There are lots of sceptics here who will be only too keen to find cases in which the apparently transparent process you have highlighted has been modified. This is an ideal opportunity for them to do so.
(I think this might be a short thread…)
In Nick’s graph, there is a ~.15 deg difference between unadjusted and GISS in the early 1900s, zero in recent years. That’s ~15% of the total change. Thanks, Nick, for showing that GISS does indeed corrupt the data.
Mike,
GISS uses the GHCN adjusted data. They add their own adjustment for UHI. But I should also say that the graph shows a calculated average anomaly. Some of the difference will be due to different methods (mine vs GISS). The green and blue curves are done with the same methods, and give a better picture of the effect of adjustment alone.
Nick, I fear that you are missing the point about BOM data adjustments. They know that there is a closely controlled account of recent data. The main issue is raw data of the past gets cooled to turn what was in many cases a cooling over the last century into a pronounced warming.
Showing that there is nothing happening to recent years’ data is basically a straw man.
Nick – I accept that there is little difference between your unadjusted and adjusted data, and should have said so. And, BTW, thanks for posting your article. But it does show in no uncertain terms, corruption in GISS. The vast majority of stations are affected by UHI, and UHI almost always biases temperatures increasingly upwards over time, yet GISS adjusts the other way!
“Showing that there is nothing happening to recent years’ data is basically a straw man.”
Exactly!
“And, BTW, thanks for posting your article. But it does show in no uncertain terms, corruption in GISS. The vast majority of stations are affected by UHI, and UHI almost always biases temperatures increasingly upwards over time, yet GISS adjusts the other way!”
1. The vast majority of stations are not affected by UHI. I love the way skeptics just assert stuff
2. To judge the magnitude of GISS adjustment UHI adjustment, just read Hansen 2010. figure 3
https://pubs.giss.nasa.gov/docs/2010/2010_Hansen_ha00510u.pdf
Mosh, Anthony Watts found that only 11% of the sites are even as good as merely OK. The vast majority of stations are affected by UHI. Just because Hansen claims that it’s insignificant doesn’t make it so. And your BEST homogenization does not correct for a gradual measured temperature increase not related to climate.
Mosh – to judge the accuracy of anything from Hansen, measure the current water level at his old office and compare it to his predictions
1. The vast majority of stations are not affected by UHI. I love the way skeptics just assert stuff
I don’t love it when either side in this just asserts stuff. But it is what it is.
I find that UHI does appear to have an effect on offset. But not so much on trend (assuming siting conditions remain constant). A well sited urban station will typically warm (or cool) slower than a poorly sited rural site. Ironically, that “urban cool park” nonsense we were hearing awhile back reflects this exact same phenomenon. (Yet instead of enjoying the cool park, their solution was to make it an uncool park. Ah, the homogenized memories.)
Only about one in ten of the USHCN stations we are covering are urban. But, ironically, urban stations are significantly more likely to be well sited than rural stations. Go figure.
Don’t think mesosite. Think microsite. Microsite is the New UHI.
“Mosh, Anthony Watts found that only 11% of the sites are even as good as merely OK. The vast majority of stations are affected by UHI. Just because Hansen claims that it’s insignificant doesn’t make it so. And your BEST homogenization does not correct for a gradual measured temperature increase not related to climate.”
Ah NO he didnt.
Anthony has applied the “guides” that LeRoy developed for “rating” stations.
However, that rating guide was never feild tested adequately.
That is they never set up rating 1 through rating 5 stations and ACTUALLY field tested for differences.
I talked with LeRoy’s partner. He set up a Small test of 4 stations.
CRN 4 had a BIAS of .1C
not 4C…. .1C
As for UHI There are over 15000 stations that have zero population. Guess what?
they also warm as fast as the urban stations
“Mosh – to judge the accuracy of anything from Hansen, measure the current water level at his old office and compare it to his predictions”
I can tell you didnt look at the chart.
Very Often here Skeptics cry that GISS adjusts data.
1. GISS IMPORT ADJUSTED DATA FROM NCDC.
NCDC does the adjusting
not GISS
NCDC
NCDC
NCDC.
2. The only adjustment Hansen does is a small one for UHI. See figure 3.
NOTE. This is NOT an argument about the accuracy of the judgements. It is an argument
about
WHO
DOES
WHAT
ADJUSTING.
The code is there. I fought to get it released. it shows you exactly what is done and who does what
And none of you clowns can bother to read or understand it
“I find that UHI does appear to have an effect on offset. But not so much on trend (assuming siting conditions remain constant). A well sited urban station will typically warm (or cool) slower than a poorly sited rural site. Ironically, that “urban cool park” nonsense we were hearing awhile back reflects this exact same phenomenon. (Yet instead of enjoying the cool park, their solution was to make it an uncool park. Ah, the homogenized memories.)
Only about one in ten of the USHCN stations we are covering are urban. But, ironically, urban stations are significantly more likely to be well sited than rural stations. Go figure.
Don’t think mesosite. Think microsite. Microsite is the New UHI.”
###########################
Well it will be cool when you actually release the site classifications.
The biggest issue is the definition of “urban”. Oke and his protege developed a new classification system
( along with field measurements) based on the Local climate Zone, essentially you end up with about a dozen different kinds of urban areas, and they all have different characteristics.
At some point one hopes that people would actually do controlled field tests to validate the LeRoy scale
Mosher states: To judge the magnitude of GISS adjustment UHI adjustment, just read Hansen 2010. figure 3
I would suggest that a better place to look is at Figure 3 in Hansen et al 1981 paper, published in Science Volume 213. See:
http://notrickszone.com/wp-content/uploads/2017/01/NASA-NH-Temperatures-Hansen-81.jpg
In that paper Hansen whilst commenting on figure 3 stated:
Whoops, formatting error. I re-post.
Mosher states:
I would suggest that a better place to look is at Figure 3 in Hansen et al 1981 paper, published in Science Volume 213. See:
http://notrickszone.com/wp-content/uploads/2017/01/NASA-NH-Temperatures-Hansen-81.jpg
In that paper Hansen whilst commenting on figure 3 stated:
Hansen refers to the NAS 1975 plot (set out below) and to the Jones and Widgely 1980 paper which concludes similar to the NAS plot, and the NCAR 1974 plot.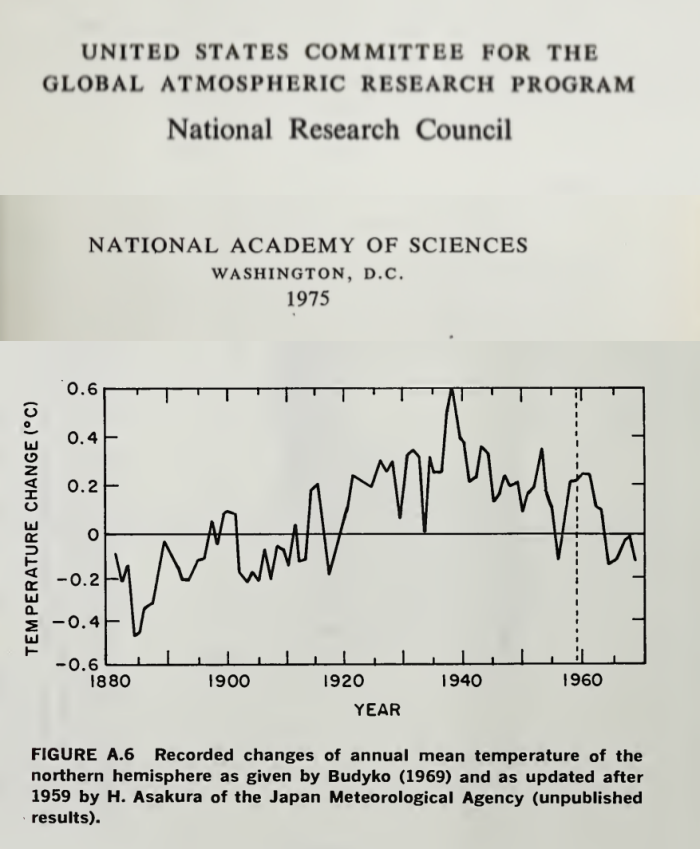
Now have a look at how GISS have erased the 1940 blip and have eradicated the 0.5degC of cooling, as per the Climategate emails that openly discuss the need to get rid of the 1940s blip and in which Phil Jones goes as far as saying that most of the Southern Hemisphere data is made up.
Richard,
“Now have a look at how GISS have erased the 1940 blip and have eradicated the 0.5degC of cooling”
Where? The first plot you showed was extra-tropical NH, the second was NH, and based on few stations. What GISS are you comparing to?
“Phil Jones goes as far as saying that most of the Southern Hemisphere data is made up”
No, he didn’t. He said that normals between 40S and 60S were mostly made up. I think he was exaggerating. But normals are not the data. They are “made up” because they don’t have long records. It’s desirable to have long records so you know what is normal, but if you don’t, it doesn’t invalidate the data you have now.
Mosher wrote: “At some point one hopes that people would actually do controlled field tests to validate the LeRoy scale.”
Even this won’t tell us what we need to know. The bias at a station doesn’t necessarily bias the trend obtained from that station. If micro, meso, or megapolis effects constantly make the reading at a station 1 K higher than it should be, the trend from that station will be unbiased. The only thing that matters is CHANGING bias. The quality of station siting today doesn’t tell us that local bias has changed.
The best way to avoid local site biases if to look at temperature on windy days, when the thermometer will be sampling well mixed air.
Essay When Data Isnt gives many specific examples for NOAA, NASA, HadCrut, Aus BoM, and even MeteoSchweiyz. US, Europe, Australia, New Zealand. Even (in footnote 26) BEST station 166900, unarguably the best kept, most expensive, mostnpristine weather station on Earth, the South Pole Amundsen Scott station. BEST turned no change into warming by eliminating 26 months of record cold using its logically flawed regional expectations algorithm.
Too funny.
There are several stations at the same location. One “Clean Air” has raw data that shows a warming
rate of 62 C per century. Of course the regional expectation adjusted this down.
Steven, are you missing a decimal point?
There’s been complaints about temperature rigging at Goulburn and to refute those claims Nick shows us a specific case where some data at Melbourne Airport hasn’t been rigged.
Well I’m convinced!
No, I showed how data from a BoM GHCN station gets transmitted unchanged to the GHCN unadjusted database. I can’t do that with Goulburn. Its data doesn’t go anywhere.
I am not sure how many people here believed that temperature data was being intentionally manipulated by providers. It would be extremely difficult to hide such an effort. Indeed, the problem with automatic stations in Australia was discovered as soon as it was cold enough to reveal the problem. If that was intentional, it was really stupid It is far more likely that it was a technical mistake that is being corrected immediately.
The real manipulation is taking place in climate studies, where the raw data is adjusted, not in the raw data.
And I would say my chief complaint is adjusting data from decades ago….at possible justification is there for it? How can we possibly know for sure if the adjustments are correct?
I guess that is really my concern – rarely do adjustment make the present colder and the past hotter – they always work in the other direction. If the errors were random, wouldn’t we see random series of adjustments?
” If the errors were random”
But they aren’t. They are due to causes. One was TOBS in the US, where observation times gradually shifted from evening to morning. Another is the improvement of shelters (use of CRS) around 1900 in some places, but later in others. More protection from radiation has a cooling effect.
Sorry Nick but no one living today has any idea, over hundreds of years, when the readings of the various thermometers were taken. I know when they were supposed to be measured but people don’t always do what they are supposed to do. These historical measurements are also taken with a thermometer that is graduated in single degrees so all of them are + or – 1 degree for accuracy. All of these measurements are taken with different devices so you cannot average these measurements together to increase the significant figures so all historical readings are still plus or minus 1 degree. Using that level of accuracy there has been no significant warming at all. Once you adjust it, it is not data anymore. will start listening to all of you doom mongers when you manage to get at least one forecast of impending catastrophe correct. So far I am waiting.
Matt Bergin
I entirely agree.
How many tea boys, cabin boys, amah’s, punkawalla’s or drunken scientists were sent out to badly maintained Stephen screens in the blistering heat, freezing cold or pissing rain to take a measurement from a dodgy thermometer, on time, every day 24/7/365.
It just didn’t happen to any reliable degree.
The Adjustments will never be “correct”
What you can prove is that an algorithm properly designed can Reduce the error
easy to prove in fact skeptics suggested the very kind of tests we use to show the algorithm works
Nick Stokes -”If the errors were random” But they aren’t. They are due to causes.
Then explain why you have to keep Adjusting the Adjustments, year after year, month after month. Can’t you guys get it right the 1st time?
Page 8 of 48 – http://www.climate4you.com/Text/Climate4you_May_2017.pdf – With Chart of the constant changes.
Diagram showing the adjustment made since May 2008 by the Goddard Institute for Space Studies (GISS), USA,in anomaly values for the months January 1910 and January 2000.
Note: The administrative upsurge of the temperature increase from January 1915 to January 2000 has grown from 0.45 (reported May 2008) to 0.69oC (reported June 2017). This represents an about 53% administrative temperature increase over this period, meaning that more than half of the reported (by GISS) global temperature increase from January 1910 to January 2000 is due to administrative changes of the original data since May 2008.
“Then explain why you have to keep Adjusting the Adjustments, year after year”
The averages aren’t adjusted as such. The individual stations are, and there are 7280 of them in GHCN. Adjusting any one of them will change the average.
Climate4you has been flogging that graph for ages. It is the difference between two particular months, cherry-picked of course. The main change came when GISS shifted from doing its own homogenisation to using the new data (based on pairwise matching) from NOAA. There was also the introduction of ERSST V4.
“Nick Stokes -”If the errors were random” But they aren’t. They are due to causes.
Then explain why you have to keep Adjusting the Adjustments, year after year, month after month. Can’t you guys get it right the 1st time?”
For us its simple. Adjustmenst are calculated from the data and the metadata. Long ago NCDC admitted ( in emails I got under FOIA ) that the metadata system needed a huge clean up. As that data changes ( looking at historical records ) the adjustments will change.. here and there .. not much to see.
As More OLD DATA is digitized the past estimates will change.
One thing that will change your adjustments is finding out that 2 stations you THOUGHT were different
were actually the same station. or two you thought were the amse are actually different.
There is no “getting it right” there is only getting it better. new methods, more data, different answer.
Ask the satellite guys Christy and Spencer. They have HUGE changes version to version
Nick, Steven etc just argued the adjustments have not really changed anything. Great so having convinced themselves of that can we just use the raw data in future discussions. The problem with homogenization of any science data is you can remove and mask out important features which show up in the anomalies (radio astronomy and particle physics is full of that).
Basically you seem to be doing the homogenization to try to create a “realistic rate of change” which is about the same science value as a “realistic rate” of population growth on Earth. Both of those are loaded with problems if you try to drag them forward 100 years and if you want to discuss either scientifically you need to discuss the background stories.
So this leads to the point your homogenized data gives you a rate .. so what now?
I have no problem with accepting that there is some rate from past to now. However as a scientist I also know Earth has a feedback stabilization mechanism so I need to exercise care if I try to project that rate forward as a year on year value. As with any feedback system you need to get some movement before it can react, okay we have measured a movement. I exercise the same care when I try to project Earth population forward 100 years because there may be factors that make it not sustainable and I am aware of that.
Mosh, “What you can prove is that an algorithm properly designed can Reduce the error
easy to prove in fact skeptics suggested the very kind of tests we use to show the algorithm works”
“however, the Forum concluded that it is likely to remain the case that several choices within the adjustment process remain a matter of expert judgment and appropriate disciplinary knowledge.”
http://www.bom.gov.au/climate/change/acorn-sat/documents/2015_TAF_report.pdf
That kind of algorithm?
Nick Stokes:
I appreciate your efforts here and I wonder if I could get your answer to a general question about the integrity of scientific methodology when it comes to temperature adjustments.
As everyone knows, sometime around 2013 there started to be this meme of a hiatus in global warming, because the temperature record for several years was tracking below the aggregate model projections. It became noticeable enough that climate researchers started to explain it.
When Karl et al published their 2105 paper, they specifically presented it as addressing this issue: “Much study has been devoted to the possible causes of an apparent decrease in the upward trend of global surface temperatures since 1998…..These results do not support the notion of a “slowdown” in the increase of global surface temperature.” http://science.sciencemag.org/content/348/6242/1469
Everyone knows all of this, of course. I bring this up as the background to this question: If the prospective temperature record had instead been tracking the models fairly closely, would Tom Karl have gone through the same process of retrospectively discovering and correcting “artifacts of data biases” in the NOAA temperature record? Is there a risk here of post hoc data adjustments that are biased in one direction, even if the adjustments themselves appear reasonable? It’s a question about basic scientific methodology.
MPassey,
Karl’s paper was actually using data that had accumulated, and was described by
John Kennedy in 2011, among others. There had been over nearly three decades a shift from ship-based SST measurement to buoys. As data is gathered, with GPS now, it is possible to make direct comparisons between measurements in close to the same point in time/space, taken by ships and buoys. By the time Kennedy wrote, several tens of thousands of such coincidence events had been monitored, and it was clear that buoys on average registered about 0.12°C cooler. That is small, but can’t be ignored. An adjustment had to be made, given the change in measurement mix. Karl’s paper made the connection of that cooling with the apparent hiatus.
It didn’t make a huge difference to trends overall, and now that buoys are dominant, it won’t have much effect in future. It seems it was only a touchy point because of the strong affection some have for the “pause”.
The latest ERSST V5 actually reduces modern trends.
I don’t know why you are going on about buoys here. Karl et al was about “correcting” daytime SST using NMAT. This inplicitly assumes that any climate change ( of whatever origin ) has identical effects on noctural minima as it does on daytime maxima in the marine environment.
Not only is that unproven , hence an invalid assumption, it is almost certainly wrong. There is already published work which finds that “global warming” affects the cooler end ( winter or night time ) more than the hotter extremes.
Greg,
From Karl.s paper
These networks of observations are always undergoing change. Changes of particular importance include (i) an increasing amount of ocean data from buoys, which are slightly different than data from ships; (ii) an increasing amount of ship data from engine intake thermometers, which are slightly different than data from bucket seawater temperatures; and (iii) a large increase in land-station data, which enables better analysis of key regions that may be warming faster or slower than the global average. We address all three of these, none of which were included in our previous analysis used in the IPCC report (1).
First, several studies have examined the differences between buoy- and ship-based data, noting that the ship data are systematically warmer than the buoy data (15–17). This is particularly important because much of the sea surface is now sampled by both observing systems, and surface-drifting and moored buoys have increased the overall global coverage by up to 15% (supplementary materials). These changes have resulted in a time-dependent bias in the global SST record, and various corrections have been developed to account for the bias (18). Recently, a new correction (13) was developed and applied in the Extended Reconstructed Sea Surface Temperature (ERSST) data set version 4, which we used in our analysis. In essence, the bias correction involved calculating the average difference between collocated buoy and ship SSTs. The average difference globally was −0.12°C, a correction that is applied to the buoy SSTs at every grid cell in ERSST version 4. [IPCC (1) used a global analysis from the UK Met Office that found the same average ship/buoy difference globally, although the corrections applied in that analysis were equal to differences observed within each ocean basin (18).] More generally, buoy data have been proven to be more accurate and reliable than ship data, with better-known instrument characteristics and automated sampling (16).
They don’t “correct” daytime SST using NMAT. The rather limited use of NMAT has been in calibrating different kinds of measurement (mostly ship) against each other where there are simultaneous NMAT readings (at night).
…. If there had been no hiatus, would Hansen have researched and have published a Paper to explain that the fall off in temperature rises during this period was due to increasing Chinese particulate carbon and sulphates emissions, i.e. Solar Gloom? Would many others have similarly been researching to find an alternative explanation?
The Karl paper is a load of horse manure. You cannot compare/combine sea temperatures with land thermometer air temperatures. They don’t relate. You are comparing apples and oranges, and combining them to present some type of global temperature trend is ludicrous.
One of the big issues with trusting the data is the adjustment of past temperatures, not of current temperatures.
“One of the big issues with trusting the data is the adjustment of past temperatures”
Homogenization is done in going from the GHCN unadjusted file to the adjusted file. I am describing the process leading to the GHCN unadjusted file, which does not change past values.
Nick,
You remarked, “That is because homogenization rarely modifies recent data. But older data may be.” Could you comment further on why older data may get ‘special’ treatment?
Right. So you didn’t address the the actual issue; you went for a strawman argument.
And since you started your analysis with this:
Clyde,
Firstly, adjustment is made relative to present. As you go back in time, if an adjustment is needed, due to station move or some such, it affects the numbers going back in time from that point, not forward.
But modern data gathered by an AWS process like this is unlikely to need adjustment, unless there were a move or change that nowadays (here at least) would be clearly recorded.
Nick,
So are you telling me that historical temperatures are ONLY changed when a documented change such as site or enclosure can be shown to have created a change?
Clyde,
“So are you telling me that historical temperatures are ONLY changed”
No. Homogenisation is done (by GHCN) based on the observations, on a balance of probabilities basis. As always, the objective is a best estimate. Sometimes data will be changed when it shouldn’t have, sometimes real changes will be missed. You have to try your best to get it right. Data doesn’t get a presumption of innocence.
“Data doesn’t get a presumption of innocence.” Only homogenization algorithms do.
Odd how the homogenization seems to alway lower the older temperatures which allows present temperatures to remain unadjusted while increasing the temperature difference between earliest and latest readings. Do that enough times and you get a pretty good increase in temperatures over time.
Nick,
You said, ” Data doesn’t get a presumption of innocence.” It probably should! Unless you have good evidence that something has changed, such as the site or instrumentation, changing it may be hiding real information.
“Odd how the homogenization seems to alway lower the older temperatures which allows present temperatures to remain unadjusted while increasing the temperature difference between earliest and latest readings. Do that enough times and you get a pretty good increase in temperatures over time.”
Actually not. SST older temperatures ( 70% of the globe) are warmed.
For land it will depend on the region. in the usa the past is warmed, on other continents it is cooled.
In anomaly space it doesnt matter which end you change ( current or past)
““Data doesn’t get a presumption of innocence.” Only homogenization algorithms do.”
Actually just the opposite.
We ( NCDC, Berkeley and others) all tested their algorithms in a double blind study.
BEST in fact was formed in part because some of us didnt believe in the NCDC approach.
“Nick,
So are you telling me that historical temperatures are ONLY changed when a documented change such as site or enclosure can be shown to have created a change?”
No because THAT would mean you trusted the metadata.
You cannot trust the metadata to
A) capture every change
B) record every change correctly
So instrumenst can be changed with no record, the wrong location can be reported, the wrong instrument can be recorded.
Today there a dozens of GHCN stations that have lat lons that position them in the ocean.
or stations that are reported to be an airport where there is no airport, or not at an airport when they
are at one.
Metadata can help, but in the end you have to weigh all possibilities.
It seems the that hard part of being a climate scientist these days is not predicting future temperatures but predicting past ones.
Nick, “As you go back in time, if an adjustment is needed, due to station move or some such, it affects the numbers going back in time from that point, not forward.”
http://jennifermarohasy.com/wp-content/uploads/2016/02/Fig1-1.jpg
http://jennifermarohasy.com/wp-content/uploads/2016/02/Fig2.jpg
Courtesy: http://jennifermarohasy.com/2016/02/12910/
Except to perhaps cool the past.
sorta with Clyde who replied below
amazing how just after 2009cop the graphs n data for the 3 hottest places in aus 1930s all got removed from Bom sites
kicking myself for not being smart enough to copy paste them wayback then.
marble bar eucla and ? hmm qld longreach from memory
that aside
Nick seeing as BOM can do 9 to 9am
which makes an absolute bollicks of actual DAILY rainfall amount let alone temps
dont you think its bloody odd and needs to be sorted to 12am to 12am so a decent and truthful DAYS records are IN that days reports
i am getting damned angry trying to track the real rainfall i get in a day adding half the prior days recordings to it is driving me nuts
and of course its reported late also
when rivers are likely to flood those delays can be VERY costly to us rural folks especially
Pete, A quote from Zeke Hausfather explains adjusting the past:
“The reason why station values in the distant past end up getting adjusted is due to a choice by NCDC to assume that current values are the “true” values. Each month, as new station data come in, NCDC runs their pairwise homogenization algorithm which looks for non-climatic breakpoints by comparing each station to its surrounding stations. When these breakpoints are detected, they are removed. If a small step change is detected in a 100-year station record in the year 2006, for example, removing that step change will move all the values for that station prior to 2006 up or down by the amount of the breakpoint removed. As long as new data leads to new breakpoint detection, the past station temperatures will be raised or lowered by the size of the breakpoint.”
There is the additional issue of pairwise or regional homogenization. Pielke Sr. years ago demonstrated empirically that nearby stations differ both in absolute values and in trends due to difference in the terrain underlying. On that basis, it is bogus to change readings at one place to synchronize with somewhere else. And as proven repeatedly the process almost always leads to higher trends.
https://rclutz.wordpress.com/2017/07/27/man-made-warming-from-adjusting-data/
Ron,
Further, temperature changes globally appear to only have significant changes in steps. It is unfortunate that NCDC uses steps as the only criteria for homogenization changes. I would recommend only making changes when a change in site, enclosure, instrumentation, or surroundings can be documented. NCDC might well be corrupting data that could provide important insights on how climate behaves.
This strikes me as being akin to calculating the standard deviation of many observations, removing those with a SD greater than two sigma, recalculating the SD, and again removing ‘outliers.’ One ends up chasing their tail and having a data set very different from what they started with. That is, the mean and standard deviation will be very different.
The nice think is you get the same answer if you use a method that does NOT always change the past.
our method doesnt preferentially change past values. How does that compare to NCDC..
same answer
It sure does get the same result, when it works like this:
Hear me, Nick. When you play with homogenization, you are playing tossup with a mathematical hatful of nitro. Just fail to account for one systematic error, and you’ll be scraping your pairwise off the ceiling.
false.
It depends on the size of the systematic error.
The cool thing is you can get the same answer by doing the homogenization using a blind method.
its rather like Leifs method for corrrecting sun spots and like christys method for correcting for diurnal
changes. basically data driven.
AND you can prove that it doesnt corrupt perfect ( CRN) stations
Yes, it totally does depend on the size of the error, so it does.
But no method, blind or not, is going to help on whit if it does not account for the error.
AND you can prove that it doesnt corrupt perfect ( CRN) stations
I must infer from that comment that you haven’t compared CRN and USHCN trends from 2005 through 2014.
I beg your pardon for my English, but it seem to me that this post relate to the news about limiting temperature below -10°C in the Goulburn weather station.
I look at the link you cited and I was not able to see any “lower temperature” under -10°C.
I’ve I misunderstood the problem, read the wrong data or what?
Mariano,
Goulbourn data for July is here. It starts out like this:
I’ve ringed the reading that attracted attention.
Thank you. My fault! I looked at Goulburn TAFE.
Well the ‘kerfuffle’ was about what happens to a reading below -10C.
You see, some say it was going to be treated as spurious and ‘corrected’ to -10C.
There was quite a ‘kerfuffle’ about smart cards and programming.
http://joannenova.com.au/2017/08/bom-had-smart-cards-to-filter-out-coldest-temperatures-full-audit-needed-asap/
Things are still rolling, as it appears old records are being binned
http://joannenova.com.au/2017/08/another-bom-scandal-australian-climate-data-is-being-destroyed-as-routine-practice/
Now, sure, its now reading -10.4, but would it have done but for all the ‘kerfuffling’?
But wait…there’s more
“Graham Lloyd has picked this up and adds more in The Australian in “Temperatures Plunge after BOM orders fix”. Jen Marohasy saw a -10.6C temperature disappear from the Thredbo recording last month, but now, after the BOM’s rushed fix, Thredbo has already reached -10.6C this week in the official record. The Bureau’s CEO, Andrew Johnson said they had replaced equipment that was “not fit for purpose”. Which begs the question that if thermometers were not fit to record cold temperatures, what purpose were they fit for? Politically correct thermometers? Thermometers to justify Renewable Energy Subsidies and ARC Grants?
Want to avoid answering basic questions — call a review!
Graham Lloyd asked the BOM about the smart cards, but got no answer:
The BoM declined to comment ahead of the internal review.
“The findings of a review into this matter will be made available after completion,” a BoM representative said. “We do not intend to publish detail prior to that.”
Since when did a review become a reason not to explain a supposedly scientific process? Either there are smart cards there, or not. There are limits set (or not). And there is hopefully a record of the real raw temperatures recorded somewhere…”
So the problem is trust.
The answer is “Trust Us’.
In the meanwhile who does the average scientist believe?
With this article the fix is in.
When one does science raw data, is sacred.All derivations are calculated from it.
The data collected is part of the bedrock of observational science.
When this is corrupted it alienates the observant and attracts people to the ‘science’ who do not know
how to measure.
It prevents not only peer review but also specialist review that is open and repeatable, the other
cornerstone of science.
One way of not answering a question in climate science is to flood the questioner with data.
The problem for the scientist is ‘whose data is this, is it reliable?’
Sadly BOM showed us it is not.
and what about the amount of concrete and bitumen at Melbourne Airport, Olympic Park or Laverton say since 1900. All the BoM temperature anomaly is revealing is the steady increase in the UHI in areas increasingly built up then projecting that as being global. There is a relationship to CO2 emissions no doubt but its not the ‘greenhouse effect’. Nick’s piece misses the point methinks, which is that the BoM data set is not fit for purpose to contribute to a proper global temperature trend. Ditto the sea surface set but for different reasons. I do not trust BoM for that reason. There is no way such an outfit can plead ‘duuhh – we didn’t think of that’. Lets say that the BoM stations are fine for the local temperature, telling it like it is but that does not make them fit for the global anomaly (essentially a trend parameter) purpose.
Leave BoM aside and think of the potential site location issues around the planet. Only a select set of sites could be considered as fit for the global anomaly task. That BoM and its counterparts do not use only properly sited stations goes directly to their credibility. Add to that this fetish for sexed up science communications as feedstock to the msm ( exemplar bar none in Oz being Peter Hannam at ‘F&$k Facts’ aka Fairfax) and this is all ready about the credibility of witnesses. Spare us the pet expert testimony.
Komrade
I’m glad someone has bought up this point. I find it perplexing that in world which over the last 150 years cities have gone from a small but growing populations to massive concreted metropolises any historical adjustments should be up not down to enable comparison with modern data. The very real impact of UHI is missing from these adjustments. The crazy thing is that when you are making policies that cost billions of dollars on less than a degree or two of warming these ill advised adjustments are so damaging. The more recent adjustments if any are actually irrelevant the damage has already been done.
Thankyou. Nice to have “how it’s done” resources like this available. It would be interesting to see how many of the sources internationally offer such transparent access to the end to end data stream.
As Nick Stokes wrote, the problem is not the present temperatures but the historical temperatures. For example the latest GISS version 2016 shows about 0.5 Celcius more warming from 1880 to 2016 than the previous version. It is simply too much. The homogenization of raw temperature data and calculating averages is not that difficult. The Americans went to the Moon in 1969. Now the history of GISS temperature versions show that they are not capable to calculate the average temperature of the Earth. What is going on? Why should I rely on the latest GISS version when all the versions so far have been wrong?
“For example the latest GISS version 2016 shows about 0.5 Celcius more warming from 1880 to 2016 than the previous version.”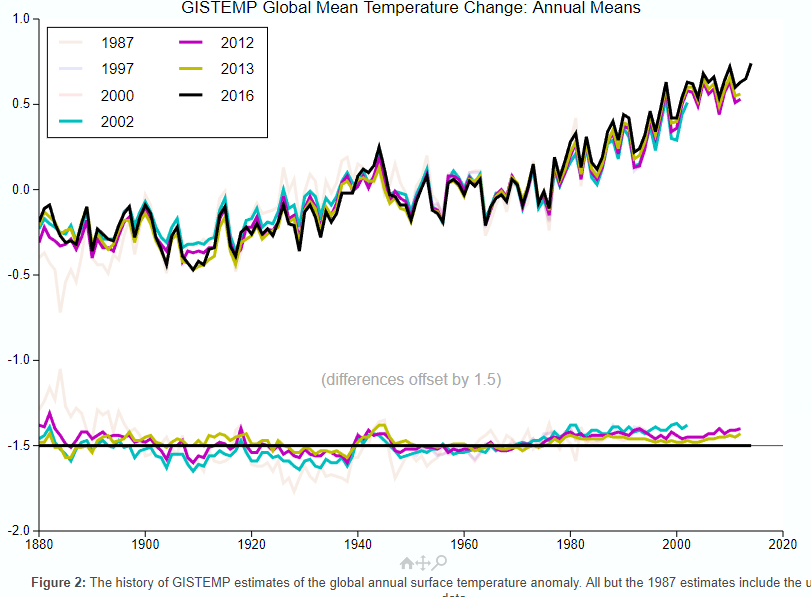
It’s not nearly so much. GISS has a history page here with an active plot showing old versions. I’ve highlighted recent versions below:
That bureaucrats alter “data” without justification isn’t a belief. It’s a fact, ie a repeated observation. NOAA even changes its “data” before reporting it, then “adjusts” it more.
The whole system is totally corrupt and only new personnel dedicated to science rather than political ideology can change it. But the damage done to raw data can’t be repaired. Hence, honest recording in future will “cause” cooling automatically.
Thanks for that U.S. surface temperature chart comparison, Latitude. NASA charlatans turned a temperature downtrend from the 1930’s into a dishonest temperature uptrend.
The 1999 chart is the true global temperature profile, with the 1930’s being as hot or hotter than subsequent years. This temperature profile is seen all over the world in unmodified temperature charts. The Hockey Stick chart profile is a completely different profile which was created to promote the CAGW narrative.
Look at this unmodified temperature chart from Finland, halfway around the world from the U.S., yet it has the same temperature profile as the NASA 1999 U.S. chart with the 1930’s being as hot or hotter than subsequent years. It looks nothing like the Hockey Stick chart. And there are numerous other examples of this same profile from around the world.
The only problem Latitude is that Nick points to a page with ACTUAL DATA
you flash pictures with no link whatsoever to any data.
the graphs you falsh are of different data, using different methods, and they dont even have the same
scales.
We could have an intelligent conversation about the ACTUAL changes they made, but Not unless you present the actual data.
Thank you Latitude. Until someone produces a record explaining exactly HOW and WHY the US record you linked was changed so dramatically I will ignore all claims of very minor adjustments. THOSE ARE NOT MINOR.
The same is true for the NH and SH records at the peak of the ice age scare.
Beyond that, whatever the cause of the surface warming it is not and cannot be GHG until the troposphere is warmer then the surface.
Mosh..in all these years…I’ve never seen you so lame…
Both of those graphs were made by NASA/GISS….using NASA/GISS data….their own data…their own graphs
(like you don’t know how to right click) lame lame lame lame lame…and no one is falling for it doodoo
“…and they dont even have the same
scales.”
At any scale, a downward trend is down.
And an upward trend is up.
And at any scale, reversing this trend direction is still a reversal of the direction.
Piling strawmen on top of a fluffy pillow of lies.
We have a name for that sort of argumentation where I come from.
BTW, I would love it if the effect of scaling was removed by making all climate related graphs show the entire temperature scale.
All of the trends are then very difficult to discern from a straight line.
Oh, and also BTW…the scale is identical in the two flashing graphs.
It shifts because the alterations were so huge it was off the scale of the first one. But test that.
Click the link.
Then hold your mouse cursor over any line on the graph as it flashes.
If you hold it right at 1.0 on the first one, it will still be at 1.0 on the second one.
The horizontal scale is likewise identical.
Mr. Mosher, you make stuff up and hurl accusations that do not stand up to even mild scrutiny.
Seriously.
The graph is exactly what it says it is…and you should admit it, or say nothing.
Since you already said something, the least you could do is admit you were completely and 100% wrong about everything you said here.
Welcome to NASA’s cool magic show! We make the cooling disappear! Now you see it, now you don’t (applause)
you know……Mosh used to at least put some effort into his “stories”…if you stood back far enough and squinted…he could sound at least plausible
Here lately it’s like he’s given up…posts drive by comments….that are so lame they are obvious to a 2 yo
Great! System normal! We are in an interstadial warm period and by golly it should be warmer with little ticks up and down during this peak period that mean nothing compared to the big swings. Check. The Earth should be greening. Check. The oceans should be in net discharge mode with sea level slowly rising. Check. The climate should on average be wetter than when it is in a stadial period. Check. Flora and fauna should be flourishing. Check. People should not be complaining about this wonderful warming climate. Oops.
People should understand that there might be slight differences (likely much less than a degree F or C) between temperature data processes which show overall warming anyway, because those slight variations just don’t matter in the long run. What we should be worried about are the people who DO think this warm period is not supposed to happen and is something we should try to fix!!!
Lordy.
Yes! Thank you Pamela.
LOL..Pam that was great!…..and spot on!!
Interglacial. Interstadials are during glacial intervals.
We are in a glacial epic in which we oscillate between stadial cold and interstandial warm periods.
https://pdfs.semanticscholar.org/3ef7/02054d1719e80561f023265bae522c953c77.pdf
The Pleistocene was a glacial epoch. The Holocene has its own epoch, but is really just another interglacial.
As I said, interstadials occur during glaciations. Interglacials occur between glaciations.
I refer you to Cronin’s 1999 “Principles of Climatology”. Within glaciations, colder stadials generally endure for a thousand years or less, while warmer interstadials for less than ten thousand years, interglacials for more than ten thousand and glacials for about one hundred thousand (now known to be the average of ~82 and ~123 thousand years, not recognized in 1999).
The Bølling Oscillation and the Allerød Oscillation, where not clearly distinguishable in the stratigraphy, are taken together to form the Bølling/Allerød interstadial, and dated from about 14,700 to 12,700 years before the present. The Holocene Interglacial is usually dated from around a millennium after that, ie 11.7 to 11.4 Ka.
The ice cores demonstrate stadial and interstadial periods. These are the ones I refer to. The terms have been confused by many as to what constitutes a glacial versus stadial period, and what constitutes an interglacial versus an interstadial period. Welcome to the confusion.
http://lgge.osug.fr/IMG/fparrenin/articles/barker-science2011.pdf
Hallelujah!!
+lots
It doesn’t matter about all the wrangling over data adjustments.
The very gradual warming is natural. That is all.
And warmer is better.

Cold is death.
I recall a recent article in a popular fake news publication (which used to actually have a reputation as being a reliable source of information) in which the writer breathlessly warned that if the Earth got tremendously hotter than it has ever been, there may be some places where the heat could kill a person.
This writer seemed unaware that there large swaths of our planet which have just that…fatal temperatures…permanently across huge areas, and seasonally across much of the habitable terrain…and it is not heat which is the killer…it is cold
Just look at which parts of the earth have fatal temps, and which are the parts which people flock to when it gets nippy outside.
Is there anyone who vacations at the poles?
I will give everyone a reminder:
http://jtpedersen.net/blog/wp-content/uploads/2009/04/frozen-penguin-2.jpg
Without sensitive instruments, a person cannot even detect the amount the Earth is supposed to have warmed over the past hundred + years.
Very good summary.
I remember reading a comment on an article quite a few years ago at WUWT…
“And even if we COULD control the world’s thermostat…who gets to choose the temp?”
“…who gets to choose the temp?”
Anyplace I have ever lived, it is the one paying the bills, not the freeloader who is past their welcome.
“”…who gets to choose the temp?””
“Anyplace I have ever lived, it is the one paying the bills, not the freeloader who is past their welcome.”
So, all government employees are barred from the playing field, but private sector janitors and carpenters and machinists…get control of the rudder and sheets. Got it.
But, really, NS’s article is a baby step in the correct direction. More separately.
“So, all government employees are barred from the playing field,”
Who is talking about being barred from any playing fields.
The issue is who gets to spend your money: You, or someone with a political axe to grind?
If you like to have your life controlled by other because they have wowed you with some fake credentials…good for you.
Leave the rest of us out of it.
Welcome to GISP’s cool reality show! We show the cooling is real! Now you see it, now you see it (applause)
http://jonova.s3.amazonaws.com/graphs/lappi/gisp-last-10000-new.png
Welcome to Vostok’s cool reality show! We show the cooling is real! Now you see it, now you see it (applause)
http://www.changecollege.org.uk/img/Vostok.jpg
The problem, Nick, is that this does not address all the possible points of data correction or corruption. I want to believe the best about the integrity of those in charge of the data (I wont even mention points of physical corruption such as the Urban Heat Island effect or proximity to airports), but when there are literally billions of dollars on the line it is difficult to do so.
I stopped believing in AGW and the integrity of those who do so on the day I saw the infamous commercial from the U.K. where the teacher blew up the heads of non-believing children. My physical and moral revulsion to what I saw caused me to question a lot of things that day.
But for the sake of argument, let us assume there is no data manipulation, correction or corruption. Let us assume that it is truly warmer today then the at any point since we began keeping records. Let us also assume that there is no need for upper or lower error bounds. Let us even further assume that CO2 is the primary cause of AGW. If we implement the Paris Treaty, will this temperature go down? If we switch to 100% renewables will this temperature go down? If we take away every car, shut down all the airlines, remove all the AC units, implement a 1 child per family policy, make everyone become vegans, and eliminate capitalism will the temperature go down?
And if it does go down, is it proof that we were suffering from AGW?
Will we go to a magical norm, where it is neither colder nor warmer than normal? Where there is no temperature change from year to year, decade to decade or century to century?
Yeah, you have no idea.
Your wider points are entirely valid. But Nick’s piece, which only goes to a small part of the chain of reasoning, is well done and clearly explained, and what we should recognize more than anything else, really does credit to this site. Not an echo chamber, but one that recognizes diversity of views.
The problem Michel, is that stuff like this is a red herring. Nick takes a small period of time in a small portion of the earth to show that data manipulation is not occurring. When I read this, I appreciate his willingness to communicate but it still bothers me.
Why, upon reading this, does it bother me?
Because a discussion about data manipulation should be forefront in our minds and should be studied by people on both sides of the divide. All of the groups putting forth data should be studied and checked. I would think that anyone who calls themselves a scientist would acknowledge it is in the best interest of science that data be as accurate as possible. Where data is obtained in different manners, like should be averaged with like (that’s the accurate way to handle data) and data obtained in a different way should be averaged separately.
When a small portion of data is presented and the attitude is “hey look this isn’t manipulated so ergo no data is manipulated” then that just concerns me.
Really Nick (if you bother to read this), nothing personal, but by presenting this information are you telling us that no data at all is being manipulated?
Or are you just saying, “look the data I see isn’t manipulated, but I can’t make a leap in logic as to the rest.” I can respect that.
Andrew,
“by presenting this information are you telling us that no data at all is being manipulated?”
I’ve looked at a lot of it, and it seems straight forward. All I can say is, if you think it is manipulated, you should be able to find out where. It’s all out there.
Hi Nick,
“All I can say is, if you think it is manipulated, you should be able to find out where.”
Could you explain the example of Darwin airport with no site changes but with 0.72 C per century cooling being adjusted to 1.2 C per century warming.
https://wattsupwiththat.com/2009/12/08/the-smoking-gun-at-darwin-zero/
Thanks,
Carl
Carl,
See below.
When nick makes valid points, rather than admit the fact, you just make up crap about airports.
Warming trend at airports is no diffferent than non airports.
That is nonsense. The differences between maximums and minimums at the non-airport sites will be greater than at the UHI impacted sites.
Quite right spren. I have been watching daily aircraft movements and checking temperatures. When our regular Easterlies and South Easterlies blow across the runway from the parking apron direct to the BoM instruments. This shows a spike for a couple of minutes only of around 1C at the times aircraft land and taxi to the apron, several times a day. Four new helicopter pads and 15 giant helicopters now operate alongside the BoM instruments, further adulterating the real temperature. Perhaps it should be AHI instead of UHI.
https://pindanpost.com/2016/03/26/jet-fueled-temperature-rises-for-broome/
https://pindanpost.com/2015/12/14/airport-heat-islands-artificial-maximum-temperatures/
That would be using your data. I guess you are saying Watts’ study is wrong then for comparison of well sited stations. Care to tell us where his study went wrong.
“I want to believe the best about the integrity of those in charge of the data…”
Not me.
That sounds silly.
I want to know the truth.
As scientists…as taxpayers, we have that responsibility…we have the right.
Class diversity. Discrimination between individuals based on the color of their skin, their sex (i.e. male or female), etc. is logically and by definition racist, sexist, etc. A bigoted (i.e. sanctimonious hypocrisy) philosophy normalized by the Pro-Choice Church and its progressive (i.e. monotonic) liberal (i.e. divergent) acolytes.
Still, denying individual dignity is a far cry from denying evolution of human life from conception. I wonder how many people actually believe in spontaneous human conception; in social justice adventures that commit mass a-bortion and force global refugee crises.
I’m a bit lost as to how this relates to Australian temp readings…?
Obviously posted to the wrong thread.
“I have been calculating a global anomaly every month, ”
I suppose if it pays the bills , why not.
Stop immediately! You are using power! What if the authorities find out?
Thanks, and very welcome.
With this post you have put clear blue water between yourselves and Ars Technica, Real Climate and the Guardian, none of whom would ever feature an article by a known skeptic, all of whom are mired in a morass of censorship of opposing views and endless cries of ‘fossil fuel funded denier’.
Thanks also to Nick for continuing to comment and participate in the face of sometimes very unfortunate and rude replies. His patience is commendable. His presence enriches the site greatly, and while I often differ from him, I always read his comments with interest.
True. Whilst I invariably disagree with comments Nick makes, he is always unfailingly polite and that should be commended.
Yeah, the good manners of people who are running cover for criminals never fails to warm the cockles of my heart.
A very useful post, Nick, with useful links…..thanks!
There is so much data available out there and that’s perhaps a large part of the problem. Once upon a time, we’d have been content to record it, use it for historical comparisons and identify extreme events and suchlike to fill a column in a newspaper and comment on the unpredictable nature of weather. Now, thanks to computers, we build models and make extrapolations and projections as if we actually understand what the underlying processes are. Hubris, I’m afraid.
That is not my understanding of what a large part of the problem is.
If that was a large part of the problem, there would not be much of a problem.
Airport stations are placed to measure conditions at the runway — hopefully a worst case so we can accurately asses the risk to flight based on density altitude and wait for a cooler time of day if necessary.
The Surface Stations project documented anomolies in many other stations.
If we can use one pristine station for carbon dioxide, why not use one pristine station for temperature.
The more we talk about process, the less we talk about outcomes, and the costs/benefits of our actions.
OK Nick, the temperatures are fine. Things are warming up a little bit. They might get as warm as they were in the MWP. Then again, they might cool down, as they did in the Little Ice Age, or heaven forfend, enough to put us into another cold period, which has been the dominant ‘climate’ of the last few hundreds of thousands of years, and not that friendly to life as we know it
There is an implicit thought here that if you can convince us your temperature series are valid, all the other claims of the CAGW advocates are valid.
Put simply, if a few degrees of temperature rise make folks so unhappy, why do northerners vacation in the Caribbean and retire to Florida. We are going to completely cycle our infrastructure in less than 100 years anyhow, and we will naturally cope with temperature, sea level, and other changes in the natural course of things.
Back to my airport. We tend to wonder that the change of life that is supped to accrue as the temperature varies a few tenths of a degree. The adibatic lapse rate is 4 deg/1000 feet, so I can cool 8 degrees
by climbing 2000 feet. Folks who live on a hill live in a different climate. I live in the temperate zone. I can change my average by moving north or south a few hundred miles. Assertion that we’ll not be able to adapt to temperatures changing makes no sense. The flora and fauna adapt along with us. We grow different plants in different regions. The plant mix has changed here as the temperature has cooled over several decades, probably a local effect.. .
So I’ll stipulate your damn temperatures, and call BS on the implied conclusions.
We have comapred all the pristine stations in the US ( CRN) to the :shitty: stations.
NO differrence.
[I call BS on that – Anthony]
Steve
Gives us the data that you looked at.
Not me.
Give them an inch, and they’ll take not a mile but our money, freedom, security, prosperity and hope for a better future.
“So I’ll stipulate your damn temperatures…”
Not me.
Give them an inch, and they’ll take not a mile but our money, freedom, security, prosperity and hope for a better future.
Thank you Nick for this, and Charles. This policy is focussing the debate rather well. Anthony has always had an open invitation to proponents of looming disaster to submit articles, but either direct invitation has been the best way to go or the time is right for this.
Well if the unadjusted is truly that close in all land based stations, the data keepers have have shot themselves in the PR foot for no gain. It has long been my contention that if we are facing an existential threat, that a hundred scattered stations around the globe would be, without adjustment, sufficient an early warning system. We would see if we are departing seriously from 0.6C/ century (we aren’t) relatively quickly. Hundredths of a degree adjustments are expensive foolishness and raise scepticism that can’t be good for morale or sober policymaking.
Paul Homewood found Paraguay and Ecuador traces grandly adjusted for GHCN and a Capetown raw record that even had the familiar wiggles of the global pause – further proof that a) you don’t need so many hands in making the broth and that b) for disaster warning, you don’t need many stations at all.
The fact that 70% of the globe is water does offer up a playground for fiddling that hasn’t been ignored, too. Since the satellite temperatures over land are frequently argued to be close to surface station results, logic would cry out for this record to be the source for ocean temperatures. Do the rejected or neglected buoys validate satellite readings?
Similarly for SLR. If the fear is we are going to be struggling with a 3m rise, why are we running down to the sea with micrometers?The tide guages, whether relative sea levels vary up or down because of crustal movements are more than adequate to give us long lead time to deal with it. It presently seems steady at ~2mm/yr. The adjustment is only to 3mm with allowances for ocean basin volumetric changes from isostasy which makes the silly situation of official sea level standing above the actual water surface.
“Of course, I can only show one example”
Nick,
There is no “of course” in climate science. One example doesn’t prove anything, either.
Andrew
It traces the path. The opportunity is there for doubters to show where the supposed “fiddling” is done.
Approximately 66% of global surface temperature data consists of estimated values…….
https://wattsupwiththat.com/2015/09/24/summary-of-ghcn-adjustment-model-effects-on-temperature-data/
“It traces the path.”
Tracing a path for one thing doesn’t mean the path is universal.
Andrew
You have a theory it is not universal.
Prove it.
One case will do
This was a well thought out article that demonstrates there is no massive conspiracy among (at least) Australian temperature monitors. However, it misses a related problem – sampling errors. Let’s grant the history record back to 1900 for NSW as shown in your figure. I have a difficult time believing the border between South Australia and the Northern Territories has as accurate a record. Similar for Siberia, the Northwest Territory of Canada, Mongolia, central portions of the Sahara Desert, interior rain forest in Brazil, central Greenland, the South Pole, and so on. In fact I would suggest that we have an excellent historical record for land area within 200 miles of the ocean or major sea (Mediterranean, Caribbean, etc) but not much else. I doubt the South Atlantic, South Pacific, South Indian or any of the Pacific is well sampled before 1950. So when we compare global averages to the past we limit the past to coastal land. I could accept that a sampling is an accurate measure of the whole except that the sampling needs to be unbiased. Since our historical sample is biased to places where people lived I don’t think we can compare to the past. Maybe I’m wrong, I’m open to correction. So in that vein – The Pacific Ocean is as large as the 6 occupied continents put together, and had very little shipping across it in 1900. How well do we know the temperature of the Pacific Ocean in 1900?
“Adjusted data” is an oxymoron. Scientists who introduce their own fallible judgment into “improving” measurements are corrupting the entire process and rendering it useless.
If data is no good, the only option is to throw it out. Trying to unscramble the egg just creates a mess and ruins breakfast.
Gary……you are naive to think that reasoned, logical methodology has any merit in the race to obtain portions of a Trillion Dollar plus industry.
I get a little bit of a kick out of all the people and money spent on the minutia involved with climate on both sides of the fence. It is all a shell game and most have lost sight of the pea.
A very recent WUWT Post on ‘Dodgy Greenhouse Data’ is an example. For decades the amount of CO2 and Greenhouse gasses have been used a propaganda to convince the public of CAGW (50% of public doesn’t know the meaning of individual letters), yet the veracity and collection method of GHG’s is completely unverified.
OT, but ctm did open with a reference to Google’s ‘diversity kerfuffle’: CNS ran a much more sympathetic story, which I think would be a lot more accurate than the Daily News version. The Daily News version reads like a totally PC distortion.
The CNS version is at http://tinyurl.com/yckx66ro
The Google boss’s statement confirmed that the engineer’s comments were accurate.
The “adjustments” are, indeed, not particularly large. However, they have a subtle goal: to make the series appear to be less variable and more in line with the AGW hypothesis. :large
So, while advocates can legitimately feign dismay to criticism on the grounds that linear trends drawn through the data have actually decreased with adjustments, it is a sleight of hand – the adjustments are erasing the features that show the warming is not actually strongly correlated with CO2 concentration.
Bartemis,
This one graph says more than all the hand waving and discussions and excuses and lame reasoning, all put together.
It tells the whole story, to anyone honest and paying attention.
“It tells the whole story, to anyone honest and paying attention.”
It tells nothing, because Goddard did his usual stuff of subtracting the averages of two different sets of stations, and saying that the result is due to adjustments. It isn’t. A substantial part is just due to their being different places and times.
But it also makes no sense. I can see a conspiracy theory that has people making the temperatures align with CO2 rise. But why on earth align temperature adjustments?
So, they were different places and times, and it still wound up a straight line?
That makes even less sense and is even less likely.
But have you guys not said over and over that it matters almost not at all which stations one uses?
That one set is as good as another?
Separately,
If the ones from one set were not comparable, how is it justifiable for NASA to say that the newer set is representative?
He used their numbers.
Are you saying at some point NASA just threw out the stations they had been using and selected some other ones?
And the new set just happened to show the opposite trend from the ones everyone used prior…even James Hansen, who made the first one and was the father of the whole meme?
But that does not concern you…just trying to discern the pattern among the sum of all of the adjustments…that is not allowed because it is apples and oranges?
As for your last question…are you kidding?
The whole reason we are here is because a group of people have the political motivation to prove that CO2 is the temperature control knob of the atmosphere…that we can adjust it by controlling emissions.
The obvious motive is the force the graph of temp trend to match the level of CO2 in the air. To correlate them.
Tony was the first person to think of graphing it this way///I am sure that the people responsible were horrified that someone figured it out who had the knowledge to use the data to make their own graphs.
It is his skill at creating software that allowed him do it.
To most of us…it is just a huge database of numbers.
My areas of knowledge do not include how to do this, but like a lot of things, you do not have to know how to do it to know what it means when you see it.
But I do not believe for a second that you are incredulous and cannot understand why this line appears.
I never saw any response or heard from you when RGB from Duke and Werner Brozek wrote the post here that analyzed the chance of this correlation arising at random or spontaneously.
It is more likely to win both of the lotteries on just two tickets than for that to be the case.
This reminds me of a “Chain of Custody” whereby there are a series of hand-offs of evidence and each must follow proper protocols (including sign off). So at least THIS data seems to be aggregated from each station and collected properly. What is missing is each station’s formal practice, then any down line attempt to use this data including the methods, justifications, and processes used to change it or derive answers from it. At any point corruption of clean data can occur (either on purpose or by accident).
Strict CoC is only necessary in fields where corruption and mistakes are deemed likely to influencing the outcome- by corruption I include the misuse of statistical methods and bad analysis which is may just be sloppiness. It is the fault of the practitioners in the field of “Climate Science” that no one believes them anymore. All data is eyed with great skepticism.
To fix this, practitioners in “Climate Science” will have to be more careful with their data and analysis. They need to understand and separate facts from the model derived outputs commonly used in place of facts. They need to answer questions from skeptics with respectful language. They need to possess a more open mind where uncertainty allows a conversation to occur, not be shut down. In short, they need to transform their practice from a self-contained religion into a normal science based one.
Nick
Thank ŷou for posting this. I do admire your integrity and wish there were more people like you at this site which otherwise can often be a bit of an echo chamber.
It’s not often we agree on things but as you know I am sceptical about the widespread corruption of raw data. My main point of contact is with the met office and I find it faintly ridiculous that as soon as I leave there the scientists such as Richard betts rub their hands and say ‘ right he’s gone, now we can get on with doctoring the data.’
Having investigated historic temperatures for many years I do however have a problem with comparing like for like between now and previous eras.
When you realise instruments were hauled to observers by mule or that observers were often untrained, used different times of day to take temperatures, used a variety of screens, that a mercury reading may be different from an alcohol one on a thermometer, that readings were often added in days after the event, that instruments were moved or urbanisation crept up on them, then it becomes very difficult to say with certainty that the same place has become notably warmer in the last 100 , 500 or 1000 years.
Certainly in my neck of the words we can trace the ups and downs of temperatures over the centuries and I would find it very difficult, based on evidence such as tree elevations, known crop elevations, harvesting dates eyc, to say that the climate was warmer today than at various points in the past. Similarly, glacier advances and retreats in such places as the alps can be followed with some certainty due to the works of such people as Le Roy Ladurie.
So all in all I do not think anything remarkable is happening and certainly do not believe that weather is as extreme as it has been at periods over the last 1000 Years.
Keep up the good work but let us put all this into the context of the Holocene, rather than just the last few decades
All the best
Tonyb
Thanks, Tony,
Yes, I agree that this relates to the very modern period only. I think past numbers are accurately preserved in GHCN unadjusted (and Daily, ISTI etc), but they were indeed gathered in more difficult circumstances.
I will second those thanks. I always wondered how the “harvest” is collected. Thank you for an informative post. I am a little disappointed that others glossed over your caveat with regard to limiting your post to gathering the raw data only, but that’s life.
Another problem, and this has to do with confirmation bias. Adjustments are sought that tend to produce results favoring the AGW hypothesis. They are not sought if they would tend not to do so.
If you go looking for something, you will generally find it. These corrections to BOM figures may be insignificant, but how many other such corrections could legitimately be found if the principals were actually looking for them?
So, while adjustments favoring the outcome one way may be legitimate on their own, they are not being counterbalanced by unfavorable ones, and as a whole are thereby not legitimate.
Nick, with respect, I do not think you have addressed the main argument here.
It is interested to see the data flow and the apparent ‘transparency’ however,
According to jo novas site, which has documented the BOM fiddlings;
The AWS screen shots showed -10, it then went to 0, it was then corrected to -10.4 which everyone agrees it should remain at -10.4 degrees C.
The big question is, who had write or edit access to the government database holding the real time data streamed in from the 712 stations?
Who was sat at a computer terminal, with the database query window open, so that they were in a position to perform an immediate edit?
Can any BOM data be considered safe or reliable, if ‘anyone’ ( and who did it is a big question) can edit any data they wish for any reason?
Is there an audit trail?
Is the original retained or lost in these multiple edits?
How often has someone had the edit/update screen open and what edits have been performed?
What other records have been edited over the years, why and how was it documented and justified?
Who ordered this edit?
Or was it a standing order – with a list of stations to watch, just do a quick hand edit, no scripts, no evidence left to incriminate?
Nick, what you have documented above is interesting and good, but does not address the issue of who did it, why, how often and under whose orders.
BOM data can not now be formally trusted, therefore datasets that incorporate BOM data can not be trusted.
What other countries do this ‘under the counter’ editing I wonder?
Exactly, this isn’t the first time the BOM has been caught with their thumb on the scale.
From August 2014:
How accurate are our national climate datasets when some adjustments turn entire long stable records from cooling trends to warming ones (or visa versa)? Do the headlines of “hottest ever record” (reported to a tenth of a degree) mean much if thermometer data sometimes needs to be dramatically changed 60 years after being recorded?
One of the most extreme examples is a thermometer station in Amberley, Queensland where a cooling trend in minima of 1C per century has been homogenized and become a warming trend of 2.5C per century. This is a station at an airforce base that has no recorded move since 1941, nor had a change in instrumentation. It is a well-maintained site near a perimeter fence, yet the homogenisation process produces a remarkable transformation of the original records, and rather begs the question of how accurately we know Australian trends at all when the thermometers are seemingly so bad at recording the real temperature of an area. Ken Stewart was the first to notice this anomaly and many others when he compared the raw data to the new, adjusted ACORN data set. Jennifer Marohasy picked it up, and investigated it and 30 or so other stations. In Rutherglen in Victoria, a cooling trend of -0.35C became a warming trend of +1.73C. She raised her concerns (repeatedly) with Minister Greg Hunt.
—–
Why would anyone trust anything from the BOM? How many other changes have been made that have gone unnoticed?
Fool me once, shame on you. Fool me twice, shame on me.
“One of the most extreme examples is a thermometer station in Amberley, “
I showed here, by looking at nearby stations, how the adjustment at Amberley was absolutely required. You can pinpoint even the month of the discrepancy (August 1980) and the amount (-1.4C). I’ve never understood the beef with Rutherglen. The fact is that ACORN temperatures are adjusted. They make a big point of the fact. That means numbers change. It means trends change. And if you look through enough, you’ll find trends that change from negative to positive, possibly by quite a lot.
Nick, that’s a very interesting analysis and discussion you link to. The comments below your post by Dr Bill Johnston, posting as ‘Anonymous’, explain his very thorough analysis of the station data over a longer timescale and he comes to a different conclusion that is summarised in this comment (bold mine):
@ Nick “I showed here, by looking at nearby stations, how the adjustment at Amberley was absolutely required.”
Joanne Nova’s BOM graph is from 1941 (when the Amberley station opened) to present (2014):
http://joannenova.com.au/2014/08/the-heat-is-on-bureau-of-meteorology-altering-climate-figures-the-australian/
Your analysis covers only 1975-85. You’re not comparing the same thing, so it’s not surprising you come up a different result, one that is deliberately misleading.
The latest temperature from the Amberley station was 0.4 C, at Brisbane (which you use in your analysis) it was 10.2 C. Clearly the climate of Brisbane, which is near the coast, is different than Amberley 50 kms away.
On top of that, Amberley is RAAF air force base. One would think that their measuring equipment would be fairly accurate.
Nick,
The problem is that you adjusted the data while sitting looking at trends but without knowing anything about what might have caused it. It other words, you assume something bad happened and that the data should be adjusted and how. As mentioned elsewhere, from a scientific standpoint, if the data is bad, you throw the data away, you don’t adjust it unless you can physically investigate and determine the real physical reason and how that reason affected readings.
Your adjustments leave one to wonder what happened and are the adjustments being made correct. Do you know what happened and how it was corrected?
Reg
JoNova’s plot is here
http://jonova.s3.amazonaws.com/graphs/australia/amberley-adjustments.jpg
It’s very clear that the curves track each other except for some event in 1980. The trendlines express the data as a gradual change, but the actual change is abrupt, and best analysed by looking at the surrounding years. GHCN independently homogenised the same data, with the same result. Their data sheet is here. Their adjustments are shown thus:
It’s clear that the only important adjustment was in 1980.
@Nick “It’s very clear that the curves track each other except for some event in 1980”
But the adjustments go back to 1941. If something changed in 1980 it would only affect data from that date going forward. They cooled the past to warm the overall trend based on something that changed in 1980.
I’m missing your point.
Verity,
“When step-changes due to suspected station re-locations are deducted (call them station effects), there is no residual trend. No amount of mushing about with the data will change that.”
I agree with most of what Bill says. I don’t know how I missed that last bit at the time; it just isn’t true, as a matter of simple arithmetic. If you shift one side of a data point relative to the other the trend has to change. That was the whole point of the arithmetic I did, to use the short-term trend to quantify and hence locate the break point.
Nick,
you identified the break point and corrected for it. For that I applaud you. The point Bill made that I was asserting is that you worked over a short timescale, found a break point and corrected for it, resulting in a different trend over that time scale. Bill on the other hand, over the complete station record, found two breakpoints. He said that correcting for both break points cancelled out the change of trend you are stating is necessary.
“Who was sat at a computer terminal, with the database query window open, so that they were in a position to perform an immediate edit?”
I doubt if anyone was. I’m sure BoM folk are very dedicated, but I doubt they are hunched over their monitors on a Sunday morning, editing data. It looks to me like a flag kicked in at -10°C, and a computer system responded, replacing the suspect value with an estimate from other data. Remember, they also have at least the continuous 30 minute readings at that site. I would expect that the flagged value would have been examined later, probably by a human. They want to know why a malfunction was flagged.
“What other records have been edited over the years, why and how was it documented and justified?”
My point here is that it is out in the open – which is where Walter Pidgeon spotted it. If you think this is common practice, you should be able to find instances.
Three years ago, there was a somewhat similar kerfuffle over Luling Texas, although that was a real GHCN station, and the issue involved several months. But it turned out that the issue was actually an automatic response to what was found to be a faulty cable. The system had detected the discrepancy, and replaced the data with an estimate based on nearby stations, which from a regional average point of view, was the right thing to do. But Goulburn isn’t part of any regional average that is normally published.
“The system had detected the discrepancy, and replaced the data with an estimate based on nearby stations, which from a regional average point of view, was the right thing to do.”
The reason for having multiple measuring and recording stations is because we KNOW temperature and precipitation vary geographically and temporally. If all stations were outputing identical data, there would be no reason to compute an average. It is the differences between stations that matter. After all, aren’t warmists claiming CAGW is confirmed by independent measurements?
Tracking each station’s variance from it’s peer stations is useful for detecting malfunctions, but when a station is discovered to be malfunctioning, the proper thing to do is to throw out the bad data. Replacing bad data with estimates gives those estimates the weight of raw data.
SR
I’m a frequent reader and enjoy the comments as much as the articles, mainly because you get different points of view, something that is, almost without exception, missing on warmest sites. This is one of the big arguments I make to people when debating climate change. Why are there no other points of view in the comments, much less the articles? Nick is consistently one of the big dissenters on this site and I really appreciate the fact that he was a provided the opportunity to guest post.
Can we conclude from this that the data we saw in 1995 showing a substantial cooling from 1940 to 1980 were in error because the modern data don’t display any cooling then? Will the data for 2000 to 2014 change in 2045? If these data are subject to such adjustment it follows that they were not trustworthy before they were adjusted. This brings up the reason I got involved in this study. As a land surveyor I make my living measuring things. In about 2008 I tried to imagine how to “measure” the earths temperature or even how to define it so it could be calculated consistently for comparison over time. My quandary was central to Ivar Giever’s(Nobel physicist) statement that climate science is a pseudoscience and his resignation from the American Physical Society. After all these years I remain unconvinced that the system of using ground measurements is a reliable way to estimate global temperature which Is accepted to be an average of averaged measurements at differing times in changing locations with various instruments and methods of adjustment.
DMA – “After all these years I remain unconvinced that the system of using ground measurements is a reliable way to estimate global temperature which Is accepted to be an average of averaged measurements at differing times in changing locations with various instruments and methods of adjustment.”
I am likewise unconvinced. A better global average temperature would be to capture all thermometer readings at the same point in time and then average them. Some readings will be at night, some will be at day. If these same calculations were performed each hour for a day, we would have 24 values that may differ since differing portions of the Earth would be facing the sun. Instead we are left with polling moving air masses with land based thermometers over some period of time such that one air mass can influence several readings, and the average of averages is published.
How do forest fires impact readings and how are those values ‘corrected’?
Thomas, the problem with trying to calculate a global average temperature is that it is the wrong variable to study if you are trying to study how the climate works. Local temperatures are the result of the climate, they don’t drive the climate. The climate is driven by energy differences that flow from one location to another making changes. The sun warms the top layer of the ocean and evaporates water either directly from radiative absorption or by molecular movement. The evaporated water carries heat energy and changes the characteristics of the air by reducing its density causing it to rise and change its volume. The enthalpy of water, some 40.65 kJ/mol is one of the main drivers of climate.
Unfortunately, the global average temperature tells us virtually nothing about how the climate system is behaving.
The same Nick Stokes who has repeatedly bashed WUWT on other sites, has made claims that Anthony censors and deletes, and who told people he’ll never visit WUWT again…not only freely posts comments here, but is given a forum to making full posts. That’s the best lesson to be learned here. Somehow I doubt the message will get across to those who need it.
Nick has posted here before with Zeke and me.
So MJ’s point goes triple then, huh Mosh?
Thank you for pointing that out.
Well done Nick.
The post traces raw data flow. That is almost beside the point as is not the main problem. The problem is final after homogenization adjustment. This is easily seen in Iceland, a number of ‘pristine’ GHCN stations in Europe, and even in pristine non-GHCN stations such as Rutherglen in Australia using the BoM homogenization. Some time ago I posted here an analysis of 14 USHCN stations judged CRN1 (best) by the surface stations project. Conclusion, homogenizarion did remove at least some UHI from urban stations, but added varying degrees of warming to all the suburban and rural stations, with only one exception.
The core logical problem is simple. Homogenizarion spreads bad data into good. Bad coming from UHI or microsite issues affecting the majority of all stations, as the surface stations project showed. And Kotsoyannis analysis of all long record, reasonably conplete GHCN showed a clear overall warming homogenizarion bias that was highly statistically significant. See footnote 14 to essay When Data Isnt for links to that 2012 paper.
+100 – People need to start looking at the forest and not the individual tree leaves. (SteveRichards 1984 also nailed it very well, the proverbial 5 W’s.)
Yes. Nick Stokes starts the article with “There is an often expressed belief at WUWT that temperature data is manipulated or fabricated by the providers” and then proceeds to show how a recently reported temperature at a site gets ostensibly accurately reported. So what? In other words a straw man is addressed by trying to show a recent instance of non-corruption somehow invalidates the lack of trust in the people and processes generally.
It is too late for that. Climategate exploded the scientific trust that previously supported the warmunist program. They have a desire and intent to change the data to suit their beliefs. Now they are stuck with the lawyer’s defence that their opponents can’t prove individual malfeasance in most individual cases. Stokes is not a fool with words, and employs them carefully in defence of the agenda.
“This is easily seen in Iceland, a number of ‘pristine’ GHCN stations in Europe,”
I’ve had a look at the GHCN v1 data – dated around 1990 – vs the original, already corrected/homogenized data from the Iceland Met Office (IMO) itself, not on a yearly, but on a month per month basis … because as such were the IMO data …
particularly for Stykkisholmur it was not a pretty picture … the blogpost about it is at http://euanmearns.com/stykkisholmur-iceland-temperatures-from-reality-to-ghcn-v1/ …
maybe Nick Stokes can explain the algorithms Russel Vose et al. were using then ?
> There is an often expressed belief at WUWT that temperature data is manipulated or fabricated by the providers. This persists despite the fact that…
Oh please. Everyone knows the data are not manipulated nor fabricated. Rather, they are adjusted and homogenized.
Go ahead Nick. I double dawg dare you. Say with a straight face that the data are not adjusted and/or homogenized.
As I said in the article:
‘This can then be used directly in computing a global anomaly average. The main providers insert a homogenization step, the merits of which I don’t propose to canvass here. The essential point is that you can compute the average without that step, and the results are little different.”
If the results are “little different”, why do it at all?
“So Nick, the BoM has NEVER EVER amended the temperature record in any way?
A simple yes or no will suffice.”
Good grief, how on earth would Nick know the answer to that question?
Has anyone conducted a detailed examination of sites that are NOT contaminated by Urban Heat Island (e.g. South Pole, Alert Bay Canada, etc.) with the use of unadjusted (homogenized) data only? If so, it would be helpful to compare it to Nick’s graph above. I remember a fellow by the name of John Daly who used to do this. His arguments were very persuasive. I remember a tidal gauge (New Zealand???) that had been put in place a few hundred years ago by Capt. Cook? that showed very little change over that time time period..
Yes. Essay When Data Isnt specifically examined De Bilt, Netherlands and Sulina, Rumania (both GHCN), Rutherglen Ag in Australia (BoM), and BEST station 166900 at the South Pole. All diddled into warming from raw cooling or no change.
And through 2015 (the last analysis I saw) the USCRN — the gold standard of US land based temperature measurement — show no warming. Granted the recent El Nino might have changed that a bit IDK.
Nick,
You are a devotee of maintaining the status quo of climate science. Do you think the status quo of climate science is adequate scientifically for determining and declaring there is a climate crisis?
Andrew
My dad was an amateur weather watcher and he wrote the temperature on my birth certificate of the day I was born. Boy, was that old buffer wrong. In fact he has been wrong at least five times at the true temperatures for that day keep rolling in.
Mr. Stokes,
First, let me congratulate you for agreeing to post an article on WUWT – and also to congratulate whoever invited you so to do. The only way in which a true consensus on CAGW is ever going to develop is if both sides are able and willing to post and debate on each other’s sites.
Then I have a question for you. You have written:
“I counted recently a total of 712 such stations, for which data is posted online every half hour, within ten minutes of being measured,” and “This data is from 4 December 2016, and I have highlighted in green the min/max data that will flow through …”
But if we have 48 temperature readings for each station why do we concentrate on only two for each? Surely the mean of all 48 is more accurate than the mean of just 2?
You do such stalwart work already but have you taken some sample stations over a single month and compared the mean of the 1440 (or so) half-hourly temperature readings with the mean of Tmax and Tmin? And if so how do they compare?
Solomon Green,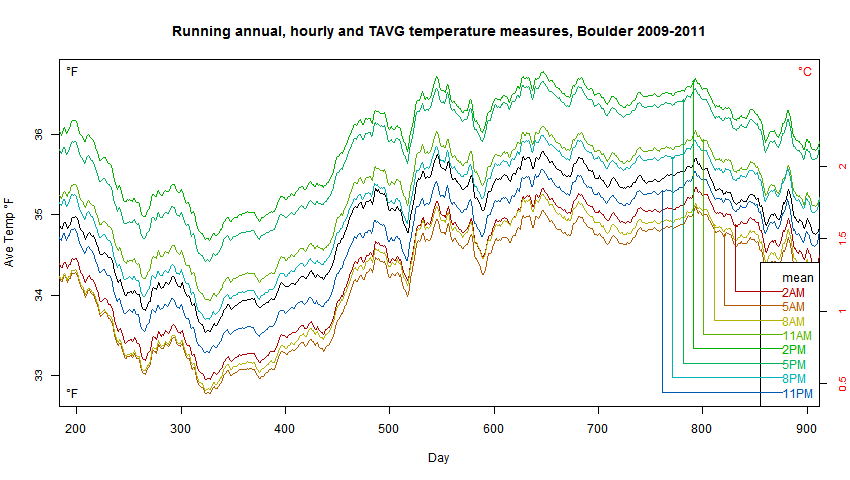
“But if we have 48 temperature readings for each station why do we concentrate on only two for each?”
I’ve tracked the min/max because it is what is sent via CLIMAT forms to GHCN. They use it because they are a historical database, and most pre-1990 data is available as daily min/max only. BoM highlights it in their summary data, because it is what people often want to know.
I have done a comparison of Boulder, Colorado, here. It was mainly to show the effect of different times of reading (notionally) the min/max. Changing that time (TOBS) has a much bigger effect than the difference between min/max (colors) and continuous (black). The plot is below – it shows a running annual mean (to avoid seasonal contrast) over three years of data.
This is what a serious blog about climate science should be! Congratulations for giving voice to different views, even if we do not agree with them. I do not agree with most Nick Stokes views in commentaries but I read them carefully and he’s clearly an informed, very polite guy, that tries to balance discussion. Sometimes he has a point. That’s what science is about – measuring, discuss and conclude. I’m an AGW skeptic but I also do not agree with lots of, sometimes, “too” biased articles that are often written here or, worst, with the common “left” and “right” political bash that as nothing to do with science.
Maybe you can convince Mann to write here someday 😉
Cheers
Agreed. It takes courage to speak an opposing view and character to invite that opposing view to speak.
CYM
Well done for getting nick to post an article here. He gets a lot of stick but has always come over to me as polite and well informed.
It is essential that the site does not become an echo chamber so how about offering a spot to victor venema?
I seem to remember that Richard Betts also wrote an article here a few years ago for which he received a lot of stick ( mostly from his peers and actvisys, in particular Sou.)
. Perhaps he can be persuaded to contribute another article? Also Sou writes good articles although she has been very quiet recently so perhaps is winding down her climate efforts.
Tonyb
Ctm
Quite why my iPad continually changes your initials to CYM I don’t know. Sorry. Perhaps it stands for ‘Charles, young moderator?’
Tonyb
Cyan, Yellow, Magenta — basic subtractive colors.
Without wishing to damp the conversation at all, I would like to say thanks to all for the discussion, to WUWT for hosting, and to CtM for encouraging.
NIck Stokes, thank you for the essay.
HADCrut4 was introduced to make 1998 colder than 2010.
HADCrut3 shows that 1998 was the warmest year on record and 2010 the second one. HADCrut4 shows that 2010 is warmer then 1998.
“HADCrut3 shows that 1998 was the warmest year on record and 2010 the second one. HADCrut4 shows that 2010 is warmer then 1998.”
They had to manipulate the temperature record so they could claim the temperatures were getting “hotter and hotter” They have manipulated the years since 2010 to make them appear to be “hotter and hotter” too, but the satellite charts show the true picture with 1998 being hotter than every year but 2016, where 2016 exceeded 1998 by one-tenth of a degree.
And according to Hansen 1999, the 1930’s was 0.5C hotter than 1998, which also makes the 1930’s hotter than 2016, which means we have been in a temperature downtrend since the 1930’s, not an uptrend, as the CAGW promoters want us to believe.
Thanks Nick
A good article but I don’t get the relevance.
We all know the planet is warming, by how much is almost irrelevant as the IPCC model predictions are way above observed temperatures, irrespective of what source.
So how does your article demonstrate that CO2 has anything to do with AGW?
What I see, is you defending data acquisition and interpretation techniques. You’re not dealing with the fundamental premise that CO2 is the demon of AGW.
So where do we go from here? Debate the data or find the cause of AGW?
My preference would be the latter, but in 40 odd years of the climate debate, there has yet to be, to my knowledge, a credible, empirical study that demonstrates CO2 causes the planet to heat up.
Now, whilst we sceptics are forced to adhere to the alarmist’s contention that 30 years is the minimum term of climate analysis, are we also forced to accept that the period to determine the culpability of CO2 is limitless, 40 years and growing.
When does this period end, when the 30 year climate alarm period has apparently been settled?
But as I say, respect to you for posting this. I can’t imagine anyone doing similar on an alarmist blog without being banned.
Nor am I a scientist, engineer, or even barely educated, so if you do reply, I would appreciate if you would talk my language. After all, that’s an educated man’s obligation, to communicate to the great unwashed.
HotScot August 8, 2017 at 1:37 pm
“So how does your article demonstrate that CO2 has anything to do with AGW?
What I see, is you defending data acquisition and interpretation techniques. You’re not dealing with the fundamental premise that CO2 is the demon of AGW.”
If data is being collected for the purpose of evaluating a premise, and backers of that premise change the data so as to confirm the premise, any who then say the data was not changed ARE dealing with the premise.
SR
Stevan Reddish
“If data is being collected for the purpose of evaluating a premise, and backers of that premise change the data so as to confirm the premise, any who then say the data was not changed ARE dealing with the premise.”
Too deep for me man. I don’t have education. You must speak Janet and John if I’m to understand. And like I said, that’s a scientist’s job, to educate morons like me.
Hotscot,
I think you have conflated the role of educators, the role of journalists, and the role of scientists.
Scientists have the job of discerning objective reality.
Educators and journalists have the job of informing the public.
None of them are supposed to be advocates for a particular point of view…that is the realm of pundits and politicians.
When we blur those lines, objectivity is lost, and trust becomes increasingly impossible.
When we have scientists stating openly that they have the duty to push an opinion, they are no longer scientists. They have disqualified themselves from that description.
When we have researchers who get the result they are paid to get, and only that result, they are not researchers at all…they are whores.
Words matter.
Steven ?w=400
Exactly they have all gone on a wild goose chase – sadly in his own country Nick will now witness the danger of doing this. Sure there seems to be some warming – we are recovering from colder times – but co2 as the driver – NBL. But as they say follow the money – trouble is it is always OPM.
I should note that I am not saying the data Nick is presenting has been changed, but that pointing out that certain temperature data was not changed does not negate other times when changes were made.
SR
Stevan Reddish
“I should note that I am not saying the data Nick is presenting has been changed, but that pointing out that certain temperature data was not changed does not negate other times when changes were made.”
Sorry mate, but to a thicko like me, that makes even less sense than your last post.
I will simple it up for you Hotscot.
A thief cannot prove he is an honest man by demonstrating a few times that he did not steal anything.
Understand now?
I suppose there are people who have never known any thieves, so lets look at another example.
A person is called a lair if he or she tells or has told lies.
If every word they speak is not a lie, they are still liars.
Telling the truth some of the time, or even most of the time, does not erase or undo the lies.
Even admitting one has lied, and confessing to every lie one has ever told, does not erase the lies and make one an honest person with an honest past.
All it does to confess is to make one an admitted liar.
All that got a little wordy and may be too complicated I suppose, so here it is in a nutshell:
Even the biggest liars on the world tell the truth some of the time.
BTW, the climate liars have admitted nothing…they just keep telling bigger and better and more complicated lies.
And the people who defend them are just as bad as the lying liars who are telling the lies.
For some reason my previous post wouldn’t animate – better luck this time. ?w=640
Where can I find historical time of observation metatdata for stations in the US and around the world? What data is being used to make the TOB adjustments? In the US there is the HOMR site (https://www.ncdc.noaa.gov/homr/), but it is not complete (or maybe it is and there are lots of missing values?) and appears to only go back to 1948. Am I missing something?
US station metadata is at HOMR. It is not perfect, but extensive. You can view the original B-19 forms submitted by observers here. I think that would be a primary source for TOBS data, although each change was supposed to be by permission from NOAA, which probably left a paper trail.
BoM has extensive metadata, but it isn’t easy to access. There is a post about it here, and a gadget that facilitates access.
I certainly understand the importance of TOB adjustments. I have used hourly data to construct correction factors for Pittsburgh, but you need to have a file of the actual times of observations.
I don’t understand how systematic, transparent, reviewable, verifiable TOB adjustments can be made if there is no digital record of the actual time of observation. I have been trying to take one station (Uniontown, PA) that is close to Pittsburgh and has a long record. The HOMR data doesn’t start until 1948. I followed the link to the original B-19 forms, but the forms are essentially illegible. They have never been transcribed? Are we suppose to believe that all of the adjustments have been done correctly when there are no downloadable records of the observation times? How were they done?
To quell discussions of data manipulation, this information should be front and center on the NOAA web site. The fact that it is not makes me concerned.
Kudos to WUWT for presenting a dissenting opinion. Stokes’ defense of corrupted data is lamentable, but he was given a chance to make his case. This would never be permitted at sites such as SkepticalScience where contrary views are deleted and dismissed as “sloganeering” – a Communist phrase from the 50’s.
Kudos to Nick for posting this.
I always welcome Nick’s comments, and always read these carefully and consider what he has to say. I always want to see all sides of a debate, and Nick’s comments are usually intelligent and well argued, and rarely does he engage in drive bys.
I find Nick to be one of the most thoughtful commentators on this blog (whether you agree with him or not), although occasionally I consider that he seeks to defend the indefensible, and sometimes obfuscates, as he did when dealing with Forest Gardener’s straightforward question:
You should have read the letters after the article on BoM in the Australian newspaper. Then you would question what is going on at BOM. In Aus every year is the hottest one yet, that is what they say where I live.
Above a question is asked that is not answered: how do we know the temperature of the Pacific Ocean in 1900? I’m a layperson, and don’t claim otherwise, but I find that an interesting question. How is it possible that we have a firm grasp on the temperature of the Pacific Ocean’s surface (and the Arctic’s, and the Antarctic’s, and that of remote swaths of Africa . . . ), in 1850, 1860, 1870, 1880, 1890, 1900, etc.? If we do not have a firm grasp on those things, how can know the temperature of the entire globe in those days, such that we can say with meaningful confidence how much warmer it is today? (Perhaps estimates are made about portions of the earth’s surface in the old days. If so, how much of the globe is subject to such estimation, what are those assumptions based on, and how are the methodologies for such assumptions tested.) I am not making an argument here; I am just inquiring.
Thanks very much.
Consider this: We have very good data for a large part of the world, a representative sample if there ever was one.
It is contiguous (all touching itself).
It is large in extent from north to south, and from east to west.
It has vast and tall mountains, and vast and not so tall mountains.
It has valleys…big ones and small ones and lots of in between sized ones.
It has vast plains, it has large coastal zones, and these coastal zones abut the two largest oceans on Earth, and the Gulf of Mexico.
It has huge lakes and small ones, and every sized ones in between, and a large number of each.
It has small streams, creeks, and rivers of every sort.
It has deserts.
It has rainforests.
And for well over one hundred years it has had excellent coverage of collected meteorological data.
And for this one place, we can see one thing very clearly…it has had several separate multi decade trends in average temperature, both up and down.
And we can also see that the recent decades have not been the warmest time period over the past hundred plus years. Not even close to the warmest.
There was a decade nearly a century ago that was so hot it changed the course of history.
This hot period can be found to have been roughly coincidental with a hot period in locations all over the world with records from that same period.
That period was roughly the 1930s.
The recent years are not the most extreme in any category of weather statistic in this place.
Other time periods many decades ago had more and worse hurricanes, more and worse tornadoes, more and worse floods, more and worse droughts, more and worse blizzards, and also times that were about just like it is now.
In fact, this place with excellent records over a wide area and for a long extent of time shows that nothing unusual is happening at the present time at all, except that crops are growing ever more bountiful, trees and plants are spreading into areas that were once marginal for their growth, and everything is growing faster and better than ever before.
This area is the United States or course.
And it proves that everything that the warmistas claim to be true is in fact false.
The opposite of what they say is true.
I challenge anyone to give any plausible, or even possible, reason or logical explanation for how a large continent sized area of the planet is doing the opposite of what is claimed to be the case for the planet as a whole.
D Clancy, ask yourself…if you have very good pictures of one area of the world over a long time, and this one place is the only place that has such pictures over such a period of time, and it does not show what some people are claiming is the case by using bad pictures, or using no pictures but only what they think the pictures should look like…what are the chances that they say they can see in their imagination is more accurate and more true than what you can see in the one place that has actual pictures?
That is what is being claimed by the warmistas.
They claim to be better at knowing the past that people who lived in the past knew it.
They claim their imagination is a more accurate representation of reality than actual pictures.
They get a lot of money for believing this and saying it, and any who refuse to say this and believe it get not a lot of money but get fired from their jobs.
They never look out the window, but claim to know what is going on outside, better than people who live outside.
Year after year, for more than thirty years, they have made predictions regarding a huge number of events, and have literally never been correct even once.
They rewrite history to agree with things they claim are true, and then claim that history proves them to be correct.
And they want everyone to believe them so confidently that we should do everything they say to do.
In short, they make stuff up and change their own story constantly.
Is there any reason to believe people who tell you to disregard your eyes and trust their eyes?
Is there instance in any person’s experience that leads one to believe people that do that are telling the truth?
Is there any experience in our lives that dictates that people who are always guessing wrong, should be relied on for guidance about what is going to happen in the future?
There is no need for someone “hovering over this stream of data with an eraser.” That is pure hyperbole, Nick.
I expect AWS stations are designed to promptly notify HQ about abnormal occurrences. Maybe sound a klaxon in the break room? 🙂
Evidently the person handling such situations wasn’t quick enough to use the manual over-ride to adjust the
temperature to the preferred value before it was noticed. Sounds like it might be a policy to not allow new records to publicly be shown without approval from higher up the food chain.
By the way, as of today GHCND shows the ‘adjusted’ -10C rather than the temporarily shown -10.4C for Tmin on July 2nd at Goulburn. It will be interesting to see if it changes when GHCND updates that station again. They currently only have data up to July 3rd. Here is a link to the GHCND file.
ftp://ftp.ncdc.noaa.gov/pub/data/ghcn/daily/all/ASN00070330.dly
Bob
“Evidently the person handling such situations wasn’t quick enough to use the manual over-ride”
There is no person handling such situations on duty early Sunday morning. Or probably any time. Remember, there are about 720 stations posting data every 30 mins. That has to be done automatically.
That portion could also be automated even if no one is around.
Those temperatures are sent to HQ. I doubt they are stored on station. HQ probably immediately posts the value when it is received. Their problem might be a coding problem where HQ looks up the current record after posting, but doesn’t adjust the new record to within that range until the next posting cycle for that station
Since it is unlikely an outsider would observe that reading in the second it would take to update the temperature automatically, there must be some time lag for an outsider to observe the lower reading. Likely a posting cycle.
“Have you read the advice from the BoM to the minister?”
No. But I will if you link to it.
Hi Nick.
Over on realclimatescience, right now there is a GIF which flashes between a NASA ‘global temperature’ graph from 1999 and a NASA ‘global temperature’ graph from 2017.
Logic and science would state that the common part of the two graphs would be perfectly super imposed…they are not. The data has been manipulated to produce a more consistent warming.
Unless of course, you’re ‘denying’ that these are real graphs from NASA?
If so why don’t you pop over there and leave a message for Mr Heller, I’m sure he would be glad to defend himself.
“a GIF which flashes between a NASA ‘global temperature’ graph from 1999”
I looked through the page, and only saw a GIF for USHCN (lower 48 US). It’s frustrating when people can’t make that distinction. It is the animated gif shown upthread.
The reason for that discrepancy is a peculiarly US one. Volunteer observers were given a lot of latitude in TOBS (time when they reset). As I showed in the Boulder plot upthread, it matters when that changes (more in the link there). It has a big warming effect, because the NWS preference had been evening reading, but people drifted toward morning. USHCN introduced the adjustment for TOBS soon after 1999. It’s not optional. Once you have a record of a change, and a clear basis for calculating the effect, you have to allow for it in calculating an average.
My mistake…I guess you’re saying that temperatures in some parts of the ‘globe’ (namely the US which is probably the closest and most consistently observed part of the ‘globe’) are behaving differently to temperatures in other parts?
Also if the measurements in the US are so unreliable, how sure can we be about the temperatures in say, the Arctic, the Antarctic, the Southern Ocean, Africa or even Asia in say….1900?
You know before anyone was actually observing them at all?
The author of the RealClimateScience blog has demonstrated statistically that the Time Of Observation Bias adjustments are and were unjustified and therefore bogus.
If warm days were double counted, so too were cold nights, or cold days, or warm nights.
Just as cooling the past is somehow justified by a UHI adjustment, the claim of TOB adjustments being justified is an assertion. A very convenient one. And one that just happens to smooth out all the bumps and trend reversals in just the way that makes some inconvenient anomalies vanish. Just exactly as the Climategate emails describe doing.
And the sum total of all of the alterations just happens to produce a straight line when plotted against the climate McGuffin, CO2.
If it was a movie script no one would make the movie, because it is to laughably predictable.
Might as well make a mystery thriller in which the opening scene has someone describing the entire plot of the movie, right down to the surprise ending.
Every aspect of the entire CAGW meme is so hackneyed and telegraphed that the only real mystery is how anyone can claim to believe it with a straight face.
Tony Heller and others have shown conclusively that the adjustments are a contrivance of such obvious motive it is stunning anyone can defend them even after they have been outed for what they are.
It was obvious from the start to some of us, even if we lacked the means to prove such.
You should be ashamed of yourself.
“The author of the RealClimateScience blog has demonstrated statistically”
That author is incapable of demonstrating anything statistically. But If you think it can be done, please explain.
“That author is incapable of demonstrating anything statistically. But If you think it can be done, please explain.”
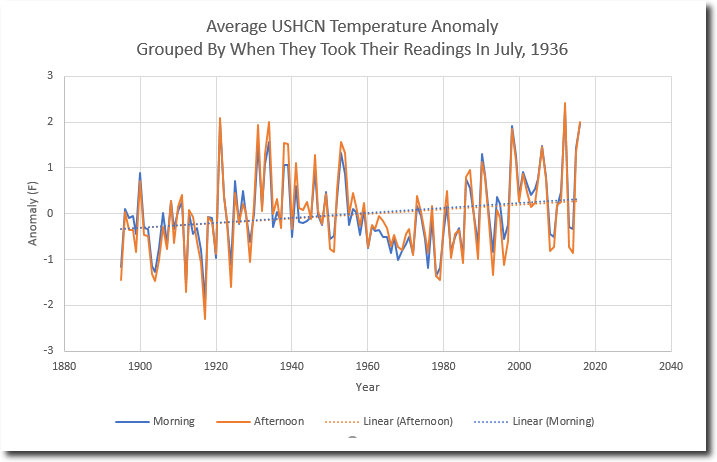
Not nice.
But beyond that, are you saying it cannot be done?
It is not in my skill set to do this sort of thing, but it is in yours, and in Tony’s.
It is unseemly of you to make such a remark of him.
But since you asked nicely, I will be happy to give you as many examples of how he has done so as you want.
He has not given me permission or anything, but I think fair usage applies. Or so I hope. I could be wrong.
Let’s start with one and go from there.
I will copy some of his text, and accompanying graphs, and then a link to the post.
Of which there are many.
Maybe you could respond with a refutation of his reasoning and a synopsis of the original justification for doing it. I can only imagine that, prior to adjusting the entire historical database of temperature records, that a very rigorous vetting procedure was performed, pros and cons weighed, peer review of the proposed methods done, objections noted analyzed and dispensed with in an agreed upon manner, etc.
I simply missed any of it.
I will have to break it up, or it will go into moderation…and it may anyway.
And I may not get back here until tomorrow afternoon, EDT.
I do not think the GIF files graphs will post as graphs, so anyone who wants to will likely have to click on them.
BTW, this one is random…it is very late here, I just pulled the top one from a search of his blog using the three letters, TOB:
“NOAA massively tampers with US temperature data, to turn a 90 year cooling trend into a warming trend.”
“NOAA says that station operators in the past used to reset their min/max thermometers in the afternoon, and now they reset them in the morning. The theory being that resetting thermometers in the afternoon causes double counting of hot days, and resetting thermometers in the morning causes double counting of cold days. So NOAA cools the past and warms the present to compensate.
This is easy to test. I split the stations up into two groups – those that took readings in the morning during July, 1936 and those that took readings in the afternoon during July, 1936. I chose July 1936 because, it was an extremely hot month, which NOAA’s adjustments massively cool.
NOAA is correct that most stations took their readings in the afternoon during that month: 937 currently active USHCN stations were afternoon stations in 1936, and only 140 were morning stations. So lets see how the trends compare.
The two groups of stations show identical trends in temperature anomaly. The TOBS adjustment is fake. There is no indication of double counting.”
“Additionally, the trends in the frequency of hot days are also identical for the two groups, but the morning stations tend to have more hot days. This is because people in warm climates tend to work earlier in the morning.”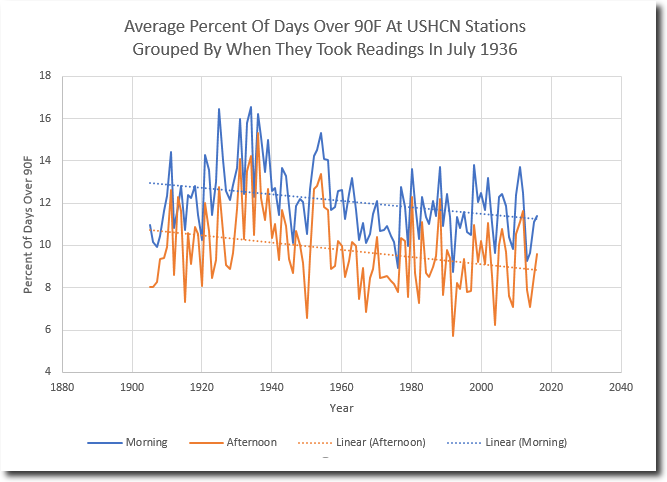
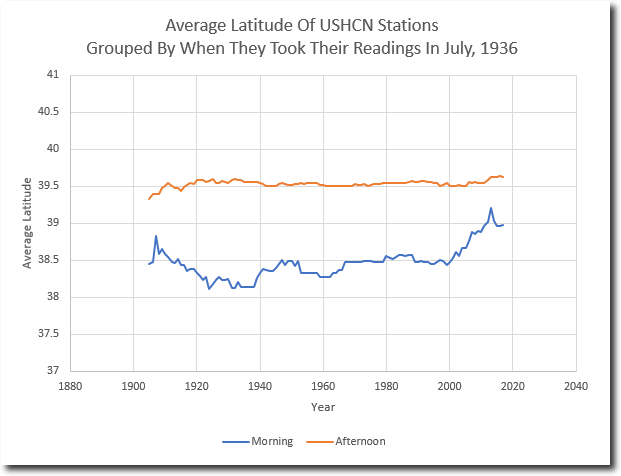
“This is confirmed by looking at the latitude of the stations. Morning stations average about one degree further south than afternoon stations.”
“Station history was obtained from this archived NOAA link : USHCN ORNL/CDIAC-87 NDP-019
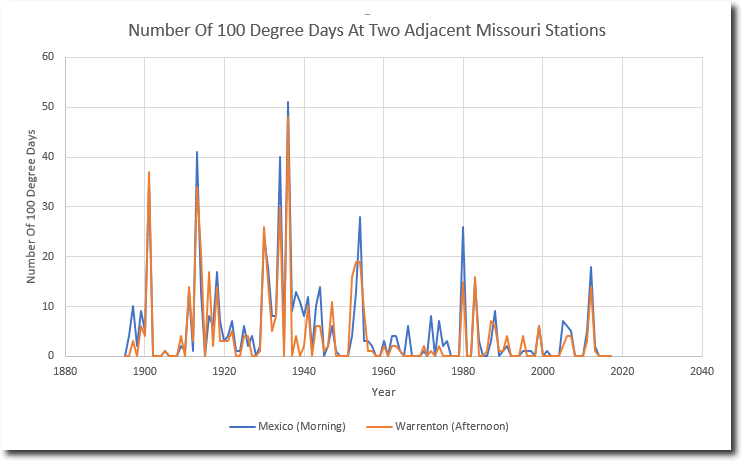
In order to test out double counting of hot days, I selected two adjacent stations in Missouri. Mexico, Missouri took their readings in the morning during July, 1936 and Warrenton, Missouri took their readings in the afternoon that month.”
“According to TOBS theory, we should see more 100 degree days in Warrenton than in Mexico, but we see the opposite. Mexico, Missouri consistently shows more 100 degree days than Warrenton, though the patterns are nearly identical. There is no indication that TOBS theory has any basis in reality.”
https://youtu.be/-oxKF6rW-W0
https://realclimatescience.com/2017/05/the-wildly-fraudulent-tobs-temperature-adjustment/
Morning station list :
FAIRHOPE 2 NE AL USC00012813
CHILDS AZ USC00021614
GRAND CANYON NP 2 AZ USC00023596
LEES FERRY AZ USC00024849
MIAMI AZ USC00025512
SACATON AZ USC00027370
SAFFORD AGRICULTRL C AZ USC00027390
YUMA CITRUS STN AZ USC00029652
GRAVETTE AR USC00032930
FAIRMONT CA USC00042941
HANFORD 1 S CA USC00043747
HEALDSBURG CA USC00043875
QUINCY CA USC00047195
SUSANVILLE 2SW CA USC00048702
TEJON RANCHO CA USC00048839
TUSTIN IRVINE RCH CA USC00049087
APALACHICOLA AIRPOR FL USC00080211
BARTOW 1SE FL USC00080478
BELLE GLADE FL USC00080611
FT LAUDERDALE FL USC00083163
MADISON FL USC00085275
PERRINE 4W FL USC00087020
TITUSVILLE FL USC00088942
HAWKINSVILLE GA USC00094170
QUITMAN 2 NW GA USC00097276
TIFTON GA USC00098703
ARROWROCK DAM ID USC00100448
CAMBRIDGE ID USC00101408
FENN RS ID USC00103143
HOLLISTER ID USC00104295
SALMON-KSRA ID USC00108080
CHARLES CITY IA USC00131402
FRANKFORT DOWNTOWN KY USC00153028
ALEXANDRIA LA USC00160098
PLAIN DEALING LA USC00167344
EASTPORT ME USC00172426
LEWISTON ME USC00174566
BLUE HILL MA USC00190736
ALLEGAN 5NE MI USC00200128
GREENVILLE MS USC00223605
NATCHEZ MS USC00226177
FARMINGTON MO USC00232809
MEXICO MO USC00235541
MTN GROVE 2 N MO USC00235834
UNIONVILLE MO USC00238523
KALISPELL GLACIER AP MT USC00244558
MOCCASIN EXP STN MT USC00245761
ALLIANCE 1WNW NE USC00250130
BEATRICE 1N NE USC00250622
CRETE 4ESE NE USC00252020
IMPERIAL NE USC00254110
NORTH LOUP NE USC00256040
SEWARD NE USC00257715
AUSTIN #2 NV USC00260507
FALLON EXP STN NV USC00262780
MCGILL NV USC00264950
MINA NV USC00265168
HANOVER NH USC00273850
LONG BRANCH OAKHURST NJ USC00284987
MOORESTOWN NJ USC00285728
PLAINFIELD NJ USC00287079
MTN PARK NM USC00295960
TULAROSA NM USC00299165
BATAVIA NY USC00300443
ELMIRA NY USC00302610
HEMLOCK NY USC00303773
INDIAN LAKE 2SW NY USC00304102
ITHACA CORNELL UNIV NY USC00304174
LAKE PLACID 2 S NY USC00304555
EMMONS NY USC00305113
OSWEGO E NY USC00306314
PORT JERVIS NY USC00306774
STILLWATER RSVR NY USC00308248
LUMBERTON NC USC00315177
DICKINSON EXP STN ND USC00322188
LANGDON EXP FARM ND USC00324958
MANDAN EXP STN ND USC00325479
NAPOLEON ND USC00326255
NEW ENGLAND ND USC00326315
WILLOW CITY ND USC00329445
FINDLAY WPCC OH USC00332791
GREENVILLE WTP OH USC00333375
PORTSMOUTH-SCIOTOVIL OH USC00336781
WAUSEON WTP OH USC00338822
BEND OR USC00350694
PILOT ROCK 1 SE OR USC00356634
ROSEBURG KQEN OR USC00357331
FRANKLIN PA USC00363028
JOHNSTOWN PA USC00364385
PALMERTON PA USC00366689
READING 4 NNW PA USC00367322
RIDGWAY PA USC00367477
STATE COLLEGE PA USC00368449
STROUDSBURG PA USC00368596
WARREN PA USC00369298
CALHOUN FALLS SC USC00381277
CAMDEN 3 W SC USC00381310
CHERAW SC USC00381588
COLUMBIA UNIV OF SC SC USC00381944
CONWAY SC USC00381997
DARLINGTON SC USC00382260
KINGSTREE SC USC00384753
ORANGEBURG 2 SC USC00386527
YEMASSEE 1 N SC USC00389469
RAPID CITY 4NW SD USC00396947
UNION CITY TN USC00409219
ALICE TX USC00410144
BALLINGER 2 NW TX USC00410493
BRENHAM TX USC00411048
CORSICANA TX USC00412019
DUBLIN 2SE TX USC00412598
EAGLE PASS 3N TX USC00412679
FLATONIA 4SE TX USC00413183
HASKELL TX USC00413992
LAMPASAS TX USC00415018
LLANO TX USC00415272
MCCAMEY TX USC00415707
MEXIA TX USC00415869
PECOS TX USC00416892
RIO GRANDE CITY TX USC00417622
TEMPLE TX USC00418910
LOGAN UTAH ST UNIV UT USC00425186
LEXINGTON VA USC00444876
ROCKY MT VA USC00447338
STAUNTON WTP VA USC00448062
ABERDEEN WA USC00450008
BLAINE WA USC00450729
CLEARBROOK WA USC00451484
LONG BEACH EXP STN WA USC00454748
POMEROY WA USC00456610
PORT ANGELES WA USC00456624
PULLMAN 2 NW WA USC00456789
RAYMOND 2 S WA USC00456914
SUNNYSIDE WA USC00458207
PARSONS 1 NE WV USC00466867
OSHKOSH WI USC00476330
MIDWEST WY USC00486195
NEWCASTLE WY USC00486660
WORLAND WY USC00489770
YELLOWSTONE PK MAMMO WY USC00489905
Afternoon station list :
BREWTON 3 SSE AL USC00011084
GAINESVILLE LOCK AL USC00013160
GREENSBORO AL USC00013511
HIGHLAND HOME AL USC00013816
SAINT BERNARD AL USC00017157
SCOTTSBORO AL USC00017304
SELMA AL USC00017366
TALLADEGA AL USC00018024
THOMASVILLE AL USC00018178
TROY AL USC00018323
UNION SPRINGS 9 S AL USC00018438
VALLEY HEAD AL USC00018469
AJO AZ USC00020080
BUCKEYE AZ USC00021026
CANYON DE CHELLY AZ USC00021248
FT VALLEY AZ USC00023160
HOLBROOK AZ USC00024089
KINGMAN #2 AZ USC00024645
PARKER AZ USC00026250
PRESCOTT AZ USC00026796
ROOSEVELT 1 WNW AZ USC00027281
SAINT JOHNS AZ USC00027435
SELIGMAN AZ USC00027716
TOMBSTONE AZ USC00028619
TUCSON WFO AZ USC00028815
WICKENBURG AZ USC00029287
WILLIAMS AZ USC00029359
BRINKLEY AR USC00030936
CONWAY AR USC00031596
CORNING AR USC00031632
EUREKA SPRINGS 3 WNW AR USC00032356
FAYETTEVILLE EXP STN AR USC00032444
MAMMOTH SPRING AR USC00034572
MENA AR USC00034756
NEWPORT AR USC00035186
PINE BLUFF AR USC00035754
POCAHONTAS 1 AR USC00035820
PRESCOTT 2 NNW AR USC00035908
ROHWER 2 NNE AR USC00036253
SUBIACO AR USC00036928
BERKELEY CA USC00040693
BLYTHE CA USC00040924
BRAWLEY 2 SW CA USC00041048
CEDARVILLE CA USC00041614
CHICO UNIV FARM CA USC00041715
CHULA VISTA CA USC00041758
COLFAX CA USC00041912
CUYAMACA CA USC00042239
DAVIS 2 WSW EXP FARM CA USC00042294
DEATH VALLEY CA USC00042319
ELECTRA P H CA USC00042728
FT BRAGG 5 N CA USC00043161
HAPPY CAMP RS CA USC00043761
INDEPENDENCE CA USC00044232
INDIO FIRE STN CA USC00044259
LAKE SPAULDING CA USC00044713
LEMON COVE CA USC00044890
LIVERMORE CA USC00044997
LODI CA USC00045032
MARYSVILLE CA USC00045385
MERCED CA USC00045532
MT SHASTA CA USC00045983
NAPA STATE HOSPITAL CA USC00046074
NEWPORT BEACH HARBOR CA USC00046175
OJAI CA USC00046399
ORLAND CA USC00046506
ORLEANS CA USC00046508
PASADENA CA USC00046719
PASO ROBLES CA USC00046730
PETALUMA AIRPORT CA USC00046826
REDLANDS CA USC00047306
SAN LUIS OBISPO POLY CA USC00047851
SANTA BARBARA CA USC00047902
SANTA CRUZ CA USC00047916
SANTA ROSA CA USC00047965
TAHOE CITY CA USC00048758
UKIAH CA USC00049122
VACAVILLE CA USC00049200
WASCO CA USC00049452
WEAVERVILLE CA USC00049490
WILLOWS 6 W CA USC00049699
YOSEMITE PARK HQ CA USC00049855
YREKA CA USC00049866
BOULDER CO USC00050848
CANON CITY CO USC00051294
CHEESMAN CO USC00051528
CHEYENNE WELLS CO USC00051564
COLLBRAN CO USC00051741
DEL NORTE 3ENE CO USC00052184
DILLON 1 E CO USC00052281
EADS CO USC00052446
FT COLLINS CO USC00053005
FT MORGAN CO USC00053038
FRUITA CO USC00053146
GUNNISON 3SW CO USC00053662
HERMIT 7 ESE CO USC00053951
HOLLY CO USC00054076
LAMAR CO USC00054770
LAS ANIMAS CO USC00054834
MANASSA CO USC00055322
MONTROSE #2 CO USC00055722
ROCKY FORD 2 SE CO USC00057167
SAGUACHE CO USC00057337
STEAMBOAT SPRINGS CO USC00057936
TELLURIDE 4WNW CO USC00058204
TRINIDAD CO USC00058429
WRAY CO USC00059243
FALLS VILLAGE CT USC00062658
GROTON CT USC00063207
STAMFORD 5 N CT USC00067970
STORRS CT USC00068138
DOVER DE USC00072730
GREENWOOD 2NE DE USC00073595
MILFORD 2 SE DE USC00075915
WILMINGTON PORTER RS DE USC00079605
ARCADIA FL USC00080228
DE FUNIAK SPRINGS 1 FL USC00082220
EVERGLADES FL USC00082850
FEDERAL PT FL USC00082915
FERNANDINA BEACH FL USC00082944
FT PIERCE FL USC00083207
INVERNESS 3 SE FL USC00084289
LAKE CITY 2 E FL USC00084731
OCALA FL USC00086414
SAINT LEO FL USC00087851
TARPON SPGS SEWAGE P FL USC00088824
ALBANY 3 SE GA USC00090140
BAINBRIDGE INTL PAPE GA USC00090586
BRUNSWICK GA USC00091340
COVINGTON GA USC00092318
DAHLONEGA 4WSW GA USC00092475
EASTMAN 1 W GA USC00092966
GAINESVILLE GA USC00093621
GLENNVILLE 3NW GA USC00093754
MILLEDGEVILLE GA USC00095874
MILLEN 4 N GA USC00095882
NEWNAN 7 WNW GA USC00096335
ROME GA USC00097600
TALBOTTON GA USC00098535
TOCCOA GA USC00098740
WARRENTON GA USC00099141
WASHINGTON 2 ESE GA USC00099157
WAYCROSS 4 NE GA USC00099186
W PT GA USC00099291
ABERDEEN EXP STN ID USC00100010
ASHTON 1N ID USC00100470
DWORSHAK FISH HATCHE ID USC00102845
GLENNS FERRY ID USC00103631
GRACE ID USC00103732
HAZELTON ID USC00104140
JEROME ID USC00104670
KELLOGG ID USC00104831
KETCHUM RS ID USC00104845
LIFTON PUMPING STN ID USC00105275
MACKAY LOST RVR RS ID USC00105462
MOSCOW U OF I ID USC00106152
NEW MEADOWS RS ID USC00106388
OAKLEY ID USC00106542
PAYETTE ID USC00106891
PORTHILL ID USC00107264
PRIEST RVR EXP STN ID USC00107386
SANDPOINT EXP STN ID USC00108137
ALEDO IL USC00110072
ANNA 2 NNE IL USC00110187
AURORA IL USC00110338
CARLINVILLE IL USC00111280
CHARLESTON IL USC00111436
DANVILLE IL USC00112140
DECATUR WTP IL USC00112193
DIXON 1W IL USC00112348
DU QUOIN 4 SE IL USC00112483
GALVA IL USC00113335
HARRISBURG IL USC00113879
HILLSBORO IL USC00114108
HOOPESTON IL USC00114198
JACKSONVILLE 2E IL USC00114442
LA HARPE IL USC00114823
LINCOLN IL USC00115079
MARENGO IL USC00115326
MCLEANSBORO IL USC00115515
MINONK IL USC00115712
MONMOUTH IL USC00115768
MORRISON IL USC00115833
MT CARROLL IL USC00115901
MT VERNON 3 NE IL USC00115943
OLNEY 2S IL USC00116446
OTTAWA 5SW IL USC00116526
PALESTINE IL USC00116558
PANA IL USC00116579
PARIS STP IL USC00116610
PONTIAC IL USC00116910
RUSHVILLE 4NE IL USC00117551
SPARTA 1 W IL USC00118147
CHAMPAIGN 3S IL USC00118740
WALNUT IL USC00118916
WHITE HALL 1 E IL USC00119241
WINDSOR IL USC00119354
ANDERSON SEWAGE PLT IN USC00120177
ANGOLA IN USC00120200
BERNE WWTP IN USC00120676
BLOOMINGTON INDIANA IN USC00120784
BROOKVILLE IN USC00121030
CAMBRIDGE CITY 3 N IN USC00121229
CHARLESTOWN 5 NNW IN USC00121425
COLUMBUS IN USC00121747
CRAWFORDSVILLE 6 SE IN USC00121873
DELPHI 2 N IN USC00122149
GOSHEN 3SW IN USC00123418
GREENCASTLE 1 W IN USC00123513
GREENFIELD IN USC00123527
HOBART 2 WNW IN USC00124008
HUNTINGTON IN USC00124181
LAPORTE IN USC00124837
MADISON SEWAGE PLT IN USC00125237
MARION 2 N IN USC00125337
MT VERNON IN USC00126001
OOLITIC PURDUE EX FM IN USC00126580
PAOLI IN USC00126705
PRINCETON 1 W IN USC00127125
RENSSELAER IN USC00127298
ROCHESTER IN USC00127482
ROCKVILLE IN USC00127522
RUSHVILLE IN USC00127646
SALEM IN USC00127755
SCOTTSBURG IN USC00127875
SEYMOUR 2 N IN USC00127935
SHOALS 8 S IN USC00128036
VEVAY IN USC00129080
VINCENNES 5 NE IN USC00129113
WASHINGTON 1 W IN USC00129253
WHEATFIELD IN USC00129511
WHITESTOWN IN USC00129557
WINAMAC 2SSE IN USC00129670
ALBIA 3 NNE IA USC00130112
ALGONA 3 W IA USC00130133
BELLE PLAINE IA USC00130600
CLARINDA IA USC00131533
CLINTON #1 IA USC00131635
ESTHERVILLE 4E IA USC00132724
FAIRFIELD IA USC00132789
FAYETTE IA USC00132864
FOREST CITY 2 NNE IA USC00132977
FT DODGE 5NNW IA USC00132999
INDIANOLA 2W IA USC00134063
IOWA FALLS IA USC00134142
LE MARS IA USC00134735
LOGAN IA USC00134894
MT AYR IA USC00135769
MT PLEASANT 1 SSW IA USC00135796
NEW HAMPTON IA USC00135952
ROCK RAPIDS IA USC00137147
ROCKWELL CITY IA USC00137161
STORM LAKE IA USC00137979
TOLEDO 3N IA USC00138296
WASHINGTON IA USC00138688
ASHLAND KS USC00140365
ATCHISON KS USC00140405
COLDWATER KS USC00141704
COLUMBUS KS USC00141740
EL DORADO KS USC00142401
ELLSWORTH KS USC00142459
FT SCOTT KS USC00142835
HAYS 1 S KS USC00143527
HORTON KS USC00143810
INDEPENDENCE KS USC00143954
JETMORE 8NNW KS USC00144087
LAKIN KS USC00144464
LARNED KS USC00144530
LAWRENCE KS USC00144559
LEAVENWORTH KS USC00144588
LIBERAL KS USC00144695
MANHATTAN KS USC00144972
MCPHERSON KS USC00145152
MEDICINE LODGE KS USC00145173
MINNEAPOLIS KS USC00145363
NORTON 9SSE KS USC00145856
OBERLIN KS USC00145906
OLATHE 3E KS USC00145972
OTTAWA KS USC00146128
SAINT FRANCIS KS USC00147093
SCOTT CITY KS USC00147271
SEDAN KS USC00147305
WAKEENEY KS USC00148495
ASHLAND KY USC00150254
BEREA COLLEGE KY USC00150619
CAVE RUN LAKE KY USC00152791
GREENSBURG KY USC00153430
HOPKINSVILLE KY USC00153994
LEITCHFIELD 2 N KY USC00154703
SHELBYVILLE 1 E KY USC00157324
WILLIAMSBURG KY USC00158709
WILLIAMSTOWN KY USC00158714
AMITE LA USC00160205
BASTROP LA USC00160537
BUNKIE LA USC00161287
CALHOUN RSCH STN LA USC00161411
COVINGTON 4 NNW LA USC00162151
DONALDSONVILLE 4 SW LA USC00162534
FRANKLIN 3 NW LA USC00163313
GRAND COTEAU LA USC00163800
HOUMA LA USC00164407
JENNINGS LA USC00164700
ST JOSEPH 3 N LA USC00168163
THIBODAUX 4 SE LA USC00169013
WINNSBORO 5 SSE LA USC00169806
ACADIA NP ME USC00170100
FARMINGTON ME USC00172765
GARDINER ME USC00173046
HOULTON 5N ME USC00173944
MILLINOCKET ME USC00175304
PRESQUE ISLE ME USC00176937
WOODLAND ME USC00179891
CAMBRIDGE WATER TRMT MD USC00181385
CHESTERTOWN MD USC00181750
CUMBERLAND 2 MD USC00182282
DENTON 2 E MD USC00182523
GLENN DALE BELL STN MD USC00183675
LAUREL 3 W MD USC00185111
MILLINGTON 1 SE MD USC00185985
OAKLAND 1 SE MD USC00186620
OWINGS FERRY LANDING MD USC00186770
PRINCESS ANNE MD USC00187330
ROYAL OAK 2 SSW MD USC00187806
SALISBURY MD USC00188000
WESTMINSTER MD USC00189440
WOODSTOCK MD USC00189750
AMHERST MA USC00190120
BEDFORD MA USC00190535
GREAT BARRINGTON 2N MA USC00193213
LAWRENCE MA USC00194105
NEW BEDFORD MA USC00195246
PLYMOUTH-KINGSTON MA USC00196486
PROVINCETOWN MA USC00196681
TAUNTON MA USC00198367
ADRIAN 2 NNE MI USC00200032
ALMA MI USC00200146
ANN ARBOR U OF MICH MI USC00200230
BIG RAPIDS WTR WKS MI USC00200779
CHAMPION VAN RIPER P MI USC00201439
CHATHAM EXP FARM 2 MI USC00201486
CHEBOYGAN MI USC00201492
COLDWATER ST SCHOOL MI USC00201675
EAST TAWAS MI USC00202423
FAYETTE 4 SW MI USC00202737
HART 3 WSW MI USC00203632
HILLSDALE MI USC00203823
IRON MT KINGSFORD WW MI USC00204090
IRONWOOD MI USC00204104
KALAMAZOO STATE HOSP MI USC00204244
MIDLAND MI USC00205434
CENTRAL MICHIGAN UNI MI USC00205662
MUNISING MI USC00205690
NEWBERRY CORRECTIONA MI USC00205816
OWOSSO WWTP MI USC00206300
S HAVEN MI USC00207690
STAMBAUGH 2SSE MI USC00207812
ADA MN USC00210018
ALBERT LEA 3 SE MN USC00210075
BAUDETTE MN USC00210515
CHASKA MN USC00211465
CLOQUET MN USC00211630
DETROIT LAKES 1 NNE MN USC00212142
EVELETH WWTP MN USC00212645
FAIRMONT MN USC00212698
FARMINGTON 3 NW MN USC00212737
FOSSTON 1 E MN USC00212916
GRAND MEADOW MN USC00213290
ITASCA UNIV OF MINN MN USC00214106
LEECH LAKE MN USC00214652
MILAN 1 NW MN USC00215400
MONTEVIDEO 1 SW MN USC00215563
MORA MN USC00215615
MORRIS W CNTRL RSCH MN USC00215638
NEW ULM 2 SE MN USC00215887
OLIVIA 3E MN USC00216152
PINE RVR DAM MN USC00216547
PIPESTONE MN USC00216565
ROSEAU MN USC00217087
ST PETER MN USC00217405
SANDY LAKE DAM LIBBY MN USC00217460
TWO HARBORS MN USC00218419
WALKER MN USC00218618
WINNEBAGO MN USC00219046
ZUMBROTA MN USC00219249
ABERDEEN MS USC00220021
BATESVILLE 2 SW MS USC00220488
BOONEVILLE MS USC00220955
BROOKHAVEN CITY MS USC00221094
CANTON 4N MS USC00221389
CLARKSDALE MS USC00221707
COLUMBIA MS USC00221865
COLUMBUS MS USC00221880
CORINTH 7 SW MS USC00221962
CRYSTAL SPGS EXP STN MS USC00222094
FOREST MS USC00223107
HATTIESBURG 5SW MS USC00223887
HOLLY SPRINGS 4 N MS USC00224173
KOSCIUSKO MS USC00224776
LAUREL MS USC00224939
LOUISVILLE MS USC00225247
MONTICELLO MS USC00225987
MOORHEAD MS USC00226009
PASCAGOULA 3 NE MS USC00226718
PONTOTOC EXP STN MS USC00227111
POPLARVILLE EXP STN MS USC00227128
PORT GIBSON 1 NE MS USC00227132
STATE UNIV MS USC00228374
UNIVERSITY MS USC00229079
WATER VALLEY MS USC00229400
WAVELAND MS USC00229426
WAYNESBORO 2 W MS USC00229439
WOODVILLE 4 ESE MS USC00229793
YAZOO CITY 5 NNE MS USC00229860
APPLETON CITY MO USC00230204
BOWLING GREEN 1 E MO USC00230856
BRUNSWICK MO USC00231037
CARUTHERSVILLE MO USC00231364
CLINTON MO USC00231711
CONCEPTION MO USC00231822
DONIPHAN MO USC00232289
JEFFERSON CITY WTP MO USC00234271
LAMAR 7N MO USC00234705
LEBANON 2W MO USC00234825
LEES SUMMIT REED WR MO USC00234850
LEXINGTON 3E MO USC00234904
LOCKWOOD MO USC00235027
MARBLE HILL MO USC00235253
MOBERLY MO USC00235671
NEOSHO MO USC00235976
ROLLA MISSOURI S T MO USC00237263
SPICKARD 7 W MO USC00237963
STEFFENVILLE MO USC00238051
SWEET SPRINGS MO USC00238223
TRUMAN DAM RSVR MO USC00238466
WARRENTON 1 N MO USC00238725
ANACONDA MT USC00240199
AUGUSTA MT USC00240364
BIG TIMBER MT USC00240780
BOZEMAN MONTANA STAT MT USC00241044
CASCADE 5 S MT USC00241552
CHINOOK MT USC00241722
CHOTEAU MT USC00241737
DILLON U OF MONTANA MT USC00242409
EKALAKA MT USC00242689
ENNIS MT USC00242793
FLATWILLOW 4 ENE MT USC00243013
FORKS 4 NNE MT USC00243089
FT ASSINIBOINE MT USC00243110
FORTINE 1 N MT USC00243139
GLENDIVE MT USC00243581
HAMILTON MT USC00243885
HEBGEN DAM MT USC00244038
HUNTLEY EXP STN MT USC00244345
JORDAN MT USC00244522
LIBBY 1 NE RS MT USC00245015
LIVINGSTON 12 S MT USC00245080
MALTA 7 E MT USC00245338
MILDRED 5 N MT USC00245668
NORRIS MADISON PWR H MT USC00246157
PHILIPSBURG RS MT USC00246472
PLEVNA MT USC00246601
RED LODGE MT USC00246918
SAINT IGNATIUS MT USC00247286
SAVAGE MT USC00247382
VALIER MT USC00248501
VIRGINIA CITY MT USC00248597
WEST YELLOWSTONE MT USC00248857
WHITE SULPHUR SPRING MT USC00248930
ALBION NE USC00250070
ASHLAND NO 2 NE USC00250375
ATKINSON 3SW NE USC00250420
AUBURN 5 ESE NE USC00250435
BEAVER CITY NE USC00250640
BRIDGEPORT NE USC00251145
BROKEN BOW 2 W NE USC00251200
CURTIS 3NNE NE USC00252100
DAVID CITY NE USC00252205
FAIRBURY 5S NE USC00252820
FAIRMONT NE USC00252840
FRANKLIN NE USC00253035
GENEVA NE USC00253175
GENOA 2 W NE USC00253185
GOTHENBURG NE USC00253365
HARRISON NE USC00253615
HARTINGTON NE USC00253630
HASTINGS 4N NE USC00253660
HAY SPRINGS 12 S NE USC00253715
HEBRON NE USC00253735
HOLDREGE NE USC00253910
KIMBALL 2NE NE USC00254440
LODGEPOLE NE USC00254900
LOUP CITY NE USC00254985
MADISON NE USC00255080
MC COOK NE USC00255310
MERRIMAN NE USC00255470
MINDEN NE USC00255565
OAKDALE NE USC00256135
PAWNEE CITY NE USC00256570
PURDUM NE USC00256970
RED CLOUD NE USC00257070
SAINT PAUL NE USC00257515
SYRACUSE NE USC00258395
TECUMSEH 1S NE USC00258465
TEKAMAH NE USC00258480
WAKEFIELD NE USC00258915
WEEPING WATER NE USC00259090
YORK NE USC00259510
BOULDER CITY NV USC00261071
GOLCONDA NV USC00263245
LOVELOCK NV USC00264698
SEARCHLIGHT NV USC00267369
WELLS NV USC00268988
DURHAM NH USC00272174
FIRST CONNECTICUT LA NH USC00272999
KEENE NH USC00274399
BELVIDERE BRG NJ USC00280734
BOONTON 1 SE NJ USC00280907
CHARLOTTEBURG RESERV NJ USC00281582
FLEMINGTON 5 NNW NJ USC00283029
HIGHTSTOWN 2 W NJ USC00283951
INDIAN MILLS 2 W NJ USC00284229
NEW BRUNSWICK 3 SE NJ USC00286055
AZTEC RUINS NM NM USC00290692
BELL RANCH NM USC00290858
CARLSBAD NM USC00291469
CHAMA NM USC00291664
CIMARRON 4 SW NM USC00291813
ELEPHANT BUTTE DAM NM USC00292848
FT BAYARD NM USC00293265
FT SUMNER NM USC00293294
GAGE NM USC00293368
JEMEZ SPRINGS NM USC00294369
JORNADA EXP RANGE NM USC00294426
LAS VEGAS WWTP NM USC00294862
LOS LUNAS 3 SSW NM USC00295150
LUNA RS NM USC00295273
MOUNTAINAIR NM USC00295965
OROGRANDE NM USC00296435
RED RIVER NM USC00297323
SAN JON NM USC00297867
SANTA ROSA NM USC00298107
SOCORRO NM USC00298387
SPRINGER NM USC00298501
STATE UNIV NM USC00298535
TUCUMCARI 4 NE NM USC00299156
ALFRED NY USC00300085
ALLEGANY SP NY USC00300093
ANGELICA NY USC00300183
AUBURN NY USC00300321
BRIDGEHAMPTON NY USC00300889
BROCKPORT NY USC00300937
CHAZY NY USC00301401
COOPERSTOWN NY USC00301752
CORTLAND NY USC00301799
DANNEMORA NY USC00301966
DANSVILLE NY USC00301974
FREDONIA NY USC00303033
GENEVA RSCH FARM NY USC00303184
GLENHAM NY USC00303259
GLOVERSVILLE NY USC00303319
LAWRENCEVILLE 3 SW NY USC00304647
LITTLE FALLS CITY RS NY USC00304791
LITTLE FALLS MILL ST NY USC00304796
LOCKPORT NY USC00304844
LOWVILLE NY USC00304912
MOHONK LAKE NY USC00305426
MORRISVILLE 6 SW NY USC00305512
NORWICH NY USC00306085
OGDENSBURG 4 NE NY USC00306164
SARATOGA SPRINGS 4 S NY USC00307484
SETAUKET STRONG NY USC00307633
TROY L D NY USC00308600
TUPPER LAKE SUNMOUNT NY USC00308631
WALDEN 1 ESE NY USC00308906
WALES NY USC00308910
WANAKENA RNGR SCHOOL NY USC00308944
WATERTOWN NY USC00309000
WEST POINT NY USC00309292
YORKTOWN HTS 1W NY USC00309670
ALBEMARLE NC USC00310090
CHAPEL HILL 2 W NC USC00311677
EDENTON NC USC00312635
ELIZABETH CITY NC USC00312719
FAYETTEVILLE (PWC) NC USC00313017
HENDERSON 2 NNW NC USC00313969
HENDERSONVILLE 1 NE NC USC00313976
HIGHLANDS NC USC00314055
KINSTON 7 SE NC USC00314684
LENOIR NC USC00314938
LOUISBURG NC USC00315123
MARION NC USC00315340
MARSHALL NC USC00315356
MONROE 2 SE NC USC00315771
MOREHEAD CITY 2 WNW NC USC00315830
MORGANTON NC USC00315838
MT AIRY 2 W NC USC00315890
REIDSVILLE 2 NW NC USC00317202
SALISBURY NC USC00317615
SMITHFIELD NC USC00317994
SOUTHPORT 5 N NC USC00318113
STATESVILLE 2 NNE NC USC00318292
TARBORO 1 S NC USC00318500
WAYNESVILLE 1 E NC USC00319147
WILSON 3 SW NC USC00319476
BOTTINEAU ND USC00320941
CROSBY ND USC00321871
DUNN CENTER 1E ND USC00322365
FT YATES 4 SW ND USC00323207
FULLERTON 1 ESE ND USC00323287
GRAFTON ND USC00323594
GRAND FORKS UNIV (NW ND USC00323621
HETTINGER ND USC00324178
HILLSBORO 3 N ND USC00324203
JAMESTOWN STATE HOSP ND USC00324418
LISBON ND USC00325220
MOFFIT 3 SE ND USC00326015
MOTT ND USC00326155
RICHARDTON ABBEY ND USC00327530
TOWNER 2 NE ND USC00328792
WAHPETON 3 N ND USC00329100
BUCYRUS OH USC00331072
CADIZ OH USC00331152
CHIPPEWA LAKE OH USC00331541
CIRCLEVILLE OH USC00331592
COSHOCTON WPC PLT OH USC00331890
DELAWARE OH USC00332119
HILLSBORO OH USC00333758
HIRAM OH USC00333780
KENTON OH USC00334189
MC CONNELLSVILLE LK OH USC00335041
MILLERSBURG OH USC00335297
MILLPORT 4 NE OH USC00335315
NORWALK WWTP OH USC00336118
OBERLIN OH USC00336196
PHILO 3 SW OH USC00336600
TIFFIN OH USC00338313
UPPER SANDUSKY OH USC00338534
URBANA WWTP OH USC00338552
WARREN 3 S OH USC00338769
WAUSEON WTP OH USC00338822
WAVERLY OH USC00338830
WOOSTER EXP STATION OH USC00339312
ADA OK USC00340017
ALTUS IRIG RSCH STN OK USC00340179
ANTLERS OK USC00340256
ARDMORE OK USC00340292
BEAVER OK USC00340593
BOISE CITY 2 E OK USC00340908
BUFFALO 2 SSW OK USC00341243
CARNEGIE 5 NE OK USC00341504
CHEROKEE 4W OK USC00341724
CLAREMORE 2 ENE OK USC00341828
DURANT OK USC00342678
ENID OK USC00342912
ERICK OK USC00342944
GEARY OK USC00343497
GOODWELL RSCH STN OK USC00343628
GUTHRIE 5S OK USC00343821
HAMMON 3 SSW OK USC00343871
HENNESSEY 4 ESE OK USC00344055
HOLDENVILLE 2SSE OK USC00344235
HOOKER OK USC00344298
JEFFERSON OK USC00344573
KENTON OK USC00344766
KINGFISHER OK USC00344861
LAWTON OK USC00345063
MANGUM OK USC00345509
MEEKER 5 W OK USC00345779
MIAMI OK USC00345855
MUSKOGEE OK USC00346130
MUTUAL OK USC00346139
NEWKIRK 5NE OK USC00346278
OKEENE OK USC00346629
OKEMAH OK USC00346638
OKMULGEE WTR WKS OK USC00346670
PAULS VALLEY 4 WSW OK USC00346926
PAWHUSKA OK USC00346935
PERRY OK USC00347012
POTEAU WTR WKS OK USC00347254
STILLWATER 2 W OK USC00348501
TAHLEQUAH OK USC00348677
WAURIKA OK USC00349395
WEATHERFORD OK USC00349422
WEBBERS FALLS 5 WSW OK USC00349445
ASHLAND OR USC00350304
BROOKINGS 2 SE OR USC00351055
CASCADIA OR USC00351433
CONDON OR USC00351765
CORVALLIS STATE UNIV OR USC00351862
COTTAGE GROVE 2E OR USC00351897
CRATER LAKE NPS HQ OR USC00351946
DANNER OR USC00352135
DUFUR OR USC00352440
FOREST GROVE OR USC00352997
FREMONT 5 NW OR USC00353095
GRANTS PASS OR USC00353445
HEADWORKS PORTLAND W OR USC00353770
HEPPNER OR USC00353827
HERMISTON 1 SE OR USC00353847
HOOD RVR EXP STN OR USC00354003
KLAMATH FALLS 2 SSW OR USC00354506
LAKEVIEW 2 NNW OR USC00354670
MCKENZIE BRG RS OR USC00355362
MC MINNVILLE OR USC00355384
MILTON FREEWATER OR USC00355593
MORO OR USC00355734
PAISLEY OR USC00356426
PRINEVILLE OR USC00356883
PROSPECT 2 SW OR USC00356907
RIDDLE OR USC00357169
THREE LYNX OR USC00358466
TILLAMOOK OR USC00358494
UNION EXP STN OR USC00358746
VALE OR USC00358797
WALLOWA OR USC00358997
CHAMBERSBURG 1 ESE PA USC00361354
EISENHOWER NHS PA USC00362537
GREENVILLE 2 NE PA USC00363526
MONTROSE PA USC00365915
NEW CASTLE 1 N PA USC00366233
SELINSGROVE 2 S PA USC00367931
TOWANDA 1 S PA USC00368905
UNIONTOWN 1 NE PA USC00369050
WELLSBORO 4 SW PA USC00369408
W CHESTER 2 NW PA USC00369464
YORK 3 SSW PUMP STN PA USC00369933
KINGSTON RI USC00374266
AIKEN 5SE SC USC00380074
ANDERSON SC USC00380165
BEAUFORT WWTP SC USC00380559
BLACKVILLE 3 W SC USC00380764
CLEMSON UNIV SC USC00381770
CONWAY SC USC00381997
GEORGETOWN 2 E SC USC00383468
GREENWOOD SC USC00383754
KERSHAW 1SW SC USC00384690
LAURENS SC USC00385017
LITTLE MTN SC USC00385200
NEWBERRY SC USC00386209
SALUDA SC USC00387631
SANTUCK SC USC00387722
SUMMERVILLE 4W SC USC00388426
SUMTER SC USC00388440
WALHALLA SC USC00388887
WINNSBORO SC USC00389327
WINTHROP UNIV SC USC00389350
ACADEMY 2NE SD USC00390043
ALEXANDRIA SD USC00390128
CANTON SD USC00391392
CLARK SD USC00391739
COTTONWOOD 2 E SD USC00391972
DUPREE SD USC00392429
EUREKA SD USC00392797
FAULKTON 1 NW SD USC00392927
FORESTBURG 4 NNE SD USC00393029
GANN VALLEY 4NW SD USC00393217
HIGHMORE 1 W SD USC00393832
HOT SPRINGS SD USC00394007
HOWARD SD USC00394037
KENNEBEC SD USC00394516
MELLETTE 4 W SD USC00395456
MENNO SD USC00395481
MILBANK 4 NW SD USC00395536
MURDO SD USC00395891
OAHE DAM SD USC00396170
VERMILLION 2 SE SD USC00398622
WOOD SD USC00399442
CLARKSVILLE WWTP TN USC00401790
COPPERHILL TN USC00402024
COVINGTON 3 SW TN USC00402108
CROSSVILLE ED RESE TN USC00402202
DICKSON TN USC00402489
DOVER 1 W TN USC00402589
JACKSON EXP STN TN USC00404561
LEWISBURG EXP STN TN USC00405187
MC MINNVILLE TN USC00405882
MURFREESBORO 5 N TN USC00406371
NEWPORT 1 NW TN USC00406534
ROGERSVILLE 1 NE TN USC00407884
TULLAHOMA TN USC00409155
WAYNESBORO TN USC00409502
ALBANY TX USC00410120
ALPINE TX USC00410174
BALMORHEA TX USC00410498
BEEVILLE 5 NE TX USC00410639
BLANCO TX USC00410832
BOERNE TX USC00410902
BOYS RCH TX USC00411000
BROWNWOOD 2ENE TX USC00411138
CATARINA TX USC00411528
CLARKSVILLE 2NE TX USC00411772
CROSBYTON TX USC00412121
DANEVANG 1 W TX USC00412266
ENCINAL TX USC00412906
FALFURRIAS TX USC00413063
FT STOCKTON TX USC00413280
GAINESVILLE 5 ENE TX USC00413420
GREENVILLE KGVL RADI TX USC00413734
HALLETTSVILLE 2 N TX USC00413873
LIBERTY TX USC00415196
LULING TX USC00415429
MARSHALL TX USC00415618
MIAMI TX USC00415875
MULESHOE #1 TX USC00416135
NEW BRAUNFELS TX USC00416276
PLAINVIEW TX USC00417079
QUANAH 2 SW TX USC00417336
SEMINOLE TX USC00418201
SNYDER TX USC00418433
STRATFORD TX USC00418692
WEATHERFORD TX USC00419532
ALTON UT USC00420086
BLANDING UT USC00420738
BLUFF UT USC00420788
CORINNE UT USC00421731
DESERET UT USC00422101
DUCHESNE UT USC00422253
ESCALANTE UT USC00422592
FILLMORE UT USC00422828
FT DUCHESNE UT USC00422996
GREEN RIVER AVIATION UT USC00423418
HEBER UT USC00423809
KANAB UT USC00424508
LAKETOWN UT USC00424856
LEVAN UT USC00425065
MANTI UT USC00425402
MOAB UT USC00425733
MORGAN POWER LIGHT UT USC00425826
OGDEN PIONEER PH UT USC00426404
PANGUITCH UT USC00426601
PAROWAN UT USC00426686
RICHFIELD RADIO KSVC UT USC00427260
ST GEORGE UT USC00427516
SCIPIO UT USC00427714
SNAKE CREEK POWERHOU UT USC00427909
SPANISH FORK PWR HOU UT USC00428119
THOMPSON UT USC00428705
TOOELE UT USC00428771
UTAH LAKE LEHI UT USC00428973
VERNAL UT USC00429111
WOODRUFF UT USC00429595
ZION NP UT USC00429717
CAVENDISH VT USC00431243
CHELSEA VT USC00431360
CORNWALL VT USC00431580
ENOSBURG FALLS VT USC00432769
SAINT JOHNSBURY VT USC00437054
BLACKSBURG NWSO VA USC00440766
BREMO BLUFF VA USC00440993
BURKES GARDEN VA USC00441209
CHARLOTTESVILLE 2W VA USC00441593
DALE ENTERPRISE VA USC00442208
DANVILLE VA USC00442245
FARMVILLE 2 N VA USC00442941
FREDERICKSBURG NP VA USC00443192
HOPEWELL VA USC00444101
HOT SPRINGS VA USC00444128
LINCOLN VA USC00444909
PENNINGTON GAP VA USC00446626
PIEDMONT RSCH STN VA USC00446712
WILLIAMSBURG 2 N VA USC00449151
WOODSTOCK 2 NE VA USC00449263
ABERDEEN WA USC00450008
BELLINGHAM 3 SSW WA USC00450587
BUCKLEY 1 NE WA USC00450945
CEDAR LAKE WA USC00451233
CENTRALIA WA USC00451276
CLE ELUM WA USC00451504
CONCONULLY WA USC00451666
DAVENPORT WA USC00452007
DAYTON 1 WSW WA USC00452030
ELLENSBURG WA USC00452505
EVERETT WA USC00452675
FORKS 1 E WA USC00452914
KENNEWICK WA USC00454154
LONGMIRE RAINIER NPS WA USC00454764
LONGVIEW WA USC00454769
NORTHPORT WA USC00455946
ODESSA WA USC00456039
OLGA 2 SE WA USC00456096
PORT TOWNSEND WA USC00456678
RITZVILLE 1 SSE WA USC00457059
SEDRO-WOOLLEY WA USC00457507
SNOQUALMIE FALLS WA USC00457773
STEHEKIN 4 NW WA USC00458059
VANCOUVER 4 NNE WA USC00458773
WATERVILLE WA USC00459012
WENATCHEE WA USC00459074
WILBUR WA USC00459238
WINTHROP 1 WSW WA USC00459376
BUCKHANNON WV USC00461220
CAIRO WV USC00461330
GLENVILLE WV USC00463544
MANNINGTON 8 WNW WV USC00465626
SPENCER WV USC00468384
WELLSBURG WTR TRMT P WV USC00469368
WINFIELD LOCKS WV USC00469683
ASHLAND EXP FARM WI USC00470349
BOWLER WI USC00470991
BRODHEAD WI USC00471078
DARLINGTON WI USC00472001
FOND DU LAC WI USC00472839
HANCOCK EXP FARM WI USC00473405
LANCASTER 4 WSW WI USC00474546
MANITOWOC WI USC00475017
MARSHFIELD EXP FARM WI USC00475120
MEDFORD WI USC00475255
MILWAUKEE MT MARY CL WI USC00475474
MINOCQUA WI USC00475516
NEW LONDON WI USC00475932
OCONTO 4 W WI USC00476208
PORTAGE WI USC00476718
PRAIRIE DU CHIEN WI USC00476827
RACINE WI USC00476922
SPOONER AG RES STN WI USC00478027
STANLEY WWTP WI USC00478110
VIROQUA WI USC00478827
WATERTOWN WI USC00478919
ALTA 1 NNW WY USC00480140
BASIN WY USC00480540
CHUGWATER WY USC00481730
COLONY WY USC00481905
DIVERSION DAM WY USC00482595
DUBOIS WY USC00482715
EVANSTON 1 E WY USC00483100
GREEN RIVER WY USC00484065
LAKE YELLOWSTONE WY USC00485345
LUSK 2 SW WY USC00485830
MORAN 5WNW WY USC00486440
PAVILLION WY USC00487115
PINE BLUFFS 5W WY USC00487240
POWELL FLD STN WY USC00487388
RIVERTON WY USC00487760
SARATOGA WY USC00487990
SHERIDAN FLD STN WY USC00488160
TORRINGTON EXP FARM WY USC00488995
WHEATLAND 4 N WY USC00489615
The link to the whole post went into moderation.
Here it is with some spaces inserted.
httrealclimatescience. com/2017/05/the-wildly-fraudulent-tobs-temperature-adjustment/
The reason I said that Steven Goddard is not capable of producing a statistical proof is that he can’t get his head around a basic step. If you are going to argue by difference in some results, you have to ensure that either it is the same population that is concerned, or you can rule out the difference being due to some other difference in the populations. And that is very relevant here. He divides the stations into two groups according to TOBS in July 1936. But they vary clearly have a relevant other difference, of 1 degree latitude on average. So you don’t know how the more southern location effect interacts with the TOBS effect. Maybe the evening TOBS were cooled by changing to morning, but the morning TOBS cooled faster because the SouthEast did.
Or even what the TOBS effect should be. What counts for trend is the changes in TOBS, and there is no data shown on that. It’s true that many in the rather large number of stations reading in the evening are likely to change at some stage to morning reading. But you don’t know how many, or when, both very relevant to trend.
One thing also not stated is whether the data plotted is raw or adjusted. The link doesn’t help at all. It goes to a WayBack file, where is just shows the front page of a paper. The links to data, or even description of data, don’t seem to work.
The Missouri test is completely useless, because there is no control over whether the stations might have had different numbers without different TOBS. There are many things that could influence the number of 100 degree days. There is also no information on whether the stations even had different TOBS in the range of the plot. The only test is whether they were different in July 1936. Finally, the 100 degree test is one that SG seems to have set up and uses for all purposes. It isn’t the right one here. If you have 5pm reading say (which was once recommended), then double counting means that on a hot after noon, the residual warmth at 5pm is counted to the next day. It may be that it is infrequently still 100F at 5pm, but still biased warm.
One last thing – the 140 morning stations is a fairly small sample. Standard error on means and trends will be quite high.
Welcome to NOAA’s cool magic show! We make the cooling disappear! Now you see it, now you don’t (applause)
Nick, you did not refute what he showed at all.
What he did is very simple, is explained in one sentence, and shows a very clear result.
Maybe of someone could show all the other places and times that the afternoon stations graph looks different, specifically looks much hotter, than the morning stations graph, that would be at least some evidence that the TOBS is justified.
You did not give any reason to think that the past should be cooled massively because some stations reported in the afternoons.
Any Tony Heller has given many very simple and very specific and very clear reasons to doubt it was ever justified.
I am wondering why you did not take the time to refer us to the research that proved that the TOBS alterations were valid and well reasoned and necessary.
The logic is so thin I can not even see that it exists at all.
And has anyone got any documentation to show that people were so careless and stupid back then that they would reset a high/low thermometer in the middle of the hottest part of the day?
They are two separate operations…recording and reporting, and resetting the high/low thermometer.
People did not suddenly grow brains in 1988.
Okay, I get to add my own two cents in, here. I do not believe there is any actual fraud involved on the part of NOAA or BEST. Furthermore, I agree that raw data (writ large) won’t do. There are a number of systematic biases which make raw data misleading.
One must either adjust the raw data or throw out all the known compromised data. Well our team has done the latter to the greatest extent possible. But, even so, we are still left with equipment issues. When they switched equipment, they were perfectly happy to get it to within a degree or so. But when you are trying to measure hundredths of a degree trends per decade, it can be a highly disruptive random element. Besides, if we dropped everything possible, we’d have nothing left. So we have to run some pairwise. (So, okay, step one on the road to hell.)
But homogenization. Now there’s a tool. A powerful one. Finally, a statistical basis for roping the ol’ maverick. Just what the doctor ordered. my friend, Kindly Uncle H.
The only (very well known) problem being that homogenization only works on basically good data, or at least on known biased data with the bias accounted for. And when there exists one or more systematic biases in the dataset (either abrupt or gradual), well, that’s when homogenization bombs. Kindly Uncle H has become Wicked Uncle H. You are actually worse off than when you started.
Follow the pea. The pea is the correct data signal.
So, instead of correcting the incorrect majority to conform with the correct minority, homogenization now “corrects” the correct minority to conform with the incorrect majority. Leaving no trace that the correct signal ever existed. As for your data signal, that pea you were following isn’t even pea soup. It is meaningless pap. Peas are not even on the ingredient list.
Kind of puts one in mind of that old movie Gremlins.
Well, that’s what’s happened here. Both to NOAA and to BEST. Our team has identified two unaccounted-for major systematic biases that fatally infect all pairwise computations. Once those biases are compensated for (by weighting, dropping, adjusting, whatever), then homogenization will be applicable. And not until.
But even then, there may be other undetected biases lurking in the data. If our merry band can drag out two, then who knows how many there actually are. It’s an ongoing process.
Nick, all you need to do to KNOW that NOAA& NSA introduced “adjustments” to historical data is to look at James Hansen’s 1999 and 2000 US temperature graphs. He cooled the 1900-1950 data and warmed the 1970-2000 data! That climate fraud for everyone to see!
Wonderful.
A post by Nick Stokes on raw data, GHCN AND GLOBAL AVERAGES.
–
By a master of evasion.
“Nick Stokes Tuesday, July 8, 2014 GHCN Adjustments are much larger in US than ROW. I was a little surprised that the positive bias had increased substantially, though still not huge. There has recently been a lot of talk about USHCN adjustments, and I did some plotting in my most recent post. GHCN v3 just uses USHCN, including the adjustment method, for its US data. So I thought the rise might well be partly due to the US component and TOBS. the trend differences caused by adjustment to stations with 60 years data were 0.0355 °C/decade for US, 0.0248 °C/decade for ROW, and 0.0284 °C/decade combined.”
–
His mate Zeke Hausfather says raw data is massaged,
“May 12, 2014 at 3:00 pm The difference is straighforward enough. Even if you use monthly rather than annual averages of absolute temperatures, you will still run into issues related to underlying climatologies when you are comparing, say, 650 raw stations to 1218 adjusted stations. You can get around this issue either by using anomalies OR by comparing the 650 raw stations to the adjusted values of those same 650 stations. The reason why the 1218 to 650 comparison leads you astray is that NCDC’s infilling approach doesn’t just assign the 1218 stations a distance-weighted average of the reporting 650 stations; rather, it adds the distance-weighted average anomaly to the monthly climate normals for the missing stations. This means that when you compare the raw and adjusted stations, differences in elevation and other climatological factors between the 1218 stations and the 650 stations will swamp any effects of actual adjustments (e.g. those for station moves, instrument changes, etc.). It also gives you an inconsistant record for raw stations, as the changing composition of the station network will introduce large biases into your estimate of absolute raw station records over time. Using anomalies avoids this problem, of course.”
–
His mate Mosher, wrong as usual, hence corrected
Zeke (Comment #130058) June 7th, 2014 at 11:45 am
“Mosh, Actually, your explanation of adjusting distant past temperatures as a result of using reference stations is not correct. NCDC uses a common anomaly method, not RFM.
The reason why station values in the distant past end up getting adjusted is due to a choice by NCDC to assume that current values are the “true” values. Each month, as new station data come in, NCDC runs their pairwise homogenization algorithm which looks for non-climatic breakpoints by comparing each station to its surrounding stations. When these breakpoints are detected, they are removed. If a small step change is detected in a 100-year station record in the year 2006, for example, removing that step change will move all the values for that station prior to 2006 up or down by the amount of the breakpoint removed. As long as new data leads to new breakpoint detection, the past station temperatures will be raised or lowered by the size of the breakpoint.
An alternative approach would be to assume that the initial temperature reported by a station when it joins the network is “true”, and remove breakpoints relative to the start of the network rather than the end. It would have no effect at all on the trends over the period, of course, but it would lead to less complaining about distant past temperatures changing at the expense of more present temperatures changing”
–
That about sums up the issue.
And why Nick Stokes can state a seemingly obvious truth while knowing the effect is a lie.
–
Adjustments are made all the time to raw data.
These adjustments keep the present, like today, correct after all the adjustments [homogenization] are done.
But all past data is continually changed downwards. see Zeke above.
Nick does not show this.
Mosher does not show this.
Zeke does not show this.
Yet ask Nick to show the same data as calculated 1, 2, 3 or 10 years in the past on this date and a funny thing happens.
All the data he gives today for the past is different to the same data when calculated at those past dates.
Ask him.
In one months time all the past data will be different.
Ask him.
Worse, as Zeke says, the ”RAW ” data they show is actually the adjusted down computer derived version, not the real raw data at all.
–
Notice Nick never shows the real Raw data side by side with the adjusted so called raw data or the end product that he shows.
Anyone able to put one up please.
Its posted for you to see for yourself.
http://berkeleyearth.lbl.gov/auto/Global/Raw_TAVG_complete.txt
And we did a whole post on it at Judith’s
angech, for years you ask the question about the number of stations. I give you the answer, and you then claim I never gave you the answer. or you change your question after I give you what you ask for.
I even gave you code.
I even posted code in response to your questions.
The whole point of asking people to show their work is for you to check it and then say
I checked, and yes.
or
I checked and no.
Otherwise you give skeptics a bad name. When I demanded code from Hansen and he gave it,
My demands stopped. he gave me the tools i needed to do my own checking. to see for myself.
I made him a promise. If he gave me the code I would never bother him with homework.
if he gave me his power ( his code, his tool) Then it was my responsibility to work with that.
Not to ask him to change the code, or output different options, or compile it for me.
But when Phil Jones conspires to dodge FOIA requests and threatens to delete data and emails that’s perfectly fine.
“Why should I show him my work? He is only going to find something wrong with it?”
“that’s perfectly fine”
I seem to remember that Steven wrote a book about it.
“When the BOM amends its own record (as it did at Goulburn) does it then transmit a supplemental record to GHCN?”
Normal process is for the met office to submit a revised CLIMAT form. If GHCN finds an error, they request that, else just flag the error. That happened back in April, when China submitted a March form with a whole lot of February data. Within a few days they submitted a revised form, which went promptly into GHCN (and was then used by GISS when they posted for March).
There are some spectacular errors in GHCN unadjusted, eg 86°C for La Paz, Bolivia, June 2010. It is flagged though, and doesn’t make it into the adjusted file. Clearly a decimal point issue. I guess it’s hard to get a revised form from Bolivia.
As for older records, there isn’t a CLIMAT mechanism. I expect BoM would notify GHCN, and probably the record would be flagged. The pre-1992 part of GHCN comes from a major funded project which sought, digitised and archived old records. There was no expectation that either the supplier or GHCN would maintain them. GHCN V1 was issued on DVD.
ps I should also say that BoM submits monthly records only, so fluctuations on the day won’t appear. Also Goulburn is not a GHCN or ACORN station. It isn’t used in any published average.
“Your version has a bit of a “so what if it is wrong” ring about it.”
No, the ring is “why would they do it?”. This is in response to the folk who think the BoM has staff dedicated (on a Sunday morning) to scrubbing up the records of places like Goulburn that are never going to be used for anything. And no, I don’t think they do that scrubbing for blessed stations either.
Nick Stokes has used the GISS history data page. I think that it is a kind of the problem. Here I show two figures with temperature trends from the original data sources. when it was published – not the GISS historical data page, which I do not trust.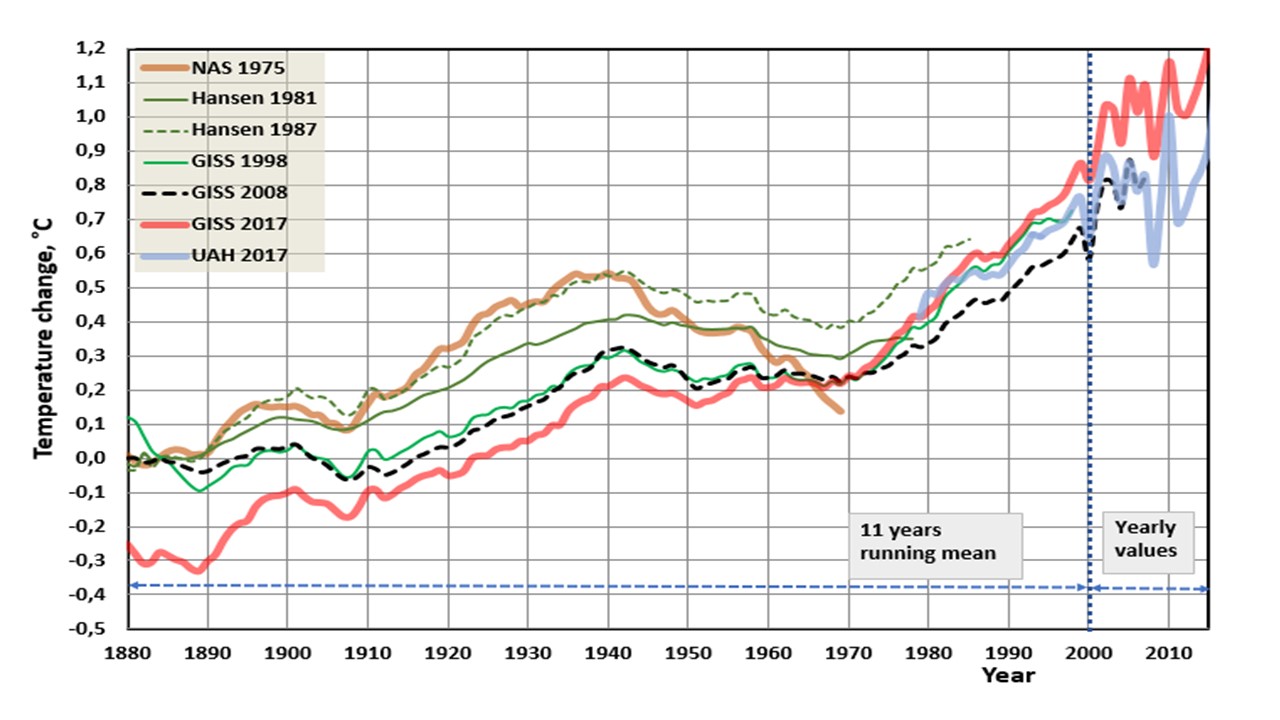
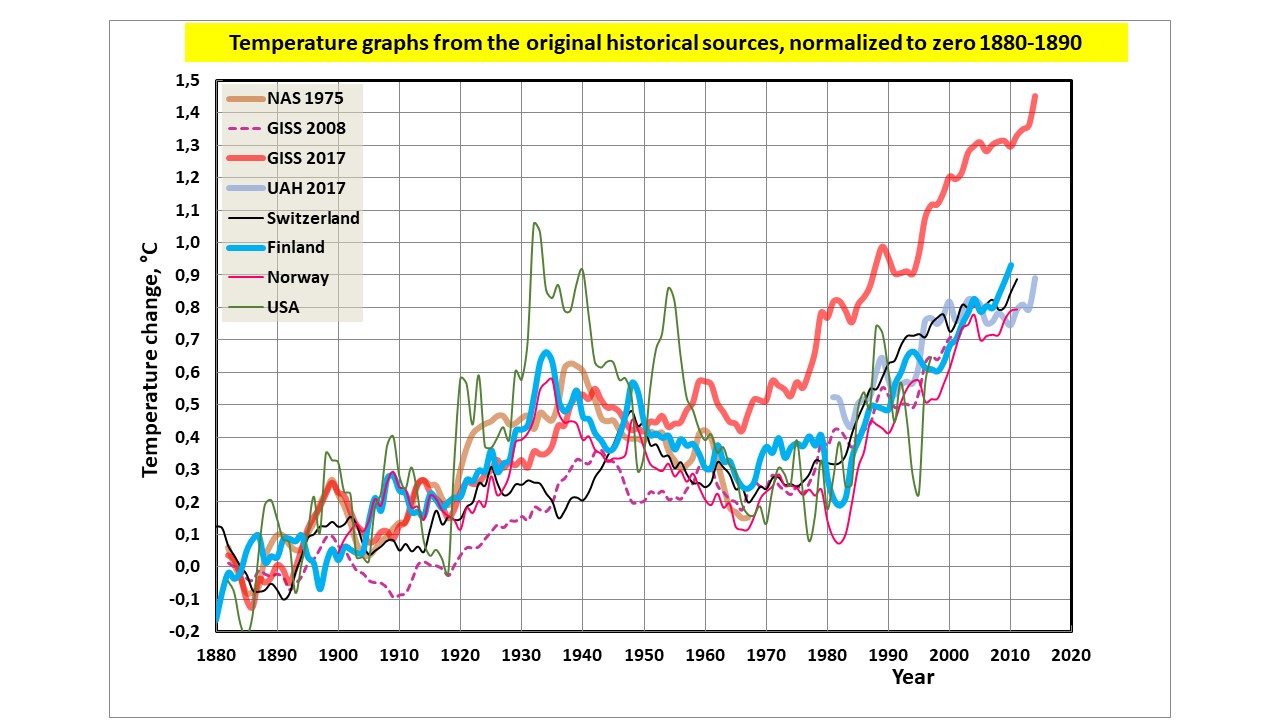
I think that the NAS (National Academy of Sciences) and UAH data are the most trustworthy data sets. The NAS data publication was composed by the committee and the chairman was Verner E. Suomi. Suomi is a Finnish word meaning Finland – my home country.
Her is another figure showing temperature graphs of some other countries.
Dr. Antero Ollila
“I think that the NAS (National Academy of Sciences) and UAH data are the most trustworthy data sets.”
But data of what? NAS and GISS 1981 are of NH, land only (and very few stations). UAH is troposphere. Hansen 1987 was based on met stations only, no SST. GISS since 1998 is land/SST. There is no use comparing such disparate things.
The GISS History page gives you not only graphs, but the numerical data (as text or CSV). You can check at least some of that with the Wayback machine, and also of course with the plots of the time..
FUnny guy Dr. Antero Ollila
Doesnt post data and distrusts those that do.
if we played skeptic to the “good” doctor we would ask for
His data sources and proof that he actually hasnt altered them.
“And just compare GISS 2008 to GISS 2017. Why there’s around a half a degree of manufactured global warming right there!”
Is the Kremlin whispering this? It came up here above too. And as I showed there, it is nothing like the truth.
“Nick, Aveollila stated his sources. He says that his graphs “
Where? I see no graphs or sources for that.
And none from you either. Where do you get that “half a degree”?
Aveollila says that he prefers his graphs to GISS. I far prefer GISS. I did my own, using a Wayback download of a 2005 GISS TS+SST file, and a copy I have of a 2015 file. Here is the difference plot, subtracting 2005 from 2015
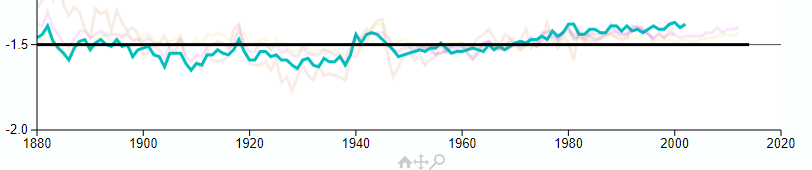
And here is an extract from the GISS history file above, with 2016-2002
Very similar,and nothing like a 0.5 degree difference in warming. In fact, since 1880 not much change.
“Nick, it’s a shame you couldn’t locate the “official” GISS graphs as published in the same years as Aveollila (2008 and 2017). As I understand his point he is saying that GISS records are unreliable and subject to arbitrary amendment after the fact.”
Well, you could try. The fact is that I got the 2005 data from the WayBack machine (here), as posted in 2005. GISS can’t amend that. And I plotted it, and it matches the GISS history page for 2002 vs 2017 (the big changes were around 2011). The 2015 data is from a file I stored at the time, but it is negligibly different from current.
GISS data begins in 1880, and according to the polot I showed, there has not been anything like a 0.5deg increase in warming due to version change since then. In fact, from 1880 to now, in that plot, very little.
I showed a GISS history page plot on this thread here, with a link to source. It’s an active plot, and you can select years. This plot is an extract from that, showing the difference between old versions and current. The faint colors show those years, blue-green is 2015-2005. You can check the original, or look at the plot upthread.
“What does your second graph (the green and pink one) actually show?”
Again I refer to the full plot above, of which this is a fragment. It shows the difference between GISS as published in 2017, and in 2002, but displaced down by 1.5C (to fit the layout of that graph). My comparable graph shows the diff between 2015 and 2005.
GISS History page. All will be revealed.
“It is the veracity of the GISS history”
You asked what the pink curves are. I have said many times that the plot comes from the GISS history page. That will tell you these answers. It’s much better to go to the source, since it is an active plot.
Forrest Gardener said: “Oh Nick. It is your answers I am seeking. Your refusal to answer even simple questions about YOUR graphs can only serve to reduce your credibility.”
No, it serves to undermine yours, not his.
For anyone who is interested in the National Academy of Science (NAS) plot of 1975 and the Hansen 1981 plots, I posted these at richard verney August 9, 2017 at 1:16 am
For ease of reference, I set it out again:
I also set out the NCAR 1974 plot:
These are Northern Hemisphere plots. The Southern Hemisphere is too sparsely sampled and there is all but no historic data of the Southern Hemisphere, a point Made by Phil Jones & Widgley in their 1980 paper, and noted by Hansen in his 1981 paper. Indeed, in the Climategate emails, Jones went as far as saying that most of the Southern hemisphere data is largely made up,
“That is because homogenization rarely modifies recent data.”
When it should adjust for a blatant jump in maximum temperatures when switching to AWS.
Maximum temperatures are usual higher than half hour readings, by degrees sometimes. You occasionally see max readings almost a degree higher than minutes either side.
Minimum temperatures in arid regions vary a lot with differences if degrees in the short distance to the ground. How is it possible that 3 minimum readings are the same and 0.1° above the old record for August?
http://www.bom.gov.au/jsp/ncc/cdio/weatherData/av?p_nccObsCode=123&p_display_type=dailyDataFile&p_startYear=2014&p_c=-1156224100&p_stn_num=076031
For a comparison, the nearest station had a lot more variation
http://www.bom.gov.au/jsp/ncc/cdio/weatherData/av?p_nccObsCode=123&p_display_type=dailyDataFile&p_startYear=2014&p_c=-442182359&p_stn_num=047016
-2.6°C was the new Aug record for that station.
“How is it possible that 3 minimum readings are the same and 0.1° above the old record for August?”
How is it impossible? They were all very cold mornings. It doesn’t seem to be due to any aversion to breaking the record – the following morning was lower at -3.1.
Eventually. Don’t you think another -2.3 would have been taking things too far?
You keep dreaming up more and more implausible conspiracies. So they tried to hold up the record (why?) in Mildura, only to then let it happen. But in the Lake Victoria site you linked, there seemed to be no such reluctance. The record was set without apparent hindrance.
The kerfuffle is that there was cutoff on minimum temperatures. I wouldn’t read too much into it if it were only two days but three and 0.1 degree above the old record is too unlikely to be a coincidence. Add to that a couple of other examples of BOM doing this and you dismiss it as implausible conspiracy theory.
Because scientists are so honest?
“you can follow the unadjusted temperature data right through from within a few minutes of measurement to its incorporation into the global unadjusted GHCN, which is then homogenized for global averages”.
Ah the irony, an article about non-adjustment that dutifully ends in an homogenization adjustment.
“With the unadjusted vs adjusted files, it is possible to do that. I have been calculating a global anomaly every month, using the unadjusted GHCN data with ERSST. ”
Homogenisation makes individual stations more like what the temperature for the area is estimated to be. The latter pretty much determines the global anomaly. It actually damning that the large changes to stations makes such a little difference. This was highlighted by a similar plot for Australia where large areas do not have actual data but places like Warburton (only station in an area for a few percent of Australia’s total) has only estimated data for the base period. Apologies for not having the link but it was pointed out that year after year, the daily temps were exactly the same for that site.
Law of large numbers.
The LLN only applies when one has many measurements of the same thing. If one took 5000 simultaneous measurements of temperature at a site, one would be justified in using the LLN. Having one-time measurements at 5000 different sites does not allow the use of the LLN.
If I measure the length of a board 5000 times, I can use the LLN to determine the precision of the mean of the measurements. I can’t measure 5000 different boards one time and use the LLN to claim that I know the length of the “average” board to the same level of precision.
You need stationarity.
“The LLN only applies when one has many measurements of the same thing.”
That’s not true. It applies whenever there is cancellation. It applies to polling, for example, where you average many different peoples’ responses. The uncertainty of the mean drops proportional to 1/sqrt(N).
“It applies whenever there is cancellation. ”
Show that is the case. Data has been homogenized and estimated by gods?
Aah, polling!
Well, pollsters are never wrong, so obviously their methodology is flawless.
“data ceases to be data when it is altered”
In fact what is homogenised is not the original reading. It is the monthly average, already a calculated result. And there are properly different ways of calculating that average. TOBS, for example, takes account of the fact that some of the results written down for a particular day really belong to an adjacent day.
But the real point is that for use in computing a global average, a station is taken as representative of a region. That is a choice, and can be varied. If you think that station is, at that time, not representative, you can use other data.
“what comes out of a computer is never data”
What comes out of a computer is the result of a calculation, eg monthly average.
It’s great that they developed such advanced technology in ~1900. Half-hourly automatic weather stations uploading to a global database and all that.
Nick, you’ve restored my faith in the climate record by proving how robust the record is going back so far in time.
Nick: A few points and questions. First, the GHCN data for Melbourne Int Ap only goes back to Jan 1970. How did you get a plot of those temps back to 1900 to compare?

Second, I checked the GHCN data for the first four days of December 2016 with your table, and they matched perfectly. However, when I ran the average TMIN and average TMAX for the month, I got 12.3C and 26.0C, while the CLIMAT report showed 12.7C and 26.3C. That’s quite a difference. How do you account for it? Here is the table of figures as reported from GHCN for Melbourne in December 2016:
Date	TMIN	TMAX

1-Dec-16     9.1	24.6

2-Dec-16	  10.8	22.7

3-Dec-16	    6.5	23.2

4-Dec-16	    9.1	31.7

5-Dec-16	  15.7	22.1

6-Dec-16	  11.4	21.2

7-Dec-16	    7.1	28.4

8-Dec-16	  15.1	23.4

9-Dec-16     8.2	18.3

10-Dec-16 10.9	19.3

11-Dec-16  11.7	20.9

12-Dec-16    7.8	33.0

13-Dec-16  16.4	35.9

14-Dec-16  14.5	19.9

15-Dec-16    9.0	19.7

16-Dec-16    7.9	24.1

17-Dec-16   12.6	21.5

18-Dec-16     6.7	18.6

19-Dec-16     5.5	30.9

20-Dec-16   13.8	23.2

21-Dec-16     9.6	20.4

22-Dec-16   13.8	22.0

23-Dec-16   11.7	32.0

24-Dec-16   14.6	34.9

25-Dec-16   13.5	36.6

26-Dec-16   25.5	30.0

27-Dec-16   16.7	28.0

28-Dec-16   18.7	38.2

29-Dec-16   19.2	31.2

30-Dec-16   16.0	25.2

Average	    12.3    26.0
I hope the formatting doesn’t get too screwed up in the above. God help me if I need the break tag…
Finally, I’ll present the scatter plot of the GHCN data for the Melbourne Int AP, GHCN station id ASN00086282. First, I’ll explain my methodology. I grabbed the ASN00086282.dly file from the GHCN site here. You’ll see the data goes back only to 1970. I used a Perl script to extract the TMAX, TMIN, and TAVG records into a tab-delimited file, and then used sqlldr to load the file into an Oracle database. Once there I deleted all of the temp records with -999,9 values and those with qflags with any failed flag present.
I then extracted the monthly averages for the entire record using the query:
with table_of_averages as (select t1.id, to_char(t1.timestamp,'MON-YYYY') as month, round((t1.temp+t2.temp)/2,1) as TAVG

                  from ghcn_temps t1 join ghcn_temps t2 on t2.id = t1.id and t2.timestamp = t1.timestamp

                  where t1.id = 'ASN00086282' and t1.data_type = 'TMIN' and t2.data_type = 'TMAX'

                  order by t1.timestamp)

select month||chr(9)||round(avg(tavg), 1) as mAvg from table_of_averages

group by month order by to_date(month, 'MON-YYYY');
That gave me the average of each TMIN and TMAX grouped by month. I then took the average of those monthly average over the period JAN-1981 through DEC-2010 to get my baseline, which was 14.7C. To get the monthly anomaly, I subtracted this baseline from each monthy TAVG. The results were interesting.
The standard deviation for the entire period JAN-1970 through DEC-2016 was 3.99C. Pretty wicked large. The minimum anomaly was -7.4C and the maximum was 9.6C.
Finally, I attach my scatter plot for the monthly anomaly with the monthly averages and a 13-month moving average. It sure looks a lot less scary than what we usually see.
I am sure that Nick and Mosh have seen Latitude’s flash graph as many times as I have. If I were trying to refute the proposition that continuing data adjustments have altered trends, I would begin by trying to show that the flash graphs are bogus for some reason. Good luck with that.
Wrong burden of proof.
The changes in GISS ( actually noaa) between 1999 and 2017 are related to data and methods.
1. The 1999 data that Noaa provided to giss was grossly inferior. read the history of v2 adjustments.
2. The methods have also changed.
As for changing trends? Yes, the last change to GISS methods ( 2010) LOWERED TRENDS
that is because they realized they overdid their previous “adjustments” and toned it down … committing fraud is hard work …
Sorry, but the bulk of the changes that made the 1930s cooler than the 1990s occurred before 2010. I have seen a flash graphs that predates 2010 that shows that clearly. There is a simple way to have honest science and that is to keep zealots away from control of the data.
“1. The 1999 data that Noaa provided to giss was grossly inferior. read the history of v2 adjustments.
2. The methods have also changed.”
Inferior, as in gave results that were very damaging to The Cause.
And the methods have changed alrighty.
That part is 100% for sure.
Changed from reporting what the temperature was at the time and place it was recorded, to making crap up and pretending it is the real world.
Thank you for writing the article.
Lets take some of the earliest estimates of global temperature we have.
NOT by a climate scientist, but by a steam engineer.
https://www.climate-lab-book.ac.uk/2013/75-years-after-callendar/
Hi Nick,
“All I can say is, if you think it is manipulated, you should be able to find out where.”
Could you explain the example of Darwin airport with no site changes but with 0.72 C per century cooling being adjusted to 1.2 C per century warming.
https://wattsupwiththat.com/2009/12/08/the-smoking-gun-at-darwin-zero/
Thanks,
Carl
“Could you explain the example of Darwin airport with no site changes”

Actually, that was my first ever Moyhu post, in 2009. One of the graphs has gone missing, but it’s mostly still there. There was a major site change in the move to the airport. But as I shoiwed there, if you look at all the adjustments (that was GHCN V2), the histogram of changes to trend looks like this:
It’s pretty symmetric. If you go cherry-picking, you can find ones like Darwin. Or like Coonabarabran, where it goes even more the other way:
Nick: A few points and questions. First, the GHCN data for Melbourne Int Ap only goes back to Jan 1970. How did you get a plot of those temps back to 1900 to compare?

Second, I checked the GHCN data for the first four days of December 2016 with your table, and they matched perfectly. However, when I ran the average TMIN and average TMAX for the month, I got 12.3C and 26.0C, while the CLIMAT report showed 12.7C and 26.3C. That’s quite a difference. How do you account for it? Here is the table of figures as reported from GHCN for Melbourne in December 2016:
Date	TMIN	TMAX

1-Dec-16     9.1	24.6

2-Dec-16	  10.8	22.7

3-Dec-16	    6.5	23.2

4-Dec-16	    9.1	31.7

5-Dec-16	  15.7	22.1

6-Dec-16	  11.4	21.2

7-Dec-16	    7.1	28.4

8-Dec-16	  15.1	23.4

9-Dec-16     8.2	18.3

10-Dec-16 10.9	19.3

11-Dec-16  11.7	20.9

12-Dec-16    7.8	33.0

13-Dec-16  16.4	35.9

14-Dec-16  14.5	19.9

15-Dec-16    9.0	19.7

16-Dec-16    7.9	24.1

17-Dec-16   12.6	21.5

18-Dec-16     6.7	18.6

19-Dec-16     5.5	30.9

20-Dec-16   13.8	23.2

21-Dec-16     9.6	20.4

22-Dec-16   13.8	22.0

23-Dec-16   11.7	32.0

24-Dec-16   14.6	34.9

25-Dec-16   13.5	36.6

26-Dec-16   25.5	30.0

27-Dec-16   16.7	28.0

28-Dec-16   18.7	38.2

29-Dec-16   19.2	31.2

30-Dec-16   16.0	25.2

Average	    12.3    26.0
I hope the formatting doesn’t get too screwed up in the above. God help me if I need the break tag…
Finally, I’ll present the scatter plot of the GHCN data for the Melbourne Int AP, GHCN station id ASN00086282. First, I’ll explain my methodology. I grabbed the ASN00086282.dly file from the GHCN site here. You’ll see the data goes back only to 1970. I used a Perl script to extract the TMAX, TMIN, and TAVG records into a tab-delimited file, and then used sqlldr to load the file into an Oracle database. Once there I deleted all of the temp records with -999,9 values and those with qflags with any failed flag present.
I then extracted the monthly averages for the entire record using the query:
with table_of_averages as (select t1.id, to_char(t1.timestamp,'MON-YYYY') as month, round((t1.temp+t2.temp)/2,1) as TAVG

                  from ghcn_temps t1 join ghcn_temps t2 on t2.id = t1.id and t2.timestamp = t1.timestamp

                  where t1.id = 'ASN00086282' and t1.data_type = 'TMIN' and t2.data_type = 'TMAX'

                  order by t1.timestamp)

select month||chr(9)||round(avg(tavg), 1) as mAvg from table_of_averages

group by month order by to_date(month, 'MON-YYYY');
That gave me the average of each TMIN and TMAX grouped by month. I then took the average of those monthly average over the period JAN-1981 through DEC-2010 to get my baseline, which was 14.7C. To get the monthly anomaly, I subtracted this baseline from each monthy TAVG. The results were interesting.
The standard deviation for the entire period JAN-1970 through DEC-2016 was 3.99C. Pretty wicked large. The minimum anomaly was -7.4C and the maximum was 9.6C.
Finally, I attach my scatter plot for the monthly anomaly with the monthly averages and a 13-month moving average. It sure looks a lot less scary than what we usually see.
James,
“How do you account for it?”
Well, something has gone wrong with your input. There are 31 days in December. Somehow your addition has left out the 27th, and relabelled the days following. The BoM data is here. The line missing is
27 Tu 16.7 28.0
” To get the monthly anomaly, I subtracted this baseline from each monthly TAVG. The results were interesting.”
You aren’t doing the anomalies right. You have to do an average for each month, and subtract from each month the anomaly for that month. That error is why you have a big seasonal effect in the anomalies.
Sorry, it is the 29th that is omitted, the line
29 Th 24.9 34.7
Since this is about 12° above the average (max and min), omitting it brings the average down about 12/30=0.4.
Nick: Thanks, I see my parsing error now. I’ll get that fixed. I think I get what you mean about the anomalies now, too. I’ll rerun my numbers later today.
“If you think that station is, at that time, not representative…”
And there is the source of the bias, right there, plain as day, spoken aloud.
Great sequence of postings.
I think it’s pretty clear from the multitude of references above that the data HAS been tampered with and is pretty much worthless now.
What’s good is that, with the latest satellite sets being under such close scrutiny, there is no longer room for the cheats to operate…maybe this explains the “Pause”?
Nick Stokes,
Thanks for your efforts here but I remain unconvinced by the data on a number of fronts. I preface my comments by saying I believe BOM does not deliberately tamper with data in any preconceived way and it does follow world best practice.
This leads to my first question: who is there to say that world best practice is indeed “best practice?” What are the objective tests?
You do allude to the recent BOM -10.4 C change to 10C. We still don’t really know the reason irrespective of what world best practice was being followed.
Now take a specific example Jan 7th, 2016:
Perth City, West Australia and
Swanbourne (a suburb of Perth within 8km of the central T station, 16m height difference for the T station):
Perth was 37.5C at 11.30am, peaked at 2pm showing 41.2C. By 11pm it showed 31.3C
Swanbourne 39.2C at 11.30am (peaked), was down by 2pm to 29.5C . By 11 pm it was 25.7C.
So the T diverged by more than 11C for two stations within 8km of each other and maintained a high difference throughout the day. So what was Perth’s avg T for the day? What gets entered into the books and passed on to the worldwide database!!?
I don’t make a habit of checking for this but have seen similar on other occasions. Anyone knowing the geography of Perth will readily understand why it can happen (Swanbourne is on the coast, Perth CBD is inland say 8km; varied sea breeze will be a main factor).
What does it say about the credibility that GISS projections and homogenization of T within 1200km is appropriate? Pure junk in my view. Unless specific physicality can be used to explain adjustments they are simply an excuse for self fulfilling “fixes.” I do have experience in iterative “homogenizing” in a different field where data drift in a specific direction is almost inevitable despite statistical dampening.
Ultimately all this is neatly captured by Tony Heller where he found that adjustments correlate exceptionally well with CO2 changes with an R2 of 0.98.
TonyM,
“What gets entered into the books and passed on to the worldwide database!!?”
Well, that’s easy. Neither. The current GHCN station is Perth Airport.
As you say, the fluctuation is just the famous Fremantle doctor. But none of this goes into the databases either. What does is the monthly average. And the sea breezes will have an effect, but smoothed out, and rather small. And in this case, not much at the airport.
But what counts for analysis is change. If they put the station at Fremantle, it would be cooler in summer. But there’s no reason to think the anomaly or trend would change. They are trying to measure climate.
On correlation, I plotted below some 1937-2016 trends, unadjusted GHCN. Here is a snapshot of the SW.
WA s big, and these places aren’t close. Perth to Kal is 600 km. Here are the trends in C/cen (quite high):
Perth 2.933
Albany 3.39
Cape Leeuwin 2.46
Kalgoorlie 3.79
Geraldton 3.99
Not perfect correlation, but not bad.
Nick Stokes,
Thank you for your thoughts.
Don’t know where you are getting your numbers but they certainly conflict with mine straight from BOM – unadjusted I assume. Perhaps if you simply look at the changes rather than generate linear trends it may be clearer (I will group and average two years at a time; my data is consistent with the means shown by BOM).
Albany:
1880 & 1881: max 18.2C, min 12.5C
1937 & 1939: max 20C, min 11.7C (there is no reading for 1938)
2015 & 2016: max 19.9C, min 12.9C
I would concede 0.75C incr per century against your trend of 3.39C from 1937.
Perth Airport: (no data prior 1945)
1945 & 1946: Max 24C, min 11.6C
2015 & 2016: max 25.3C, min 12.6C
I would concede 1.6C per century vs your trend of 2.93C
Kalgoorlie -Boulder Airport (no annual data prior 1943):
1943 & 1944: Max 25C, min 10.9C
2015 & 2016: max 25.7C, min 12.4C
I would concede 1.5C increase per century vs your trend of 3.8C.
The template to get my data is:
http://www.bom.gov.au/climate/data/index.shtml
If we can have such different views from similar data-sets then is it any wonder that there is such conflict in this area. Further I am not convinced that there is any role for homogenization. That was very much part of the thrust of showing such a disparity between sites only 8 kms apart. If data is to be changed then it should be be justified by the specific physics and not based on some generalized statistical massaging which from memory only had an R2 of just over 0.5.
I have not looked at the other sites in your set but I doubt if we will be any closer in trends.
TonyM
Sorry, you are right, or at least I was wrong. I had clicked on he wrong choice on my gadget. When I get the right one, I get these numbers:
TonyM
The last comment posted prematurely. Actually for an odd reason – WordPress seems to respond oddly to entering whitespace in edit mode within <pre. tags. Anyway, I’ll resume…
Sorry, you are right, or at least I was wrong. I had clicked on he wrong choice of trend years on my gadget. When I get the right one (1937-2016), I get these numbers C/Cen:
Albany doesn’t have a trend. the gadget allows up to, I think, 10% missing years, which probably accounts for the posting of some places that don’t quite go back to 1937.
Anyway, I think the point about correlation stands. I’ll redo the image I posted for WA. It’s actually a bit more uniform.
All I want is to use RAW unadjusted data
What we require is good quality data. One cannot make a silk purse with a sow’s ear, and the land based thermometer data set is a sow’s ear. We need to get back to basics so that we can work with good quality data.
All stations in the network should be audited along similar lines to the surface station project. That is the first task that BEST should have undertaken. It is not a task that should have been left to citizen scientists 9who have only so far looked at the US, and found the majority of stations sorely wanting)..
The best/prime 100/150 station in the Northern Hemisphere should be selected. These would be stations where there has been no station moves, no change in nearby land use, no advance of UHI, the best maintenance of screen and equipment, and which have the best practices and procedures (including record keeping).
These prime stations should then be retrofitted with the same type of LIG thermometer as used by the station in question in the 1930s/1940s calibrated in Fahrenheit or Centigrade, as appropriate for each individual station, and we should then observe temperatures using the same practice and procedure as used by each individual station, as the case may be. This will include the same TOB as applicable at each individual station.
In this manner, we will obtain RAW data for the period say 2017 to 2022 which can then be compared directly to the RAW data collected by that station in the 1930s/1940s without the need to carry out any adjustments whatsoever to RAW data.
There would be no attempt to constitute a Northern Hemisphere wide data set, or a country data set. Instead, RAW data from each station would simply be compared to the historic RAW data from that very station. The comparison would be on an individual station by individual station basis.
We would then be able to compile a list showing how many stations show no significant warming since that station’s historic highs of the 1930s/1940s, and how many stations show some warming, and the order of such warming.
I envisage that if we were to undertake such an experiment/observation, it would show that the vast majority of stations show no significant warming from their historic highs of the 1930s/1940s such that we could safely conclude that the Northern Hemisphere is about the same temperature today as it was in the 1930s/1940.
This type of experimentation would give us a quick check on whether the warming in the thermometer data set is likely nothing more than the way that data set has been compiled (with poorly sited stations, station drop outs, the shift to ever increasing number of airport stations, the drop out of high latitude stations etc) and/or incorrect adjustments for TOB, UHI, and station fill ins etc.
Why use 1930s/1940 as the RAW data reference point? The reason is twofold.
First we know that there was warming between 1920 to 1940 and that the 1930s/1940 were a high point.
Second, some 95% of all manmade CO2 emissions have taken place after 1940 so this will show whether there is any temperature increase coincident with these emissions. If there is little, or no temperature increase (at the prime stations selected), then whilst this will not prove that CO2 has no warming effect, it would at the very least suggest that Climate Sensitivity if any at all is low.
Richard V,
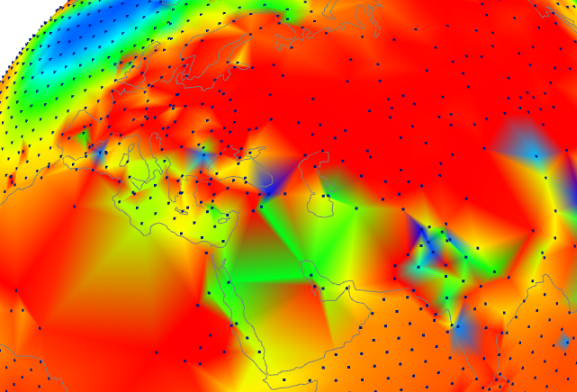
“I envisage that if we were to undertake such an experiment/observation, it would show that the vast majority of stations show no significant warming from their historic highs of the 1930s/1940s”,/i>
A raw data study is done here. The WebGL plot shows individual station trends, with shading to indicate interpolated trend, but with the color correct at the station. You can choose unadjusted or adjusted GHCN, and a variety of periods, but it sounds like you want 1937-2016, which is an option (button labelled un_1937-2016). You can click on or near any station to make it show the trend there.
Here is a screenshot of N America. It’s actually a good lesson on why TOBS adjustment is needed. Nothing is adjusted anywhere. US except for west is mostly blue – negative trend. But across the border in Canada, and even in Alaska, where the COOP system didn’t apply, the trend is uniformly positive.
And here is a screenshot of part of the Old World, again without TOBS issues. Again unadjusted, so a few stations are outliers. But overwhelmingly the station trends are positive and fairly uniform.
Sorry, I don’t know why that last plot didn’t show. It does if you click on it. But I’ll try again
.
Great visuals. But I don’t see patterns related to well mixed CO2-related Anthropogenic Global Warming. I see warming and cooling related to short and long term weather pattern variations typical of Earth;s oceans and quasi-permament atmospheric pressure systems. Am I missing something?
Thanks Nick for responding to me. I will look at the site.
However, one of the problems is that today’s equipment is not the same as the equipment used in the past, and has a materially different response time to any temperature variation. The inopportune passing of a cloud, or short rain shower can make a difference. the equipment today has a different standard of calibration compared to that of the past, and that too leads to problems/issues.
I want to replicate, as best possible, the past. That requires not simply using the same type of equipment and TOB as used in the past (on a station by station basis), but also ensuring that there is no material site change; that there is nothing that may pollute the data when comparing RAW data with historic RAW data.
What one wants to achieve is to obtain the best quality data where there is no need to make any adjustments whatsoever to the data, and in that manner, there can be no argument on the consequence of data adjustments (data ceases to be data once it has undergone adjustment – a point that you quite rightly seemed to accept above) and whether those adjustments were apposite.
What I am suggesting is a different paradigm to the way in which the data is collected and looked at. If you like, merely to act as a SANITY CHECK.
One of the problems with the land based thermometer time series data set is that we are never comparing apples with apples. It is impossible to see whether there has been any change in temperature between 1920 and 1940, or between 1940 and 1980 because we are never looking at the same sample.
The set sample in 1880 is not the SAME set sample as that used in 1900 which in turn is not the SAME set sample as used in 1920 which in turn is not the SAME set sample as used in 1940 which in turn is not the SAME set sample as used in 1960 which in turn is not the SAME set sample as used in 1980 which in turn is not the SAME set sample as used in 2000 which in turn is not the SAME set sample as used in 2016. Because of this variation in samples, the time series data set is worthless. It tells us nothing of significance about what has really happened over time. It is no more valid than assessing how the height of males has varied over time when using data collection the 1900s from a sample of US men, in 1920 from a sample of Italian men, in 1940 from a sample of Finish men, in 1960 from a sample of Spanish men, in 1980 from a sample of Dutch men. if the constitution of the sample changes over time, one can draw no valid conclusion from the data set, and therein lies one of the significant problems with the land based thermometer time series data set.
One of the issues is that we need an identical sample set so that we can make a valid comparison between now and then. We need to be able to compare apples with apples, if we are to be in a position to draw any worthwhile conclusions. This is one important reason why I suggest obtaining and using an identical sample set (ie., say the 150 best sited/most prime stations) and then retrofit these with the same type of historic equipment and employ the same historic practice etc.
You are absolutely right. BEST screwed up. They should have gone about their task in a completely different manner. They ought to have adopted a fundamentally different approach, ie., employed a completely different principle to the assessment of temperatures. Science is about experimentation, observation and data. In a numbers game, purity and quality of data is paramount. BEST ought to have extrapolated the best data, rather than working with the crud, and using a different algorithm to try and make a silk purse out of what is a sow’s ear. In effect, BEST simply took the same type of approach as used by the other agencies, and so it is not surprising that they show a similar outcome. One would expect this.
There is no need to look at the Southern Hemisphere. The fact is that the Southern Hemisphere is so sparsely sampled that there is no worthwhile data of the Southern Hemisphere. Even today, it is sparsely sampled, but historically (especially prior ARGO) it is useless. In the Climategate emails, Phil Jones went as far as saying that the Southern Hemisphere data is largely made up. Further, the majority of people live in the Northern Hemisphere and it is here that we have the best historic data, so we should, at any rate in the first instance, only look at the Northern Hemisphere.
All I want is to use RAW unadjusted data That eliminates data handling/data adjustment error, but obviously one needs to make sure that the RAW data is good quality data, ie., data that does not require adjustment.
What we require is good quality data. One cannot make a silk purse with a sow’s ear, and the land based thermometer data set is a sow’s ear. We need to get back to basics so that we can work with good quality data.
All stations in the network should be audited along similar lines to the surface station project. That is the first task that BEST should have undertaken. It is not a task that should have been left to citizen scientists (who have only so far looked at the US, and found the majority of stations sorely wanting)..
The best/prime 100/150 station in the Northern Hemisphere should be selected. Steven Mosher has often stated that data from 50 stations would be sufficient, and I consider that 100 to 150 would be an ideal set size. These would be stations where there has been no station moves, no change in nearby land use, no advance of UHI, the best maintenance of screen and equipment, and which have the best practices and procedures (including record keeping).
These prime stations should then be retrofitted with the same type of LIG thermometer as used by the station in question in the 1930s/1940s calibrated in Fahrenheit or Centigrade, as appropriate for each individual station, and we should then observe temperatures using the same practice and procedure as used by each individual station, as the case may be. This will include the same TOB as applicable at each individual station.
In this manner, we will obtain RAW data for the period say 2017 to 2022 which can then be compared directly to the RAW data collected by that station in the 1930s/1940s without the need to carry out any adjustments whatsoever to RAW data.
There would be no attempt to constitute a Northern Hemisphere wide data set, or a country data set. Instead, RAW data from each station would simply be compared to the historic RAW data from that very station. The comparison would be on an individual station by individual station basis.
We would then be able to compile a list showing how many stations show no significant warming since that station’s historic highs of the 1930s/1940s, and how many stations show some warming, and the order of such warming.
I envisage that if we were to undertake such an experiment/observation, it would show that the vast majority of stations show no significant warming from their historic highs of the 1930s/1940s such that we could safely conclude that the Northern Hemisphere is about the same temperature today as it was in the 1930s/1940.
This type of experimentation would give us a quick check on whether the warming in the thermometer data set is likely nothing more than the way that data set has been compiled (with poorly sited stations, station drop outs, the shift to ever increasing number of airport stations, the drop out of high latitude stations etc) and/or incorrect adjustments for TOB, UHI, and station fill ins etc.
Why use 1930s/1940 as the RAW data reference point? The reason is twofold.
First we know that there was warming between 1920 to 1940 and that the 1930s/1940 were a high point.
Second, some 95% of all manmade CO2 emissions have taken place after 1940 so this will show whether there is any temperature increase coincident with these emissions. If there is little, or no temperature increase (at the prime stations selected), then whilst this will not prove that CO2 has no warming effect, it would at the very least suggest that Climate Sensitivity if any at all is low.
As I mentioned above, there is no need to look at the Southern Hemisphere. It is mainly ocean, and there is simply inadequate historic data on it. But obviously if one wants to look at say the 20 most prime stations in Australia, that could be done as a separate task. One would need to carefully consider whether it is possible to conduct this experiment using data as far back as the end of the 19th century since it appears that it was very warm in Australia towards the end of the 19th century.
Nick:
The adjustments for Darwin airport occurred from about 1940 to 1990. An adjustment of 2 C over 50 years is about 0.4 C per decade. Your graph shows it as about 0.22. Did you divide by the full 80 or 100 years even though the adjustment was over 50 years? The warmists can point to the warming in the last half of the 20th century and you can say the adjustment over 100 years wasn’t so bad. I notice the Coonabaraban adjustments are over 100 years. Can you reverse engineer the Darwin adjustments? Do you have access to the program that produced a neat stepwise adjustment?
Also, you said the adjustments don’t account for UHI. Given that most sites are now in cities and airports, wouldn’t UHI be the biggest effect requiring adjustment? Since UHI makes recent readings higher, even if all other adjustments are legitimate, just ignore UHI would give a distorted picture.
Carl,
Adjustment is just adjustment. It’s usually a step change (or several). You can always pick out a subrange to get a steep slope. That is really cherry-picking. The histogram I showed has trends over the full data period of each station.
No, I can’t reverse engineer the Darwin adjustment. It was in any case with V2 GHCN. The datasheet for V3 Darwin is here. The adjustment seems to be rather less. It shows very clearly the dip about 1940-2 which is the period of wartime disruptions which eventually led to the transfer to the airport site in, I think, 1945. There were substantial site modifications in this period.
Nick,
Point taken. Thanks for taking the time to provide so much information. I would say that the Australian BOM figures might be much better than the US figures where Hansen et al had so much influence. In particular, I hope Anthony Watt’s photo collection of US sites couldn’t be replicated here.
My main issue with Global Warming has always been the second part of the theory: that a small warming due to the greenhouse effect would cause a major warming due to positive feedback. A system that has been as stable as the earth’s climate, even allowing for long periods of glaciation, can’t have strong positive feedback.
My other issue is that the theory assumes a steady upward climb. The fact that after adjustments and ignoring the UHI, there has been no warming since 1998 would invalidate that. Skeptics don’t have to explain the “highest ever” plateau. Warmists have to first explain the unpredicted pause, and then show why the small rise in the 20th century is different from the Medieval Warm Period, Roman or Egyptian warm periods.
I remain skeptical because the various adjustments all seem to be one way. The strangest is that the sea levels need to be adjusted upwards because the land is now rising but it wasn’t before.
Nick
As I see it, there are two possible approaches. We have a lot of data, but we know that there are a lot of issues/problems with the data. So what do we do?
We can either:
1. Assess the data, try and identify the problems/issues and consider what adjustments need to be made to deal with the issues/problems hoping by making these adjustments to improve the data., Or
2. We can discard any data where there are identifiable issues/problems and make a small set of only good quality data that is so good that it needs no adjustment whatsoever.
There are pros and cons with both approaches. The first approach is a larger set, but when you adjust data it is no longer data.n The second approach results in a smaller sample but the data remains data.
Thus the issue all boils down to whether the second approach will result in a sample set of sufficient size for the purpose to which it is being put. In my opinion, if we disregard the polluted data/the data where there are known issues and use only the data which is pure and of good quality we are left with a sufficient size of sample set. For that reason, I favour the second approach over the first approach.
Nick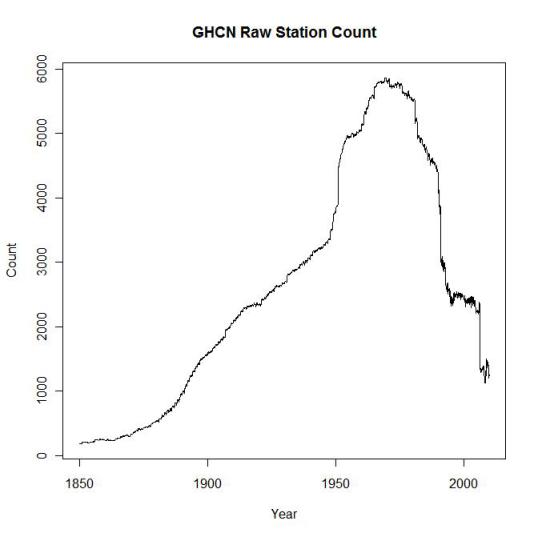
You are a consummate mathematician, in fact one of the most qualified who comment on this site, so you must readily appreciate the problem that comes with a time series data set that has undergone the following changes;
And also look at how there has been a significant change/trend towards airport stations:
http://notrickszone.com/wp-content/uploads/2017/02/NOAA-Data-Manipulation-Urban-Bias-Airport-Temperature.jpg
Further, airports in the 1920s and 1940s are nothing like airports today. So even if an airport station was in the data set in 1940 and remains in the data set today, the airport in the 1940s may have had a grass runway, a very small terminal, and no cargo terminals etc. the Heathrow airport of today is nothing like the Heathrow airport of 1930s/1940.
https://realclimatescience.com/alterations-to-climate-data/
So much for Nick Stokes the fraud’s endless evil.
Nick Stokes,
It is common knowledge that Sydney and Melbourne are having more, longer, hotter heatwaves because of global warming.
That is, until you inspect the original data and the ACORN-SAT homogenised as well. You get these results, that show no such thing:
http://www.geoffstuff.com/are_heatwaves_more_severe_version2.pdf
Instead of trying to show a path through data, why not start with whether the story about the data is credible or not?
Geoff.
“I agree that this relates to the very modern period only.”
So, the way we approach assessing climate depends on the time period.
I hope Nick and Mosh can explain this further, as this means the squiggles in the lines mean different things at different times.
Sounds like an inexact science.
Andrew .
You have to admit that Nick is very good at what he does, whether he actually believes what he says I am not sure.
I would like to bring up this point – “As I said in the article:
‘This can then be used directly in computing a global anomaly average.
The main providers insert a homogenization step, the merits of which I don’t propose to canvass here.
The essential point is that you can compute the average without that step, and the results are little different.”
It just so happens that Zeke computed the Average Global Temp (which I assume was really land only) using average “Actual Value”, with no adjustments at all.
Here is the Result, would you say it looks anything like the current “straightened Trend” graphs from GISS or any of the others?
http://rankexploits.com/musings/wp-content/uploads/2014/06/Averaged-Absolutes.png
And then there is this Statement “But data of what? NAS and GISS 1981 are of NH, land only (and very few stations).
UAH is troposphere. Hansen 1987 was based on met stations only, no SST. GISS since 1998 is land/SST.
There is no use comparing such disparate things.”
But NCDC were using the Land & Sea Global Average in 1998 as well, in fact they published the 1997 Global Land/SST temperature here.
https://www.ncdc.noaa.gov/sotc/global/199713
Note the comment about a different Baseline, but also note what they published what not the Anomaly, but the Computed Actual Temperature, ie Baseline + Anomaly.
It was 62.45F or 16.92C.
The 1999 Report for 1998 stated that 1998 was hotter than 1997, so higher than 62.45F.
The current NCDC value for 1998 is 58.13F or 14.53C.
So in approximately 20 years they have lowered the 1998 temperature by 4.32F or 2.39C.
Perhaps Nick can provide an adequate Justification for such a large change?
Nick – You have shown, “for Australia (BoM) at least, that you can follow the unadjusted temperature data right through from within a few minutes of measurement to its incorporation into the global unadjusted GHCN, which is then homogenized for global averages”.
Unfortunately this does not follow through GHCN to the final stage, even for the unadjusted data. You need to examine the integration of the CLIMAT data, which you show, into MCDW by NOAA, which then becomes the final “global unadjusted GHCN”, but, as my example here at https://oneillp.wordpress.com/2017/02/09/ghcn-m-raw-data-from-ireland/ shows, may lead to corruption of data values which up to this point have been correctly reported in GHCN unadjusted based on the CLIMAT data. This is known to GHCN (see the March 11th 2017 entry in the GHCN-M v3 status.txt file), but the “correction” hardly inspires confidence. Failure to spot that your “corrected” unadjusted data still contains six identical rogue mean temperatures values for six months of the year at 51.85°N is impressive. Five of these are picked up by quality control as more than 5 SD from the historic monthly mean, but one slips through into the adjusted data. An obvious check,which appears to be absent, would be that any MCDW values grossly different from the previous CLIMAT data are flagged for manual checking. The belief in the status.txt file that problems are confined to “select stations in Ireland” may be overly optimistic.
I’ve just noticed that Australia is unique among the major contributors to GHCN-M v3 in _not_ having its data integrated into MCDW. Australia has 30672 records for 586 stations in ghcnm.tavg.v3.3.1.20170809.qcu.dat, with no incorporation in MCDW. The next largest number of records without incorporation in MCDW is 555, for Iraq, with 14 stations.
So there is a reason why Nick would not have considered that step of incorporation into MCDW since it does not happen for Australia. But it does happen for at least some records for every other country in the GHCN-M v3 inventory with more than 555 records, and so it seems unwise for NOAA to simply conclude that this problem affects only “select stations in Ireland” without further explanation.
The inability to correctly implement a correction does not inspire confidence that the nature of the problem has been identified. It does not suggest that data has been manipulated or fabricated, but rather gathered and maintained without due care and attention.
Peter,
The point of the article was really transparency. It’s not saying that errors can’t be made; it’s saying that if made, they can be found. You were able to do that with the rogue Irish values, by comparing what Ireland recorded to what appeared in GHCN.
Nits…mostly tech writing issues:
First, technical writing like this can be especially time consuming, requiring a dozen or more revision cycles for even a short article.
IMO, the most valuable thing in the entire article is that Australia’s bill of, er, bureau of meteorology use (highest+lowest)/2 as the daily central tendency, i.e. aggregate temperature number for each “day”, where “day” doesn’t necessarily begin right at midnight nor sun-set nor sun-rise. Next month: Techniques used/abused for arriving at monthly aggregate temperature, and temperature anomaly figures. Maybe by December we can get to a clear write-up on the mysterious “homogenization” and the various techniques and software used to carry it out.
Use a single weather station and work straight through that one from beginning to end, not even mentioning others. That simply created confusion.
Along the way, keep the hyperlinks synchronized with the words, tables and graphs…do not separate them by even a sentence if at all possible. And no hand-waving allowed. Revision cycles can make this even more difficult. I say this because I am not sure which of numerous links was supposed to lead us to source code…and am wary enough of malware and time priorities are such as not to simply try each one until I have happened on the correct one.
Then, go to show a second station all the way through. Then a third… Choose each station as examples of possibilities: stable readings, changes in environs that probably affected readings up, …down.
What are the frequencies of polling of the automated weather stations? Yes, there is bound to be both variation and drift, and proper and improper handling of missed readings. There was probably even more variation, drift, and missing readings on the old manual systems.
The amount of data is overwhelming. (I remember the local meteorology dept. and weather bureau guys freaking out through several telecomm upgrades. There was a couple decade span when the Felonious State U meteorology dept. had more and better data on the weather on a spot on Mars than we had here on the ground in a 2-3 mile radius around the building.)
When you post a graph, diagram, map, etc., please provide a key (+scale for maps). Some of these look like they might be very interesting, but mean nothing without a key.
At first, I had to pause to try to translate. Is BoM, “bill of materials”? Ah, context, probably “bureau of meteorology”? UK? Ah, a map, so it must be Australia. GHCN? GWPF? Yah, sure, I think I looked up that last one once. NCDC? Is that more like CDCP or BATFE? RSS? CSST? Ah, the SST part is probably “sea surface temperature”. USCRN? USHCN? CRN1? ACORN? Those leftist saboteurs who had to change their name in shame, but then shifted to other gangs to make it more difficult to track them? NMAT? NASA I know; used to work there. TOBS looks like it might be “Times of Observations”…oh, or “Time of Observation Biases” (so, why not ToObs or ToOs or ToOBs? ToO or ToOB for singular?). At least the quote from “Karl’s paper” defined its main acronym.
Please, be kind. My network access device can only sip and display tiny quantities of words…and decent images. This virtual key-board is an abomination. And this is neither the main focus of my profession nor a significant hobby, though I certainly am interested in seeing all this clearly laid out.
The past has been cooled consistently to exacerbate the warming trend. Administrative adjustments now are a giant factor in the warming.
… These convenient adjustments are highly unlikely from a statistical perspective.
… If the adjustments went the other way, would they have been done?
… Heads it is adjusted, tails, it is ignored.
… Why does NASA always ignore their own satellite data and instead quote GISS?
Temp adjustments to the GISS can be viewed here…
https://postimg.org/image/ctawb7m49/
I suspect this game has run it’s course, though.
“I suspect this game has run it’s course, though.”
I think so, too. There is no legitimate defense for changing historic temperature records the way they were done, and that should be obvious by the weak or nonexistence defense of questions about the historic record in this thread.
One of these days the truth will out to everyone.
The article you linked to shows:
. Average adjustment is small, 0.0175 C/decade.
. The adjustment for Darwin is upwards in recent years.
If half the adjustments are up and half are down, but the up ones are recent but the down ones are for older measurements, then we can have both these statements true:
. Average adjustment is small.
. The effect of the adjustment is a large increase in the warming trend.
Do you have a graph showing adjustment by year?
“then we can have both these statements true”
The statement about small adjustment is quantified by the change to trend, in C/decade. I showed a histogram of that over long-record world stations – Darwin was well out in the high tail.
“Do you have a graph showing adjustment by year?”
adjustment of what?
Your article from December 21 2009 has a graph titled “GHCN adjustment change to trend, stations > 80 years length”. You said the average adjustment to trend was small, 0.0175 C/decade. I thought you were saying the average adjustment to temperatures was small, but reading it again I see that you were referring to the adjustment to the trend, so what I said in my previous post isn’t relevant.
In the R program, you had:
for(i in 1:(len-1)){
kk=kk+1
# to find matching rows, first check diff between stat nos and years
u=vmean_ann_adj[j,]-vmean_ann[i,]
# If the adjusted counter has got ahead of the unadj, wait
if(u[1]<0){ if(j<jmax) j=j+1; u=vmean_ann_adj[j,]-vmean_ann[i,] } # If we have a match, add to regression vec vv[]
if(u[1]==0 & u[2]==0 ){
if(!is.na(u[3])){ # don't add to regression if NA
k=k+1 # local adjusted counter
jj[k]=kk # x for regression
vv[k]=u[3] # discrepancies for regression
}
if(j0){
m=m+1 # m is station counter
grad[m]=slope(vv[1:k],jj[1:k]) # compute regression slope
k=0 # zero local counters
kk=0
}
}
I can program but haven't used R. It looks like "i" will be incremented every time around the "for" loop, but j will only be incremented only once around the loop even if there are more rows in part of vmean_ann_adj than in vmean_ann. Would that mean some rows will be missed?
Carl,
This is the process for extracting station records from the GHCN format. This has one line per year (12 mths) per station. I have two files, one adjusted, one unadjusted. I’m trying to keep them in sync. Not every line in the undajusted file will have a corresponding one in the adjusted; that is why j tracks i. I don’t think lines get lost. They are basically just being sorted. I was also fairly new to R then; I do it differently now.
If the T constructions that gave rise to the cold scare were bogus the same may be true of those that gave rise to the warm scare. Save the gay baby whales and the Iditarod! –AGF
I still regard as a mystery why August 2009 monthly min and max for at least 32 Western Australia weather stations were listed, seemingly accurate, in the BoM’s CDO from 1 September to 17 November 2009 when they were suddenly changed, the average increase for August 2009 monthlies close to 0.4C. The BoM claims it was a bug in an updated version of its Daily Weather Observations on the web that caused rounding to the nearest degree. The database bug curiosity is detailed at http://www.waclimate.net/bom-bug-temperatures.html
Not directly related but still relevant, more than half of all daily observations recorded across Australia before 1972 Celsius introduction were rounded to the nearest F degree.
Your article from December 21 2009 has a graph titled “GHCN adjustment change to trend, stations > 80 years length”. It shows the average adjustment is quite small. Wouldn’t most adjustments occur for stations with a short period of measurements. Those would be the most problematic. Do you have a graph showing the frequency of each size of adjustment for all stations.
Also, I think leaving out the UHI effect is a major failing of the attempt to get an accurate long term picture. Since there are few places that have depopulated, and so many sites are now at busy airports, the UHI effect is bound to show a spurious warming.
Carl,
I did some later analyses of GHCN V3. The last is here, and links to the earlier. It shows three groups; stations with >30 yrs data, >45 yrs data, and >60. I don’t think it’s true that most adjustments happen for short period stations, but they are the most affected. It takes a certain interval to compile the evidence that adjustment may be needed, so they are less likely to be near the ends.
Homogenisation adjusts for discrete events, so it can’t deal with gradual UHI. GISS deals with UHI separately.
Nick:
Thanks for your time providing information re the BOM adjustments. You said “Homogenisation adjusts for discrete events, so it can’t deal with gradual UHI. GISS deals with UHI separately”. What is your opinion of the skill of the GISS adjustments? Given that UHI would show a false warming signal, have GISS compensated for that by reducing the measured warming?
Carl,
Sorry, I don’t know very much about the skill of the GISS UHI adjustments.
You haven’t checked what GISS does with your data? I meant all their adjustments to BOM data, not just for UHI. I would think that if the BOM has already adjusted the data and homogenised it, there wouldn’t be any more adjustments needed for discontinuities due to site changes. Do you know whether they adjust the Australian data before including? You’ve given thoughtful responses on the BOM data. I’m trying to get your opinion as an informed person of what happens after the data leaves the BOM.
Regarding the BOM adjustments. Unless there is a pattern to the discontinuities, the adjustments should average out to about zero as you said they do. Wouldn’t the important changes then be the non-random ones, in particular UHI. Homogenising the data might be useful for looking at the history of a particular place, but for looking at climate trends the important adjustments would be those that didn’t cancel each other out. The biggest would have to be UHI. I think for climate trends, it would be necessary to eliminate data that was corrupted by UHI over time. That would require studying each site individually. For example, if a site was in the country 30 years ago, but is now surrounded by bitumen, buildings, cars and air conditioning vents then you would eliminate that site from the list that was used for climate trends. It might still be useful for determining whether today was hotter than yesterday, but not for determining whether the climate has warmed by a fraction of a degree over 50 years.