Guest post by David Middleton
Over the past 10 months or so, articles like this have been a “dime-a-dozen”…
ENERGY TRANSITIONS
Coal plants keep closing on Trump’s watch
Benjamin Storrow, E&E News reporter
Climatewire: Tuesday, February 21, 2017
[…]
In the next four years, utilities have plans to close 40 coal units, federal figures show. Six closures have been announced since Trump’s victory in November.
[…]
Any guesses as to why this is irrelevant?
Here’s a hint:
AUG 6, 2017
Nine Natural Gas Facts That You Should Know
Jude Clemente , CONTRIBUTOR
I cover oil, gas, power, LNG markets, linking to human development
Natural gas is now our main source of electricity, and thanks to the shale production revolution prices collapsed from $8.86 per MMBtu in 2008 to just $2.52 in 2016. Prompt month September prices are now below $2.80, a shoulder month and blue weather maps for the next two weeks mean a bearish market. So far this summer, although hotter on the low demand Western coast, we simply haven’t had a prolonged heatwave to increase prices.
Gas is not just cleaner but also has unmatched versatility: no single sector accounts for more than 35% of all gas usage – utilized in electricity, industry, heating, transportation, and more. Gas is the most interesting and talked about major fuel market these days and in future, so continually arm yourself with some gas knowledge:
1. FERC now finally has quorum for the first time since early-February, and with a huge backlog of unapproved pipeline projects at least 6 Bcf/d of new takeaway capacity projects are scheduled to come online throughout the critical Appalachian Basin between now and the end of First Quarter, 2018. Although don’t expect significant volumes flowing through the troubled Rover pipeline until next year – a 3.25 Bcf/d line carrying PA and OH shale gas into eastern Michigan and up into Dawn Hub in Ontario.
2. From 2016-2018, U.S. piped gas export capacity to Mexico will double to nearly 15 Bcf/d. The country now takes about 4.2 Bcf/d from the U.S. and needs more U.S. supply because gas is 60% of Mexico’s electricity and domestic production is rapidly dropping. But, bear in mind that the 2013 Energy Reforms have been progressing and upstream auctions for more foreign investment have been successful. Mexico’s de-regulation is about producing more, not importing more from the U.S, with a $640 billion investment required (here).
3. By 2020, more than 150 new natural gas power plants are scheduled to come online in the U.S., concentrated in or around our shale basins. There’s at least 90,000 MW of new gas generation currently in development, 70% of which is located in the PJM and ERCOT regions. This represents nearly a 20% expansion of our gas capacity, as gas is surging toward being 50% of all U.S. power capacity – given coal and nuclear retirements and the requirement to back up wind and solar.
4. We’ve been lucky: we had the warmest winter ever in 2015-2016, and 2017 has brought the warmest February ever. Let’s be clear: a normal cold winter could bring $4 or even $5 natural gas. This is especially true since low injections in the past month (a 20 Bcf gain reported last week) should equal just 3.7 or 3.8 Tcf in gas storage to start the winter withdrawal season in November. This would be below average and well below the more than 4 Tcf we had last year. As a declining surplus, inventories are now 9% below last year’s level and just 3% above the five-year average for this time of the year. To reach 4 Tcf, the average weekly injection over the next 15 weeks until the heating season will need to average a very unlikely 66 Bcf.
5. As likely our most vital incremental gas producing state, Pennsylvania’s GOP-controlled Senate has passed a volumetric fee on production designed to generate an estimated $100 million annually. This severance tax will be a very tough sell in the House, where Republicans have a strong majority. PA’s Commonwealth Foundation details the full proposal on its website. Make no mistake: anything that disrupts PA gas production impacts ALL natural gas users around the world. The Marcellus is probably the world’s largest gas field and now produces nearly 20 Bcf/d of gas – more than double the second place Permian in the U.S.
[…]
Key points
- U.S. natural gas exports are rapidly rising.
- 90 GW of natural gas-fired power plants are scheduled to come online by 2020.
- One normally cold winter could send natural gas prices up to $4-5/mmbtu.
- The Marcellus is fracking HUGE.
What does any of this have to do with coal?
Natural gas prices have been the driving factor in the utilization rate of coal-fired power plants since at least 2009.
From 1997-1999, the spot price (Henry Hub) for natural gas averaged $2.28/mmbtu. In 2002-2003, there was a surge in construction of natural gas-fired power plants.

From 2003-2008, natural gas prices averaged $7.10/mmbtu and very few natural gas-fired power plants were built. Recently low natural gas prices appear to be fueling another surge in gas-fired power plant construction.
JANUARY 30, 2017
Natural gas-fired generating capacity likely to increase over next two years
Source: U.S. Energy Information Administration, Electric Power Annual and Preliminary Monthly Electric Generator Inventory
The electricity industry is planning to increase natural gas-fired generating capacity by 11.2 gigawatts (GW) in 2017 and 25.4 GW in 2018, based on information reported to EIA. If these plants come online as planned, annual net additions in natural gas capacity would be at their highest levels since 2005. On a combined basis, these 2017–18 additions would increase natural gas capacity by 8% from the capacity existing at the end of 2016. Depending on the timing and utilization of these plants, the new additions could help natural gas maintain its status as the primary energy source for power generation, even if natural gas prices rise moderately.
The upcoming expansion of natural gas-fired electricity generating capacity follows five years of net reductions of total coal-fired electricity generating capacity. Available coal-fired capacity fell by an estimated 47.2 GW between the end of 2011 and the end of 2016, equivalent to a 15% reduction in the coal fleet over the five-year period.
The electricity industry has been retiring some coal-fired generators and converting others to run on natural gas in response to the implementation of environmental regulations and to the sustained low cost of natural gas. The cost of natural gas delivered to power generators fell from an average price of $5.00 per million Btu (MMBtu) in 2014 to $3.23/MMBtu in 2015 and averaged $2.78/MMBtu from January through October 2016, the latest available data.
Expanded production from shale formations is one of the main reasons that natural gas prices have remained low in recent years. Many of the natural gas-fired power plants currently under construction are located in Mid-Atlantic states and Texas, where the nation’s major natural gas shale plays are located. Expanding natural gas pipeline networks also help support the growth in natural gas-fired electric generating capacity.
Based on projections in EIA’s January 2017 Short-Term Energy Outlook (STEO), natural gas prices are expected to increase in both 2017 and 2018. Rising natural gas prices could lead developers to postpone or cancel some of the upcoming power plant additions. Construction timelines for these plants are relatively short: more than half of the natural gas-fired generating capacity scheduled to come online in 2017 and 2018 was not yet under construction as of October 2016.
[…]

While the construction of new and decommissioning of old power plants plays a role in the generating mix, a more significant factor is utilization rate.
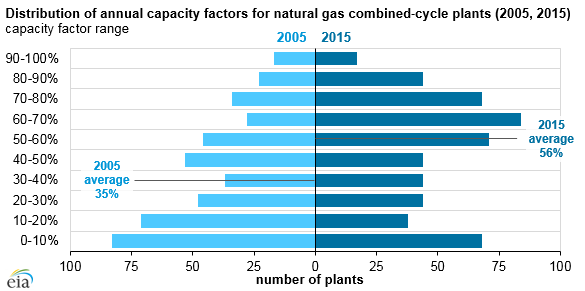
Average utilization for natural gas combined-cycle plants exceeded coal plants in 2015
Source: U.S. Energy Information Administration, Electric Power Monthly
Last year marked the first time on record that the average capacity factor of natural gas combined-cycle plants exceeded that of coal steam plants. The power industry has been running natural gas combined-cycle generating units at much higher rates than just 10 years ago, while the utilization of the capacity at coal steam power plants has declined. The capacity factor of the U.S. natural gas combined-cycle fleet averaged 56% in 2015, compared with 55% for coal steam power plants.
The mix of energy sources used in U.S. electricity generation has changed dramatically over the past few years. This change is particularly evident in the shift from the use of coal to natural gas for power generation. The industry has been building new natural gas capacity and retiring coal plants, but another important factor behind the changing generation mix is the day-to-day pattern of how existing power plants are used.
Coal power plants primarily rely on steam-driven generating units. In contrast, power plants fueled by natural gas rely on a variety of technologies. Natural gas-fired generating units driven by combustion turbines or steam turbines accounted for about 28% and 17%, respectively, of total natural gas-fired capacity in 2015. Combined-cycle plants, which are designed as an efficient hybrid of the other two technologies, accounted for 53% of gas-fired generation capacity and tend to be used more often than the other types of natural gas generators, as measured by capacity factors.
Capacity factors describe how intensively a particular generating unit or a fleet of generators is run. For instance, a capacity factor near 100% means that the unit is operating almost all the time at a rate close to its maximum possible output.
When natural gas prices exceeded coal prices by a large margin, as was typically the case over the 2005-08 period, electricity systems where both natural gas-fired combined-cycle and coal-fired power plants were available to serve load would typically run combined-cycle units only after making maximum use of available coal-fired generation. As natural gas prices have declined, power plant operators have found it more economical to run combined-cycle units at higher levels.
The capacity factor of the U.S. natural gas combined-cycle fleet has risen steadily from an average of 35% in 2005 to more than 56% in 2015. Although there is a wide variation of capacity factors for natural gas combined-cycle power plants, many of these units operated in the 50%-80% range in 2015. In 2005, combined-cycle units commonly operated at capacity factors lower than 30%.
[…]

The utilization rate of coal-fired plants is very sensitive to natural gas prices.

Here is a plot of the coal utilization rate with natural gas spot prices overlaid:

Coal-fired utilization rates correlate fairly well with natural gas prices (R² = 0.4396 (2005-2015), R² = 0.7232 (2009-2015).
Here’s the plot for 2005-2015:

Under the EIA’s reference case with no clean power plan, they forecast that US coal-fired generating capacity will decline from 274 to 217 GW between now and 2050.
Here’s what happens when I combine the coal-fired utilization rate (calculated from projected natural gas prices) and the EIA’s generation capacity forecast:

The above projections are based on the US EIA’s fairly conservative estimates of future natural gas prices and current forecast of coal-fired power plant closures with no regulatory relief other than the cancellation of Obama’s Clean Power Plan. If coal utilization rates rise back to 65-70%, the rate of plant closures will very likely slow down.
The Wild Card
What happens if the Marcellus goes south?

The Marcellus/Utica is fracking huge. But, like all oil & gas plays, it will peak and enter a decline phase. If that decline is sharp, like the Haynesville, gas prices could rise more quickly than expected. What happens to coal-fired utilization rates if natural gas spikes to $10-15/mmbtu for a protracted period of time? The coal-fired utilization rate would climb to 69-75%.
| Natural Gas ($/mmbtu) | Coal Power Plant Utilization Rate |
| $ 2.00 | 59% |
| $ 3.00 | 60% |
| $ 4.00 | 61% |
| $ 5.00 | 63% |
| $ 6.00 | 64% |
| $ 7.00 | 65% |
| $ 8.00 | 66% |
| $ 9.00 | 67% |
| $ 10.00 | 69% |
| $ 15.00 | 75% |
A rise to a 70-75% utilization rate by 2050 would lead to more coal-fired generation, relative to 2015, despite the decline in capacity from 274 to 217 GW.
I don’t expect that the Marcellus/Utica will start its decline any time soon. The IEA forecasts that Marcellus production will continue to rise through at least 2022… But no one’s crystal ball is perfect.
However, coal-fired power plants will very likely return to 60-65% utilization rates as natural gas prices modestly rise over the next few years and decades. Both coal and natural gas are currently operating at utilization rates that allow for significant increase in output without capacity additions.
The interesting thing is that coal consumption could rise significantly with no real capital investment by utilities in the US.
Bingo!
It’s called power factor.
Capacity factor is the maximum output relative to name plate capacity. Natural gas combined cycle has a capacity factor of about 87%, a conventional coal plant about 85%.
Utilization rate is the actual output relative to name plate capacity. Natural gas power plants were around 56% and coal plants were around 55% in 2015. Either power source could generate considerably more electricity without adding new capacity.
Sorry, miswrote. Meant CF.
Wish I could reply directly to Mr. Middleton’s August 7, 2017 at 2:13 pm statement that:
“That Capacity factor is the maximum output relative to name plate capacity” and that “Utilization rate is the actual output relative to name plate capacity”
But, the site does not provide the opportunity to reply directly to Mr. Middleton’s comment in this case.
I in any event beg to differ, regarding Mr. Middleton’s definition of “capacity factor”.
Capacity factor, in my usage as a capacity planner (retired) for the nation’s largest public utility, is NOT “the maximum output relative to name plate capacity”. It is the generating unit’s actual output (in MWh) compared the unit’s maximum possible output (In MWh) over a given period of time. Where the “maximum possible” can be either the name plate capacity times the number of hours of operation over the period OR (just as frequently) the plant’s maximum net dependable capacity times the number of hours of operation over the period. The periods cited are usually mentioned as annual or monthly.
To be crystal clear:
Capacity Factor = Power actual produced over a period/Max power possible to produce over that period.
In the case of the EIA study cited above the EIA specifically stated:
“Capacity factors describe how intensively a particular generating unit or a fleet of generators is run. For instance, a capacity factor near 100% means that the unit is operating almost all the time at a rate close to its maximum possible output.”
See the report listed above or at: https://www.eia.gov/todayinenergy/detail.php?id=25652
From the content of the report I assume EIA meant ANNUAL capacity factors. Furthermore, from the context of the report, it is clear the EIA used the term “utilization”, to mean the net change in annual capacity factors from over a comparative period of time. As in:
” The power industry has been running natural gas combined-cycle generating units at much higher rates than just 10 years ago, while the utilization of the capacity at coal steam power plants has declined. The capacity factor of the U.S. natural gas combined-cycle fleet averaged 56% in 2015, compared with 55% for coal steam power plants. ”
That said, please recognize, that my inability to reply directly to Mr. Middleton does not provide him with an equal an opportunity for rebuttal…. an opportunity any gentleman should be allowed.
Capacity and utlization are often used interchangeably.
The capacity factor is what a power plant is capable of generating…
New natural gas combined cycle power plants are capable, on average, of delivering 87% of their capacity.
Actual output is highly variable.
If you go to the EIA’s plant level data, you can see that output ia highly variable and almost always lower than the plant’s maximum capacity factor.
I call the latter a utilization rate because that’s what it actually is. Calling both sets of numbers capacity factors, as EIA often does, is confusing.
If you don’t like my terminology, pretend I am using maximum capacity factor and actual capacity factor.
Replying to Mr. Middleton August 9, 2017 at 2:18 am
Dear Sir
Thank your for your reply. I understand the distinction your trying to made in using the term “utilization” verse “capacity factor”. And I can understand reasons your for taking “literarily license” in the current case. Never-the-less I believe the readers should understand that such license is being taken and that some clarification should be made.
Strictly speaking the “maximum capacity factor” for any generating unit is 100% annually.
This may seem like I’m quibbling, but, bear with me and I’ll demonstrate why this is important.
The capacity factors presented in EIA’s Table 1b of your comment are, for all practical purposes, the MINIMUM average annual capacity factors (over a continuous 20 year period) needed to provide economic justification to construction the types of generating assets listed. They are NOT the “maximum capacity factor” for that type of unit. Nor do they represent the maximum annual output expected of that type of unit.
Brand new units (1-2 years old) frequently fail to meet the capacity factor listed in Table 1b as the “kinks” are worked out of the assets. For roughly the next ten years they can be expected to exceed the rates listed on Table 1b. In the remainder of the 20 year period, the capacity factors begin drop to the point that they, more or less, meet the rates listed on Table 1b — as wear and tear necessitate more frequent and lengthy outages.
After hitting the 20 year mark the asset is likely to be retained… until it capacity factor consistently hits below 30%… at which point one would start to consider the unit’s retirement. Once a base-load unit hits below a capacity factor of 20% (gas or coal) – well retirement is near certain.
Now to why this this “quibbling” is important. Look carefully at your graph “Distribution of annual capacity factors for Natural Gas Combined-Cycle Plants (2005,2015)”. You’ll notice that, in 2005, there were an inordinate number of N.G. combined-cycle units operating with capacity factors in the 30-10% range. These units would have more than likely been destined for near immediate “retirement”. Meaning they were likely older “base load” assets in poor condition. That these units were not working hard in 2005 is a fair indicator of their likely poor condition, because the economy was “hopping” and most utilities were running their assets as hard a humanly possible.
Side Note: It may seem odd, but, the 2005 units shown with capacity factors of 0-10% wouldn’t necessary be destined for the scrape heap because they were more likely to be units specifically constructed to serve as either “reserve capacity” or as “seasonal capacity”. Consequently, these assets could have been in relatively good condition and serving their intended purpose.
Now look at the 2015 figures. You’ll notice the number of Natural Gas Combined-Cycle Plants units with capacity factors in the 20-10% range were dramatically reduced compared to 2015. In addition the number units in the both the 10-0% and 30-10% ranges were reduced. Notice also the at a substantial number of units remain in the 10-0% range.
There are TWO ways of interpreting the graphs data as presented.
1) That gas units are being worked harder in 2015 as compared to 2005. (As commonly accepted in the comments here).
OR
2) That gas units that based load gas units that were old, worn-out, or other wise uncompetitive in 2005 were replaced with new units by 2015. Consequently, the graph reflects the increased output one would normally expect when replacing a worn out assets with a new ones.
Given that the poor “quality” of the combined-cycle assets typically constructed prior the “gas boom”, I suspect the EIA graphs reflect a combination of both factors – with the 2nd interpretation being a significant contributor to the graph’s results. It’s impossible to say definitively with out knowing more.
The maximum capacity factor is never 100%. Not even for nuclear power. Every power plant unit has to have some down-time for maintenance.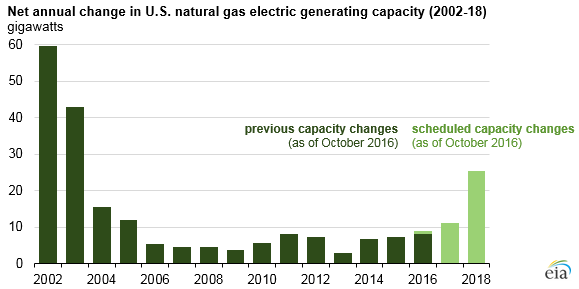


My first thought was that the EIA distribution plot of natural gas capacity factors included less efficient types of gas turbines. But it’s just for combined cycle.
There were very few additions of natural gas-fired capacity from 2005-2015…
https://www.eia.gov/todayinenergy/detail.php?id=29732#
The EIA estimates that natural gas combined cycle plants can operate at 87% of their name plate capacity on a sustained basis. Even with low natural gas prices, few NGCC’s operate at that high of a utilization rate.
These capacity factors are what the EIA estimates average power plants are capable of…
Table 1b is on page 8 of the 2017 LCOE report.
https://www.eia.gov/outlooks/aeo/pdf/electricity_generation.pdf
This is what they actually did in 2005 and 2015…
In the article the EIA used utilization rate and capacity factor interchangeably…
https://www.eia.gov/todayinenergy/detail.php?id=25652#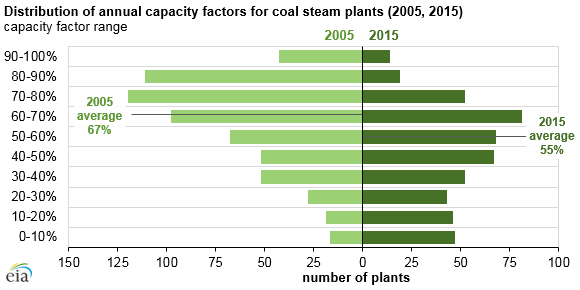
Most coal-fired plants could operate at 85% of their capacity on a sustained basis; but they rarely do…
Replying to Mr. Middleton August 10, 2017 at 12:24 pm
Dear Sir
I feel like were beating a dead horse over a minor point, but frankly your central premise that the annual capacity factors the EIA listed on Table 1b are some kind of “maximum” is simply and plainly wrong. As to your statement:
“The maximum capacity factor is never 100%. Not even for nuclear power. Every power plant unit has to have some down-time for maintenance.”
Nope sorry. Dead wrong. Nuclear plant’s can and do achieve 100% annual capacity factors. Indeed they sometimes operate in excess of 100%. For example, on August 2, 2012 Rajasthan Atomic Power Station Unit five became the second longest running reactor in the world by being in operation for 765 days continuously. It did so operating at 105% capacity factor. (That is not a typo). Prior to this period it operated at a 98.5% capacity factor. See:
http://www.thehindubusinessline.com/news/unit-5-of-raps-becomes-worlds-2nd-longest-running-reactor/article6386568.ece
Now I’ll grant you the “average” nuclear plant in the United States operate at an average of 91.9% in 2015. But t top ten nuclear units operated that year had capacity factors above 100% . They ranged from 100.8 % to 102.6%. See:
https://www.nei.org/News-Media/News/News-Archives/US-Nuclear-Plants-Set-Reliability-Record-in-2015
I reiterate my previous point. The capacity factors listed for Coal (with carbon sequestration) and Natural Gas Combined Cycle systems on the EIA’s Table 1b are the MINIMUM average annual capacity factors (over the first 20 years of operation) one would require to justify the construction of new base-load generating units. The capacity factors listed are the product of economic constraints. They do not define a physical “maximum operating constraint” … average or otherwise. Nor do these figures define capacity factors limitations required to conduct annual plant maintenance, planned outages, or unplanned outages
The EIA capacity figure listed do take in to account certain practical considerations capacity planners consider – particularly the unit’s thermal efficiency. Most units optimum thermal efficiency is achieved while operating BELOW the unit’s name plate. For example, most Pulverized Coal (PC) units peak efficiency this is achieved near the 85% capacity factor mark. Since most planners focus on lowering the cost of electricity, it’s common practice to propose operating NEW units near the thermal optimum. That you can conformably fit a maintenance program well within the 85% capacity figure is simply a happy coincidence.
So while your statement ” Every power plant unit has to have some down-time for maintenance.” is certainly true it’s also ill-relevant .
When a utility has a fleet containing fully depreciated plants (i.e. has units operating past the 20 year mark) , achieving “optimal” thermal efficiencies is less important to preventing the “rate shock” commonly associated with new construction. In such a cases it’s more important, to focus on lowering future total cost than to lower immediate operating cost. Consequently, there’s considerable incentive to operate fossil assets above their thermal optimum as means of fending off a need for new construction. (The exception being nuclear assets.). It’s at this point that maintenance and outage consideration do become a constraints.
On my system, the upper practical limit for a 50-60 year-old base-load pulverized coal unit\ was an annual capacity factor in the 93-95% range — with record setting beyond this range possible. Other utilities will have different “upper limits”.
These upper limits are maintenance related. But the better measure of this is are the worlds records for continuous days between outages. These being, roughly, as follows:
Pulverized Coal Unit – 1,093 days. Set by the Tennessee Valley Authority’s Shawnee Unit 6 in February 2007. See:
http://www.powermag.com/tvas-shawnee-fossil-plant-unit-6-sets-new-record-for-continuous-operation
Natural gas plant – No data found. Should be able to meet coal record.
Nuclear plant – 940 days. Set by Heysham 2 Unit 8 in September 2016. See:
http://www.powermag.com/new-record-nuclear-power-plant-online-for-940-continuous-days/
From the world records above you can see that it is physically possible fossil assets to achieve a 100% annual capacity factor. That fossils assets typically don’t is primarily the result of demand fluctuations and the attendant practical need to “load follow” – not any physical constraint.
Finally addressing your statement:
“There were very few additions of natural gas-fired capacity from 2005-2015”
Actually the graph show roughly 5 Gigawatts (5,000 MW) of new capacity being added each year since 2005. That’s roughly equivalent to adding 50 brand new 1,000 Mw base-load units since 2005. Those additions are not, in your words, “very few”.
Moreover the figure covers “net” annual changes in capacity…. so it does not include plants constructed to REPLACE the old inefficient 2005 gas plants. So my original point remains intact… a portion of the change in capacity factors for natural gas combined cycle units can be explained as a result of replacing old plants with new ones.
SIDE NOTE 1: In my view, we see coal fleets operating at lower average capacity factors in 2015 compared to 2005, in part because the typical utility had more coal capacity relative to demand than they did in 2005. Hence there was less the need to run the coal fleet “hard”. This partially explains why the 2015 capacity factor figure look different from those in 2005. (Without discounting the impact of lower natural gas prices, which have a similar impact… and which you have correctly noted).
SIDE NOTE 2: I do have a problem with the with EIA applying a 85% capacity factor to “coal with carbon sequestration “, on Table 1b. Specifically that the EIA came to this figure by making the highly unlikely assumption that a coal based IGCC system with carbon sequestration system can match the capacity factors of a typical pulverized coal (PC) system without carbon sequestration. Where a typical PC could achieve an sustained average annual 85% capacity factor without breaking a sweat, your typical IGCC system would struggle to met this goal — even without an attached carbon sequestration system. I worked in the first IGCC plant in the U.S. and some idea of the limitation of these unit’s. To be fair, Duke Power is actively working on this problem at their Indiana IGCC plant… and was making progress last I looked
The EIA numbers for each type of power plant are the average maximum capacity factors over the life of the power plant (20 yrs in the LCOE calculation). Not the maximum output achieveable by specific units over shorter periods of time.
The purpose of the LCOE calculation is to provide a levellized comparison of the various sources. Obviously, individual units can vary by wide margins from the average and the 20-yr lifetime is way too short for most nuclear, coal and hydroelectric power plants.
LCOE is simply a baseline number. This is the maximum output that can be expected from each type of power plant on a sustained basis.
Furthermore, the EIA numbers are only for US power plants operating under the US regulatory environment. Power plants in India, Red China, Russia or the rest of the world aren’t included in EIA’s numbers.
I normally say I would be happy to live next door to a nuclear power plant. I live within 80 miles of Comanche Peak NGS. However, if I knew one of the units was running at 105% of capacity, continuously for 2 years, I might not feel quite so comfortable.
The EIA’s numbers for coal with CCS are clearly speculative, because no CCS plants have sufficient operating histories. I think there is only one CCS power plant operating in US (W A Parrish) and it only captures a small fraction of the plant’s CO2 for EOR in the West Ranch oilfield.
Replying to Mr. Middleton August 12, 2017 at 5:06 am
Dear Sir
I agreed with roughly 95% of what you said in your last comment. My point of disagreement lies in your 3ed paragraph where you stated:
“LCOE is simply a baseline number. This is the maximum output that can be expected from each type of power plant on a sustained basis.”
To be specific: I agree “LCOE is simply a baseline number”. I disagree that “This is the maximum output that can be expected from each type of power plant on a sustained basis.” Assuming you mean the associated capacity factor (85% in the case of coal) defines “the maximum output that can be expected from each type of power plant on a sustained basis”.
As I’ve stated before the capacity factors listed in the EIA’s table are the MINIMUM capacity factors needed to achieve the desired Levelized Cost of Electricity (LCOE).
I understand where your coming from, I think it’s just that I have more experience with this and the nuclear capacity issues… and appreciate some subtleties I think you missing. Bear with me and I’ll explain.
To begin with, let’s look at this from an economic point of view. If I, as a capacity planner, were to DECREASE the plant’s capacity factor below 85% I would INCREASE the LCOE. And probably get myself & my CEO fired!!!
(For the novice following this discussion you can play with this simplified LCOE calculator to see what I mean. Decreasing the capacity factor increases the LCOE):
https://www.nrel.gov/analysis/tech_lcoe.html
The nuance your missing lies in how we plan. Very roughly, this is how we actually plan new base-load capacity additions.
First we run various technology options (coal, gas, nuclear, etc.) thru a capacity forecast model (computer simulation) that forecasts each option’s expected annual capacity factor over the next 20 years – while competing against all existing assets. This model takes into account factors such as: altered weather conditions; planned outages; unplanned outages; fuel/reagent cost variations; load following demands (if any); any need to place the unit’s on cold or hot standby; hot, cold, and warm start-up cost; variances of the unit’s fuel efficiency with load, Etc. This model “examines” our entire system at a resolution of every hour for the next twenty years.
Then we take the forecasted capacity factors, from the above model, and compare the options LOCE’s and Net Present Value (NPV) figures to make an initial cut of the options. We then select two or three options we want to examine in more detail.
Then we run the selected options in competition against each other AND the existing fleet in another even more sophisticated model — to validate the proposed new units performance and check for impacts on the existing fleet. (This model also examines the entire system as a resolution of every hour for the next twenty years). We also run the model with various generation load scenarios such as: expected load, low load, high load, and cases with different economic and regulatory projections. We narrow the field and repeat until we have a winner. Where the “winner”, more or less, statistically “performs” the best in the collection of cases run.
If none of the new fossil options has a statistically high probability of achieving an average annual capacity factor of AT LEAST 85% (or 90% for a nuclear option) then we either don’t add new base-load capacity or lower the amount needed.
If the new unit’s are being run with capacity factors above what we feel can be reasonably sustained then we look at adding addition capacity. What we “feel can be reasonably sustained” is a somewhat subjective judgment based on the “engineering judgment” of the utility. And in fairness to you, these particular capacity factors figures tend to be a held pretty “close to the vest”.
This is pretty much the point where we are in disagreement – the nuance if you will. Your assuming the EIA’s capacity factors are, in your words, “the maximum output that can be expected from each type of power plant on a sustained basis.” In other words you believe the EIA capacity factors figures are those subjective “what we feel can be reasonably sustained” figures.
What I’m saying is the EIA capacity figures reflect a minimum level of performance – and absolute minimum standard if you will. We plan for, expect, and achieve better performance out of brand new units.
Every utility’s view of the upper capacity factor they “feel can be reasonably sustained ” will differ. Due to variations in weather alone an Alaskan’s utility will have a differing view from one in Florida. But, both will be likely targeting a capacity factor above the EIA’s figure.
As I’ve said in my prior comments, this nuance IS a minor point when discussing competition between fossil assets.
However, it’s not a minor point when renewable come into the mix. Because: 1) Renewable advocates tend to think fossil/nuclear assets are more limited than actually are, and 2) they look at the EIA’s renewable capacity factor figures and think “Oh we can get “close” to that goal and it will be good enough”. Not realizing that they have actually have to the exceed those factors… by margins that will be challenging for them to meet.
This is one reason I’ve devoted a somewhat “excessive” amount of time making my point.
Changing subjects to U.S. nuclear plant performance. Specifically the increased average capacity factors for these units.
The trend to increasing annual capacity factors in the U.S. nuclear industry isn’t new. The annual capacity factors of nuclear units in the 1960s-1980s was averaging in the 50-60% range and has since risen to the annual ~90% level. See:
Now, in the short run, I’m not sure the annual numbers can be improved; because, if you look at the 2015-2017 monthly capacity factors numbers it becomes clear that our nation’s nuclear fleet’s annual capacity factors APPEAR to be limited by seasons demand for electricity as opposed to any maintenance, safety, or refueling issues. See here:
https://www.eia.gov/electricity/monthly/epm_table_grapher.php?t=epmt_6_07_b
Notice that the peak demand winter/summer months (January & August) the capacity factor of the nation’s entire feet are at or near 100%. For January: 101.3% in 2015, 98.8% in 2016, 99.0% in 2017). For August: 98.6% in 2015, 96.3% in 2016. While the capacity factors drop in the low-load “off” seasons.
We’ve known for some time that nuclear units base-load output could be varied to meet seasonal demand and the numbers above reflect it.
In the long run this is important (my view) because:
1) The nation’s nuclear fleet, as currently configured, can (theoretically) “pick-up” a good deal of the “off season” base-load increases that are likely to occur as the economy improves under President Trump.
2) As base-load demand increases during a “Trump” recovery, there is value in obtaining new fossils units that can fill in any demand gaps for base-load power in the “high-load” months while transition to acting as “load -followers” during “low-load” months. Natural Gas Combined Cycle units are ideally suited for this task. (Remember current nuclear assets are already operating near 100% capacity in January & August).
I suspect this is one reason why utilities with substantial existing nuclear capacities are deferring new nuclear and are currently preferring to build high-efficiency base-load natural gas combined cycle units.
3) As we move past the transition period, the 111 (b) GHG regulations currently inhibiting new base-load coal are likely to have been dispensed with. So…. utilities will, at that point, be tending to expand base-load needs with whichever fossil or nuclear assets makes sense for them to use.
In the long run, I expect U.S. nuclear unit’s average annual capacity factors will continue to increase… until the nuclear units truly hit the point where their capacity factors are limited by maintenance, safety, and fuel reloading issues.
Side Note 1: My experience is in the U.S and this discussions covers U.S. plant performance only.
Side Note 2: The above discussion covers planning strategies for new base-load units only. If, for example, we had a need for pure “load following” assets, we would likely lower the minimum capacity factor target to about 40% for new natural gas combined cycle units. That’s an entirely different discussion… one with a whole other packet of nuances.
Just so!
We are also exporting coal to Asia. The amount, I do not know, but it is growing.
Coal exports to both Europe and Asia have risen this year.
a temporary situation…
10 year contracts are “temporary”? Hahahahahahahahahahahaha!!!!!!!!!!!!!
Replying o2hotel9 on August 10, 2017 at 6:30 pm
Dear sir:
Fuel contracts, either coal or gas, tend to vary from 3 to 10 years with 3 years being more typical.
There are “hazards” for utilities with 10-year+ contracts. These being.
1) If the price of coal or gas increase well above expectations you “gain” but you contractors suffers. When such situations get extreme it’s not that unusual for contractors to send the utility off-grade or near off-grade fuel hoping the utility will reject shipments so they can sell the fuel on the open market. We saw kind of behavior when China was paying extraordinary prices for coal during it’s housing “boom” – particularly with Central Appalachian (CAP) coal. Moreover, if the price spikes are due to increased mining/shipping cost beyond the vendors control, you don’t want an otherwise reliable vendor going broke.
2) On the other side of the coin, if the price of the fuel decreases well below expectations, the utility suffers.
Because, I’ve seen both situations, I tend to favor 3-year contracts. If one does go to longer term contracts I generally recommend having contractual “triggers” that provide for price resets should fuel prices wander unreasonably beyond the expectations of both parties.
I agree, with the volatility inherent in fuel prices it is very important for buyers to pay close attention. The point of my comment was that griffie is full of shiite, always has been and always will be. Oh, and with price of coal currently being quite depressed a 10 year contract would likely be a very good deal.
US Coal Exports….March 2017
https://www.eia.gov/coal/production/quarterly/pdf/t7p01p1.pdf
The gradual replacement of coal by cheaper cleaner gas is surely a good thing which we should all hope for.
The gradual replacement of coal by natural gas will render natural gas more expensive than coal… It actually already has.
+1
Or in the case of Australia gas reserves are being exported which reduces local supply which forces prices up. This is happening right now and politicians are in free-fall panic mode arranging meetings with the heads of energy generators as if it’s their fault. Turnbull should look in the mirror if he wants to look for fault.
It is decades since coal could be honestly called anything but clean, emission-wise.
Staff at the US Department of Agriculture (USDA) have been told to avoid using the term climate change in their work, with the officials instructed to reference “weather extremes” instead.
https://www.theguardian.com/environment/2017/aug/07/usda-climate-change-language-censorship-emails
Why not just call it weather?
This website is now the world’s most popular site about warming and extreme weather 🙂
“weather extremes”…that is such a crock
Where I live 90F is a nomal day, we’re used to it…..that would be a weather extreme somewhere else
This is not only a testament to gas supply and price but also the flexibility of newer gas turbine plants. But they do need a very large or dedicated pipeline for those. You would think SC, GA, MS, and TVA could understand this by now. They have all been tagged with massive losses in recent years from highly organized failures with scale.
Utilities sign looonnggg term contracts containing language that protects them from high spikes. The rest of the market picks up the balance. Think Costco. Sams. Walmart.
And it’s the CCPP designs that give NG the edge, not the price alone. In simple cycle CT or Rankine NG would no longer have such a big edge over coal.
Many of the utilities’ coal plants are well over 40 years old, retirement was long past penciled in for them.
The contracts aren’t of that long of a term. Utilities hedge their purchases in much the same way that producers hedge their sales. This smooths the spikes out, but doesn’t eliminate the effect of natural gas prices on power plant utilization rates.
http://www.utilitydive.com/news/rising-natural-gas-prices-power-sector-2017/429789/
Most of the oldest plants will be retiring by 2020-25. After that the retirements flatten out under the EIA reference case with no Clean Power Plan (black curve)…
I’m afraid the water’s are a bit to muddied agree to with EIA on that score. Granted the EIA’s reference case assumed no “Clean Power Plan”. However I see their analysis failing on a several grounds:
1) The “Clean Power Plan” only impacts EXISTING coal plants under the 111 (d) regulations. In 2015, the EPA passed the 111 (b) regulations that impact the construction of NEW power plants. The 111 (b) regulations require any newly constructed coal plants can emit no more than 1,400 lbs CO2/MWh. This regulation effectively mandates use Integrated coal gasification combined cycle (IGCC) with of carbon capture and storage (CCS) technology and makes the construction of new coal plants impossible, given the excessive cost of IGCC based coal generation coupled with CCS.
2) Remove the 111 (b) regulation on GHG’s and coal competes very nicely with natural gas in many regions of the country. Particularly in regions of the country with access to cheap Powder River Basin (PRB) and/or Illinois #6.
3) Folks forget that many natural gas pipelines depend on gird based electricity to move compressed gas (other pipe lines burn gas to run the compressors). And a hard cold snap can cause serious pipeline outages. The Texas black out in the winter of 2011 and similar issues in 2014 provide examples of what can happen. In addition hard cold snaps frequently lead gas producers to choose between supplying gas to home owners or utilities. And voting homeowners usually win.
4) In winter the older coal plants are, generally, easier to start than gas plants and have fewer fuel source problems. In contrast both natural gas plant and “high-efficiency” coal plants, such as supercritical systems, can be nearly impossible to start in the dead of a hard cold snap. (Like say the Kingston plant in Tennessee). So, I can envision a situation where a period of hard multi-year winter cold snaps hits and neither the gas plants or the newer coal plants can start… resulting in a massive winter blackouts. (Basically a repeat of the 1970s). We didn’t have this problem prior to 2011 because the Southeast, Mid-West, and East coast had those “old’ plants. We don’t have them now because those “easy to start” plants were the “inefficient” ones that where typically retired. So, I see a longer term market of less efficient but easy to fuel and start coal plants should we return to more typical winter weather patterns.
5) Obama’s EIA tended to assume a long term trend towards “warmer” winters in their weather assumptions. (Not sure if they did in this case). If that assumption was retained, and I suspect it was, their power demand assumptions are out the window. Most states north of the Mason Dixon line experience peak power usage in the winter. Tying into item 4 above. Southern states tend to vary year to year, often having distinct “maximums” in both the winter and summer. So, coal is more likely to be in increased demand north of the Mason Dixon line – if we return to traditional winter patterns.
6) Most generation plants closers since 2009, were the result of decreased electrical demand resulting form the “Great Recession” – not completion from natural gas. For example, our utility lost roughly 30% of demand in the Great Recession compared to a 2007 reference point. And after the demand fall stopped, despair over Obama’s economic policies forced planners to decrease electrical demand growth forecast to as low as 0.5%/yr from the historical range of roughly 2%/yr. In addition, in the midst of this crises, we closed the older coal plant’s… and when we needed to replace capacity to meet limited rising demand elected to build natural gas plants with lower capital cost … even if we didn’t believe gas would be the long term lower cost option. We did so, in part, because we were locked in by accurate forecasts of the (then) coming the 111 (b) regulations and, more importantly, because we could build the gas units in stages should are low demand forecast prove to be to rosy. Should President’s economic policy succeed and electrical demand return to the historical norms… well we planners wouldn’t be able to justify an 100% natural gas build position. We’d have built a mix.
Walmart is a very, very large user of renewable energy…
I think they may even be going for 100% renewable.
solar panels fix a known percentage of your electricity cost for 25 years.
Ah so basically since the power company will have to constantly generate backup power for them, and they won’t be paying for it, Walmart will end up passing the cost on to the rest of us.
Gee thanks Walmart.
How can solar panels, whose output is unpredictable provide a known percentage of your electricity for 25 years?
BTW, no solar panel has lasted that long.
The answer is Mark, solar output is predictable and that the panels last 25 years with little fall off.
you may find this interesting:
https://www.forbes.com/sites/christopherhelman/2015/11/04/walmarts-everyday-renewable-energy/#59d4d6184a30
And who told you that?They will never ever achieve 100% renewable,Not ever!
This website from the Energy Information Administration shows every power plant in the USA, coal, gas, solar, wind etc. and the amount of energy each produces. Coal use is declining quickly. https://www.eia.gov/state/
Where?
https://www.eia.gov/todayinenergy/detail.php?id=29872
https://www.eia.gov/outlooks/ieo/coal.cfm
Nobody denies that the amount of power from coal has declined in the recent past, thanks to the big drop in nat gas prices. This discussion is about the future. Will the current trend continue into the future or not.
The fact that nat gas prices have been rising is evidence that the trend will not continue and may even reverse.
With Trump in the White House, Obama science experts operate shadow network to press their positions
https://www.statnews.com/2017/08/07/white-house-ostp-obama-trump/
The former Obama administration are like cockroaches.
Cockroaches like decaying wood and stagnant water. And dark.
In related news …
An energy company’s decision to abandon work on a nuclear project in South Carolina has left the state reeling and the governor seeking one of several solutions to save at least one of the two reactors.
Last week, Scana Corp. said it would walk away from its project to build two nuclear reactors in tiny Jenkinsville—after nine years and $10.4 billion spent—stunning local leaders and the 600 nuclear employees and 5,000 construction workers at its V.C. Summer Nuclear Station. The move left Jenkinsville, population 71, with an unfinished worksite the size of 1,000 football fields, while electric customers continue to pay 18% of their bill for a nuclear-power plant that may never generate a single kilowatt.
https://www.wsj.com/articles/south-carolina-seeks-ways-to-salvage-nuclear-project-1502125431
I guess that’s good news for coal and gas.
At least it isn’t bad news for everyone… https://wattsupwiththat.com/2017/08/02/failing-nuclear-power-is-good-for-coal/
According to the Stat article the Trump administration has been very slow to replace Obama-era science and technology folks. This is not good news but seems typical of the dysfunctional White House. Trump obviously regards scientists as suspicious characters who threaten the know-nothingism of his administration. If Congresspeople keep going to Obama people for advice, this can’t be good for the so-called triumph of skepticism. Obama’s people are smart and motivated. Give them a crack in the door and they can do serious damage.
@scraft1: Unfortunately scraft1, I too am starting to get the impression that Trump actually has a problem with the integrity of science, regardless of the scientific issue. Back in January, he appointed Robert Kennedy Jr to head a panel to look into the safety of vaccines, even after they’ve been approved for use:
https://www.cnbc.com/2017/01/10/donald-trump-appoints-vaccine-critic-robert-kennedy-jr-to-panel-examining-vaccine-safety.html.
If he didn’t have a significant mistrust of science, I should think that he would have appointed a scientific adviser by now. He has not, and he has been in office for going on 7 months now. If one does a Google search for “Trump mistrusts science,” you get a rather lengthy list of leftist websites that attack him on this. If a significant number of politically motivated Obama science people are still serving in their positions in govt, that is something Trump must deal with.
The appointment of Pruitt to head the EPA probably can be seen as a positive result of this mistrust as can pulling the U.S. out of the Paris climate accord. However, I believe we need a president that is capable of trusting honest, sound science. He must be a president that has people around him who can identify honest, sound science and apply it to U.S. policy issues. And that certainly includes the climate AGW issue. If a significant number of politically motivated Obama science people are still serving in their positions in govt, this is something Trump needs to deal with.
I can’t say if Pruitt’s read-team-blue-team idea for addressing CAGW issues is a good one. If indeed Trump is viewed as a CAGW skeptic however, he needs to be one for the right reason(s).
Sadly, and I can hardly believe that I, with a scientific degree and a lifelong interest in the natural sciences am saying this – but we are at that unbelievable point where mainstream science has become SO corrupted and SO self serving that we are probable better off with someone who suspects all of it.
Our system, at present, is no longer capable of producing “honest, sound, science.”
And I don’t care for what reasons Trump is a CAGW skeptic. Right now, this is a war, and the enemy of my enemy is at the very least an extremely valuable ally.
Yes, excellently stated. The average person does not trust or believe “scientists” anymore, or “doctors”. Both groups have done this to themselves, they have been caught out pushing agendas or just outright lying. It is going to take a major shift in ethics back to where “science” and “medicine” were 60 or so years ago, and many people will never trust them again. All thanks to leftist ideology. Good job.
It never ceases to amaze me how so many on the left are quick to declare that anyone who disagrees with them is a “know nothing”.
MarkW. I don’t think any of the comment string started by me can be classified as coming from the “left”. Trump supporters need to get used to the idea that Trump criticism comes from everywhere.
I would turn your notion around. To support Trump one has to have an ideological bias that overwhelms one’s powers of observation. The Scaramucci episode should be the eye-opener to turn Trump supporters around. Can you possibly look the other way in the face of such foolishness?
Your response please.
Yes. Because, if I don’t look the other way, I see this (or worse)…
There are two main cost models used – marginal cost and full cost.
It is entirely plausible that the the reason coal keeps chugging away is that the energy companies price coal power at marginal cost on the basis that the plant has been fully depreciated. New gas power requires both running costs and investment.
The situation will change as coal plants reach the end of their service and become uneconomical to replace or extend. I also suspect that new gas plants are much qucker and flexible to bring on stream as required.
New gas plants can be very quickly put into service.
When the marginal cost of coal is cheaper than natural gas, old coal-fired plants can stay in service for a long time.
But new ones still won’t be built
New ones are being built, fool, in China and India and Indonesia and Brazil and South Africa and GERMANY and America and on and on. Your lies can not stop reality.
That entirely depends on what natural gas prices do over the next few decades.
However, there really don’t have to be any new coal-fired power plants in order to increase coal consumption in existing power plants.
People often state that we haven’t built a new oil refinery in the US since the 1970’s… Yet our refining capacity has increased by 33% since 1985.
https://www.eia.gov/dnav/pet/hist/LeafHandler.ashx?n=pet&s=mgirius2&f=a
Really zhotel, the Germans are not building any more coal plant – their Dateln 4 plant is not quite finished and may never be – it is the last, ever.
I can’t find any US coal plants which are in the planning/approval stage and likely to proceed to construction.
The SA plants building are way behind schedule: they did announce soime more – but also build wind and solar.
I have no idea what’s happening in Brazil
[snip] Germany is building coal plants and they are burning coal, and you can’t stop them. So is China and India and Brazil and Indonesia and America and Chile and South Africa and everyone else on the planet, and you can’t stop them. Suck on that.
Looking at EIA information, neither new coal- nor gas-fired generation capacity will be required in the foreseeable future, even considering retirement of old plants. Economic decision making will determine the relative use of coal or gas.
A tantalizing question: Considering the sunk costs of coal and gas generation capacities, why build wildly costly renewables?
“Griff August 8, 2017 at 7:02 am
I have no idea what’s happening in Brazil”
You can add several more countries to that list.
A question.
I seem to remember that for oil drilling it takes time for permits to make it through the system. If I remember correctly, Obama to took credit for the increase in drilling from permits that had been approved under Bush.
The question. Is coal mining still suffering from Obama’s disapprovals?
The regulatory issues blocking the construction of new coal-fired plants started during the Bush years and expanded under Obama.
The primary Obama era regulatory impact blocking construction of NEW coal plants, thus impacting coal demand, is the EPA’s passage, in 2015, of he GHG related 111 (b) regulations. The 111 (b) regulations require any newly constructed coal plants emit no more than 1,400 lbs CO2/MWh. This regulation effectively mandates use Integrated coal gasification combined cycle (IGCC) with of carbon capture and storage (CCS) technology and makes the construction of new coal plants impossible, given the excessive cost of IGCC based coal generation coupled with CCS. The 111 (b) regulation the is a primary reason coal plants are not be constructed.
In effect, new coal plants are required to compete with new natural gas plants while having both hand tied behind their backs.
Existing coal units were impacted by the Obama era Cross-State Air Pollution Rule (CSAPR) , Mercury and Air Toxics Standards (MATS), and the 111 (d) related “Clean Power Plan”. With the primary impact being coal plant closer in the face of reduced electrical demand in the face of the Great Recession. Most of the surviving coal unit were base-load plant already slated to receive SO2 and NOx pollution control upgrades under phase II of the Bush era CAIR regulations.
Note also, despite what other’s may have said above, I don’t expect existing coal or gas generating units to expand generation capability. The cost of upgrading existing plants to meet a New Source Performance Standards is simply to great.
I’d add one more wild card to the assessment – efficiency.
It has not been well reported, but the overall efficiency of thermal power plants has surged over the last 20 years. From 55% to 65%. 10% doesn’t sound like much, but it translates into 10% fewer power plants to feed the same load. That means hundreds of power plants need to be shut down and never replaced. Supercritical generation promises another 10% gain, meaning hundreds more power plants will be mothballed. Probably within the next 10 years.
At the same time, LEDs have reduced significantly our demand. Figure another 5-10% less power plants required because the load is declining.
Finally, the big batteries renewable power people keep touting as the solution to making wind and solar dispatachable – if anything they will be used to ditch peaker plants altogether, resulting in further cost declines for traditional thermal plants, which will load up the batteries at night for discharge each day.
20-30% fewer power plant needed to cover the load. This is a huge cost savings, and explains everything we are seeing. In many cases the coal plant is being retired, and the former gas peaker plant pressed into service as a replacement.
Interesting comments, Tenn.
Please reference a thermal plant with 65% efficiency. Mitsubishi recently claimed 63%, but as far as I know the very highest for a plant actually on line is 62%. And these are all CCGT. Peaker plants with pure GT have much lower efficiencies.
I am dubious that LED’s and CFLs have caused any power use decline whatsoever. The whole system is build on a base load designed to cover a significant portion of the maximum power utilization which occurs at about 3pm in Summer, and probably about 10 am in Winter in most locations. When we get home at 6pm and turn on our LEDs power use is in significant decline as businesses and factories shut down. There is a surplus of potential power at the time the LEDs get turned on, and there always has been, so there is no net savings of power.
Note that businesses have always used fluorescent lighting (or at least the last 50 years I have been alive) which has a similar efficiency to LEDs (in fact the 32 and 40watt T-8 and T-10 tubes are more efficient) and so there is no net gain to be had during the day.
Last time I saw the figures, lighting was only about 5% of total energy usage. Much of that is already fluorescent and CF. Even if every light in the country was switched to LED and the drop in cost didn’t cause any increase in light usage, I don’t see LED’s reducing demand by much more than about 3%.
With the reduction in cooling costs you might get another 20 or 30% above that.
I don’t see LED reducing it at all because they basically only used in homes when power demand is low, and there is a surplus of potential energy, which basically just gets “thrown away” if not used. This is why some utilities offer discounts for power used after 7pm or so … Now if you look at the meter on your own house, yeah it would say you used less – but natural resource-wise, you did nothing.
Not quite. The fleet average for conventiinal coal generation in the US is 34%, The one USC coal, Turk in Arkansas, is 41%. The larger USC in China run 45%. CCGT is 61% per Siemens and GE.
“In the next four years, utilities have plans to close 40 coal units” Had plans, with the major shift in regulatory priorities across the board those plans will be changing, and with EPA’s foot removed from company’s neck so they can go forward with smoke stack scrubber upgrades, yea, coal is back.
At least 5 coal plant closures announced since Trump took office. No sign of any reprieves..
My, my, my! Where have we seen THIS before:
“[Gas]. . .has unmatched versatility: no single sector accounts for more than 35% of all gas usage – utilized in electricity, industry, heating, transportation, and more.”
And this:
“There’s at least 90,000 MW of new gas generation currently in development, . . . as gas is surging toward being 50% of all U.S. power capacity – given coal and nuclear retirements and the requirement to back up wind and solar.”
Almost exactly the words I used in my recent article on WUWT, from 8/5/2017.
That caused such an uproar. And garnered almost 600 comments. In 2 days.
Nice job, David Middleton! Welcome to the real world,,,
It’s refreshing to see these types of articles on WUWT.
The facts are very, very clear:
Half the nuclear capacity in the US will retire – without being replaced – in the next 10 years. Call that by 2030, and it will be a long decade.
Another huge chunk of the coal power plant capacity will retire right alongside the nuclear.
By 2030, that’s one-fourth of the entire US generating needs that must be replaced.
Figure the total at 1,300 million MWh per year must be replaced by 2030.
The plant closures will be sporadic, but on average, that’s 100 million MWh/year to add. That computes to 19 GW of new natural gas plants, each year.
(That 19 GW does not include the usual build for replacing old, end-of-life natural gas plants. The actual build rate will include additional 10 to 12 GW per year just for replacing old plants. Call it 30 GW total in new gas power plants built per year for the next decade, at least.)
Thanks Rog… I live and work in the “real world”… Petroleum geology in Texas… 😉
I know it sounds stupid but shouldn’t we want gas prices to go up enough to keep coal viable? If gas replaces all the coal plants over the next 20 years and then it gets expensive we won’t have the capability of replacing it with coal.
I’d rather pay slightly higher marginal rates now to keep both options in play rather than have to rely on just one supply.
The market will deliver your preference… unless the government tries to help too much.
Jerrry,
The coal is not going anywhere. Just like oil that is too expensive to pump out of the ground, we leave it in the ground until the day the price increases to make mining the coal profitable.
The second thing that occurs is more drilling and exploration for natural gas as the price increases. We just keep finding more, and more, and more and…..
If they shut down all the coal plants it will take a serious investment to get coal power working again. As fanciful as all your predictions of wind power taking over I’m pretty sure that we’ll still need a solid base load in twenty years. Why rely on gas prices only to secure our energy? Let gas prices rise to the level that coal can compete in the near term. I’m
The only thing wind power will take over is space in scrap yards.
Doesn’t that give you more expensive electricity, even with a full load on the coal plant?
Gee, time to buy solar and a powerwall…
Roger,
“Leaving in the ground until we need it” isn’t a viable strategy in places like the Gulf of Mexico or Alaska. In order to maintain infrastructure, you have to maintain production. And you have to maintain production in order to maintain the infrastructure.
The Trans Alaska Pipeline System requires a minimum flow of about 300,000 bbl/d in order to function. If production from the North Slope drops below that level for an extended period of time, TAPS would have to be shut in and Federal law requires that it be dismantled and removed. The removal of TAPS would permanently strand about 30 billion barrels of oil and 137 trillion cubic feet of natural gas under Alaska and its OCS (outer continental shelf).
Griff,
It would give you slightly more expensive electricity that worked at night and when the wind wasn’t blowing. Natural gas prices could double and there would be very little effect on electricity prices. Cheaper coal-fired generation would displace higher price gas generation.
Higher natural gas prices would eventually lead to a greater supply of natural gas, which would drive prices down again. At which point, natural gas utilization would go up and coal would go down.
Natural gas and coal will be trading off 60-70% of our electricity generation for many decades to come.
Even if nuclear power declines from its current 20% to 15%, the slack would mostly be picked up by gas, coal and, to a minor extent, wind. Solar will remain a boutique power source everywhere outside of California, until someone figures out how to put the solar panels in orbit.
Even in in-sunny Germany, solar delivers 25 to 33% of the electricity on a working day from May to September.
The price of solar is dropping and so is that of batteries.
30% of Queensland homes have solar panels now… the whole US south West will go solar at a higher percentage than that, with batteries.
I don’t see why US will be different from Europe in terms of renewables installed, even given the current political climate.
Jerrry, all it will take is building new coal fired power plants.
The cost of one plant does not depend on how many other plants are available. The cost of delivery is just the cost of transporting it on already existing rail lines.
Griff, it’s not 30% in Queensland. It’s 30% in Brisbane only.
Now imagine how much we could really save if we didn’t waste all that money on wind and solar.
and wind and solar will step right in there
Obama 2012: “We can’t just drill our way to lower gas prices!”
Yet, that is exactly what we did, for both gasoline and natural gas.
If coal is restored to a fair ‘playing field’, it can compete easily with NG
https://youtu.be/Z96ZiaQbwqw
..it’s a shame when you have to play with a brain like that
J Mac
August 7, 2017 at 4:29 pm
“If coal is restored to a fair ‘playing field’, it can compete easily with NG”
If there is a considerable gap to fill, by need of energy demand (for or by whatever reason), coal does not have to be considered in terms of competition with NG,, at least not in a “hostile” term.
It just have to be there available, and not blocked (“killed”) by silly legislation or silly policies….
put in simple terms.
cheers
https://youtu.be/ZBo6OWr3zwc
I can’t watch that Obama video without uttering streams of profanity and flipping the bird so often that I have actually sprained both middle fingers.. 😉
Very pointed video. I ran out of language to express my disgust.
Possibly the stupidest thing to be uttered by a U.S. president EVER!
Be careful in relying so heavily on nat gas. What is wrong with subsidizing clean coal as a possible balance should something happen with gas? I support testing the efficiency of solar and wind and also clean coal. Let the lowest cost lead the way but keep alternatives ready to go. Like coal…
All of this sounds like a competitive energy market. Shouldn’t some [trimmed] from Chicago be making these decisions
Who would have thought? All we had to do is hire Griffie and all our electric power supply problems would have been solved!
Right, I’m with you so far: a declining number of existing coal plants will get used (much) more due to the high price of natural gas.
Thus more coal mined and used.
But given there is no pipeline at all of new coal plant and given the time to get a new plant through planning and construction, there is not going to be any new coal plant built -so there is a limit to the expansion of coal, even given high gas prices. (I’d imagine planning may be difficult, these days).
And there is no reason to suppose that plant won’t still close (for reasons other than price, e.g sheer old age!)
But what you have not at all factored in is that the Us continues to build wind, which if available is going to be run instead of coal and gas, but mostly instead of coal… cutting the chance of coal running at capacity and especially of running at peak demand hours.
That’s what sank RWE and EON’s coal plant profits in Europe. Even without priority dispatch of reenwables it will damage coal capacity in the US.
Then there is flat demand for electricity, unless Teslas drive it up, and the impact of soalr, storage, etc.
If gas prices go up, so do electricity prices, een with more coal burned -which makes solar plus battery a very attractive proposition.
and look at how many corporations are pledging and buying in 100% renewable energy.
And then we could see a Democrat President elected within 4 years or (just over) a decade and that would kill any coal pipeline of investment stone dead…
Coal fired plants are being brought back on line and new ones are being built worldwide, but hey, keep lying, it is all you got.
and in some places they stopped building them and are switching them off… e.g. all UK coal plant must close by 2025, Germany is not building any more, etc
Actually I would expect wind to be run instead of gas which is much easier to regulate up and down than coal. And without subsidies – no more wind.
Well gas is easier to switch up and down around wind, so after a certain point coal just gets left out entirely…
UK is running virtually no coal over this summer.
Grift, the fact that you monkey-see, monkey-do-types concoct your own reality and then, through misinformation, bribery, and coercion, convince government agencies to act on it, is not an endorsement or recommendation, or even a good thing. It’s just a bunch of conformists running around in (and selling) the Emperor’s New Clothes.
Pretty much any country that pushes this sort of crap is hamstringing themselves, while coal and other fossil fuels will simply be picked up by others which will then give them the competitive edge.
That’s the thing about elitists – they think their status is God-given and eternal.
Wind and solar won’t be truly viable unless an affordable storage system is made for their output. They are too intermittent, even in sunny spots like LA. It is estimated, that wind required 80% constant backup, Solar 92% constant backup by conventional coal and Natural Gas plants.
If we go to 100% renewable as you want, we would have to change our society significantly. Move our workdays to the afternoon, because that is when wind is more likely to blow. Keep people home from work on regionally cloudy days, be willing to live without power, at home for periods of several hours a month. But in the end it is probably more economic and better for the environment to just use natural gas, than to try to create a contrived system to get renewable to work. Renewable’s cause environmental damage in proportion to their cost (just as cost is a good indicator of the environmental (resource) impact of everything we use) – so if it costs 10x as much to set up a renewable system than coal or gas, you are quite probably hurting the environment much more.
That’s exactly what the UN wants to do.
David, an aside from the main thesis of your article, the spike in gas generating capacity in 2002 and 2003 shown in your first two figures is likely explained by the spike in gas prices in 2000 and 2001 shown in your eighth figure (adapted from Art Berman). That 2000-2001 spike in gas prices would have motivated the large buildup of gas generating capacity in 2002 and 2003.
Here are the two figures together…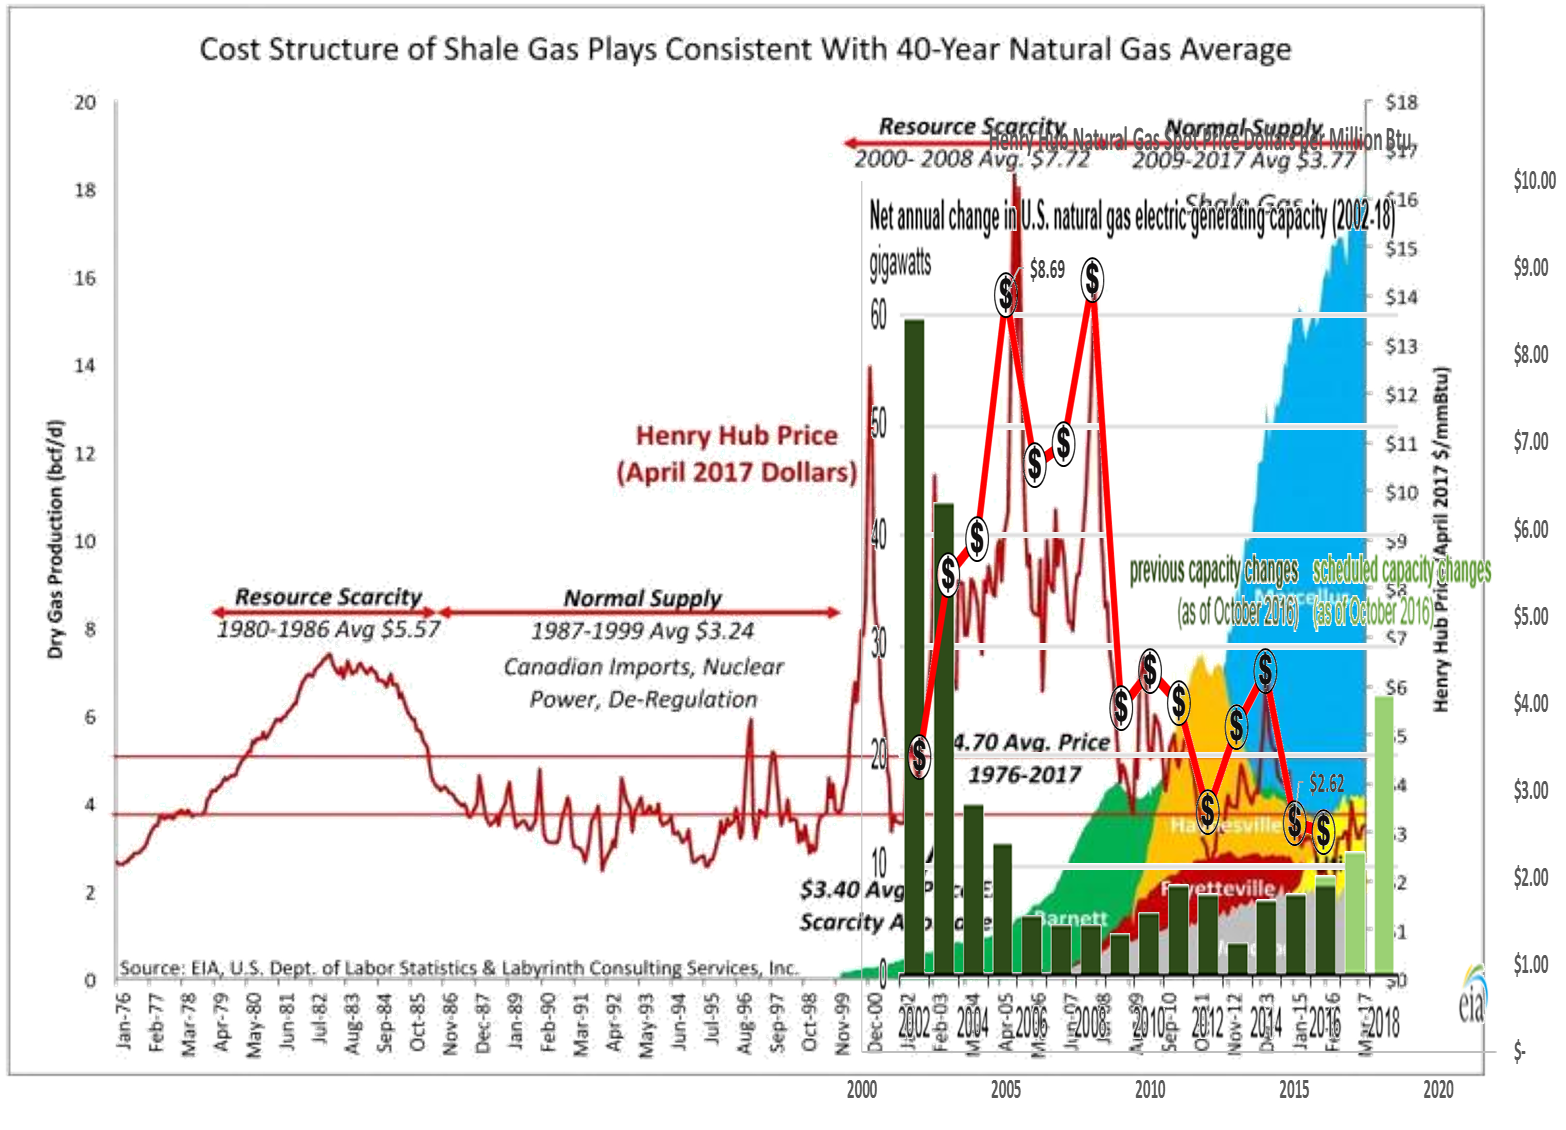
Gas prices were low through most of the 1990’s, spiked in 1999 to early 2000 and then dropped again until 2003. It looks like the big spike in gas plants occurred after the 1999-2000 spike and then construction tailed off as gas prices rose in the 2000’s.
I always find when someone puts “resource scarcity” on some chart, that it is dubious. Resources are always in balance with demand, and the price is the mechanism that does this.
So what is a scarcity? Lack of a resource at some price you would like it to be? Currently there is a scarcity of gasoline at 10 cents a gallon in the USA. Maybe I could make a chart about it.
Almost no coal plants are being built in the US. How can the existing ones last another 25 years? I think that maintenance cost would become exorbitant.
Why? These power plants were built to last more than 50 years. Like B-52’s, with proper maintenance, they can operate for 100 years.
The costs only become prohibitive when new regulation impose prohibitively expensive upgrades.
Well, it depends what those regulations require…
UK coal plants were subject to new rules under the LCPD directive, which involved pollutants like sulphur and NOT CO2. UK plant operators didn’t want to make those changes due to cost and shut up shop. In short, I’d say pollution regulations not to do with CO2 should be applied… and its up to the operators to decide if they bear costs, not govt to decide that it is too expensive for operators to stop pollution.
The U.S. approach to energy is to kill coal, natural gas and nuclear. It’s built into the markets (even at the level of manufacture, GE would prefer to build hundreds of thousands of generators that wear out every 20 years and abandon nuclear support), the politics and the politicized institutional authorities. The success of wind and solar requires the death of its competitors to the degree that we become entirely dependent on it and committed to yet another extremely expensive addition of back-up and battery storage that will vastly increase inefficiency and be environmentally worse than managing coal ash, carbon monoxide and sulfur emissions.
But why? Carbon dioxide? The word “dirty” used in biased manner?
A couple of comments from a coal guy.
Great analysis David. Gas plants that were designed as peakers are now running base load. They are not designed with the robustness of base loaded plants. They are wearing out very quickly. Lots of repairs and rebuilding going on.
Coal fired plants designed as base loaded are now operated as peakers. Not a good way to run a plant that has lots of heavy metal parts that expand and contract at different rates and other implications of running a big plant up and down. These plants are old and this makes the problem worse. This shortens the life of already old existing coal fired plants. It is also inefficient as hell to run the plants up and down like that.
Because we have not built any new coal plants in the US for years when the gas rise and the coal plants start operating as base load again they will be inefficient as compared to what they are replacing and as compared to new plants.
It would be nice if some sense of order and common sense could come to the energy policy in the country. Utility companies cannot make wise choices because the regulatory requirements change rapidly and something you spend money on today may be obsolete in a few years if a regulation changes. A good optimal mix of everything. We can only hope.
A factor in coal that is not fuel cost dependent. According to the FERC inventory (available on line) the average age of the US coal fleet is 42 years. The average age of retirment (economic and maintenance reasons) is 48 years. In terms of MW, about 1/3 of theninstalled base will be retired by 2026-2030. The question is how much of that will be replaced by CCGT, and how much by USC coal. There are 12 proposed USC coal plants, but all on hold waiting final legal disposition of CPP.
Are there 12 proposed plants?
A reference would be handy… I can’t find any.
Netl.doe.gov, Shuster, figures 2,3, and 6
“4. We’ve been lucky: we had the warmest winter ever in 2015-2016, and 2017 has brought the warmest February ever.”
Warmest winter evah!
Maybe it is not luck, but it is caused by something – what could it be?
Weather.
Selectively forgetting the 2011? Where on February 2, 201, Texas started having rolling blackouts because the weather was so cold the State couldn’t bring idled generating units on line due to burst water supply lines on coal plants and a lack of fuel for natural gas plants? And the contributing problem of lowered wind capacity due the sever cold weather and lack of wind in cold weather?
It was even worse in Dallas. They were exempting Jerry World from the rolling blackouts. It was Super Bowl week. While Baylor Hospital had to deal with rolling blackouts, just a few miles down the street, the Dallas Convention Center had 100% power for the NFL Experience!
The press isn’t going to stop their propaganda.
The short term EIA outlook for the U.S. follows…..
Electricity, coal, renewables
Total U.S. electricity generation from utility-scale power plants averaged 11,145 gigawatthours per day in 2016. Forecast U.S. generation declines by 1.2% in 2017, which mostly reflects expectations of milder temperatures in the third quarter of 2017 compared with the same period last year. Forecast generation grows by 1.8% in 2018 based largely on a forecast of colder temperatures during the first quarter 2018 compared with the same period in 2017 and on the expectation of a growing economy.
EIA expects the share of U.S. total utility-scale electricity generation from natural gas to fall from an average of 34% in 2016 to about 31% in 2017 as a result of higher natural gas prices, increased generation from renewables and coal, and lower electricity demand. Coal’s forecast generation share rises from 30% last year to almost 32% in 2017. The projected generation shares for natural gas and coal are nearly identical in 2018, averaging between 31% and 32%.
Coal exports for the first five months of 2017 were 37 million short tons (MMst), which was 60% higher than coal exports over the same period last year. EIA expects growth in coal exports to slow in the coming months, with exports for all of 2017 forecast at 70 MMst, 17% above the 2016 level. The increase in coal exports contributes to an expected 58 MMst (8%) increase in coal production in 2017. In 2018, coal production is forecast to increase by 10 MMst (1%).
Those who believe that natural gas prices will remain low forever know nothing about the industry or its history.
Scraft1 says “According to the Stat article the Trump administration has been very slow to replace Obama-era science and technology folks. This is not good news but seems typical of the dysfunctional White House. Trump obviously regards scientists as suspicious characters who threaten the know-nothingism of his administration.” Actually, no.
There seem to be several things going on, all reflecting opposition to Trump and his agenda. First, the Obama appointed Office of Ethics and Integrity, which vets all appointees, has been slow-walking his staff selections; next, the minority Democrats have united to block Trump appointments as long as possible. And finally, RINOs and NeverTrump Republicans are helping them by not adopting simple majority rules.
The only good news it all of these roadblocks are slowly opening. Next issue? Will Trump’s appointees FIRE Obama appointees wholesale, anywhere? I live to see it happen…. Before years end, maybe?
Wind and solar contribution to the US grid is currently negligible. Forecast our future well-being on those technologies at risk of total embarrassment or life in the dark.
While on a bicycle ride yesterday I saw a lot of coal being processed for transportation in North Vancouver, British Columbia, Canada:
https://twitter.com/Protonice/status/896346291617189888