Guest Post by Willis Eschenbach
I discussed acceleration in the tide gauge records in a previous post. However, people are also claiming that either there is acceleration in the satellite record or there will soon be acceleration. So I thought I’d take a look at the satellite-measured sea level question. First, here’s the satellite data:

Figure 1. Satellite-measured global sea level changes, 1993-2016
There are several interesting things about this. First, IF the data is correct the sea level goes up and down a lot. The monthly jump averages about three and a half millimetres, which is larger than the average annual increase.
Next, the rise is far from monotonic, with the Gaussian average (shown in red) actually decreasing about one month in six.
So … is sea level rise accelerating? Visually you’d have to say no, but that’s why we have math. However, in this case, the math agrees with the reading of the Mark 1 Eyeball. If we fit the data with increasing numbers of terms, the only one among them that is statistically significant is the first term (a linear equation). Here are the residuals of fits using from one to five terms:

Figure 2. Residuals from various fits to the sea level data
In addition, in the quadratic fit, the second term (acceleration) is NOT statistically significant (p-value=0.37). So it’s quite clear that there is no acceleration currently visible in the sea level data.
However, apparently this isn’t good enough for the alarmists. Over at the Colorado Sea Level site, I find the following quote from a recent paper entitled “Is the detection of accelerated sea level rise imminent?” by Fasullo et al.:
Global mean sea level rise estimated from satellite altimetry provides a strong constraint on climate variability and change and is expected to accelerate as the rates of both ocean warming and cryospheric mass loss increase over time.
In stark contrast to this expectation however, current altimeter products show the rate of sea level rise to have decreased from the first to second decades of the altimeter era.
Here, a combined analysis of altimeter data and specially designed climate model simulations shows the 1991 eruption of Mt Pinatubo to likely have masked the acceleration that would have otherwise occurred. This masking arose largely from a recovery in ocean heat content through the mid to late 1990 s subsequent to major heat content reductions in the years following the eruption.
A consequence of this finding is that barring another major volcanic eruption, a detectable acceleration is likely to emerge from the noise of internal climate variability in the coming decade. SOURCE
Hey, if the data doesn’t fit the theory, just change the data … what’s not to like?
First thing not to like is that the Pinatubo eruption was in mid-1991 … and the satellite record doesn’t even start until 1993. So they are talking about some kind of really long term reduction. This is much longer than the length of the known effects of the volcano on the atmosphere. These effects show clearly in the clear air solar energy absorption records from Mauna Loa, Hawaii.

Figure 3. Eruption effects on the clear air transmission in Mauna Loa, Hawaii. SOURCE
There were two large eruptions during that time period, El Chichón in Mexico and Pinatubo in the Philippines. However, the recovery times are short. As you can see, by 1994 the effects of the Pinatubo eruption are gone.
That brings us to the next thing that’s not to like. There is NO SIGN of the claimed “major heat content reduction in the years following the eruption”. Here is the data from the World Ocean Atlas of Levitus et al, showing the changes in heat content for the top 700 metres depth of the ocean.

Figure 4. Global ocean heat content anomaly for the top 0-700 m
Now, as you likely already noticed, there are no years on that graph, and for a reason. They’ve claimed a “major heat reduction” after the 1991 eruption of Pinatubo. And as shown in Figure 3, there’s also the equally large eruption of El Chichón a decade earlier which should have an equally major heat reduction.
So … where in Figure 4 do you think the two eruptions happened?
I ask because unless you know when the eruptions occurred, you can’t see anything anomalous in the record. For me, the best guess for Pinatubo would be the deep notch at the right, or maybe the big drop after the peak two-thirds of the way through the record.
And obviously, the scientists who want to change the data have the same problem—they can’t find the claimed signal in the observational record. Now, any sane scientist would stop there. But these are climate scientists, so instead they take a climate model, show that a modeled “major heat reduction” occurred in the modeled ocean heat content of their modeled earth after a modeled eruption … and then they use that imaginary outcome to bend the data to the desired shape. Acceleration ‘r’ us!
So … where are the eruptions actually located in Figure 4? Figure 5 shows that result.

Figure 5. Global ocean heat content anomaly for the top 0-700 m, with dates of eruptions
You can see why they had to throw out the data and use a climate model … there were two huge volcanoes during that time, but there’s no visible effect on the heat content of the ocean. Heat content went up a bit after El Chichon in 1982 and dropped slightly after Pinatubo. However, check the graph—heat content also dropped about three years before Pinatubo, in an almost identical manner. So there’s nothing significant there.
(I have demonstrated that this lack of response to eruptions is because when the tropics cool down, whether from eruptions or any other reason, the clouds and thunderstorms form later during the day or not at all. This lets in extra sunshine every day which counteracts the heat loss from the eruptions. However, that’s a subject for a different post or two, not this post …)
So I thought, well, maybe I’m looking at too broad a picture when I look at the global ocean. Perhaps there was a reduction that was localized in the area of the eruptions. Given their location we’d expect the largest effects to include changes in the North Pacific. This North Pacific effect is supported by the large eruption-driven reductions in clear-air transmission seen at Mauna Loa (Figure 3). However, the Pacific heat content is shown below.

Figure 6. North Pacific ocean heat content anomaly for the top 0-700 m, with dates of eruptions
Ooops … that shows even LESS of an effect from the eruptions than did the global data—in fact, it goes opposite to the authors’ expectations. In both cases, Pacific oceanic heat content went UP after the eruptions, during the times the authors’ claim there was a “major reduction” in heat content.
Conclusions, in no particular order:
First, it is mathematically clear that there is no sign of any significant acceleration of sea level rise in the satellite data.
Next, the claim that there was a “major heat content reduction” in the oceans after Pinatubo is strongly contradicted by both the global and North Pacific observational data. We see no such thing for either Pinatubo or for El Chichon.
Finally, the models do a lousy job modeling the effects of the volcanoes. I’ve written about this a number of times, see below. The reality is that the effects of the eruptions on surface temperatures are generally small, local, and short-lived.
====================
It’s a glorious Sunday now that the mist has burnt off. I’ll be in and out next week, my mad mate Gepetto the Puppet-Master has a gold mine in the Southern Sierras that he wants me to invest in. If it were anyone else I’d just laugh … but Gepetto is probably even crazier than I am, so I gotta pay attention to him.
Best to all,
w.
PS—As usual, I politely request that when you comment you QUOTE THE EXACT WORDS YOU ARE DISCUSSING, so we can all understand your subject.
PREVIOUS POSTS ON THE LACK OF EFFECTS FROM ERUPTIONS:
Overshoot and Undershoot 2010-11-29
Today I thought I’d discuss my research into what is put forward as one of the key pieces of evidence that GCMs (global climate models) are able to accurately reproduce the climate. This is the claim that the GCMs are able to reproduce the effects of volcanoes on the climate.…
Prediction is hard, especially of the future. 2010-12-29
[UPDATE]: I have added a discussion of the size of the model error at the end of this post. Over at Judith Curry’s climate blog, the NASA climate scientist Dr. Andrew Lacis has been providing some comments. He was asked: Please provide 5- 10 recent ‘proof points’ which you would…
Volcanic Disruptions 2012-03-16
The claim is often made that volcanoes support the theory that forcing rules temperature. The aerosols from the eruptions are injected into the stratosphere. This reflects additional sunlight, and cuts the amount of sunshine that strikes the surface. As a result of this reduction in forcing, the biggest volcanic eruptions…
Dronning Maud Meets the Little Ice Age 2012-04-13
I have to learn to keep my blood pressure down … this new paper, “Abrupt onset of the Little Ice Age triggered by volcanism and sustained by sea-ice/ocean feedbacks“, hereinafter M2012, has me shaking my head. It has gotten favorable reports in the scientific blogs … I don’t see it at…
Missing the Missing Summer 2012-04-15
Since I was a kid I’ve been reading stories about “The Year Without A Summer”. This was the summer of 1816, one year after the great eruption of the Tambora volcano in Indonesia. The Tambora eruption, in April of 1815, was so huge it could be heard from 2,600 km…
New Data, Old Claims About Volcanoes 2012-07-30
Richard Muller and the good folks over at the Berkeley Earth Surface Temperature (BEST) project have released their temperature analysis back to 1750, and are making their usual unsupportable claims. I don’t mean his risible statements that the temperature changes are due to CO2 because the curves look alike—that joke has…
BEST, Volcanoes and Climate Sensitivity 2012-08-13
I’ve argued in a variety of posts that the usual canonical estimate of climate sensitivity, which is 3°C of warming for a doubling of CO2, is an order of magnitude too large. Today, at the urging of Steven Mosher in a thread on Lucia Liljegren’s excellent blog “The Blackboard”, I’ve…
Volcanic Corroboration 2012-09-10
Back in 2010, I wrote a post called “Prediction is hard, especially of the future“. It turned out to be the first of a series of posts that I ended up writing on the inability of climate models to successfully replicate the effects of volcanoes. It was an investigation occasioned…
Volcanoes: Active, Inactive, and Retroactive 2013-05-22
Anthony put up a post titled “Why the new Otto et al climate sensitivity paper is important – it’s a sea change for some IPCC authors” The paper in question is “Energy budget constraints on climate response” (free registration required), supplementary online information (SOI) here, by Otto et alia, sixteen…
Stacked Volcanoes Falsify Models 2013-05-25
Well, this has been a circuitous journey. I started out to research volcanoes. First I got distracted by the question of model sensitivity, as I described in Model Climate Sensitivity Calculated Directly From Model Results. Then I was diverted by the question of smoothing of the Otto data, as I reported…
The Eruption Over the IPCC AR5 2013-09-22
In the leaked version of the upcoming United Nations Intergovernmental Panel on Climate Change (UN IPCC) Fifth Assessment Report (AR5) Chapter 1, we find the following claims regarding volcanoes. The forcing from stratospheric volcanic aerosols can have a large impact on the climate for some years after volcanic eruptions. Several…
Volcanoes Erupt Again 2014-02-24
I see that Susan Solomon and her climate police have rounded up the usual suspects, which in this case are volcanic eruptions, in their desperation to explain the so-called “pause” in global warming that’s stretching towards two decades now. Their problem is that for a long while the climate alarmists…
Eruptions and Ocean Heat Content 2014-04-06
I was out trolling for science the other day at the AGW Observer site. It’s a great place, they list lots and lots of science including the good, the bad, and the ugly, like for example all the references from the UN IPCC AR5. The beauty part is that the…
Volcanoes and Drought In Asia 2014-08-09
There’s a recent study in AGU Atmospheres entitled “Proxy evidence for China’s monsoon precipitation response to volcanic aerosols over the past seven centuries”, by Zhou et al, paywalled here. The study was highlighted by Anthony here. It makes the claim that volcanic eruptions cause droughts in China. Is this possible?…
Get Laki, Get Unlaki 2014-11-18
Well, we haven’t had a game of “Spot The Volcano” in a while, so I thought I’d take a look at what is likely the earliest volcanic eruption for which we have actual temperature records. This was the eruption of the Icelandic volcano Laki in June of 1783. It is claimed to…
Volcanoes Once Again, Again 2015-01-09
[also, see update at the end of the post] Anthony recently highlighted a couple of new papers claiming to explain the current plateau in global warming. This time, it’s volcanoes, but the claim this time is that it’s not the big volcanoes. It’s the small volcanoes. The studies both seem to…
Volcanic Legends Keep Erupting 2015-07-22
Once again, Anthony has highlighted a paper claiming that volcanoes have great power over the global temperature. Indeed, they go so far as to say: “From the reconstruction it can be seen that large eruptions, such as Mount Tambora in 1815, or clusters of eruptions, may …
Why Volcanoes Dont Matter Much 2015-07-29
The word “forcing” is what is called a “term of art” in climate science. A term of art means a word that is used in a special or unusual sense in a particular field of science or other activity. This unusual meaning for the word may or may not be …
If the wrong math–such as curve fitting–is used to [mis]define acceleration, then virtually any result that is desired can be obtained.
For those who wish to know how it’s done, apparently including Eschenbach:
https://tamino.wordpress.com/2017/07/25/sea-level-rise-has-accelerated/
https://tamino.wordpress.com/2017/07/25/a-few-other-stations/
https://tamino.wordpress.com/2017/07/27/understanding-sea-level-rise/
Cheers.
This “a few other stations mentioned Fremantle. Sinking land is the reason for Fremantles changes in sea level. Massive amounts of groundwater are pumped from the coastal plain near here. All other West Australian sites show sea levels falling since 2011 or so. I wont bother looking at the rest of Taminos links.
https://pindanpost.com/2017/04/13/falling-sea-levels/
Some links to Fremantle tidal changes here: https://pindanpost.com/2012/12/19/not-so-scary-any-more-sea-levels/ Tamino shows Fremantle sea level soaring.
Tom, firstly thanks for the links. Here is another link to a recent post from Jo Nova about Fremantle sea levels. Cheers
http://joannenova.com.au/2017/05/sea-level-rise-hysteria-can-be-cured-by-looking-at-tide-gauge-data/
I won’t look at ANY of Grant Forster rantings until he has the courage to post in a space where he does not control the discussion and delete anyone he does not agree with or who criticises him.
1. Willis’s article is on satellite data. Tamino’s is on tide gauge data. At least try to understand what’s being discussed.
2. Tamino tortures the original data where there is obviously no acceleration to get his ridiculous result. You really do need to stop paying homage to your high priest of obfuscation.
I have a question; probably a dumb one, but I still have it.
So Willis shows us a graph purported to be satellite sea height readings. Well If Willis says that’s what they are well I believe it, but would still listen to serious contrarians.
So my question is: Just where on earth did the satellite read the sea level ??
It seems to me that a satellite can put a “tide gauge” any place within its purview, and read that spot every time it gets near enough to see it. But I suspect that actually those light blue dots do not reflect the level at any fixed location, but are some sort of composite reading over the whole earth.
Now I once spent a whole month studying the height of the Pacific Ocean, by watching it go up and down underneath the ship I was on, so I know the sea level does go up and down from time to time in even a single location, and watching that spot over a long time would give one some idea of what is happening. But I don’t quite understand what you learn if you change the time, and also the place, and perhaps don’t even keep track of where you were when you read some particular height.
A fixed tide gauge has its own foibles with earthquakes and subsidences and whatever ails you. But at least the tide is still sloshing around pretty much the same point.
So it is not clear to me just how that shower of blue dots gets transmogrified into a nice smooth red curve.
Well I know it has something to do with statistics which is a swear word in my lexicon, but maybe I’m missing some absolute reference that is not apparent.
G
George:
A hearty Here Here!
Now I’d add that the rocket rise graph of near 45 degrees rise is all of 80 mm. That’s 8 cm, or about 3 inches over 20+years.
Now when I look at the ocean, I see 20 FOOT waves with 3 inch ripples on them, blowing spray, and another 15 feet of tides (just for starters…). My confidence in their ability to measure that globally with less than 3 inches of error, including in thunderstorms…, is 0.000000000000000001
Now add that there is an 1800 year lunar tidal cycle pulling the oceans into different lumps over different bottoms. To know if the water rose, or just got pulled into shallower areas more, you would need a less than an inch error in bottom topology globally. ALL of it… please show me those maps and their use in figuring ocesn rise… along with the tides model with one inch error over ALL the global waters…
I’m not going to hold my breath…
@EM & George. Yes. However we can look at a global spread of tide gauges with a fifty plus year record and accurate satellite data on land movement at the location of said tide gauges. What we find is a fairly consistent rate of SL rise of 1.49 mm per year and ZERO sign of acceleration.
Since we live near the tide gages, and do not live on satellites, I choose to go with the tide gauge record.
@David A:
Do remember those tide guages were originally installed for ships for deciding to enter port. Sediments accumulate, guages get repositioned, mud compresses, but most problematic, the original markings were in 1 foot increments. I have zero trust that 1.x cm can even be recorded in the historical record, so just what is being compared to the present precise readings?
Now we do know mountains wash into the seas so the oceans must rise just from that, but how much is that? What is the global rate of detritus deposition? So is the rise from warming, or sedimentation? How much of each? During the Indonesia quake, a section of seafloor rose 9 feet. How much does bottom topology change?
One anecdote: About 45 years ago I went to the docks at Alviso to see about parking my boat there. Some folks had liveabordes there. (In the 1930s & 40s they built Liberty Ships and delivered supplies by larger ships there). But now, since they stopped dredging, it has silted in and reeds grown. The port of Alviso has become marsh and some of it park land. Just what will the tide guage there report? And what would it mean? The port has become a park and boats no longer dock there… has that water become “sea level rise” elsewhere?
So yes, we live near the tide guages, but they show land taking over the seas as much as land lost to rising waters.
Ostia Antica and Sea Level
https://chiefio.wordpress.com/2010/12/06/ostia-antica-and-sea-level/
That bit or Roman Empire is not unique. Parts of Istanbul have an ancient harbor in the dirt below them… a castle in the UK which had a wall to the sea to prevent attack now has a wall ending well before reaching the sea.
Then places like Boston changed where was land:
http://www.iboston.org/rg/backbayImap.htm
Now what will their historic tide guage records be compared to?
Yet somehow folks think they can have 1 cm precision and accuracy?
The assumption that the land is static is false. The Port Of Alexandria is now below the Mediterranean. In Florida, I stood on coral in the keys that was 4 feet above the high water line. California rises from the sea and I’ve hunted shark teeth in the mountains. In israel, a historic port on the Red Sea is now inland no longer reaching the sea. Scotland rises and England settles, yet the chalk cliffs of Dover tower over the water.
To claim the ocean is rising is to claim all that is known to enough precision to “correct” for it. AND is known for enough time into the past of the historical record of the comparison.
I see no proof that it is known to cm precision.
@EM, as always you bring information. However if you look at daveburtons site ( I will look for a link later) you will find some excellent work. He describes the tide gauges used and selects only those global stations where we have consistent record of land rise or subsidence and subtracts or adds accordingly. He also selects stations with a long term 50 plus year record accounting for 18 year lunar cycles etc.
These accurate gauges in geo stationary locations provide reasonable evidence that there is no acceleration or alarming rate of SL rise. I will look for the link.
I do not see land sentiment affecting local sl, except of course if the land erosion is the shoreline. My point is, even if we do not know the net of sentiment in flow and ocean trench subduction and sea floor change, what matters is the sl change relative to where we live. The satellites can show 25 mm per year, but if tide gauges show 2 mm per year, the satellites mean little in practical terms.
Correction to above, ” reasonable evidence that there is NO acceleration or alarming rate of so rise.
If there were actual acceleration it would almost certainly show up not only in the satellite record but on the tidal gauges — all of them.
David A July 31, 2017 at 3:15 am
Fixed.
w.
Tide gauges record tides, example:

http://rtulip.net/yahoo_site_admin/assets/images/Sydney_Tides_2014.19831408_std.png
Tides reflect the wanderings of the moon in it’s orbit, north and south, near and far, pulling on the water AND the land:
Then add the effect of the wolfish wind driven storm surge and tell me 3 cm amounts to more than a hill of beans:
If you live near an active medium like the ocean you best plan accordingly. God gave us legs so we can get out of the way.
GES: the satellites have to try to guess the mean sea level by reflections coming from the trough of the swell and then pretend to do this with sub-millimetre accuracy.
They fiddle a few model parameters to get the results they want.
Long term acceleration is determined almost entirely by how you stitch together incompatible data from different satellites with different instruments which do not have a cross calibration period.
It’s a crock.
“I see no proof that it is known to cm precision.”
Those tidal gauges were not necessarily put up to measure the tidal range. Some of the longest records are from Sweden (back to c. 1750 as a matter of fact). Those gauges were put up (on Precambrian bedrock) by scientists to study “vattuminskningen”, the secular sinking of the relative sea-level in the (tide-less) Baltic and they have centimeter precision or better all the way back to the eighteenth century.
You can see the equipment used from the 1880’s to 1966 here:
https://www.smhi.se/kunskapsbanken/oceanografi/mareograf-1.13483
reallyfakeskeppie:
A tamino fan, eh?
Such a devoted disciple; further and further down the Kool-Aid rapture path you travel, trulyfakeskeppie.
From the vaunted psmsl.org website regarding their psmsl calculations:
• Models instead of actual trends.
• Don’t like a station’s data, flag it with a quality control flag.
Then there is that little catch phrase:
“Should not be treated as a research quality product suitable for publication, or for use in planning or policy making”
Their very own “Get out of jail free” cards…
• Knowledge of wrongdoing
• Willful misrepresentation
• Sure appears to be intent to defraud.
+1!
If one subscribes to the benighted notion that linear regression, or any polynomial least-squares curve-fitting, produces “actual trends,” no matter what the nature of the residuals obtained, then using models to actually account for the residuals may seem frivolous, or even suspicious. But once the recognition sets in that the data model tacitly assumed for such curve-fitting is “trend” plus identical, independently distributed white noise, then the wisdom of more advanced techniques employed by PSMSL becomes apparent.
Yes, PSMSL now uses a remarkably obscure approach for sea-level trend analysis. The old (circa 2015) trends (which they calculated by simple linear regression) are here, and the new results are here. (For some long-record sites, they’ve also improved their handling of differences between Mean Sea Level (MSL) and Mean Tide Level (MTL) measurements.)
Perhaps surprisingly, the results of their new trend calculations are very close to the sealevel.info linear regression trend calculations, at least in most cases. So I haven’t bothered to try to understand what they’re now doing, since it doesn’t seem to actually make much difference.
Reminds one of a magic show.
• Increase the complexity.
• Make the trick look impossibly hard.
• Distract viewers from the actual trickery and prestidigitation.
Especially worrisome when all of that complexity results in similar result.
Those inclined to believe that PSMSL uses “a remarkably obscure approach for sea-level trend analysis” no doubt will be totally disinterested in the challenges latent in such analysis. Those who recognize that the less one knows about sea-level, the simpler it seems, will find a professional view of the problem of relying upon regressional methods (see: http://onlinelibrary.wiley.com/doi/10.1002/2014JC010005/full) enlightening.
RS, you are confusing Ironic Science with Science. Ironic science are the scientific problems that are created when one or more deep fundamental assumptions are absolutely incorrect. Ironic science problems can never be solved.
There are genuine scientific paradoxes associated with current and past ocean level rise. In addition to the paradoxes which are caused by deep fundamental errors, there is the continual climategate game, where angry/motivated people enthusiastically manipulate data, hide real fundamental problem issues, and so on to push CAGW.
As has been known for more than a decade, the sum of the analyzed inputs that affect ocean level are less than what is required to justify even an ocean level rise of 1.2 mm/yr. The magical solution to this problem has a single paper by an IPCC lead author (what are the qualifications of IPCC lead authors?). The climategate study of course has paid for by European Research Council project Seachange blah, blah, blah, and so on.
This is a summary of the sum of the parts is not sufficient to justify the whole problem.
http://www.nature.com/nature/journal/v428/n6981/abs/nature02309.html
Ocean ‘Level’ from Satellite Data Before ‘Adjustments’

Ocean ‘Level’ from Satellite Data After ‘Adjustments’
http://scienceandpublicpolicy.org/images/stories/papers/reprint/sea_level_not_rising.pdf
William,
Quoted from the journal article, “They show that the oceans are freshening at a rate equivalent to the addition of 1.4mmyr21 of fresh water, approximately the value needed to bring the mass plus volume rate close to the gauge rate.” I wonder if this estimate is supported by a decline in salinity.
This really is a descent into dogma. Still interesting links showing a different approach from WE. Having lived by the sea for 60 years or so it is hard to reconcile what I see with what Tamino says I should be seeing.
No matter seaside property is still fetching a very satisfying premium on this edge of the Atlantic.
“In addition, in the quadratic fit, the second term (acceleration) is NOT statistically significant (p-value=0.37). So it’s quite clear that there is no acceleration currently visible in the sea level data.”
alpha, beta, power.
Common Steve, if you have somethink to say, don’t say it in Swahili. Drive-by comments make you look like a jerk. Say what you want to say clearly and completely…. or say nothing.
Look at the claim being made. Do you see a test supporting that. A test that acceleration = 0?
you understand alpha, you understand beta, and you understand the power of a test,
especially when the effect magnitude is potentially small.
You’d also want to look at residuals after a linear fit. did you ask to see that?
Nope.
So, I’m a skeptic. I’d say I suspend judgement on the question of whether there was acceleration or
not. I dont see any evidence that supports a claim of zero acceleration.
Steven, I foolishly assumed that since I’d showed that the p-value of the acceleration term was 0.37, my claim of no acceleration would be interpreted by anyone following the story as meaning no SIGNIFICANT acceleration.
However, as you point out that may not be clear to folks like yourself who are looking to find fault rather than to contribute to the conversation. Fair enough, there’s plenty like you out there.
So I’ve clarified it by adding the word “significant” to the first of my conclusions in the head post.
As to the residuals after a linear fit, why should he “ask to see that”? I showed it in Figure 2, not just for the linear fit, but for all the fits.
Regards,
w.
Steve M look to the geo stationary tide gauge record for evidence of zero acceleration.
Mosher: “So, I’m a skeptic. I’d say I suspend judgement on the question of whether there was acceleration or
not. I dont see any evidence that supports a claim of zero acceleration”.
Good to see that you share Willis position that there is no significant acceleration in the sea level data. By the way, I didn’t see anyone claiming that the acceleration is zero. I saw claims that there is no significant acceleration in the data, i.e. nothing can be assured, i.e. those claiming that it is accelerating do so without data supporting their assertion.
stevefitzpatrick,
If it ducks like a quack…
When I’m being pedantic, I say something like this: None of the high-quality, long-term, sea-level measurement records show significant, sustained acceleration in rate of sea-level rise. Nor has there been significant, sustained deceleration in rate of sea-level decline at those locations where sea-level is falling.
When I say, “sea-level rise hasn’t accelerated,” that’s what I mean.
alpha beta power..
Used car salesman terms, hey Mosh !!
Sorry I sell the very opposite of used cars. I “print” new money.
Steven, I would say that you are a great mystician. 🙂
“I “print” new money”
Yes, we know you are heavily into frood. working for BEST hgives you no alternative.
“Steven Mosher July 30, 2017 at 9:23 pm
Sorry I sell the very opposite of used cars. I “print” new money.”
Ah, secret is out. You devalue EVERYTHING, even the stuff you have. You do not create wealth, just debt. I hear ya!
So the oceans haven’t heated enough and volcanoes have to be invoked to explain that. On the other hand, the oceans have heated up hugely according to this.
What we have here is the gang that can’t shoot straight. They really can’t get their crap together. The alarmists really are arguing one thing and its opposite.
There’s a rule in courts of law that if you say a thing in one court, you can’t contradict it in another court. I wish that applied in real life.
Willis, I don’t trust satellite altimetry of the sea level. The sea is not flat; there are 10 meter waves with 1 meter waves over their surface with 10 cm waves over their surface and so on. The best you can do with such data is to extract some statistics. I doubt they can do it with a 1 mm precision.
In a noisy signal (sea level altimetry at a 1 mm precision) even extracting the mean is not simple. Getting the first derivative of the mean (the sea level rise) depends on many arbitrary assumptions.Getting the second derivative (the acceleration) is a pure sorcery.
Well CG and you missed out that there are rivers out there in those oceans and they meander quite freely since the river banks are not even thick enough to plough.
So wait a month and return with your satellite to the exact same GPS location, and you are no longer over the same body of water that you were over last month, and very likely the value of (apparent g) will not be the same either.
Anomalizing is pretty much a differentiation process, so it is a noise amplifier.
Climatists think it eliminates base line wander, but that is not amplified signal, it is simply random noise.
G
You’re not alone, CG. Dr. Willie Soon does a very excellent job of explaining the problems with satellite altimetry, starting at 17:37 in this lecture:
NASA data shows sea level drop:
http://www.americanthinker.com/blog/2017/07/media_blackout_on_nasa_report_that_sea_level_has_fallen_the_last_two_years.html
I love all the folks telling me I’m doing it wrong.
If so, DO IT RIGHT, post it up here, and explain what you’ve done. Yes, Mosh and the rest, I’m looking at you. You’re big with your mouths … how about you put your money where your mouths are?
If you think that there is acceleration there, SHOW YOUR WORK or shut up. I’m tired of whiners.
w.
sorry. it was showed. and, scarlet birdie, Tamino’s stuff was not just on tide gauge data
Tamino’s stuff is junk-science, if you Really have something show it yourself.
Why, when an expert has all ready done it? and saying Tamino is junk science means you have no idea. So you have just removed yourself from the conversation.
ReallySkeptical July 30, 2017 at 5:48 pm
That makes no sense. What is the “it” that was showed? What is a “scarlet birdie”? I’m sure you find yourself terribly clever, but out here in the real world, you’re making no sense.
Finally, Tamino is too cowardly to let me post at his site, so I haven’t been there for years. If he wants to tell me something he can grow a pair and come here and talk about it.
Or not …
w.
Well, except your posts last week trying to answer Tamino’s posts indicate you are not being completely honest. Whatever.
Opps, and you do realize the “scarlet birdie” is not to you? Sheesh.
Hmmm, but now that I think about it, why would you think “scarlet birdie” refers to you? Just kidding…
Tamino.. ROFLAMO..
You have to be joking. !
ReallySkeptical July 30, 2017 at 6:33 pm
You charming little man, you really should learn to read. I was TOLD about Tamino’s posts right there in the thread. I haven’t been to his site in years.
Perhaps you are willing to accuse people of bad actions because you go around “not being completely honest”, so you expect it in others. Or maybe that’s what your friends do. Me, I tell the truth as best I know it and my friends do as well.
So you can take your nasty insinuations in your left hand, and place them gently up your fundamental orifice all the way to the elbow, because they assuredly don’t apply to me.
Accusing me of lying without a scrap of evidence?!? You truly are a blessing to humanity. I can see why you use an alias. That way you can walk away from your ugly words and vile accusations and never, ever have to take responsibility for your underhanded methods. And the beauty part is, your family will never know just how pleasant and supportive you truly are.
That’s no way to go through life, son …
w.
Hey, I’m sure it doesn’t apply to me (and see no reason Willis would think it applies to him) But count me as one with no idea what you are trying to say with the phrase “scarlet birdie”. Might as well be ” wha wha whhaa wha whaaa”….
I see nothing “cute” in gibberish.
I googled it, and “scarlet birdie” seems to have something to do with Ohio State University:
http://www.buckeyedistrict.com/products/ffllc-007-01917/Top-of-the-World-Ohio-State-Buckeyes-Scarlet-Birdie-Adjustable-Visor.html?tl=c111s
Maybe RS thinks he’s talking to the ghost of Woody Hayes?
Evidently he’s referring/replying to scarletmacaw. Please don’t feed the trolls.
Let me add that in addition to my own poor self saying that there is no significant acceleration in the satellite record … that is also the finding of the Fasullo study. That’s why they’ve had to go to the models.
So if you can show that there actually IS significant acceleration, I’m sure Mr. Fasullo would love to hear about it.
In the meantime … I agree with Fasullo. Don’t like it? Then POST YOUR METHODS AND RESULTS as I have done.
Bigger bunch of back-biting cowards I’ve never seen …
w.
Count me in Willis as one totally flummoxed by “Scarlet Birdie” reference. I HAVE been accused of illiteracy, since I never read “The Wind in the Willows”, nor “The Mill on the Floss,” but I did see the movie of the latter.
I do see a similar pattern of obfuscating parameters related to what is observed or tracked and recorded re sea Level rise, to yours, but I suspect you spent much more time on the briny than I did.
My observations some where between Feb 16 1961 and March 13 1961 were grossly disturbed by a freak calamity, in that we got hit by a tidal wave going about 450 MPH, while stuck out in the Pacific. The captain tooted the horn just before the thing smashed into us; which gave everybody time to line the rails and watch the thing go by.
It was simply immense; a 150 nm long bulge of water that they said was a foot high.
Sure created havoc when it went up some Australian coastal rivers.
G
But of course you can see acceleration in the tide gauge data. The problem with the satelite record is that it started at mt Pinatubo, which was the real point of the Fasullo study.
Did you notice Tamino talked about accelerations and decelerations with acceleration recently? Did you notice that there were also large accelerations earlier in the 20th Century that had to be natural? (That Tamino did not bother mentioning) Did you notice that with the satellite data we are talking about the most recent 6 years of acceleration? I agree with most sea level researchers that say (along with Willis) that there is not a detectable sea level acceleration that we can be sure is real. And that we can’t say if it is natural or man-made. Much too soon to tell.
There is no acceleration in the tide gauge record unless you cherry pick a short segment and fail to include the time period after the last large El Nino.
But I can understand your problems with Tamino lately, him constantly pointing out your mistakes. I just think it’s funny he did it a week before your sorry post.
I have no problem with Tamino. My life doesn’t intersect with his. He’s a coward who won’t face me. That’s not my problem.
That’s his …
w.
But you still answer to him. Interesting.
No, he is pointing out that Tamino himself doesn’t comprehend.
AndyG55 you do some research before you say silly things, because you look like a fool.
“No, he is pointing out that Tamino himself doesn’t comprehend.”
Actually not. Last week, or in the last two weeks depending on your count, Eschenbach has answered Tamino’s posts twice. In both cases Eschenbach admitted his errors. Tamino comprehends more than a normal WhatsUp post posts.
Interesting response.
Such a demeaning condescending response reminds of the cowardly connolly or the especially false attp poo.
A trollop in all disguises and pretenses. False in one, false in all.
Sorry. you might check check the recent Eschenbach posts, in the last few weeks, for his demeaning condescending responses to Tamino before you condemn others of cowardly posts.
Hey, what the hel is a cowardly post anyway?
cuz actually, ATheoK, I think yours is.
Last word insult attempt?
More like, proof of the fake?
Do you have one substantial contributing comment here?
No!
Your posts are specious ad hominems, sneers, empty claims or lame attempts to drive up tamino site visits.
reallyfakeskeppie comments are:
• A complete waste of space.
• Pure time wasting.
• Typical trollop thread diversion attempts.
What is amazing, that in spite of all the detailed rebuttals to reallyfakeskeppie comments, you ignore science details, overlook every fact, yet harp about your false claims.
• Willful ignorance.
• Willful misrepresentation.
Another envious child internet trollop abusing the research and personal involvement time of others.
Willis…relax. Your work is far more informative and compelling than anything that has been put out by the warmests in a very long time. They got nothing! NOTHING! Every one of their projections has failed or is failing. Every link that is offered to support their claims is either a cherry pick, largely irrelevant, some form of model speculation, semantic quibbling, obfuscation or some combination of all of these things. There are no real world observations that support their calamity theory, and they know it.
So they will not engage in honest, scientific debate. They cannot. Yet, they are still under the spell of the misnamed ‘Precautionary Principle’, which gives them a sense of superiority, despite the fact that they are always wrong. You can’t fight this kind of irrational thought with rational arguments. In fact, you cannot fight it all. For your sake, it is best that you drop any expectation of a reasonable discussion with the likes of ReallySkeptical, or the other professional irritants. They are not hear for a rational discussion. They are hear to goad you, frustrate you, and make you run around in circles. They are here for ‘brownie points in a game that is played only in their heads; nothing else. You don’t have to play that game.
Everyone here can see the stark difference between your clear, informative, rational and powerful scientific arguments, and the childish, annoying and cryptic responses of those trying to bait you. You don’t need to defend yourself from this nonsense (we can see what is happening) and you certainly shouldn’t reduce your enjoyment of life one bit by anything they throw at you. It ain’t worth it.
I really appreciate your contributions. Thanks for all the hard work you do!
+100
You made a claim of zero acceleration. That’s the claim we want to audit.
personally I think the data is ambiguous.
Satellite data on sea levels stated being adjusted somewhere between 2000 and 2003.
After that, it became meaningless.
Tide gauges show absolutely no acceleration and have in fact been dropping over the last couple of years.
SM,
You said, “I look for that exact test! hmm.” You criticize Willis, but then provide nothing except your unsupported opinion. Demonstrate why you have good reason to believe “the data is [sic] ambiguous.”
Mosher “You made a claim of zero acceleration”
That’s a lie, or else quote the words. As far as I can tell Willis said no acceleration VISIBLE in the data.
How can data be ambiguous ?? If it IS data, then it is something real that actually happened.
Now trying to explain what it might or might not mean could be ambiguous; but the data itself is definitive.
Well that is until the adjustment police come along and tell us what really happened; that nobody actually recorded anywhere.
G
If you need statistics you should have done a better experiment.
Steven Mosher, its not ‘just’ statistical significance, its real world significance. No one in the real world spends billions of dollars or drives global policy on the basis of a p-value. The problem under study is what is important. CAGW’s main pillar has been sea-level rise caused by anthropogenic combustion of fossil fuels. For that causative mechanism to be responsible for a real problem requires us to be observing statistically significant rises in *all* measures of local sea-level (across the world). Willis has shown here there is no statistically significant rise in global mean sea-level. A statistically significant rise in local sea-levels observed across the world should translate to a statistically significant rise in a global average derived from those local observations. I see none in the data presented here.
As Willis pointed out, there is substantial natural variability and it doesn’t tie in with typically cited causes of that variability (of which other commentos have spoken off here). So we can safely conclude that human emissions of CO2 are not currently having a significant adverse effect on rising sea-levels (as postulated by CAGW). They could be offsetting a natural decline, but that would be a good thing given the costs of dredging harbours.
We also need to recall the 200m odd global rise that occurred completely without human influence.
It seems completely pointless worrying about a few mm per year.
The CAGW emperor has no clothes on this one and folk who insist that skeptics prove the data show no accelaration are forgetting that the onus of proof is on them to show we need their windmills and waterwheels.
‘I love all the folks telling me I’m doing it wrong.”
You will note that I never said you did it wrong. quote my words saying “willis did it wrong”
For this post i see no code and no data. how could know If you did ‘it’ wrong? I cant know.
Cant know if you did it ‘right’ or wrong. I do know that I havent seen convincing evidence
that acceleration = 0.
but “willis did it wrong” Not my words. never said that.
I just make an observation: I quoted your words claiming No acceleration.
I look for that exact test! hmm.
So. Pretty simple. I dont know you’ve done “it” wrong. never claimed you did “it” wrong. Not my words,
play by your own rules and you lose this one.
“In addition, in the quadratic fit, the second term (acceleration) is NOT statistically significant (p-value=0.37). So it’s quite clear that there is no acceleration currently visible in the sea level data.”
What is it that you don´t understand about that. He used a statistical method that can quantify correlations that you can not be easily seen, and tried to fit the data to an accelerating curve form. That method came out with a (p-value= 0.37). That clearly indicates that there is no statistically significant correlation between the data and an accelerating curve form.
“Cant know if you did it ‘right’ or wrong. I do know that I havent seen convincing evidence
that acceleration = 0.”
This is what Willis said:
«So it’s quite clear that there is no acceleration currently visible in the sea level data.»
«First, it is mathematically clear that there is no sign of any significant acceleration of sea level rise in the satellite data.»
Steven, you are an §#$%&
Steven, what would you say about the following citation practice widely used by climate scientists and IPCC then?:
“Model-based estimates of the eruption’s cooling effects suggest that the recovery of ocean heat content during the 1990’s may have increased sea level rise by as much as 0.5 mm yr−1 on average in the decade following the eruption 23,24,25,26,27.”
Is the detection of accelerated sea level rise imminent? J. T. Fasullo et. all
It is a common practice within governmentally funded climate science, to make a statement and refer to a handful of paywalled papers. This is what that kind of practice can lead to:
United Nations has taken part in scientific malpractice – and contributed to an overly negative perception on the state of the ocean!
+100 for all three comments, Science or Fiction.
The Mission Statement for the very latest altimetry satellite, Jason-3, : “The primary instrument on Jason-3 is a radar altimeter. The altimeter will measure sea-level variations over the global ocean with very high accuracy (as 1.3 inches or 3.3 centimeters, with a goal of achieving 1 inch or 2.5 centimeters). ”
The total measured change over the last 20 years (TWENTY YEARS) according to the sea level group at Colorado is 40 mm — forty millimeters or 4 centimeters — just barely more than the accuracy designed into Jason-3.
All that with no offered error bars or even confidence levels.
Jason-3 was launched into orbit January 17, 2016 10:42 a.m. PST (1:42 p.m. EST) . 18 months ago — so ALL data prior to that is based on the less precise, less accurate Jason-2 and earlier even less precise satellites. The Jason-2 program hoped for, but did not achieve and accuracy of 2.5 cm — The pre-launch data sheet calls for “”The accuracy should be of about 2.5 cm [1 inch] on the altimeter measurements. “,,,,Jason-3 still hopes to achieve that goal.
The twenty year “anomaly” is still, believe within rational measurement error bars for the Jason series of satellites — certainly must be within the confidence bars — the “ruler’s: accuracy is 2/3 of the twenty years anomaly.
Thanks for that detail. I always wonder how many different instrument types contribute to a “series”.
My understanding of the Colorado Topex/Jason SLR data was that for years, it was 2.2 mm/yr.
Then, it was 2.2 mm/yr. / 3.3 mm/yr. GIA corrected.
The, starting last year, it is 3.3 mm/yr. (No mention of GIA correction.)
Perhaps in a few years, at least in the popular press, the GIA issues will be long forgotten, and SLR will have increased from 2.2 to 3.3 mm/yr., a 50% increase. Good enough for teaching in public schools and scaring children. Or am I a bit too suspicious?
Nope, nailed it.
2.2mm/yr is an important and ‘correct’ value, for two independent reasons. 1. That is the value for the diff gps land motion corrected long record PSMSL tide gauges. 2. The value closes. See my SLR and closure guest post here previously for details.
Willis, could that be the Zenda Mine, in the southern Sierras?
Thanks, visitor. Could be … or could not be …
w.
Willis, if it’s Zenda, that’s really southern. Interesting occurrence, had some decent grades exposed in the stope. Visited it in the 1980’s. Would be interesting to know if someone is trying to make something out of it.
In the last 20 years sea level rise has risen at a similar rate to the 1925-1945 AMO warming period.
your record stops 20 years ago. Good one.
ReallySkeptical…you seem to me like a poker player on the Titanic, totally focused on bluffing your way into winning a few coins, as the icy water comes up around your ankles.
so you are so totally unskeptical that you don’t see a problem when one says to look a the last 20 years and they aren’t there?
wow.
but typical of most at this site, so at least you fit in.
It makes little difference:
The rate of sea rise bears no relationship to the rate of human GHG emissions:
http://cdiac.ornl.gov/images/global_fossil_carbon_emissions_google_chart.jpg
Chris Hanley
Perhaps more than is obvious from a glance at the chart.
The site from which your top chart originates states: “The rate of sea level rise is faster now than at any time in the past 2,000 years, and that rate has doubled in the past two decades.”
https://www.giss.nasa.gov/research/features/201508_risingseas/
There is no need for the most recent years to be presented. Yogi stated that the SLR from 1925 to 1945 is equal to the rate of rise in the last several decades. The current SLR is stated as being around 3mm/yr, and there was an equal rate of rise back in the past. That was the point of Yogi’s comment, which apparently went over your head. Looking at the graph which he shows it is easy to see that from around 1929 to 1950 the rate of SLR is certainly close to 3mm/yr.
Are readers starting to see why for years now I have been pushing for proper, formal analysis and display of errors? Geoff
Using Colorado’s interactive wizard:
Selecting random oceanic spots: Without artificial adjustments without smoothing.
Longitude: 184 Latitude: 60
http://sealevel.colorado.edu/cgi-bin/create_plot.cgi?q=content%2Finteractive-sea-level-time-series-wizard&dlat=60&dlon=184&fit=n&smooth=n&days=60
Longitude: 149 Latitude: 34 (Off Japan)
http://sealevel.colorado.edu/cgi-bin/create_plot.cgi?q=content%2Finteractive-sea-level-time-series-wizard&dlat=34&dlon=149&fit=n&smooth=n&days=60
Longitude: 345 Latitude: 37 (Outside of the Mediterranean, West of Gibraltor)
http://sealevel.colorado.edu/cgi-bin/create_plot.cgi?q=content%2Finteractive-sea-level-time-series-wizard&dlat=37&dlon=345&fit=n&smooth=n&days=60
Longitude: 292 Latitude: 32 (East of American Atlantic coast)
http://sealevel.colorado.edu/cgi-bin/create_plot.cgi?q=content%2Finteractive-sea-level-time-series-wizard&dlat=37&dlon=293&fit=n&smooth=n&days=60
Longitude: 325 Latitude: -29 (East of Brasil)
http://sealevel.colorado.edu/cgi-bin/create_plot.cgi?q=content%2Finteractive-sea-level-time-series-wizard&dlat=-29&dlon=325&fit=n&smooth=n&days=60
Longitude: 99 Latitude: -37 (Southwest of Australia)
http://sealevel.colorado.edu/cgi-bin/create_plot.cgi?q=content%2Finteractive-sea-level-time-series-wizard&dlat=-37&dlon=99&fit=n&smooth=n&days=60
Sea levels away from shorelines appear to be remarkably stable. Without all of that fakery involving landform rises.
Tends to happen when you have a rotating “solid” ball with a viscous fluid sloshing around on top of it.
Westward (relative) motion of water, must stop at Eastern coasts, and the KE (mv^2 /2) must be converted into PE of sea level rise (mgh). Sorting all that out is not trivial.
And the piled up water (relative to gravitational level) has to go somewhere else; like flow north and south as in gulf streams etc.
G
You only explain tides. Sea level measurements are not tidal effects.
Claiming to separate tidal forces thus leaving sea level increases is speculation without accurate daily, hourly, minute details which is sea level and which is tidal. “Not trivial” is understatement and diversionary.
Unfortunately, shoreline isostatic adjustments are used to obscure actual sea level rise; causing away from shore line sea level measurements to be more accurate.
Sloshing seas may back up on eastern facing coastlines, but those same seas do not demonstrate sea level increases away from shore lines.
If sea level is rising, that signal is global, not extremely localized or shore line dependent.
Increasing CO2 is increasing global plant 🌱 mass and thus increasing the amount of water 💦 tied up in the vegome. This will act to reduce sea level slightly.
The satellite data must be adjusted for orbital decay. Why aren’t they using the extensive worldwide tide gauge data as a measuring stick to set the orbital decay adjustment properly?
A height measurement made from space is being adjusted for orbital height, to then find a DIFFERENT sea level height than tide gauges around the globe tell us. Truly baffling.
It seems to me that the ONLY reason to go to SPACE to measure sea level is the opportunity to adjust the measurement. What other possible reason is there to ignore the very high quality land based sea level measurements going back ~100 years or more all around the globe?
For global “temperature” data the warmists prefer the surface based data, over satellite, since it gives them the results that they prefer.
For sea level rise, however, the same warmists prefer the satellite data, over surface, since it gives them the results that they prefer.
For the first, yes – satellite orbit decay is really a problem! Worse than we thought!
But for the second, no – satellite decay is really not a problem! Better than we thought!
The irony of that is almost beyond comprehension. Somehow the satellites can not accurately record temps, but they are mysteriously able to measure the surface of the constantly changing ocean surface to within a fraction of a millimeter.
“It seems to me that the ONLY reason to go to SPACE to measure sea level is the opportunity” to spend gobs of money on really cool toys and toy makers.-sarc
Willis, an excellent analysis, as usual. Many thanks.
I noted that they didn’t just use models. They actually used “specially designed climate model simulations”. You couldn’t make it up!
A poster gave the link to this NASA site that gives the sea level data:
https://climate.nasa.gov/vital-signs/sea-level/
It’s actually quite interesting. Whether the pause at the end is significant or not, time will tell. But the one thing it does not show is acceleration.
It shows the satellite and tidal gauge data. The satellite rate is given as 3.4 mm/yr. But the tidal gauge graph is truncated at 2000, which is ridiculous, and just a little bit suspicious. It’s as if they didn’t want to show much overlap of the two data sources. The reason is obvious: I calculate the rate from the lower graph at just 1.5 mm/yr.
It’s quite extraordinary: NASA shows us the sea level rise from two different sources – but they are out by more than a factor of 2!
Chris
I always find my self asking the same question when facing sea level rise data. With respect to what are the measurements done. One may try to argue that since it is a relative measure the reference point doesn’t matter, but it does. One cannot measure the level difference between to moments directly you always measure level at a location in a specific moment with some reference frame as origin; then you compute the difference between these measurements at different times to get the level rise.
This can either be the ocean rising or the reference point falling. This problem is not eliminated by satellite measurements, since in this case the reference is the satellite position which is computed from ground stations by triangulation. These stations will be moving with the continents where they are placed, either up or down, by magnitudes typically comparable with the thing you ar trying to measure.
Its just like with the temperature record. All this is magically solved by averaging everything together.
Sorry, I know this is a fairly serious discussion but I lost it on “Colorado Sea Level Site”…
“a recent paper entitled “Is the detection of accelerated sea level rise imminent?” by Fasullo et al.:”
Funny coincidence, Fasullo is Italian and as an adjective it means: fake, fabricated.
Folks shouldn’t worry about “really skeptical”, he isn’t, he’s just the repackaged “Pippen Kool” who posted here under that other fake name. He’s a hapless demo-operative from the Detroit area.
He’s mostly entertainment value, no skills of his own.
Thanks for the clarification, Anthony!
Typing style is obvious now you mention it.
+10
Thank you Willis – your analysis and article were well worth the wait. Appreciated.
Emsworth, Havant, Portsmouth, Gosport, Exeter in the UK…ALL low lying coastal places for HUNDREDS of years, esp Portsmouth, Gosport and Exeter ALL being coastal PORTS and have been for at least 300 years show NO significant sea level change. Sure, a few data points does not make a whole case for warming, but one tree, YAD061, did, thanks to Mann.
Not geologically stable regions.
“stevefitzpatrick July 31, 2017 at 5:45 am
Not geologically stable regions.”
On geological time scales or human. Geological, no. Human, insignificant…for hundreds of years. Even thousands.
Patrick,
Glacial rebound is significant everywhere in the British Isles, on the order of 1mm rise of the land per year (or more). See for example: http://people.rses.anu.edu.au/lambeck_k/pdf/152.pdf
Tide gauges in this region do not accurately describe the change in global sea level.
Willis,
The U of Colorado group has not updated their data since Sept 2016, but NASA has satellite data through March 2017, showing declining sea level since the El Nino peak. So I suspect the p-value for acceleration with the whole data set is even larger than 0.37. There really is no evidence of significant acceleration. No evidence of significant acceleration = no evidence of need for significant alarm over sea level rise. It is the right hand side of that equality that frustrates the green rabble, and leads to some very dubious papers being published.
After I saw the NASA graph I wanted to see the CU update even more.
There are many comments above that should give pause to anyone who buys into the acceleration meme. The data have become so tortured to get the desired trends, that investigations into violations of the Geneva Convention seem to be in order.
“It’s a glorious Sunday now that the mist has burnt off. I’ll be in and out next week, my mad mate Gepetto the Puppet-Master has a gold mine in the Southern Sierras that he wants me to invest in.”
For some reason, I can’t recall why, I looked into Gold and Silver in the Sierra Nevada once. There’s lots of it of course. But almost all (that has been found) is in the Central and Northern parts of the range. But I think there were some productive mines on the Kern River area and maybe around Tehachapi. More mines further East in the El Paso Mtns and other parts of the Basin and Range of course. But somewhat different geology there. Gets a bit warm in those parts of the world in August with some truly terrifying — get me the hell out of here — thunderstorms at times.
Have fun.
Mining in those areas is best done in the winter or in the spring. I just bought a metal detector and have been out practicing here in Northern California. Besides finding a few square nails and some coins, I have also acquired a bunch of foxtail stickers and a slight case of poison oak. Then there is always the possibility of finding a Pacific Coast rattlesnake. I will wait for the arrival of Fall weather before attempting to get serious with the metal detector.
Wonderful job, Willis!
Broken Altimetry? 225 Tide Gauges Show Sea Level Rising Only 1.48 mm Per Year …Less Than Half The Satellite-Claimed Rate!
http://notrickszone.com/2016/04/11/broken-altimetry-225-tide-gauges-show-sea-level-rising-only-1-48-mm-per-year-less-than-half-the-satellite-claimed-rate/#sthash.1OuaLksl.dpbs
I’m waiting for the sea to rise
RC, Tamino is playing the climategate game which is lose-lose-lose.
There are real scientific breakthroughs, of the jump up and down wondrous kind, associated with what causes the cyclic super large, super-fast climate change events.
It is an observational fact which there must be a physical explanation for, that there is cyclic warming, in all cases followed by cyclic cooling, in the paleo record both poles. The confirmation that the warming and cooling is both poles and has the same periodicity is recent.
It is a fact that there are cosmogenic isotopes changes that are concurrent with the cyclic climate change (large, medium, and super large, same periodicity SML).
http://wattsupwiththat.files.wordpress.com/2012/09/davis-and-taylor-wuwt-submission.pdf
Oh well, back to the climategate game.
http://www.21stcenturysciencetech.com/Articles_2011/Winter-2010/Morner.pdf
Nice one, Willis. It keeps the salient points short and obvious.
Just a detail:
The series from the university of Boulder Colorado, which the article seems to be based on, ends in mid-2016, while the NASA with Jason-3 data includes the first quarter of 2017. The last data confirms the lack of acceleration.
ftp://podaac.jpl.nasa.gov/allData/merged_alt/L2/TP_J1_OSTM/global_mean_sea_level/GMSL_TPJAOS_V4.jpg
/Jan
All I can see from that is that the suspicious looking continuity between JASON 1 & 2 looks even worse. Interestingly, this series appears to be pre-massaged in some way. The Colorado stuff had to be interpolated to do anything reasonable with it using straightforward time derivatives (rather than the abstract curve fitting/confidence level hyperbollox so beloved by modern day snake charmers).
Still no evidence of statistically significant acceleration by several leagues under the sea. Currently running at -0.087 mm/annum/annum ±4.750. Next month it’ll be different but equally meaningless of course.
Aother great piece Willis. Thank you
It’s the orbit, the satellite orbit.
All satellite orbits are not equal!
Rarely was a satellite orbit managed in the early-space era, 1958 to current. Today NASA Aqua and Terra are managed to be sun-synchronous (for MODIS in particular, 10:30 / 22:30 Terra equator crossing times, and 13:30 / 01:30 Aqua equator crossing times.
Whether managed or unmanaged, example the DMSP satellites, there is a problem that does depend on the real physical thing that is being attempted to measure, periodicity. This can be two-way: i.e. periodicity of the physical thing that is being attempted to measure and the periodicity of the “sampling” instrument.
The Nyquist-Shannon Theorem.
The two-way problem in satellite based “attempts” and measurement lead to Diunral Cycle Alisasing.
Ah ha!
Lots of refs, check this one: http://www.fiduceo.eu/content/orbit-drift-and-diurnal-cycle-aliasing.
Just the beginning!
That’s a valid point, but I think that the three platforms used with the Poseidon Radar Altimeters (Topex and Jason 1/2) were/are all actively managed with the intent of repeating scans of the same ‘point’ (actually a small region) at the same “time” once every ten days. I imagine that the management is less than perfect, but “small” in-track or cross-track errors probably aren’t going to affect the measurements much. Now radial distance errors … Those matter.
As well as making points succinctly, this post emphasizes another truism of looking at scientific data: When something looks like it is not statistically significant, then that is usually the correct assessment, even for an eye that has not been extensively schooled in looking at this type of data. (As a grad student I became adept at spotting when a single-exponential decay was inferior to a double-exponential fit.)
William M. Briggs also said, “just look at the data”, when telling people to not smooth a time-series, under pain of death. http://wmbriggs.com/post/195/
The human eye is actually very good at spotting certain things. Climate scientists, and people faking a drug-trial in front of potential investors, will often reach for their statistics first. The climate charlatans generally also understand much this quite well by now. That is why the the hockey-stick was brought into existence.
+10
Agreed. For instance, here’s 111 years of continuous, high-quality sea-level measurements in the mid-Pacific, juxtaposed with CO2:
http://sealevel.info/1612340_Honolulu_vs_CO2_annot1.png
http://www.sealevel.info/MSL_graph.php?id=Honolulu
That record is 4.5 times as long as the combined satellite altimetry record, and 10x as long as the longest single-instrument satellite altimetry measurement record
Usefully, it spans four decades before the post-WWII surge in CO2 emissions, as well as seven decades of sharply rising CO2 level, so you can compare the trend with barely rising CO2 to the trend with sharply rising CO2.
You shouldn’t need to use SPSS to tell that there’s no significant acceleration in sea-level rise. Sea-level is not rising significantly faster with CO2 at 0.04% of the atmosphere than it was with CO2 at 0.03% of the atmosphere.
Thelonious Monk-“Between the Devil and the Deep Blue Sea” from “Straight, No Chaser”
A less stress inducing coverage of humanity’s relationship to our oceanic environs.
In re; https://tamino.wordpress.com/2017/07/25/a-few-other-stations/
http://www.jcronline.org/doi/abs/10.2112/JCOASTRES-D-10-00141.1
Is There Evidence Yet of Acceleration in Mean Sea Level Rise around Mainland Australia?
P. J. Watson
Abstract
As an island nation with some 85% of the population residing within 50 km of the coast, Australia faces significant threats into the future from sea level rise. Further, with over 710,000 addresses within 3 km of the coast and below 6-m elevation, the implication of a projected global rise in mean sea level of up to 100 cm over the 21st century will have profound economic, social, environmental, and planning consequences. In this context, it is becoming increasingly important to monitor trends emerging from local (regional) records to augment global average measurements and future projections. The Australasian region has four very long, continuous tide gauge records, at Fremantle (1897), Auckland (1903), Fort Denison (1914), and Newcastle (1925), which are invaluable for considering whether there is evidence that the rise in mean sea level is accelerating over the longer term at these locations in line with various global average sea level time-series reconstructions. These long records have been converted to relative 20-year moving average water level time series and fitted to second-order polynomial functions to consider trends of acceleration in mean sea level over time. The analysis reveals a consistent trend of weak deceleration at each of these gauge sites throughout Australasia over the period from 1940 to 2000. Short period trends of acceleration in mean sea level after 1990 are evident at each site, although these are not abnormal or higher than other short-term rates measured throughout the historical record.
The folks at JPL at Caltech have noticed the problems in satellite measurements of sea level rise, as well was the incommensurate differences between Jason, et al and traditional tide-gauge measurement. Their solution? LET’S LAUNCH ANOTHER SATELLITE INTO GEOSTATIONARY ORBIT IN ORDER TO CALIBRATE THESE DIFFERENCE DATA SOURCES!
(Anyone got a LINK to post here–please add! Mine is inaccessible at the moment. Oh, here’s an old WUWT by Anthony https://wattsupwiththat.com/2012/10/30/finally-jpl-intends-to-get-a-grasp-on-accurate-sea-level-and-ice-measurements/)
Brilliant! you say? But monies to do it are, apparently, still lacking. Thus, a legitimate step to quell controversies like this one goes on and on, and the GCM modelling hysterics keep spinning their billion dollar super-computers instead getting messes that need grounding in sound data, good processing, evaluation and remediation.
Orson wrote, “Anyone got a LINK to post here–please add!”
That one and six other links here:
http://www.sealevel.info/resources.html#grasp
Willis wrote, “There were two large eruptions during that time period, El Chichón in Mexico and Pinatubo in the Philippines. However, the recovery times are short. As you can see, by 1994 the effects of the Pinatubo eruption are gone.”
Agreed. You can also see it in atmospheric CO2 levels, which slow their assent slightly after a major volcano, perhaps because particulates ejected by the eruption cool the planet, which temporarily increases CO2 absorption by the oceans (because gases like CO2 dissolve more readily in cool water than in warmer water), and/or perhaps because iron and other minerals in the volcanic ash fertilized the ocean and thereby increased CO2 uptake by ocean biota (Sarmiento, 1993).
After Pinatubo the dip lasted only 2 or 2½ years, and after El Chichón it was even shorter:
http://sealevel.info/co2_data_mlo_pinatubo_and_el_chichon.png
It’s utterly remarkable that no one has pointed out that the above description of smoothed monthly sea level is wholly inconsistent with the answer given to the question of sea-level acceleration:
Apparently there’s no recognition of the mathematical definition of acceleration as the second time-derivative of displacement. By that rigorous criterion, it’s impossible to go from decreasing values to increasing ones without acceleration. And the vaunted “Mark 1 Eyeball” must have been issued by the Braille Institute, since it’s apparent from a glance at Figure 1 that global sea level has been increasing from 2011 at steeper than usual rates in the satellite record.
Sadly, instead of computing discrete estimates of the rate of change and its time derivate–which would show the accelerations and decelerations clearly–the inappropriate criterion of statistical significance of quadratic fit over time was adopted. Since the second derivative of t^2 is a constant, the property of the data that is being tested thereby is the presence of geophysically unrealistic CONSTANT acceleration. That’s the unfortunate consequence of blind misuse of regressional curve-fitting as a time-series analysis tool.
1sky1 wrote, “Since the second derivative of t^2 is a constant, the property of the data that is being tested thereby is the presence of geophysically unrealistic CONSTANT acceleration. That’s the unfortunate consequence of blind misuse of regressional curve-fitting as a time-series analysis tool.”
No, 1sky1, you are badly confused. Regression analysis does not assume anything is “constant.” Rather, it finds an average.
Linear regression finds the average linear trend over the analyzed period. If a “constant” trend was assumed, you wouldn’t need regression analysis: you’d just pick any two points and calculate the slope.
Likewise, quadratic regression does not assume a constant acceleration, it finds the average acceleration.
The ocean is full of water, and it “sloshes.” It sloshes with many periods: minute-to-minute (waves), once & twice per day (tides), monthly (neap vs. spring), seasonally, and with longer periods of up to at least about sixty years (which is why it is well-established in the literature that at least 50-60 years of tide gauge measurements are needed to establish a robust trend). From the perspective of someone doing coastal planning, those sloshes up and down don’t matter.
That’s why regression, which finds averages (rate, acceleration, etc.) is perfectly appropriate: because those averages are what matters, for predictions.
When I looked briefly at PSMSL’s new approach, I noticed that the trends they calculated were very similar to the trends which they previously calculated by simple linear regression, and also to the trends that NOAA calculates, and the trends that my sealevel dot info site calculates (all three by simple regression).
For instance, PSMSL tide gauge #1 is the two-century-long measurement record (with a few gaps) at Brest, France. Here’s a graph from my site, with linear (red) and quadratic (green) regressions plotted:
http://sealevel.info/MSL_graph1.php?id=Brest&boxcar=1&boxwidth=3&quadratic=1&lin_ci=0&colors=5&co2=0
http://sealevel.info/190-091_Brest_France_MeanSeaLevelTrends_since1807_linear_and_quadratic_fits_red_green_no_CO2.png
As you can see, linear regression for the entire two-century-long measurement record shows an average rate of only 1.0 mm/year of sea-level rise, with small but noticeable average acceleration of 0.01275 ±0.00270 mm/yr².
PSMSL’s old calculated trend for Brest, for 1807 to 2013, was 1.05 ±0.10 mm/year (calculated by linear regression).
PSMSL’s new calculated trend for Brest, for 1807 to 2015, is 0.97 ±0.11 mm/year — nearly identical.
Obviously the method change doesn’t have much effect.
There is a problem with those trend calculations for Brest, but PSMSL’s new method does not solve it. The problem is that global sea-level rise accelerated a little in the late 19th century and very early 20th century. That acceleration ceased about ninety years ago, so it doesn’t affect trend calculations for most locations. But for very long measurement records, like Brest, the 19th century acceleration makes a substantial difference, and causes the reported average trend to be a little bit too low, for coastal planning.
1.0 mm/year is not the right rate to use for the sea-level trend at Brest, for coastal planning. For more than a century, the rate of sea-level rise at Brest has been about 50% greater than that.
You can see that if you start the regressions at 1900. As you can see, that the average rate of sea-level rise at Brest is 1.5 mm/year (which is very typical), with no significant acceleration (which is also very typical):
http://sealevel.info/MSL_graph1.php?id=Brest&boxcar=1&boxwidth=3&quadratic=1&lin_ci=0&colors=5&co2=0&c_date=1900/1-2019/12
http://sealevel.info/190-091_Brest_France_MeanSeaLevelTrends_since1900_linear_and_quadratic_fits_red_green_no_CO2.png
1sky1 August 2, 2017 at 4:50 pm
1sky1, it appears that you missed my comment from five days ago, wherein I said:
Willis Eschenbach July 30, 2017 at 5:40 pm
Regards,
w.
CU Sea Level Data ends a year ago, on Jul 20 2016. On the other hand AVISO Data extends to Apr 24 2017, and shows there is not only no recent acceleration, but not even sea level rise in the last one and a half year.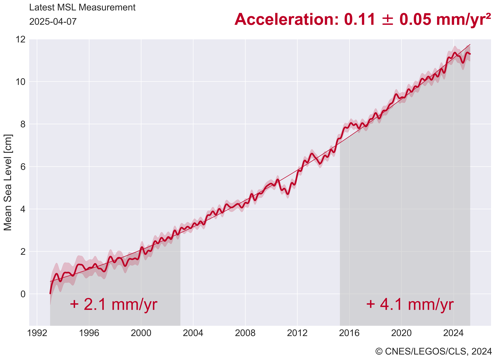
The notion that anyone who is making as basic a mathematical point as acceleration being defined by the second time-derivate of displacement (i.e., by the time derivative of velocity) needs to SHOW THEIR WORK betrays a stupendous lack of analytic comprehension (see: https://en.wikipedia.org/wiki/Acceleration).
For those interested in demonstrating to themselves that there was considerable acceleration evident in satellite data after 2011, I would recommend simply running the discrete ROC estimator [f(n+1) – f(n-1)] / 2 through the data recursively, always centering the result at t = n. That sporadic acceleration, along with the current deceleration, will show up unmistakably upon applying any reasonable smoothing, before or after using the estimator.
1sky1, it appears that you still have missed my comment from five days ago, wherein I said:
Regards,
w.
Fix your own fundamental mistakes, instead of imposing upon others.
To be more precise, successive (cascade) application of the estimator is here loosely termed “recursively.”