Reposted from Roy Spencer’s Blog
July 21st, 2017 by Roy W. Spencer, Ph. D.
 If I had not looked past the headline of the press report on a new study, I would have just filed it under “It’s worse than we thought”. A new study in Nature reported on July 17 carried the following headlines:
“Satellite snafu masked true sea-level rise for decades”
“Revised tallies confirm that the rate of sea-level rise is accelerating as the Earth warms and ice sheets thaw.”
When I read that, I (like everyone else) assumed that corrections to the satellite sea level data since 1993 have now led to a revised trend toward faster (not slower) sea level rise. Right?
Wrong.
During the satellite era (since 1993), the trend in sea level rise was revised downward, by almost 10%, from 3.28 mm/year to about 3.0 mm/year. (For those concerned about Miami going underwater, these numbers equate to a little more than one inch every 10 years). This result was published back in April in Geophysical Research Letters, and the new Nature study looks at the wiggles in the revised data since 1993 and makes ominous pronouncements about sea level rise “acceleration”.
I’m calling “fake science news” on the Nature reporter who covered the story. The headline was technically correct…but misleading. (I can also make up technically correct headlines: “Scientists Agree: Sea Levels are Rising, We are All Going to Die”)
The researchers in April made a major adjustment to the first 1/4 of the satellite record, bringing those early sea levels up. This results in adding curvature to the upward trend (an acceleration) by flattening out the early part of the curve. This new signature of “acceleration” was what made the news in the new Nature study, even though the long term trend went down.
Should this New “Acceleration” be the News?
In a word, no.
Short-term undulations in the sea level rise curve should not be used as a predictive curve for the future. They are affected by a wide variety of natural phenomena. For example, ice loss from Greenland (which was large in 2011-12) has recently reversed itself with huge gains made in the last year. These events are governed by natural variations in weather patterns, which have always occurred.
For longer-term variations, yes, the rate of sea level rise during the entire period since 1993 probably is a little more than, say, during the period since 1900 (sea level rise was occurring naturally, anyway). But the inferred acceleration is small. And even that acceleration could be mostly natural — we simply don’t know.
My main point is that the Nature headline was misleading. They clearly had to find something in the study that supported the alarmist view of sea level rise, and they figured few people would read past the headline.
A face-value reading of the two main studies together results in the conclusion that sea level rise since 1993 has been revised downward. The most recent study then reads too much into the wiggles in the new data, and even implies the acceleration will continue with the statement, “The suggested acceleration… highlights the importance and urgency of mitigating climate change and formulating coastal adaptation plans to mitigate the impacts of ongoing sea level rise”.
The new study does NOT revise recent sea level rise upward, as is suggested by the Nature headline quoted above.
If one has something like sea level (or temperature) that has oscillated in the past, reporting a rise without noting the history is deceptive.
Sea level goes up and down. It is only news for people with an agenda. The agenda is greed, status and power. These things are a constant. They never go up or down.
Once again , here is the Jevrejeva 2014 data from tide gauges, with a low-pass filter on rate of change of sea level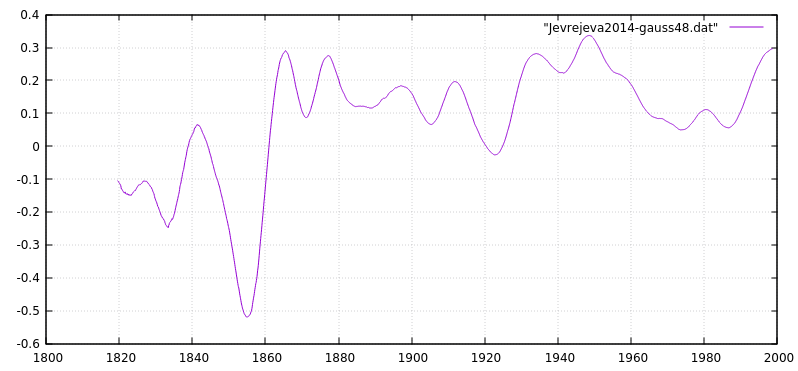
So yes, there was a recent “acceleration” just like there was earlier ups and downs. No more. The satellite era just gives a convenient window which only records the latest wiggle, an upwards one.
People woth an agenda, or confirmation bias maay also ajust sea level or temp in the past.
Just one more ” ajustment” towards, it worse then we thought.
I’ve posted that quick hack of a graph several times in the recent posts on this subject, so I thought I should tidy it up with a data ref. and properly labelled axes etc.
Greg, most people will work out that the x-axis is date. The y-axis does not specify the units of rate.
Greg … your graphs also end in 2000. Need updating.
It’s the revision of tallies that is accelerating.
This after all IS The Adjustocene !
g
Better numbers are available now, but I remember easily that 13,000 years ago the sea level was 130 m lower.
Yes, and as I recall, beachfront properties went for a song back then.
I don’t think there was any beach front properties along the English Channel back then nor any along the Korean strait.
But, but, but – that was before patio heaters.
If only they had installed wind-turbines and solar panels, and recycled their compost – then this catastrophe could have been stopped.
Same here down-under.
Thankfully, Norway, at least. was properly entrenched.
British Isles?!? What is British about Ireland?
Oh, the old United Kingdom of Great Britain and Bretagne.
Yes, the favorite Doggerland hunting grounds of my great*320 grandfather are now only accessible via oil rig, saturation diving or submersible. 🙂
Wow, you are old. 😊 and with a good memory.
Another Revision that goes the wrong way for the skeptical theory that all adjustments are upwards and bogus.
Thanks, Stevie, for pointing that out for us. Us Den’s can be pretty think, sometimes…
Pretty think?
all your typos are belong to me!
Will NYT WAPO HUFFPO BBC report on this?
Steve,
That’s not entirely accurate. By reducing the rate of SLR in the early 1990’s, the alarmist headlines will read, “SLR acceleration confirmed!”
The bit about slowing down the past will be “below the fold,” if reported at all by the FNM.
Sorry I am specifically debunking the skeptical claim repeated many times here that all adjustments
are upward.
Witness as a second example ERSST v5.
Witness as a third example, hansen 2010.
If you want to go on the record and say
” Not all adjustments are upward”, then Go ahead.
For the record. is the skeptical arument that all adjustments are upward Busted or not?
Simple question. yes or no.
you cant answer yes or no.
Steve,
As a light lukewarmer, and in due deference to the Patron Saint of Lukewarmers… Not all adjustments are upward.
M’kay?
That said, downward adjustments of the past, that make the present appear more anomalous…
All that David is saying here is that in this particular case it bolsters the skeptic claim…
Steve,
The more I think about it, most of us don’t have an issue with upward revisions of the present. The issue is with downward revisions of the past.
The truly noticeable feature of “adjustments” to the temperature record in GISS and elsewhere is to reduce the variability of the past.The Twentieth Century changes minimize the 1910-1940 warm period, and the 1940- 1975 cooling. Mann and his accolytes eliminate the Little Ice Age and the Medieval Warm period.
It looks like an attempt to made climate seem simpler.
“The researchers in April made a major adjustment to the first 1/4 of the satellite record, bringing those early sea levels up”
If it’s not adjusting past temps down…..it’s adjusting the slope up
What ever it takes….now they are going to slow everything down so they can claim the models were right
Mosher, i hope you don’t deny that the perception looks awful. When i started taking an interest in agw after inconvenient truth, the standard temp data at wikipedia had temps rising .4C, then falling .2C and rising again .4C during the 20th century. i find in these adjustments a sort of orwellian creepiness. And to think that most ordinary people wouldn’t even notice the changes. (only us climate change junkies) There may not be anyone pulling the wool over peoples eyes, but if there is, then it’s not too hard to see that they could easily be getting away with it. This sort of thing should concern all of us…
True, not ALL adjustments have been upwards. But the vast majority of them have served to increase the rate of rise, either by increasing recent data, or lowering older data. Certainly suspicious, isn’t it? It’s almost as if they know what the data is supposed to say, and adjust to fit whenever they can.
Steve, the skeptical point is proven not only by the exception but by the way the adjustment was reported. Using straw man is unworthy of you.
Mosher’s monolithic characterisation of skeptics is, of course, just as inaccurate as the skeptical view that climate scientists are entirely dishonest charlatans making it up as they go along. I happen to think that there is very good evidence that many of them are completely honest.
More interestingly, what might one expect? The climate scientists are the ones claiming to be the experts, so they ought to be correct more often than critics taken at random from the general population. In turn, the general population could be forgiven for wondering just when the climate scientists are going to start getting things right such that they don’t need to make so many adjustments and readjustments to their output.
Climate scientists aren’t “entirely dishonest charlatans making it up as they go along”… There’s John Christy, Roy Spencer. Judith Curry, Richard Lindzen, Pat Michaels… 😉
I agree that the vast majority are honest. They just have a flashlight problem…
I see that your theory that all adjustments are bogus is not falsifiable.
Its your dogma. Your religion.
Take ERSST version 5. The last adjustment changed the trend during the pause..
The trend during 2000-2015 was revised downward from the “pause busting” version.
I’m sure you will find a way to preserve your faith in “all adjustments are downward” except when they are
not. In which case they are bogus for some other reason.
Your statement is false. There are plenty of times where someone commenting here has noted that past temps were lowered in order to make the current rise in temps appear as an acceleration. SLR has also been lowered in the past for the same reasons. It makes current SLR appear to be rising faster then ever before.
“Another Revision that goes the wrong way for the skeptical theory that all adjustments are upwards and bogus.”
You wouldn’t know that from the press release.
I’ve yet to see anyone claim that “all adjustments and upwards and bogus” and will be forevermore. Stop making ish up.
The idea was to show an acceleration.
They knew that faking recent data would never fly, so they figured out how to make it look like sea level rise was accelerating while also allowing Mosher to say ” Ooh, too bad for the skeptics”.
Why should anyone believe that in 2017 people have a better idea of what sea level was way back then, than the people who were measuring it at the time?
Steve Mosher wrote, “…the skeptical theory that all adjustments are upwards and bogus.”
I’ve never heard that “skeptical theory,” and downward adjustments are not unprecedented. E.g., do you recall this discussion between Phil Jones and Tom Wigley about how to adjust-down the 1940s “warm blip,” to support the Hockey Stick narrative?
FOIA/1254108338.txt
Good god those idiots are idiots. What a bunch of effing nonsense. Pseudoscience!!
Frauds posing as scientists. Adjusting 1940 temp by 0.15 degree to make it look more believable.
And then a formal government study saying this isn’t fraud. Well of course it isn’t fraud by government standards. If you or I did it then it would be fraud. But when it is done to favour government policy, then it is no longer fraud, it is outstanding service to the nation and the world.
DaveBurton: It is important to post these Climategate Emails from time to time as some of the newer readers of WUWT were not readers when this fiasco broke.
I nominate Steven Mosher for giving us the least scientific comment of the day.
(or the mosht unscientific comment of the day… ☺)
SM,
The problem is that you are misrepresenting the complaint. The actual complaint is that “the adjustments always make the situation seem worse than it is, and are bogus.”
It is unfortunate that you don’t have something worthwhile to contribute other than playing the role of an impotent gadfly.
“1. What was the manufactured single figure in representing the temperature of the earth in 1998 in 1998;
2. What is that figure now;
3. What will that figure be in ten years time?.
A. There is no manufactured figure representing the temperature of the earth in 1998, either then or now.
B. There are several different estimates of a global INDEX which is a non physical combination of SAT and SST.
C. these Estimates are PREDICTIONS of what the Index would be at UNOBSEVRED Locations.
D) These estimates, like the estimates of the speed of light, or any metric, change over time as data and methods improve.
E0 The 1998 estimates of 1998, from GISS and HADCRUT, where based on data available at that time
and methods developed at that time.
F) Since 1998, both the source data has changed and the methods have been improved.
G) Changes to data include the addition of More data and the correction of data ( some supplied by skeptics)
H) Changes to methods include improved adjustment methods and improved UHI de biasin
#########################
Its really quite simple. Imagine a 1998 study that only used Tokyo urban thermometers for its record, that showed an everage temperature of X. Today, we have methods that allow us to use ALL THE OLD HISTORICAL DATA that surrounds the city. Other methods (the 1998 methods) had to ignore this data.
But now we can re assess the old 1998 version of 1998. What do we find? We find that old 1998 version
was too high because it ignored other data. So we include the other data and go figure, Tokyo 1998 gets
adjusted down.
The thing that most skeptics miss is that a “global average” really is an estimate. Change your input data, improve your methods, and the 2017 version of 1998 will be different. Of course you test your methods ( via double blind) to insure that they in fact are better. The other thing you do is check whether or not your added data changes the value outside the stated uncertainties. In general it doesnt.
More data is out there. Tons more. Some of it is being recovered, but its a huge effort. There is a also
tons of agriculture data.
let me tell you how I use that. You find an area that has a few weather stations. You use that data to build
an area average.. an Area Prediction. This predicts the temperature at all those locations where you THINK
there is no data. Then you go looking for data taken for agriculture purposes. Entirely different networks
networks that you have never seen or even read about. you then use that data to validate your spatial model.
Guess what?
the skeptics at Climate Audit were right! if you use Kirgging you get a better prediction.
i used to think the same way you did. then I works with statistics from Wars. You would be amazed how the understanding of the past improves as you have more time to research additional data and use improved methods.
For Example
See this page
https://data.giss.nasa.gov/gistemp/history/
1. it details all the changes made.
2. Look at the changes post 2000. see something.
3. The Magnitude of the changes are inconsequential. Its still warming. there was an LIA
Perhaps it was deemed more expedient to create a false acceleration and lower the overall trend.
You didn’t address Dr. Spencer’s point at all.
That wasn’t his goal.
Thanks Steve, for a well thought out and considered answer. It basically answered a point I have made with many folks – a global temperature is a construct. Perhaps a useful construct, but still a construct.
Good comment regardless of less flattering commentary.
Thanks.
Mosh
How do you determine if the data gave too high a reading?
In actual empirical science and engineering you have to characterise your sensors. And they have to be capable of resolving better than the minimum uncertainty required.
You also need to know each sensor characteristics using other data, not just temperature, so that you can provide the appropriate corrections.
If you can’t do this you can make a set of assumptions and work from that. But the result will have much less relevance and weight. And you shouldn’t be making decisions based on this.
Forrest, excellent exchange between y’all and mosh. Antagonistic points of view bring out the best (did i really say best?) in all of us…
One Swallow does not a summer make.
Aristotle (384 BCE – 322 BCE)
Steven,
What has happened to the authors of papers based on these indices that were estimated at a given time in the past? Now that time has marched, indices have changed, have the papers been corrected or withdrawn? I must confess I have seen virtually no corrections, but this might mean no more than I have read the wrong literature.
Cheers Geoff.
OK, all bar this one go one way. Happy??
“D) These estimates, like the estimates of the speed of light, or any metric, change over time as data and methods improve.”
Hahahahahahahahahaha!
Let me know when they adjust c as methods improve. Don’t hold your breath waiting for a better estimate though.
“The thing that most skeptics miss is that a “global average” really is an estimate.”
I don’t miss it at all. What I miss is how comparing one estimate to another estimate and seeing a miniscule difference is supposed to give any indication of a trend. By definition an “estimate” is an unknown. The error bars on something that can’t be known are huge, but which climate scientists such as yourself sweep under the rug and pretend that doesn’t matter.
Forrest
Yeah I was addressing Mosh but the nested comments go a certain way.
I also have no problem if the BEST guys or NOAA try to estimate temperature anomalies as by the very nature of the source data it’s going to be in the realm of theory and hypothesis.
But in reality we don’t actually know if 1910 was hotter than today as the measurement tools and processes were never made to give repeatable 0.1K accuracy.
As long as no one acts on these data sets like they are fact.
Oh wait…
It will be difficult to revise the speed of light as our measuring systems of time and distance are now precisely defined in terms of it. Since 1983 the metre has been defined based on c being exactly 299,792,458 metres per second.
Andrew July 24, 2017 at 2:39 am
“D) These estimates, like the estimates of the speed of light, or any metric, change over time as data and methods improve.”
Hahahahahahahahahaha!
Let me know when they adjust c as methods improve. Don’t hold your breath waiting for a better estimate though.
The values for c were certainly adjusted as methods improved:
1729 James Bradley, aberration of light 301000
1849 Hippolyte Fizeau, toothed wheel 315000
1862 Léon Foucault, rotating mirror 298000±500
1907 Rosa and Dorsey, EM constants 299710±30
1926 Albert A. Michelson, rotating mirror 299796±4
1950 Essen and Gordon-Smith, cavity resonator 299792.5±3.0
1958 K.D. Froome, radio interferometry 299792.50±0.10
1972 Evenson et al., laser interferometry 299792.4562±0.0011
1983 17th CGPM, definition of the metre 299792.458
The adjustment increased the acceleration and the headline was bogus. Now you can’t even trust that the headline matches the story.
1729 James Bradley, aberration of light 301000
========
If physics worked like climate science, we would be changing Bradley’s estimate to 300000.
“Revised tallies confirm”
Only idiots believe in such statements.
It’s commonly called the exception which proves the rule, especially when the science press tries to spin it the alarmist direction.
Mosher writes
I think you’ll find the skeptical theory (if there is one) is that statistically, its improbable that all the adjustments have been applied while the adjustments form a significant non zero trend themselves. If all the adjustments had been identified and applied then we would expect about zero trend as a result.
One goes one way, 100 go the other.
Moshest, I’m glad that you are willing to admit that the global temperatures are estimates.
That’s rare from your side.
Regardless, when the signal you have claimed to found are a small fraction of the adjustments to your data, you aren’t doing science.
Lot’s of misleading headlines/statements. Like “the climate is always changing.”
“the climate is always changing.”
Not as fast as the measurements of it and of it’s effects it seems.
““the climate is always changing.””
So are the historical databases.
The difference is, climate changes are unpredictable.
Warmista chicanery, on the other hand, is entirely and transparently predictable.
Looks like a giant leap of faith there unless I’ve misunderstood you “Really Skeptical”, but are you claiming the climate constant?
Like the weather, climate data is constantly changing. Today’s facts are tomorrow’s fiction.
Scep, why did they change the name ‘Anthropogenic Global Warming’ to ‘Climate Change’ a decade ago? Don’t they expect the globe to be warming anymore? And if it isn’t, then why all the fuss? The change came precisely when the globe stopped warming for two decades, that’s why.
I’m a geologist who studied paleoclimate 60yrs ago. The climate has changed beyond your wildest imagination over billions of years and over 100s and thousands of years. It even changed wildely on Mars where there were once seas and a thicker atmosphere. I encourage you to be disobedient, question a lot, challenge a lot, not just sceptics but everyone(!) , otherwise your name is an oxymoron. You may have seen some of the papers supportive of the sceptic position get thoroughly trashed here by sceptics. There is even a ‘way out’ website of this kind that is ANTI-CAGW that we don’t support or accept goofy comments from. This electronic age makes it a true sin to be ignorant.
A big plus in your favor is that you have come to this site (the lion’s den) to read articles and to comment so you are somewhat more independent than the vast majority. Here is a remarkable, rare proof that climate has changed enormously from 53million yrs ago:
https://www.livescience.com/23374-fossil-forest-redwood-diamond-mine.html
A redwood forest at the Arctic circle – Climate Change that wasn’t reported by the left media.
Of course, the Tide Gauge record (anywhere you care to look) remains linear, repeat: linear, and within the upper and lower 95% confidence zone too! With admitted inability to accurately encompass land-ocean transition zones, why rely on the low resolution altimeter readings when Tide Gauges provide high resolution measured, verified, and validated data?
Everything that you need to know about the problem of trend analysis of a short period of sea level measurement is explained in this NOAA link and the graph at the end of the page:
” If several recent years have anomalously high or low water levels, the values may actually move slightly away from the true long-term linear trend.. A 30-year data set should provide a trend with a +/- 1.5 mm/yr confidence interval. ”
The satellite era of measurement is shorter than 30 years. So the noise, swamps the signal. Discussing acceleration with such a short trend length is pretty meaningless. See the graph at the bottom of the page. All is revealed…by NOAA themselves.
https://www.google.co.uk/search?q=trend+length+sea+level+rise+acceleration&client=firefox-b-ab&source=lnms&tbm=isch&sa=X&ved=0ahUKEwjf85DfyqDVAhWDhRoKHd8KCi8Q_AUICigB&biw=1010&bih=599#tbm=isch&q=trend+length+sea+level+rise+&imgrc=iM_aKq8LGNHkPM:
Apologies, My mistake. This is the NOAA link. Please can the moderator fix this and add this correct link into my comment, above: https://tidesandcurrents.noaa.gov/sltrends/faq.htm
Ah yes, just like the IPCC. A big misleading graphic, with the truth hidden in a tiny footnote. When someone points out the graph is misleading, the author’s hand you a magnifying glass to read the footnote, claiming innocence.
Another piece of research suggests and it’s agreed , science ! Also let’s play with the numbers again .
Don’t know how many times in this subject and others someone has given me a link to a study and it’s pretty much always the same .
More and more sheeple are becoming irate people as the price of electricity spirals and they’re not getting their feet wet when stepping out the front door or get sick and tired about being assured of the runaway globull warming when their shivering in the cold unable to afford to turn the heater on.
Give them enough rope and they will hang themselves I say .
She’s right in Oz, mate. Only 0.65 millimeters/year.
https://tidesandcurrents.noaa.gov/sltrends/sltrends_global_station.htm?stnid=680-140
John of Cloverdale, WA,
One of my best friends in the world is from Manjimup.
For perspective,
On the topic of sea-level rise, and 0.65mm/year, I had my first bout with kidney stones recently.
The doc was apparently a rookie with lithotrypsy, and didn’t do a spectacular job of zapping the stone.
The 4 or 5 largest fragment sizes were about 2mm x 4mm x 6mm; one was longer and pointier.
The painful part was from the kidney downward. Lasted about 4 hours each.
They all did pass eventually. I suspect that catastrophic sea level rise will too.
I can probably cope with 0.65mm/year.
Oh.
And those fragment sizes are actual physical measurements.
No modeling.
No harmonizing or adjusting or averaging.
The original data is available on demand/request for verifying the physical measurements.
Just recently, for my own amusement, I snipped the standard graph of Church and White plus satellite et al.(I forget what the others two plots are) from 1925 to present and rotated it to an approximate horizontal.
It becomes immediately obvious why detection of a long-term acceleration is not such a simple matter. We see natural fluctuations over-laid on an approximately linear trend.
No apocalyptic banana shaped graph…https://ibb.co/cruPqQ
You did it wrong.
The data need to be adjusted, corrected, and possibly homogenized. Then the apocalyptic acceleration becomes clear. The GIA adjustment has proven useful in this case.
And I needed to represent the satellite era as the volumetric SLR i.e. the change in total ocean water volume represented (oddly) in mm/year- and then called sea level rise rate, even though it is something else.
A creation so absurd, that everyone is totally baffled and fails to understand what is going on before their very eyes.
@indefatigablefrog (to further your point)
If the ocean basins had been rising instead of sinking, would consensus scientists have LOWERED the “sea level” to compensate? To ask the question is to know the answer.
An inconvenient fact for the CO2 crowd, sea levels were higher 2000 years ago.
http://jonova.s3.amazonaws.com/graphs/sea-level/sea-levels-nsw-lewis-20000-7000-years-ago.gif
Reference here: http://joannenova.com.au/2012/10/australian-sea-levels-have-been-falling-for-7000-years/
CO2 rising, sea levels falling. How can this be, if rising CO2 is melting the ice caps and glaciers?
http://notrickszone.com/wp-content/uploads/2017/03/Holocene-CO2-10500-0-R.jpg
https://wattsupwiththat.com/2017/06/09/a-holocene-temperature-reconstruction-part-4-the-global-reconstruction/
CO2 levels reflect southern hemisphere temperatures. The northern hemisphere, on the other hand, saw temperatures plummet over the same time frame. (hence you have the so called “holocene conundrum”)…
It’s a global consensus. Which only deniers would deny!!
Here’s another 35 papers saying similar things. “35 Scientific Papers: Global Sea Levels Were 1 – 2 Meters Higher Than Now For Most Of The Last 7,000 Years” http://notrickszone.com/2017/02/06/35-scientific-papers-global-sea-levels-were-1-2-meters-higher-than-now-for-most-of-the-last-7000-years/
Thanks for the reference.
With global tide gauges showing sea level rise of under 2 mm per year (eight inches per century), and satellite readings being constantly adjusted from raw data showing no increase to 3.8 mm/year after many adjustments (and only starting in 1993) – and having large margins of error – what is the problem? The range of all these readings falls in a band of a minimum of four inches and a maximum of fifteen inches per century, and none show significant acceleration. West Coast cities have tide gauge records showing higher sea level 34 years ago in 1983 than now. For example, the Los Angeles tide gauge shows sea level rise of 0.96 mm/year, less than four inches per century.
And here is a paper about paleo sea levels on Hawaii:
Sea level higher (about 2 metres) than present 3500 years ago on the
northern main Hawaiian Islands
Eric E. Grossman and Charles H. Fletcher, III
Department of Geology and Geophysics, School of Ocean and Earth Science and Technology
University of Hawaii.
https://www.google.com/url?sa=t&rct=j&q=&esrc=s&source=web&cd=2&ved=0ahUKEwju_Jey3KDVAhUHFZQKHTG_AqEQFggnMAE&url=http%3A%2F%2Fwww.soest.hawaii.edu%2Fericg%2Fkap_paper.pdf&usg=AFQjCNF73l0ESx0l5dcRV9Sbf-oa9s3Lig&cad=rja
I love Mosher’s comments. I have a new word.
Mosherisms.
Food for thought.
Thanks Mosh.
(kind of like ‘ratherisms’)…
Whether the net revisions/adjustments are up or down is irrelevant the point is that they always attempt to bolster the narrative, in this case alleged sea level acceleration.
Drowning down under:
Yet another nothing-burger…
If we look at the three figures, there is a significant change on the background area/ topography. This change might have contributed to the imaginary SLR in 2016.
Dr. S. Jeevananda Reddy
Focal length of cameras changed. Geoff
Taken from 3 different angles. Cannot vouch for the authenticity of the the dates, but that is where the tidal data is taken giving a complete record. Interesting place to visit.
Cheers.
Painted by George Barrington. Pinchgut Island, 1790’s.
http://www.jimhaynes.com.au/images/pinchgut-2.jpg
There is the issue of low tide versus high tide.
There is a difference of 4 feet in many cases at Sydney so a picture or a tide mark is not going to work unless you are taking the high tide mark at the King tide times.
Very much like Emsworth, Portsmouth, Gosport and Exeter in the UK. NO CHANGE IN HUNDREDS OF YEARS!
Doesn’t Sydney Harbor have tides? What was the stage of the tides when the above pictures were taken?
It’s irrelevant to the discussion. The rate of rise at that location is recorded as 0.65mm/year. So – if we did bother to find photos taken when the tide was at exactly same stage, and under identical barometric conditions – then, the rise would still not be evident to the eyes in a photo taken at that range. It’s just 6.5cm per century.
It’s a nothing burger.
“the new Nature study looks at the wiggles in …”
Toot toot chugga chugga big red car …
I knew all along Australia’s wealthiest citizen’s from its most successful band had something to do with climate change.
He had to wake up so he could invest in renewables and make lots of money .
If you split the most recent CU data set in two Dec 1992 – October 2004 – July 2016
you find that from 1992 to 2004 the rate of sea level rise was 3.55 mm/yr and from 2004 to 2016
the rate was 3.65 mm/yr. How they get to 3.9 mm/yr requires a shorter time series:
August of 2005 to July 2016 comes to 3.9 mm/yr, but what’s the point?
Besides that, CU’s Research Group has been adjusting the data right along. Here’s a chart where each point represents the rate of sea level rise since late 1992:
http://oi68.tinypic.com/2hz4cqt.jpg
Had no changes been made, those two plots should have fallen on top of one another – they don’t.
When Release 2017-1 or 2018-1 is published, it will be interesting to see how well a new plot falls on top of the one from 2016. Will the high point around January 2006 still be there? Or will it be lowered to the point that a significant acceleration appears? Only time will tell.
Climate hype and deception are synonymous.
As with temperatures, another attempt to measure a trend which is way below the noise floor of the system.
The sea level in fact goes up and down twice a day, and by about one thousand times as much as the claimed annual rise. If that makes a 3mm annual trend sound hard to measure, it also has to be borne in mind that the tidal range is not constant but varies due to a number of factors.
Ian,
You said, “… tidal range is not constant but varies due to a number of factors.” Like lunar cycles, waves, wind, and barometric pressure at individual sites! The tides are also affected by the underwater topography such that huge tidal bores are created in many locations in the world. The standard deviation of the sampling is probably about two orders of magnitude greater than the reported sea level rise!
Where can I find data about the Earth diameter? I wonder if it’s decreasing due to gravity.
According to the late Prof. Warren Carey, a pioneer in plate tectonics, the Earth is expanding.
“Short-term undulations in the “XXXXXXXX” curve should not be used as a predictive curve for the future.”
Words to live by
“For longer-term variations, yes, the rate of sea level rise during the entire period since 1993 probably is a little more than, say, during the period since 1900. But the inferred acceleration is small. And even that acceleration could be mostly natural — we simply don’t know.”
Dr. Spencer,
We know the rate of sea level rise since 1993 (3 mm/yr) is natural because the same rate was observed in 1930-1950 when atmospheric CO2 was around 305-310 ppm, then it decreased to 1.1 mm/yr in 1950-1992 even when CO2 increased to 350 ppm. See Figure 2 (Jevrejeva et al, 2014)
https://wattsupwiththat.com/2017/07/20/sea-level/
Are NOAA”s GSN station temps used in any of the “official” NOAA data sets?
Maybe due to Obama saying:
What he was referring to was the flooding that happens in a few low lying areas surrounding Miami during the twice-a-year King tides (not daily high tides) that have been occurring forever.
Falling sea levels should be more of a concern, because if that happens, it could signal a return to another glacial period. It also means more shoreline to build on, and create alarm about, when sea levels fluctuate up again.
We never learn.
I’m surprised sea level rise isn’t measured in angstroms.
There is an easy conversion between millimeters and angstroms! 🙂
I wonder how the bet on travelling from Svaalbard to the N Pole without seeing ice is looking?
Well, the “SEE” level on this nature article has certainly risen!
(don’t say “si”, say “oui”)…
Much like the “collusion” delusion, the “Day after Tomorrow” scenarios of sea-level rise are a figment of uninformed imagination. Nevertheless, the evident accelerations and decelerations of that rise do provide scientifically useful indications of the strength of some factors involved. Noteworthy in this connection are the strong local minima of rate shown in Greg’s graph here in the 1860s, 1920s and 1980s. Bearing in mind the steric component, these prominent features roughly 60-odd years apart suggest that multidecadal global temperature swings were considerably stronger than most published GAST indices indicate. In any event, the recent acceleration to ~3mm/yr. evident primarily in satellite data cannot be attributed credibly to the monotonically rising CO2 concentrations.
Yeah, Sky, one has to wonder if the rate of sea level rise is an indicator that the temperature data sets might be way off. They used to look more or less like what is seen in Greg’s graph. Plus, there is the c*nsp*r*cy theory out there that Callender sought to manipulate the station data to produce results more in line with his failing agw theory. (he sought a .75C/ Century increase through various techniques of manipulating temperature stations) i think that you’re right that the SLR data brings up a question or two that need answers…
http://oi44.tinypic.com/29axhua.jpg
And the same is true of extreme weather metrics. Floods, cyclones, droughts, etc
Or even the remarkably non-alarming precipitation trends.
All that anyone has, is some arctic warming, which can be accounted for as PDO warm cycle plus emergence from the little ice age.
Maybe Antartica really is gaining mass – as shown by NASA Zwally.
Maybe the ARGO floats really did reveal that the oceans were cooling – before all the inconveniently cooling floats were hand-cherry-picked, declared to be faulty and removed from the analysis.
Maybe, what the science is really telling us – is that the original CRU analysis of global temperatures from 1850 was bunk.
I’m inclined to be most suspicious of the ocean component during the first century of the series.
We have been warping everything else to fit with those original analyses of the temperature of ocean water collected by sailors using a variety of types of bucket.
And yet – it simply isn’t stacking up.
Maybe those evaluations of the ocean bucket temperatures – plus infilling and homogenization of nearly entire continents during pre-1950 period – maybe the entire thing is bunk.
If it isn’t then why is the rest of the story not conforming to expectation?
I’m not all that surprised that buckets on ropes may not be able to tell us much about the precise average temperature of the globe.
Nobody should be surprised – on the face of it, it sounds idiotic.
afonzarelli:
Results quit similar to the graph you show are obtained–without resort to any trend correction–simply by relying exclusively upon vetted, century-long station records that show high low-frequency coherence with their neighbors. Because these are land records, the decline to the 1976 low that preceded the present warming swing registers even more strongly than in the trend-adjusted HADCRUT4 global average.
indefatigablefrog:
The fundamental problem with historical SST data is not the use of various buckets for acquisition, but the very sparse, highly irregular sampling outside well-traveled sea lanes. This raises serious frequency-aliasing issues in cosntructiing SST time-series that have never been satisfactorily addressed in “climate science.” The transition to engine-intake temperature measurements during WWII introduces yet another confounding factor. The upshot is that we have only an uncertain, partial glimpse of global SST variations before the advent of satellites.
Oops, that should be 1850s.
Funny thing about science… it ain’t never settled
Can someone explain (beyond the Trump effect) why there are no more updates to the NOAA/NESDIS/STAR downloadable datasets. The URL I am looking at is
https://www.star.nesdis.noaa.gov/sod/lsa/SeaLevelRise/LSA_SLR_timeseries_global.php
It is titled:
Laboratory for Satellite Altimetry / Sea Level Rise
Global sea level time series
The last dates are 2016.7032, mid September 2016.
Shaking my head at a comment made by Steven Mosher that taking a look at “other data” surrounding Tokyo shows that Tokyo’s past readings were “too high”. WTF does that mean?
If the other data shows Tokyo’s temperature used to be ten degrees higher than the surroundings, and current shows it to be 5 degrees higher than the surroundings, then it’s obvious to anyone with a brain that the surrounding areas are likely now entering into the same urban heat island that biased Tokyo’s readings in the past, which is useless for gauging the accuracy of any of Tokyo readings, past, present or future.
If the other data shows Tokyo’s temperature used to be five degrees hotter than the surrounding areas, and now it’s ten, then Occam’s Razor suggests the urban heat island or some other similar effect is becoming more pronounced in Tokyo than in the surrounding areas, which if anything would indicate all of today’s Tokyo readings should be adjusted downward, and the past left alone.
There is no mathematically or scientifically justifiable reason to adjust past data based on current data. There are far too many building and hardscape density/profile and micro-climate shifts possible to determine exactly why today’s temperature patterns differ from those in decades past.