by Rud Istvan,
EPA administrator Pruitt wants to “Red Team” the catastrophic anthropogenic global warming (CAGW) consensus best reflected in the IPCC assessment reports (AR). At its core, CAGW rests on just three propositions:
1. CO2 is a ‘greenhouse’ gas retarding radiative cooling. This should not be in serious dispute since Tyndall experimentally proved it in 1859.
2. The Earth is warming. Although the details are in dispute because of temperature data quality problems and ‘adjustments’, the general fact is not. The Earth has been intermittently warming since the Little Ice Age (LIA) ended. For example, the last Thames Ice Fair was in 1814.
3. CO2 and its knock-on effects caused the recent warming, and climate models (such as the CMIP5 archive for IPCC AR5) predict this will continue to catastrophic levels. This is an extremely dubious proposition.
This guest post addresses proposition 3. It does so in a short sound bite ‘abstract’ useful for debating warmunists, and then in a typical WUWT full climate science guest post. It is a modest Red Team contribution.
Sound bite ‘abstract’
Climate models have run hot since 2000. Except for the 2015-16 now fully cooled El Nino blip, there has been no warming this century except by Karlization or (newly) Mearsation. Yet this century comprises about 35% of the total increase in atmospheric CO2 since 1958 (Keeling Curve). The climate models went wrong on attribution. The warming ~1920-1945 is essentially indistinguishable from that of ~1975-2000. AR4 figure SPM.4 said the earlier period was mostly natural (because not enough change in CO2). The CMIP5 archive assumes the latter period is mostly CO2 (and other GHG). That assumption is fatally flawed; natural variation did not magically cease in 1975.
Fully documented post
CMIP5 climate models have run hot since before 2000, and the divergence of CMIP5 from observations is highly statistically significant. Details are in Dr. Christy’s 29 March 2017 Congressional written testimony (available on line), from which Figure 2 provides sufficient up-to-date evidence.

This divergence is rooted in the attribution problem between natural and anthropogenic warming. It is unavoidably inherent in CMIP5 models for a very basic reason.
To properly model essential climate features like convection cells (thunderstorms), a grid cell needs to be less than 4km on a side. The finest resolution in CMIP5 is 110km at the equator; the typical resolution is 280km. This is because halving grid size requires an order of magnitude more computation. So adequately simulating such atmospheric processes from first principles is computationally intractable. Details are in my 8/9/2015 WUWT guest post “The Trouble with Climate Models”.
The solution is to parameterize such processes (for example, put a number on the probability of how many thunderstorms per grid cell per time step –a conceptual rather than actual example as parameters are a bit more complicated). Parameters are obviously just guesses. So they are tuned to best hindcast compared to observations; for CMIP5 the ‘experimental design’ was from yearend 2005 back three decades to 1975.[1]
Parameter tuning implicitly drags the attribution problem into CMIP5.
Dr. Richard Lindzen, MIT professor emeritus, first made the observation that the period of warming from ~1920-1945 is essentially indistinguishable to that from ~1975-2000. This is readily apparent visually, and is also true statistically.

IPCC AR4 WG1 figure SPM.4 and the accompanying text make clear that the earlier period (circled in blue) was mostly natural; there simply was insufficient change in atmospheric CO2 to explain the rise in temperature without natural variability. A portion of figure SPM.4 (readily available via the IPCC) is reproduced below as sufficient evidence.

The IPCC intent of AR4 WG1 figure SPM.4 was to convince policy makers that the second warming (circled in red) had to be AGW. But that IPCC logic is fatally flawed. The SPM did not tell policy makers about model parameter tuning, which clearly drags natural variation into the model parameter tuning period assumed by IPCC to be AGW. So the warming is falsely attributed only to CO2. Note also the subtle “cheat” in Fig SPM.4 of models using only natural forcings. The issue is not guessed natural forcings. We do not know why natural variation occurs, only that it does (no model of ENSO periodicy, for example). Natural forcings are not the issue; only the resulting natural warming variation is. Natural temperature variation, not ‘forcings’, is the proper statement of the attribution problem. The AR5 WG1 SPM makes IPCC’s erroneous and unscientific belief explicit:
§D.3 This evidence for human influence has grown since AR4. It is extremely likely that human influence has been the dominant cause of the observed warming since the mid-20th century. [Bold mine]
Natural variation did NOT stop in the mid-20th century. And that is why CMIP5 models now run hot.
[1] Taylor et. al., An Overview of CMIP5 and the Experimental Design, BAMS 93: 485-498 (2012).
Does anyone really know what the temperature trends are anyway????
Temperature adjustment impact study
Thanks for the link – very interesting reading…
That is the one quibble I have with ristvan on this one. The world has warmed (when you have a suitable start point – choosing other start points indicate that it has cooled considerably).
What it is doing is actually unknown at this point in time.
CO2 can’t even stop massive cooling overnight in high altitude dry deserts, where water vapor is essentially absent from the atmosphere.
The specific Spectral Absorption Lines that make up the various CO2 absorption bands; most notably the roughly 13.5 to 16.5 micron band, are not also occupied (to any extent) by other GHG components, including water vapor.
Ergo, the heat confining properties of CO2 in the atmosphere, right outside my front door; or at any other place, are NO different from the heat confining properties of CO2 in those high, and dry deserts; namely virtually imperceptible.
In the very coldest of places, such as the Antarctic highlands around Vostok Station, the spectral peak wavelength of the surface emitted LWIR radiation is right on the 15 micron center of the CO2 absorption band, so the warming effect of CO2 should be a maximum at such places.
That’s why it frequently gets down to -94 Deg. C in those regions. Well of course it so happens that there is not too much atmospheric water vapor around Vostok Station either.
Somehow, I don’t get the picture of CO2 causing it to warm much, if at all, virtually anywhere on this planet.
Now having said that; I do not dispute that CO2 is an effective absorber of LWIR EM radiation energy in that 13.5 to 16.5 micron wavelength band, and is also in the region around 4.0 microns; where there is actually very little surface emitted radiation, and also very little incident solar radiation, in that band. It doesn’t seem to be what is controlling our stable Temperature comfort zone.
There is somewhat more solar emission in the region around 1.0 micron to perhaps 2.5 microns, so CO2 in the atmosphere can absorb some of that.
But that is a SUBTRACTION from the surface incident solar irradiance that is what is actually being converted to heat at the earth’s surface, and keeping us warm.
So in those near IR CO2 bands, the presence of more CO2 in the atmosphere is a net cooling effect at the surface.
G
George,
It doesn’t need high or dry… even in California, the daily cycle is roughly symmetrical.
When there is variation (not due to precipitation) it directly tracks clouds, with more cloud causing cooler days. Sunny days hotter.
https://chiefio.wordpress.com/2017/06/26/is-the-average-variation-of-clouds-co2/
CO2 is functionally static over a few weeks, (as is solar power and more), so has no explanatory power for the observed variation. Clouds do. Now if one grid cell over a few weeks is explained by clouds, how can averaging more of them over time or space be only CO2?
Well the only reason I said high , was that generally leads to drier.
The point being that when CO2 is free to do its thing by itself, sans backup helpers, it is seen to be woefully incapable of keeping anything warm.
The Antarctic highlands (during winter’s night) of course is an extreme condition. The surface radiant emittance is about one twelfth of the surface emittance of the hottest dry deserts under the noonday sun, which is where the earth is really cooling big time, at nearly twice the rate for the global average Temperature of 288 K.
In the Arctic, there is the added factor of petawatt streams of energy fed to the poles from the tropics, by either ocean currents or atmospheric circulations; but the Temperatures there are still low enough that the radiant cooling surface emittance is unable to get rid of all that imported heat, which is why the polar regions warm more than the tropical regions.
Despite the importation of all that tropical heat energy, the north polar Temperatures are still very low.
Of course that could be a consequence of much less solar incident energy density in the polar regions.
Just imagine how cold the north polar region would be without the gulf stream and other heat importation paths. So much for the CO2 keeping anything warm.
G
BINGO
Mars is a good illustration. Whilst it has only a small atmosphere, this atmosphere is composed nearly entirely of CO2. 96% of a small atmosphere equates to many more molecules of CO2 than does 0.04% of a large atmosphere.
In fact, on a numerical basis, Mars has approximately 10 times as many molecules of CO2 in its atmosphere, as does planet Earth, and yet there is no measurable GHE on Mars, and these molecules of CO2 do not slow down the rapid loss of temperature as the sun sets.
In practice one would expect to see an even greater GHE on Mars if CO2 is truly a GHG since not only is there on a numerical basis more than 10 times as many CO2 molecules in the Martian atmosphere, these CO2 molecules are much more densely packed (ie., much closer to one another) given that Mars has a radius of approximately 1/2 that of the Earth, and thus the surface area over which the Martian CO2 acts is about 1/4 of the surface area of planet Earth.
The Tyndall experiment is far removed from real world conditions, and establishes nothing of importance. We would do well to stick to the facts. CO2 is a radiative gas, whether it is a GHG is moot, and this can only be determined by way of observational evidence of how it behaves in Earth’s atmosphere and what if any Climate Sensitivity there is to CO2.. Such evidence we have is of poor quality and not fit for scientific purpose, but to the extent that one can draw conclusions it would appear that the Climate Sensitivity to CO2 is little, if any at all.
Hi George,
In 2009 I raised the issue of planetary cooling by discussing the effect on world temperature of the high altitude ice desert of Antarctica, a place where in winter radiative cooling can easily generate air temperatures below -50C. My purpose was to explain the source of the cold deep water that exists in the modern world ocean. This cold ocean water is formed by a linked process of air movement off the Antarctic ice-cap by katabatic winds, these cold winter winds freeze the surface waters of the Southern Ocean and also form dense saline water in the coastal latent heat polynya of the Weddell Sea. The high altitude Antarctic ice desert, the katabatic winds and the coastal latent heat polynya are the key parts of a continuous process of dense saline cold water generation that has filled the world ocean with 4C abyssal water for at least the last 20 million years.
At that time you stated that “I always learn something from other people’s posts” and I am pleased to see that you have done so in your acknowledgement of the role that the Antarctic ice-cap has in generating super-cold air.
I will now return the compliment to you. You pointed out to me in your comment in 2009 that the Sahara Desert is a much more important region of the planet that at night radiatively cools by emitting surface heat directly to space, when you stated:-
I now know how profound this comment of yours actually is. You see the standard explanation for the Hadley circulation is that air that has been lifted to the top of the troposphere dries by rain water fall-out in the thunderstorms of the ITCZ, cools by radiation to space at the tropopause and then descends over the Horse Latitudes as hot dry air. The implication is that this descent is due to increased air density caused by radiative cooling at the top of the atmosphere. This is not true. The air aloft is forced back to the surface by the rotational of the Earth and that it is the speed of a planet’s rotation determines the size of its Hadley Cell and not planetary air temperature.
Since your comment in 2009 I have found two papers that prove that this angular momentum mechanism for the latitudinal reach of the Hadley Cell is correct. See:-
From the abstract of Del Genio, A.D. & R. J. Suozzo 1987: A Comparative Study of Rapidly and Slowly Rotating Dynamical Regimes in a Terrestrial General Circulation Model. Journal of the Atmospheric Sciences, Vol. 44 (6), 973-986.
From the abstract of Hunt, B.G. 1979: The Influence of the Earth’s Rotation Rate on the General Circulation of the Atmosphere. Journal of the Atmospheric Sciences, Vol. 36 (8), 1392-1408.
The take home message is this:- The location and size of the climate zones on planet Earth are controlled by its daily rotation. In order to extend the latitudinal reach of the Hadley Cell towards both poles simultaneously, it is necessary to slow down the Earth’s daily rate of rotation. Carbon Dioxide cannot do that. Climate change by increased air temperature cannot alter the size of these climate zones which on Earth are controlled by planetary momentum.
Of course radiative cooling during ice ages is another story. By providing more high elevation land surface during ice buildup our fast rotating planet is more prone to cooling than to warming. As far as I am concerned it’s game over for Carbon Dioxide.
Thank you George for correcting me with your fascinating insight.
“””””…..
Philip Mulholland
July 10, 2017 at 3:37 am
Hi George,
“
CO2 can’t even stop massive cooling overnight in high altitude dry deserts, where water vapor is essentially absent from the atmosphere. …..”””””
Phillip the point of my mention of the Sahara and other tropical dry deserts, is NOT that at sundown, somebody tells the desert ” OK it is ok to radiate now that the sun has gone to sleep.
MY point is ….. The Deserts are ‘Radiatively Cooling’ the fastest, NOT at night, but in the hottest part of the day, when the solid surface can be well in excess of sixty deg. C, some say it gets to 90 degrees C.
At those mid day to early afternoon Temperaures the deserts are radiating at almost twice the 590 W/m^2 that one calculates from a 288 K global average Temperaure for a BB radiator.
Yes the polar regions are cold, specially the Antarctic highlands during winter midnight, because there is nothing (including CO2) to stop them from cooling ad infinitum; BUT they do so at a pitifully slow rate if the surface Temperature is -94 deg. C as satellite measurements suggest is common at such times. The radiative cooling rate is about 1/12th of the tropical desert cooling rate.
Among the reasons the south gets colder than the north, besides longer colder winters, is that there isn’t any gulf streams bringing vast quantities of warmer tropical waters close to the south pole, like happens in the Arctic.
Antarctic winters are colder because the sun is more distant, and by Kepler’s laws, it spends more time in that more remote region, but there also is not the high heat flux from the tropics making it much inside the Antarctic circle.
G
Thanks a lot. Hopefully ths report will be the subject of a WUWT post soon.
Measurement error alone on the surface network is +/- .15C and there are obviously other errors that have likely crept into the calculation so it is almost certainly greater. Then there’s methodology. If you search back for old GISS announcements you get the 1997 “it’s this much hotter than the average was” and then you find out what that average is, do the math…and realize that using their methodology the “world” was over 1C warmer back then than it is using today’s methodologies.
What the heck would you even say is an “average” temperature of the earth? In what way would it be remotely descriptive of the wild daily, seasonal, and century scale changes? They talk about energy balance…but how do we even know what the REAL energy balance is? How much energy is the earth trying to reach equilibrium after the little ice age? What would a half a watt per square meter drop in solar output for a couple centuries back then impact what it looks like today?
My gut feeling is that it is truly unknowable and that the way they stitch together the surface record to make it continuous…gives a false sense of accuracy where none exists.
“Does anyone really know what the temperature trends are anyway????”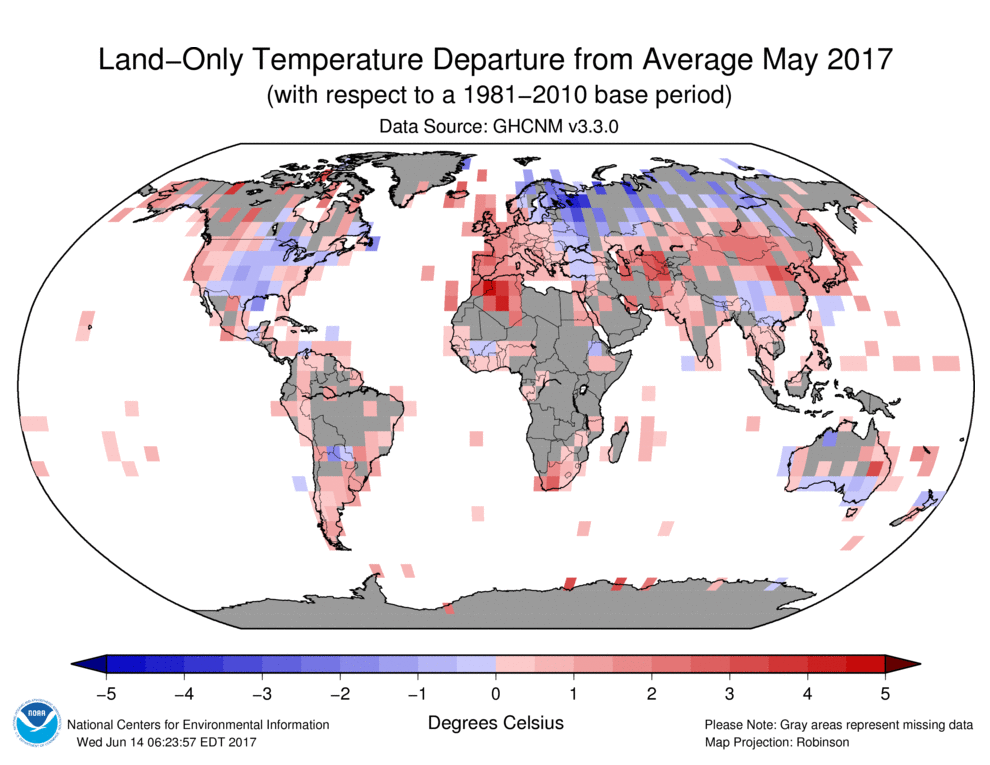
Sampling bias gives us trends for areas of humans preferred habitat: Riparian and Maritime regions. Does this reflect the earth’s true terrestrial aspect? I think not.
Note that this map’s gray areas represent missing data.
Some how NOAA gets from this map:
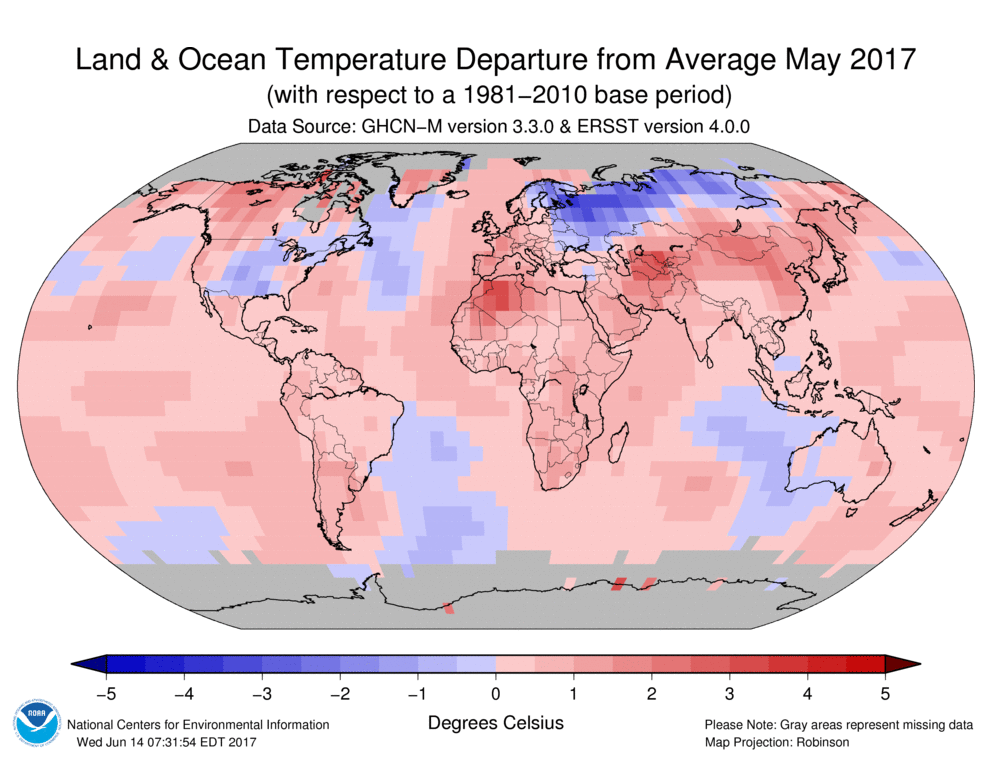
to this map:
Where did the missing data go? Or should that be where did the missing data come from?
Tony Heller has even more egregious examples. Counter, he cherry picked months. Counter to counter, the point remains generally true irrespective of the month used for the illustration. Nice comment.
They like it hot, hot, hot. Sorry, couldn’t resist.
I don’t know… the lowest CHIMP5 model that is tracking below current temperature observations past 2020 looks OK… but when and how are they going to get it to ‘hockeystick’?
AND can anyone tell me which model that is as I’m red green colorblind. Thanks.
Russian INM-CM4
Got it. Thanks!
I’ve long maintained that they should only fund those that are close to reality. Cut the funding to the other 30 and watch the real science start.
Well, I don’t know about that, but certainly Some Like It Hot.
Although now the world is looking to the Chinese for leadership, perhaps the following is HOT, HOT, HOT.
There is an outlier model closer to the other datasets. Is it worth anything?
Can they repeat the run and get the same results?
Repeatedly?
The outlier model following reality is the Russian INM-CM4. It has three salient feature: higher ocean thermal inertia, lower water vapor feedback, and for both reasons also lower sensitivity.
Thanks Rud. In my last post https://climateaudit.org/2017/06/19/the-effect-of-atlantic-internal-variability-on-tcr-estimation-an-unfinished-study/ we tried to find the source of the for the overestimation of TCR in CMIP5.
best Frank
In its latest run the sensitivity is 1.4degC. Sounds right-ish to me!
“However, these are strong mitigation scenarios (RCP 2.6, 4.5)”
The scenarios do not differ much in effect in the years 2005 to now. You can see this in the trajectories, which do not start to sort by color until about 2030. It is convincing evidence that the CMIP5 runs are consistent with observations.
Late back. Frank IMO long time since oceans are the key. And before ARGO, we have no good data. (Trade route, laden depth, biased.) So dunno. Read your and Nic Lewis post at Climate Audit ( now that Steve has moved to twitter), but dunno. I am expert enough to recognize dunno. Highest regards. Skeptic Rud.
Rud, of course nobody can be quite sure about our climate system. That’s why I wrote: “We tried” and this is the contrast: A realistic admits the uncertainty in everything he does and makes more or less doubtful approaches. Some others shout out loude, i.e. https://www.eurekalert.org/multimedia/pub/144866.php . 😉
best Frank
Some of the CMIP5 model runs are fairly close to the observed temperature data…
However, these are strong mitigation scenarios (RCP 2.6, 4.5).
Any way you slice the models, they all either incorporate or result in a climate sensitivity that is far too high.
Your graph shows a 1986 start point in the middle of the herd. Dr. Christie’s Figure 2 lines up the beginning of the satellite era with the average of the CMIP5 Models at that time. By 1986 the observations were well below the average of the 102 models. I can’t help but wonder why a 1986 start point was chosen and were the models in that close of agreement at that time? Dr. Christie’s data says they weren’t.
The two model comparisons used different model ensembles and different starting points.
The starting point for the CMIP5 ensemble is actually 2006. All of the models are CMIP5 using various RCP scenarios, compared to HadCRUT surface temperatures. 1986-2005 (gray curves) are historically constrained. The predictive mode starts in 2006 and immediately runs way too hot.
Dr. Christy uses 1979 as a starting point and compares satellite & balloon temperature data to a range of CMIP5 models run by various different groups.
The failure of the models is more apparent on Dr. Christy’s presentation.
“The failure of the models is more apparent on Dr. Christy’s presentation.”
One reasonable interpretation of that is that Christy is wrong.
While setting the starting point in 1979 is subjective, how could it be wrong?
If you have enough models, all producing different projections, surely at least one or two of them will happen to run close to reality?
I think the thing to look for is one that runs close to reality backwards, forwards, and repeatedly, yes?
“One reasonable interpretation of that is that Christy is wrong.”
Perhaps it would be better to look at absolutes rather than anomalies.
The later version of models had been hind casted to show better correlation with observations.
The models presented at the Hansen climate change hearing 1988, showed scenario A at around 1.6c by 2019.
Scenario B 1.2c by 2019 and Scenario C 0.6c by 2019.
CIMP5 show none at 1.6c and none at 1.2c, yet all average around 0.6c which was the scenario C range.
That is back tracking and hind casting in one, to con the public into thinking the models were even remotely accurate.
The real issue with the models is how they are used to sway public opinion. How many news stories have we seen that use the above chart as the source for a statement like “climate models point to possible warming as high as 2.5 degrees by 2050 which will lead to the mass extinction of all life in the universe!!!!”.And if someone tries to point out that the more likely scenario is much less warming they are instantly branded as a danger to all life in the universe who should be arrested and locked in jail…..
The models presented at the Hansen climate change hearing 1988 up to year 2005 were not even close to what was shown in the CMIP5.
CMIP5 Historical (42 models) had increases by 2000 only about +0.2c and +0.3c by 2005. The historical models never showed such little warming and have been adjusted to match observation in making them appear there were not far off.
1988
Scenario A, 2000 0.8c, 2005 1.0c
Scenario B, 2000 0.5-0.6c, 2005 0.7c
Scenario C, 2000 0.5-0.6c, 2005 0.6c
Therefore 0.3c-0.6c out by 2000 and about 0.4c-0.7c out by 2005.
Regarding Hansen et al., 1988…

To quote Bob Uecker, “Juuuust a bit outside!”
Only reason it is not much outside is because GISS has been adjusted that many times to match it. What I have mentioned still applies regarding the difference between CMIP5. Technically it is still well outside because it generally matches scenario C.
On this planet there has never been a year ~0.4c warmer than the strong El Nino 1997/98. Generally GISS with this exaggerated warming still matches scenario C.
Scenario C – Drastically reduces trace gas emissions between 1990 and 2000.
Yep. Apart from the recent El Nino, GISS matches scenario C.
C holds CO2 flat at 368 ppm after 2000 IIRC.
“Juuust a bit outside” was a reference to this scene from the movie Major League…
https://youtu.be/Jdv2Wp9MzY0
Tyndall’s Experiment occurred inside a glass bell jar, which had absolutely no relationship to the atmosphere of planet Earth, nor did he represent it as such!. The lifespan of CO2 in the atmosphere is reasonably well known from balloon and satellite measurements and photographs of planet Earth have yet to show a sealing glass bell jar over the planet! The CO2 experiments only work in sealed environments where CO2 is allowed to build higher concentrations without any losses. The entire concept of “Greenhouse” gases is a misnomer because the heating that occurs in a typical greenhouse is due to solar radiation and evapo-transpiration (i.e. water vapor) and would remain even if you sealed the greenhouse and replaced the air inside with pure oxygen or nitrogen (which would harm the plant life, but you could substitute pans of water to provide the evaporating water). Ice cores have proven the relationship between temperature and CO2 levels – CO2 rises ONLY after temperatures rise, mostly due to the increased vegetation that occurs when temperatures remain well above Freezing!
Actually, greenhouses warm and stay warm due to lack of convection.
The mechanism of the so-called “greenhouse effect” doesn’t even hold true in a greenhouse, let alone in a convective atmosphere.
I thought the rise in CO2 after warming was due to release of CO2 from warmer oceans. Vegetation uses CO2 and produces O2. Do I misunderstand what I have read here?
SRI, warming oceans will cause a rise in CO2 per Heny’s law. But ice cores show this is with a lag of about 800 years corresponding to the thermohaline circulation. The rise the past century can be shown to be anthropogenic using the changing C12/C13 isotope ratios. See also my Salby guest post a few months ago which disproves and ‘fast’ carbon sink temperature moderated atmospheric CO2 change.
The oceans are not directly warmed by the air above them. So warming due to CO2 should have no noticeable affect on the temperature of the oceans. There may be secondary effects, but the lags would be high.
ristvan,
I’ve seen references to Tyndall, 1859 on many occasions. I have always wanted to read it, but could never find a copy in internet searches. Mostly I keep getting links to a Mike Hulme article on Tyndall. Do you by any chance have a copy that you could link to?
ristvan – thanks for your comment. I will look up your references.
Mr. Penrose – I referred to increased CO2 due to warmer oceans, not warming of the oceans by CO2.
SRI,
Sorry for the misunderstanding.
Plant’s Produce O2 during daylight hours during photosynthesis. At night, they consume O2 and respire CO2 just like almost every other living thing on the planet.
Phil R, his paper was read to the Royal Society (London) in 1860. I believe their records are called the RS Transactions. It is there. Wikipedia has this covered in some detail under Tyndall’s biography, including an illustration of his IR experimental apparatus. IIRC, the apparatus illustration footnote links directly to the original paper. The whole thing is quite famous in physics circles, so there are probably reliable secondary sources as well.
ristvan,
Thank you for your response. I have a copy of his 1861 paper in the Philosophical Transactions. I just always see references to Tyndall 1859 but could never find the paper. Not a physicist (or member of the RS) so that might be part of my confusion. I like his attempt to explain his results in light of the ether theory predominant back then. This might make for an interesting discussion on how even currently accepted theories might be wrong, and how solid, empirical observations might still be attributed to the wrong cause.
Phil R. The experiments were done in 1859. So far as I know, there is no 1859 paper. The first report of the experiments was to the RS.
According to Google Scholar there are two publications by J Tyndall in 1859.
https://scholar.google.co.uk/scholar?q=Tyndall%2C+1859&btnG=&hl=en&as_sdt=0%2C5
Tyndall, J., 1859. Note on the transmission of radiant heat through gaseous bodies. Proceedings of the Royal Society of London, 10, pp.37-39.
http://rspl.royalsocietypublishing.org/content/10/37.full.pdf
There is also in 1861:
Tyndall, J., 1861. The Bakerian Lecture: on the absorption and radiation of heat by gases and vapours, and on the physical connexion of radiation, absorption, and conduction. Philosophical Transactions of the Royal Society of London, 151, pp.1-36.
http://rstl.royalsocietypublishing.org/content/151/1.full.pdf
Tyndall, J., 1861. XXXVI. On the absorption and radiation of heat by gases and vapours, and on the physical connexion of radiation, absorption, and conduction.—The bakerian lecture. The London, Edinburgh, and Dublin Philosophical Magazine and Journal of Science, 22(147), pp.273-285.
Don’t tell me no one has tried to replicate Tyndall’s experiment since 1859. Surely others have confirmed it.
Thank you sz939!
If indeed this greenhouse gas notion was “proved in 1859”, then why haven’t we extended what we know about it since then? We should be building upon this established fact. I want to see any axiom, law, postulate, formula, or anything to reason with, instead we have a dead end theory. Since we haven’t advanced this theory, the whole notion should be under serious dispute.
Perhaps we could change the name to:
Screenhouse Gas – It doesn’t actually trap much and what it does trap we can’t quantify.
Thomas
Al Gore in his movie confirmed that the basis of CO2 warming,is that that in the depth of a glacial phase the CO2 rises, increasing relative density which causes the warming, and the change of state into interglacial. And becuase the CO2 stops increasing at 280ppm, the temperature stops increasing..
This is the foundation stone to the current belief system that more CO2 is going to cause more warming.
This is what the models are based on. Inclusive of the 1859 theory.
The problem is they did not prove or provide evidence that their own theory, that the CO2 saturation increases during the warming period. There is no evidence that the relative density of CO2 increases during the transition from glacial to interglacial. In fact quite the reverse occurs, the relative saturation decreases.
So you have the theory of 1859, which nobody has attempted to replicate.
and you have the theory that CO2 density increases during the glacial to interglacial change of state not proven or qualified. Just talk..
This only proves one thing – incompetance.
Regards.
We could count the bugs.
Come on boys, take any textbook about radiation and absorption and learn something about that topic before commenting…
Here is a scientific explanation by fellow skeptic Jack Barett in E&E:
http://www.warwickhughes.com/papers/barrett_ee05.pdf
A whole world of analyses is based on IR spectroscopy, which wouldn’t exist if there wasn’t the so-called greenhouse effect. Neither would exist the CO2 lasers, which can cut steel at 1200 C:
https://en.wikipedia.org/wiki/Carbon_dioxide_laser
Ferdinand
The paper is good and clear, thanks, agreed.
The warming effects are minimal, but they occur. This has been my understanding.
The paper reports on a continuous state, where only the ppm changes to measure the effects of warming.
However it does not discuss the saturation or density issue during the glacial to interglacial change of state.
To my knowledge no-one has produced a relative saturation curve based on the Vostok or other ice core data, using ppm and temperature. Relative saturation is judge, jury and executioner. Any movement in temperture alters the relative saturation before it moves the PPM. This is a fact of life.The ppm wont move until the relative saturation is in negative equilibrium state creating the need for volume movement. PPM is volume. It has nothing to do with saturation or density, unless you factor in the temperature
CO2 relative saturation reduces during the warming phase, as it does in all similar dynamic equilibriums.
That is the main point.
So, if CO2 density is lower, the warming effect is less, not more. And yet the state changes to interglacial.
If the folks doing the models do not understand this basic movemnt in equilibrium dynamics, the results that they get from the models is nothing like reality. Plus all the other unknowns..
Regards
Ferdinand Engelbeen – from early in the article you linked:
“Their absorption characteristics allow them to act in the retention of heat in the atmosphere”
That is a spurious proclamation with no supporting science. Once that is introduced, any conclusion can be drawn to bolster your claim. But the conclusions are then also spurious.
Please provide any single axiom, postulate, law, etc. … i.e. any actual science.
ozonebust, in An Inconvenient Truth, Al Gore was showed his temperature and CO2 charts next to each other, not overlayed, which would have made more sense to the viewer if his purpose were to educate. But if you freeze frame and look closely, you will see that the temperature went up first. CO2 was a lagging indicator, not a leading indicator as Gore wanted you to think.
ozonebust,
Not direct my area of knowledge, except for measurements of chlorine in air (alarms for an eventual leak) and Cl2 in HCl vapor (HCl production from Cl2 and H2) to maintain an excess H2 in the production unit…
If I did understand what you mean, the real density of the air in glacial periods is higher than during interglacials, thus the relative aborption at low CO2 levels (glacial) was higher than during interglacials at higher CO2.
That is true, but at the other side, the volume of air is higher during interglacials and thus the pathway for IR to pass the atmosphere will be longer and the point where relative more absorption by CO2 turns into relative more outgoing IR will be higher too.
Thus in my (not so informed) opinion, the difference will not be large enough to have much influence…
Thomas Homer,
Their absorption characteristics allow them to act in the retention of heat in the atmosphere
Any EM radiation contains energy. If a foton is absorbed, that increases the energy of the molecule that absorbed the foton. That can be translated into rotational energy, vibrational energy,… With other words, a “temperature” increase of that single molecule.
If the extra energy is re-emitted, that energy is lost. If that is redistributed over other molecules by collissions, the whole lot of molecules will gain a little energy, thus the average temperature and the energy/heat content of the atmosphere rises… That is a matter of conservation of energy.
Thus retention of heat (energy) in the atmosphere depends of the ratio between re-emissions and collissions.
Take the CO2 laser as real life example: An external source gives energy to CO2 molecules, which get into excited state. Much of that energy (~80%) is wasted as heat and the laser needs (water) cooling. 20% leaves the laser as IR radiation and that energy is concentrated enough to melt steel…
Ferdinand
At the bottom of the glacial cycle the CO2 relative saturation is higher. This is a positive state of equilibrium when comparing the atmosphere tyo the sinks.
The atmosphere has remained in a state of positive disequilibrium through most of the transition into glacial state.
The first rise in atmospheric temperature moving out of glacial state causes the atmospheric CO2 relative saturation to reduce and a state of negative disequilibrium occurs in the atmosphere, (the atmosphere is proportionally short of CO2). That is why the ppm follows temperature.
The sinks are colder relative to the atmosphere, so there is a time lag on sink release, despite a receptive atmosphere. With increasing heat the biospheres start digesting CO2 adding to the negative disequilibrium.
It requires this change of temperaure to create volume movement (ppm) out of the sinks.
During ALL warming phases out of glacial state, the atmospheric CO2 relative saturation / density is lower. If it is lower the warming effect is lower.
Therefore any claim to higher density by the CAGW crowd is nonsense. However this is the basis of their theory.
Tim Maguire
You are correct. They relied on the fact that few people actually understand equilibriums, and fewer undestand relative saturation / density as a function of temperature movement.
Right at this moment I am running a system that is changing the depth and characteristics of an equilibrium, by changing the relative saturation relationship between the sink and the fluid at temperature..
Relative Saturation is king.
Ferdinand Engelbeen – Thank you for your response. You described your theory but still haven’t provided any axioms, laws, postulates, formulae, or anything to reason with. We would not be able to derive any of these methods to apply science from a flawed theory. You cannot distinguish your theory from a flawed theory. You’re left describing the details of today’s celestial spheres.
Thomas Homer,
I think that conservation of energy is one of the fundamentals of physics…
If a photon (why English remains on ph for f…) is absorbed by a molecule, its energy is fully absorbed by that molecule. The potential energy of a foton is transformed into the kinetic energy of the molecule.
That is all what can be said: if a certain type of molecule absorbs certain photons with specific wavelengths, that increases the kinetic energy of a gas where that kind of molecules is present and where photons of the right wavelength are passing by and reverse for re-emitting photons at the same wavelength.
What the net effect of this all is, is mainly a matter of ratio between re-emissions and collissions. All other variables being equal.
Convection, condensation, clouds, rain,… all play a role in the ultimate result…
Ferdinand,
English uses “ph” instead of “f” for all words coming from Greek with the letter “phi”. Hence photography, philosophy, physics, etc.
and Philip
sz939,
Tyndall’s experiment had nothing to do with a glass bell jar or a greenhouse, see the description at:
https://en.wikipedia.org/wiki/John_Tyndall
What Tyndall did was quantitatively measuring the IR absorption by different gases and mixtures, with as conclusion that water vapor was the strongest IR absorber.
Both the increasing absorption of IR by increasing CO2 as good as the backradiation to ground are measured: the former by satellites measuring the outgoing spectrum, the latter at two stations (Barrow and ?) over time.
No matter how the extra heat radiation retention is further distributed, enhanced or reduced by feedbacks, the effect of more CO2 is more warming of the lower atmosphere.
While calling that a “greenhouse” effect is indeed a misnomer, it is the nearest simple explanation of the effect for lay people. Not to be taken literally…
Ferdinand,
What you say is true, but the ramifications of the increased IR absorption by the additional CO2 is the real point of contention. The max daytime temperatures, which is what is most important to the vast majority of the biosphere, is capped by the solar input and the density of the atmosphere. Changes in energy transport can only reduce this maximum, and in this role, CO2 is a bit player. It is swamped by H2O, conduction, and convection. The most it can do is slightly retard the night time cooling. And this is exactly what we see when we examine the min and max temperatures separately; the max has remained quite steady, but the mins have increased. Translation: no disaster. This is what we need to be talking about, not the Tyndall strawman argument.
Paul,
Largely agreed…
The problem is that (too) many skeptics use these wrong arguments in discussions, while that undermines their credibility where the real discussion should be: the (minimal) effect of all that extra CO2…
Ferdinand Engelbeen July 6, 2017 at 2:01 pm says
the (minimal) effect of all that extra CO2…
“Extra” CO2? What baseline are you referring to?
Just how much of the problem with the models is due to the changes in reported temperatures from the 1980’s and early 1990’s reporting, showing a marked decline from the 1940’s to 1975, and the post 2000 reporting of temperatures showing much less decline?
Spot on. Since there is no way to run a “controlled” experiment on planet Earth, there is no way to untangle natural variation from anthropogenic forcing. You are then left with a conjecture – an untestable guess – as to the effects of CO2 on temperature. It could be less than equal to or greater than what the models project, depending on whether the underlying natural variation is warming, not effecting or cooling the planet.
Trebla:
You make this mistaken assertion
Sorry, but such a guess is NOT the proper scientific conclusion.
To date no recent global climate behaviour is observed to differ from previous behaviour(s) of global climate in the holocene. And there is no reason to postulate any novel effect when a system’s behaviour is not observed to differ from previous observed behaviour of the system (i.e. parsimony).
Therefore, the ONLY scientific conclusion which can be made concerning observed recent climate changes is that there are no discernible effects on global climate that differ from the previous and natural effects that have operated on global climate in the holocene.
This is an important finding because it indicates, for example, that there are no significant effects of the observed recent increase to atmospheric CO2 concentration.
This indication is because an effect that cannot be observed is too trivial for it to have discernible consequences (discernment of its consequences would be observation of the effect).
Richard
I think, “We don’t have anywhere near enough good data to have any idea what is going on.” , is a valid conclusion as well.
Just how “concentrated” is 4 parts per 10,000, anyway.
In such conditions, if you were an IR photon that was emitted from a molecule that was a part of the surface of the planet, how high would you fly on average before you had an opportunity to “stimulate” a molecule of atmospheric CO2? What are the odds that you would reach outer space (in a few microseconds) as a missed opportunity?
“an effect that cannot be observed is too trivial for it to have discernible consequences (discernment of its consequences would be observation of the effect).”
Well said Richard!
Jean parisot, no! Richard is correct. That there is no difference detected that climate is acting any different today at the higher concentration of CO2 than previously. Either CO2 has only a marginal effect or none at all on temperature. That is the only conclusion one can make at present.
You elevate an hypothesis of AGW too high on a lab experiment. It is a better supported hypothesis, accepting Tyndal’s experiment, that other factors in the planet’s dynamics counteract the change that a sIgnificant increase in CO2 was expected to cause. Look up Bertrand Russell’s Tea pot.
There is no physical reason why 35%more CO2 would delay its temperature response now to hit us later. There is zero reason to think that natural variation doesn’t exist. So we know for sure that the effect of CO2 must not be near as strong as proponents make it our to be.
Now consider the observation that the planet is greening substantially (14% more forested area than a decade ago, plus growing fringes around arid areas, plus growth in phytoplankton populations in the sea). Obviously a substantial reduction in rate of CO2 growth in the atmosphere due to photo synthesis. Note this growth is exponential and is an endothermic (cooling) reaction! Add plants to Tyndal’s experiment. Let Tyndal’s bell jar heat and evaporate water to rise and emit infrared to outer space. There is also the energy of winds and currents driven by heating that should be subtracted.
Now maybe there is a very small residual effect remaining, but not necessarily so. That is what the evidence tells us every day.
The plankton aren’t waiting around for the debate to end. Neither are the trees.
“When the map and the terrain differ, believe the map” — Warmists.
Excellent analogy!
Yes, there are far too many knobs and dials that control climate ‘models’ and with this many degrees of freedom I can make any model behave any way that I want it to.
Yes, it is just a multivariable curve fit. You can always fit it to the past. But, there is no basis to presume that it has predictive power.
I also strongly suspect that an absurdly high sensitivity is baked into the models, either directly or indirectly and that to accurately curve fit the past to a high sensitivity means that the model must be too warm in the future to account for the unmanifested warming trend that a high sensitivity predicts.
Sounds like another falsification test to me …
That is correct. It is indirect, and was made explicit by AR4 WG1 backmbox note 8.2. Details in the long footnoted climate chapter of ebook The Arts of Truth. In short, the models are programed to produce constant relative humidity so the water vapor feedback is too high. See also essay Humidity is still Wet in ebook Blowing Smoke.
clearly articulated, thanks
It seems to me (just logical = I don’t know) that even with grid cell size reduction and less parameter tuning, the attribution issue can’t go away until we know about natural variation.
BC, that is correct. But the grid size thing is about 6 orders of magnitude. The new superest duperest Chinese supercomputer is one order of magnitude faster than the US current best. So parameterization and the attribution problem highlighted will exist for a very long time.
Its because that’s literally the direction they’re being biased to turn and being pushed in.
A linear progression IS NOT A MODEL OR A MODELE’, IT IS A PLAN.
,
Well if the person opposite is “watermelon” communist, there is little value in your arguments. You will not change thier mind with facts because their opinion is not based on facts, it is a political position : a motivated agenda.
However, all this terminaology does is underlines your own political bias and prejudice against anyone who has been fooled by the hype.
As I have pointed out before should reign in the smug name calling if you want to advance a scientific point.
This kind of information may be useful in talking to people who have bought into the constant barrage of disinformation but who are NOT” warmunists”.
The term honors past Czech president Vaclav Klaus, who pointed to the analogy in his 2007 book Blue Planet in Green Chains.
Most of the people pushing the climate alarmist agenda are not scientists and have no understanding of The Science. Their motivation is political. E.g. The recent election campaign by US Dems. Anyone on the receiving end of their propaganda and “info-memes” will attest this. An attempt to debate them will, generally be greeted with insults like shill or denier.
In any debate, the purpose is to convince the audience, not your opponent. As such, you are advised to never take the bait. Stay calm, reasonable and win the moral argument by keeping one’s temper.
1920-1945 is essentially indistinguishable to that from ~1945-2000
That should be 1975-2000
Correct. My bad.
Fixed. I hate typos. Rud, thanks for an interesting post
w.
Double thanks. For the fix and the (from you) high praise. Highest regards.
“2. The Earth is warming. …”
Yes, but it started much earlier then the ending of LIA. It started to warm ‘near’ the end of the last ‘Ice Age’ ~28 000 years ago.
By that standard we can say that the Earth has been cooling since the end of the Holocene Climate Optimum.
Agree and according to previous cycles, it’s a relatively fast process … Hopefully not in near future, as where I live will be inhabitable again …
… but we really don’t know for sure …
Some people can’t deal with, that in perspective, humans and other species are small, very small, in several ways. It causes dents in their ego.
Although 35% of the CO2 increase so far took place this century, a slightly smaller percentage of the increase (I figure 30-31%) of its effect took place this century, because its effect is logarithmic.
Once again – the first figure is deficient in that it should have a vertical line on the date the models are run. Otherwise it is unclear which portion of the model run represents hindcasting and which represents forecasting/predictions/output/data/results (whatever term is being used these days). Without such a vertical line it appears the models were valid instead of simply tuned to known data. Any graph showing model output should have a vertical line on the year they were run.
Huffpo seems to think that ‘red’ team and ‘blue’ team are something to do with republicans and democrats.
See here:
http://www.huffingtonpost.com/entry/epa-climate-red-blue_us_59568718e4b05c37bb7e126f“
“Huffpo seems to think”
Well there’s your first mistake.
fake news if there was ever fake news
And R. W. Wood disproved it in 1909.
That’s the scientific reason. Then there’s the funding reason that without hot models projecting dire consequences there is no increase in funding. And the political reason that without a fake crisis demands of more government don’t stand a chance.
Both the temperature record and the satellite sea level record have been adjusted to support the viewpoint of government funded science. Anyone with modest Excel abilities can prove this to themselves with a short trip to the Internet Archive: Wayback Machine
Additionally NOAA’s Climate at a Glance website has temperature and precipitation data for the United States back to 1895 making it fairly easy to demonstrate that not all of what is claimed in the popular press is exactly so.
1) Per IPCC AR5 Figure 6.1 prior to year 1750 CO2 represented about 1.26% of the total biospheric carbon balance (589/46,713). After mankind’s contributions, 67 % fossil fuel and cement – 33% land use changes, atmospheric CO2 increased to about 1.77% of the total biosphere carbon balance (829/46,713). This represents a shift of 0.51% from all the collected stores, ocean outgassing, carbonates, carbohydrates, etc. not just mankind, to the atmosphere. A 0.51% rearrangement of 46,713 Gt of stores and 100s of Gt annual fluxes doesn’t impress me as measurable let alone actionable, attributable, or significant.
2) Figure 10 in Trenberth et al 2011jcli24, in addition to substantial differences of opinion, i.e. uncertainties, 7 of the 8 balances considered, 87.5%, showed more energy leaving ToA than entering, i.e. atmospheric cooling.
3) Even IPCC AR5 expresses serious doubts about the value of their AOGCMs (IPCC AR5 Box TS.3) and Key Uncertainties (TS.6) (IPCC AR5 Box TS.3).
The sea ice and sheet ice is behaving as usual for decades (DMI) and does not affect sea levels. Polar bear population is the highest in decades, the weather (30 years = climate) is less extreme not more, the sea level rise is not accelerating, the GCM’s are repeat failures, the CAGW hypothesis is coming unraveled, COP21 turned into yet another empty and embarrassing fiasco, IPCC AR6 will mimic SNL’s Emily Letilla, “Well, neeeveeer mind.”
The BEST effort, although compromised by depending on unreliable surface temperature measurements, nonetheless provided one of the strongest arguments for natural variability–the measurements pushed back the beginning of the warming to 1800, adding about 50-80 years of warming to the other surface temperature databases. If I remember correctly, the BEST warming from 1800-1880 was on the order of 0.7 C.
See also this article in Geophysicla Research Letter:
Attribution of extreme weather and climate events overestimated by unreliable climate simulation
https://upcommons.upc.edu/bitstream/handle/2117/85869/Attribution%20of%20extreme%20wather%20and%20climate.pdf
Models run hot as a result of biased parameterization. Maybe, but that should be easy to fix. Just “tune to the balloons”. Seemingly that could be done in a week.
My sense is the problems are bigger than that. Baked in misconceptions regarding CO2 saturation, and treating water as “feedback only” come readily to mind…
Rud, thanks for the post. I have been asking you for some details about the average of 102 models graph.
A question about the warming period circled in red. I recall reading a comment (or a post by Lindzen here at WUWT) about Ross McKitrick weather station drop-out paper saying that most of that warming was due to a change in the number of weather stations used to calculate the temperature. During the nineties the number of weather stations used to calculate the surface temperature anomaly located at airports went from 40% or so to about 80%. I am guessing that the vast majority of the drop-outs were from the northern hemisphere since there were fewer weather stations in the southern one. So, is there any difference between the warming of the northern and southern hemisphere during the 1980-2000 period? and if there is, can this difference of warming be used to calculate the fraction of (artificial) warming introduced during the weather station drop-out?
I read McKitrick’s analysis. His argument is that the ‘recent’ station drop out biases the global record toward a lower latitude average having a higher averagetemperature. Here is the problem with that. What is plotted above is the anomaly, not the temperature. And the way the global anomaly is calculated is as a sum of individual GHCN anomalies. This is essntial. So his argument, while true, doesn’t matter to the global anomaly record. There are plenty of other problems with both the blue and red circled eras. See essay When Data Isn’t for a number of examples.
There is a difference between NH and SH temp histories, true. But how much is just insufficient SH coverage dunno. Parts of South America and southern Africa have very poor GHCN long term coverage.
Forget ‘during the 90s’. I recall an animation I saw, probably here, showing the sites on a wirld map over time. IIRC in 1990 there is a dramatic cut-off, and I mean dramatic. Watching the animation is evidence that someone deliberately selected ‘useful’ sites, and by ‘useful’ I mean useful to the narrative.
Solar variability and anthropogenic forces acted together to increase heat on the planet for over a century, and the whole of a system is often greater than the sum of its parts.
A confluence of processes and events, interacting with progressive complexity or chaos.
Has anyone seen this yet?
Found it on GreenieWatch.
Their model is able to explain the temperature of rocky celestial bodies and show that atmospheric composition isn’t much of a factor.
A key entailment from the model is that the atmospheric ‘greenhouse effect’ currently viewed
as a radiative phenomenon is in fact an adiabatic (pressure-induced) thermal enhancement analogous to compression heating and independent of atmospheric composition.
https://www.omicsonline.org/open-access/New-Insights-on-the-Physical-Nature-of-the-Atmospheric-Greenhouse-Effect-Deduced-from-an-Empirical-Planetary-Temperature-Model.pdf
Very interesting, this is what we’ve been screaming about in regards to Venus ever since Hansen created the sci-fi meme that Venus was hot because of CO2. You’d think composition would still have a measureable effect, especially when water vapor is present.
And maybe the water vapor is exactly why Earth is slightly warmer than the best of their models predict. This paper is a big fat nail ready to seal the climate cult coffin forever.
The first reference is to Volokin and ReLlez, which has been withdrawn. Nothing new here, anyway; this was all published previously. Calling these curves “models” is a stretch. Four coefficients, only five planets. The whole thing is out on a limb. A twig. .
It was withdrawn because the authors used pseudonyms to get it published. Now how is the paper wrong? Can you show how their four coefficient models fail to predict the temperature of any rocky planet or satellite?
At your link:
Venus Earth Moon Mars Titan Triton
“The average near-surface atmospheric densities (ρ, kg m-3) of
planetary bodies were calculated from reported means of total
atmospheric pressure (P), molar mass (M, kg mol-1) and temperature
(Ts) using the Ideal Gas Law, i.e….”
It’s my opinion that when the basis of an approach relies so much on the ideal gas law, it’s going nowhere.
Long-term natural cycles run hot and cold too. Gee, I wonder how they relate?
“greenhouse” gas retarding radiative cooling…. experimentally proved
In isolation, then extrapolated to global extremes. This is why the models, “hypotheses”, demonstrate low skill to reproduce, forecast, let alone predict, temperature or climate change, in the past, present, and future.
Incompletely and, in fact, insufficiently, characterized, and unwieldy. Hence the need for a science philosophy and method where accuracy is inversely proportional to the product and space offsets from an established frame of reference (i.e. scientific logical domain).
Why the continued use of this chart?
The hind-casting from Mount Pinatubo make the models look more accurate than they really are. The apparent correctness is fake. A better graph would be a difference of mean model from observed temperature over time. Another approach would be to just smooth out the hind-casting dip. I’ve seen this chart a hundred times and disappoints me each time.
Interesting point about the average grid resolution of the models being 280 km or so. There are two issues that arise that I can see. I speak from the experience gaine I learning the hard way when first using CFD software to model flow around a ship hull – I am a naval architect by profession).
Firstly, that distance is way larger than the size of tropical storms and cumulus cloud formations which are the mechanisms that actually deliver much of the heat-water vapour LHV energy transfer tin the atmosphere. The ‘models’ cannot therefore be ‘modelling’ the actual phenomena using the Navier Stokes equations so must just be using a ‘fudge factor’ driven simplistic formula to mimic nature, fitting her with a fig leaf and then asserting the size and details of what cannot be seen. The model I was using only looked at ‘potential flow’ ( i.e. flow of a frictionless fluid) and ignored turbulence as it occurs at much smaller scales than required to look at wave wake formation and the curvature of the hull shape. (calculation times would not double but increase by 2 – 3 orders of magnitude).
Secondly, there is a potential ‘false convergence’ problem with a model mesh size that is larger in size than the fluctuations of the phenomena you are ‘modelling, in my case the wave wake formed by the ship moving through the water. My mesh size was too coarse to properly model the steeper bow waves and the code converged to a false solution that yielded a much higher bow wave. Sound familiar?.
I was able to pick it very quickly because I had photographs of the vessel operating at service speed and knew more or less what the result should be (this was an job to model new bulbous bows on the vessel).
Clearly, committed CAGWarmistas would have just laughed me out of the place and concluded that the photographs needed some touching up to reflect virtual reality.
Add that to the so called surface temperature record raw data simply being utterly unfit for purpose due to UHI effect and all that ‘data from a bucket’ biases and there is not much left of the CAGWarmista case. I don’t generally defer to the lawyers but gee whiz, I really would like to see a top shelf prosecutor have these swine in the witness box.
Your ‘fudge factors’ are the GCM parameterizations that then get tuned to hindcast.
Regarding tuning, IPCC uses fine words to describe an ugly practice:
«When initialized with states close to the observations, models ‘drift’ towards their imperfect climatology (an estimate of the mean climate), leading to biases in the simulations that depend on the forecast time. The time scale of the drift in the atmosphere and upper ocean is, in most cases, a few years. Biases can be largely removed using empirical techniques a posteriori. The bias correction or adjustment linearly corrects for model drift. The approach assumes that the model bias is stable over the prediction period (from 1960 onward in the CMIP5 experiment). This might not be the case if, for instance, the predicted temperature trend differs from the observed trend. It is important to note that the systematic errors illustrated here are common to both decadal prediction systems and climate-change projections. The bias adjustment itself is another important source of uncertainty in climate predictions. There may be nonlinear relationships between the mean state and the anomalies, that are neglected in linear bias adjustment techniques.»
(Ref: Contribution from Working Group I to the fifth assessment report by IPCC; 11.2.3 Prediction Quality; 11.2.3.1 Decadal Prediction Experiments )
I wish politicians could understand the meaning of that section.
It seems clear then that the ‘hindcasting’ is not run very well or too far back that it has to deal with inconvenient truths. That said hindcasting to what? ?’adjusted’ surface data records using an unfit for purpose set of instruments? It is one thing to let people know what their local temperature is where they live UHI effects and all but quite another to use that to accurately estimate a global value to a precision such as to reveal meaningful variations. Maybe its the tuning that is the problem. That said a coarse mesh model has its fundamental inadequacies in modelling nature and the result is still fudge factors. The issue is how accurate are the ‘fudge factors’ / ‘GCM parameterizations’.
“Dr. Richard Lindzen, MIT professor emeritus, first made the observation that the period of warming from ~1920-1945 is essentially indistinguishable to that from ~1945-2000. This is readily apparent visually, and is also true statistically.”
This fact means that the warming to date provides no evidence to support AGW, no evidence to support the greenhouse effect and no evidence to suggest any future climate trend.
In fact, it does more than that. The hiatus suggests that there is no greenhouse effect, While we cannot provide evidence that the later warming is natural, AGW or a mixture, the balance of evidence is GHG has no effect.
The entire global warming hypothesis is based on what evidence?
“To properly model essential climate features like convection cells (thunderstorms), a grid cell needs to be less than 4km on a side. “
According to this post, the main reason behind the fact that we cannot predict future climate by computer modeling is that there is weather on the Earth. I find this rather funny.
“According to this post, the main reason behind the fact that we cannot predict future climate by computer modeling is that there is weather on the Earth.”
The reason they don’t use “a grid cell less than 4km on a side” in their models, is because of a lack of computing power.
Warmists could try a different kind of climate modeling except current GCMs suite climate alarmists for at least 2 reasons: (1) They claim their models are simulations, (2) Projections from the models have long tails reaching as far as 9ºC/10ºC climate sensitivity for the hotter running models. The curve may have a very low probability there but they still claim there’s a ‘chance’ that the climate could send us to hell. Indeed an alarmist visited this site a few weeks ago and said just that. I think Lindzen makes this point too in his essay in Climate Change : The Facts (2015). I also make the point too: They have to pose an existential threat to humanity otherwise we wouldn’t even remember their names. We are very sensitive to threats against our existence.
A famous, Nobel Prize winner said that when experimental observations contradict theory, the theory is wrong.
The great man. Richard Feynman
Nitpick: Dick Lindzen was not the first person to note the similarity of the early 20th century warming to the 1976-97 period. Anyone with eyes could see it, even before the end of the second warming.
From page 55 of Sound and Fury, published in 1992 and written by yr. obt. svt. in 1991:
“In the overall record, the most prominent feature of the past century is a rapid warm-up of 0.5 [deg] C (0.9[deg]F) that took place between 1915 and 1930. Because that increase occurred so early, it could hardly have anything to do with the enhanced greenhouse. Thus, the “natural” variability–how much climate changes with or without human influence–of the Northern Hemisphere must be on the order of at least 0.4 [deg] C…”
And I am 100% certain several other had previously written or said something similar.We really don’t know who first noted this, but it is rather obvious.
PJM
Thanks for the note. Have the temperature models been changing that early warming to minimize or eliminate it?
I am referring to the manipulations of the raw data (BEST, HADCRUT, etc.)
Indeed it is obvious! I made the point half a dozen years ago idependently, noting that the slope of the warming trend ~1975 – 2000″was the same as the one 60yrs ago, indicating that any CO2 warming was modest indeed. I’m not a climate scientist but felt I’d joined the club!
“Nitpick: Dick Lindzen was not the first person to note the similarity of the early 20th century warming to the 1976-97 period. Anyone with eyes could see it, even before the end of the second warming.”
This Hansen 1999 U.S. surface temperature chart shows a much better, and truer view of the time period in question, than does the bastardized Hockey Stick chart:
The C-AGW argument requires a chain of arguments all of which must be true or they don’t get the full C, A, G and W effect. Nobody should argue the CO2 impedes long wave IR into space. Energy from the Sun is mostly received at the surface. Energy is radiated into space from the top of the atmosphere. The more IR opaque gas there is in between, the larger a temperature delta is necessary to transport IR from the surface to the top (excluding transport via evaporation/condensation).
It is not clear to me that most people are careful to distinguish the effect of CO2 in dry air, versus CO2 in water vapor saturated air, but it appears that some people handle this appropriately. As such, I am inclined to think that CO2 doubling has little effect in humid tropics, but larger in dry 40 Latitude desert areas?
In any case, the direct effect of CO2 doubling is not large enough to account for observed warming + adjustment effects, so a large amplification feedback is invoked.
The claim is that a weak CO2 effect controls a strong feedback for a significant impact in GW.
To make this argument, it must be claimed that there is no natural variability, which would also get amplified by strong feedbacks, as the proposed feedback mechanisms is influenced by temperature and not exclusive to CO2. Hence, the miracle hockey stick, which wiped away natural variation, making Mann the hero/savior/Christ figure to the C-AGW zealots.
To further deny the existence of natural variability, the sun must be nearly constant. By narrowly looking at TSI over a limited period, and by averting their gaze from other impacts, the conclusion is the Sun cannot be responsible for observed temperature between 1970-2000. Of course, TSI may not be nearly as steady as claimed over longer periods, and besides, would not small TSI variations also be amplified? Then the AGW theorist further ignore non-TSI solar effects, i.e. the stuff the might impact cloud formation etc, be it Svensmark’s cosmic ray or Corbyn’s SLAT.
Another part of the C-AGW claim of proof is climate models. Here on this site, many people denigrate computer models, and even the C-AGW are beginning to downplay the contribute of models. I would suggest not blaming the computer, which is only does what it is programmed to do. What needs to be evaluated is whether the “model” correctly models important effects, including which are not modeled at all, and of course: are the input parameter correct? Otherwise, the model output will correctly assert that adding heat and insulation leads to warming, but not necessarily that CO2 is climate control knob.
Joe, collisions are much more frequent than photon emissions by excited CO2. This can then lead to the relatively huge number of water vapour molecules sharing the heat and radiating it to space. Where is this taken into account?
That, I think, is really the nub. I have a longish post coming up on it, if it ever gets through the reviewing queue.
as per quantum mechanics, there is a probability of absorption, a probability of emission, a probability of direction and a probability of multiple reabsorptions. Those probabilities are not functionally additive and combining them mathematically has become beyond me since I hit 60yrs.
It’s not apparent to me why too low CO2 C.S. implies negative feedback. Not unless 1) you exclude all other factors apart from man-made warming, 2) you conveniently discover that your GCMs have long tails predicting a tiny chance of catastrophe. Those are both political factors. Scientists here underestimate the role of politics in how it channels climate alarmists to present their argument in the form that it’s made.
Much like Linear No Threshold (and the demonization of anyone who contradicted it) seem, to me, an essential part of the anti-nuclear movement. Greens will always pose their strongest arguments as existential threats to humanity.
That’s not what Gavin says. There is a new article on Bloomberg…
“Gavin Schmidt, director of NASA’s Goddard Institute for Space Studies, said that new paper provides independent backing for recent work from his unit and elsewhere. He concludes that projections of future warming derived from recorded temperature trends “are biased low.””
https://www.bloomberg.com/news/articles/2017-07-06/global-warming-might-be-speeding-up
That is where Gavin’s bread is buttered.
Gavin also said:
“The refusal to acknowledge that the model simulations are affected by the (partially overestimated) forcing in CMIP5 as well as model responses is a telling omission.”
Gavin Schmidt (Climatologist, climate modeler and Director of the NASA Goddard Institute for Space Studies (GISS) in New York). (See Comment 17)
Rulers run hot too if you don’t know what you’re doing with them.
The entire Red Team vs Blue Team exercise would be fantastic, but it answers itself once it’s described as such:
On one side we have actual science that shows:
– Carbon Dioxide is the only throttle in the Carbon Cycle of Life. (All of the carbon in the carbon cycle funnels through Carbon Dioxide.)
– Carbon Dioxide is the base of the food chain for all Carbon Based Life Forms
– Carbon Based Life Forms require Carbon
And on the other side we have:
– the invented term: ‘Settled Science” as a way to construct an argument when no actual science is available
– no laws, no axioms, no postulates, no formulae, nothing to reason with
So, one side explicitly proves that Carbon Dioxide is essential to life, More CO2, more potential life. It should take compelling science to convince humanity to restrict global CO2. Settled Science is not compelling science.
Main reasons why!
1) CO2 being a greenhouse gas behaves differently between atmosphere, land and oceans.
2) CO2 requires circular reasoning with positive feedback that does not exist.
3) Solar energy greatly influences all SST’s. (differences down to ocean circulation and upwelling)
4) Oceans are the only/main thing that can disguise solar influences.
5) The main greenhouse cause is not actually a gas (even water vapour), but heat retention in the oceans.
6) Solar influences on short term cycles never reach equilibrium.
Ignoring a lot of science against their views in determining no/little natural influence greatly shows up in models. They have only been looking for AGW influence not natural causes, so their judgment on anything else has made them to be a bunch of charlatans.
As a chemist I know all about IR spectroscopy but it a big leap to accepting global warming. However, I realise that “the science is settled” on this one.
Looked at another way, what is causing the hiatus? apart from a blip due to a known effect, it looks as though the temperature is returning to its current “normal ” level.
Either there is a natural climate driver that is negating global warming due to increased carbon dioxide, or there is nothing happening.
Oh dear.
Indeed we may start with the opposite theory: all waming/pause is natural variability with a wavelength of 60-80 years (PDO?). The only influence of the extra CO2 then is in the difference in slope: while the increase 1910-1945 and 1975-2000 are near identical, in 1945-1975 there was a small cooling, while 2000-2014 was flat.
Thus the difference in slope for the two “pauses” may be the small influence of the increase in CO2…
may also be a different set of ENSO
The other part of Point 3. which needs to be considered is, “predict this will continue to catastrophic levels.”
I’m happy to concede that without CO2 in the atmosphere the global average temperature would be cooler than now. Some estimates say 30 deg C cooler, Lindzen has suggested only 2.5 deg C cooler. If Lindzen is right then a bit of extra CO2 even doubling will produce only a small increase in temperature. If 30 deg C is correct than we have had a massive temperature change without any catastrophic climatic events unless you view the world’s current climate as catastrophic (I don’t). Either way why should it suddenly become catastrophic and for who? It’s different to say catastrophic breaking in a piece of wood being bent till it suddenty breaks in a mathematically catastrophic way.
The catastrophic part is ‘necessary’ to force unviable mitigation solutions onto the public while extorting $100 billion/year for the Green Climate Fund. Except no part of the catastrophic stuff is credible. Covered sudden SLR, ocean acidification, extinctions, and extremes in several essays in my most recent ebook, Blowing Smoke.
Thanks Rud, Blowing Smoke is now on my tablet awaiting my holiday. Cheers
CO² is not the only IR absorptive gas in our atmosphere. The calculated 30K is still contested by some. There are some who believe that atmospheric weight can be shown to provide the effect we see.
PV=nRT. P = 1BAR at surface close to 0 at TOA V = volume (assume constant) R = ,gas contant T = temperature ~ PV/R or P Therefore as pressure rises temp rises. n = 1 mole of gas.
Huge number of assumptions in this equation and calculating the effect precisely, well difficult. Hence controversy.
Imagine an earth without atmosphere, add one non IR absorptive molecule and it will bounce about between ground and TOA with an average Kinetic Energy, max at surface and 0 at TOA. Then add another and keep adding. The surface temperature will not rise at each addition. Eventually you will have a full atmosphere with no warming of the surface and a higher TOA at 0K. If this atmosphere causes 30 deg C warming at the surface please explain the mechanism.
Rud
A very nice clear easy to read post – thank you.
With all of the cash thrown at supporting the theory of CO2 warming, one would have thought that are mere pittance could be used to prove the conerstone theories that their forcasting is based on. See my comments above.
Regards
OzoneBust, thanks for the complement. Nice to be appreciated. I am trying to be of service here.
As for your above comments on saturation, please read essay Sensitive Uncertainty. The CO2 Greenhouse effect NEVER saturates, because the effective IR escape level ( the so called effective radiative level, ERL) can always go higher. Higher is also colder, which is the physics behind the log CO2 doubling relationship.
Regards. You are almost a climate Jedi.
Rud
My comments on CO2 saturation are only focused on the atmospheric CO2 densiity not the actual greenhouse effect on the CO2 saturation.
Eventually I will put together a post to identify what happens to relative saturation during temperature movements within equilibriums. Currently working on sea ice, now that is an interesting one.
Also a report on the 2016 Hurricane Matthew, why is weakened approaching Florida.
Always enjoy your posts and comments.
Does that mean I get a green saber ?
Regards
I completely agree. It was informative and a pleasure to read.
They run “hot” because they are politically forced to do so. End of story.
I was recently reviewing some old WUWT articles that I had saved for future contemplation, particularly this one from Tom Vonk, and it finally clicked with me.
If you look at the outgoing TOA spectrum, it is clear that there is a good sized chunk of the outgoing spectrum taken out by CO2.
http://www.xylenepower.com/Mars_EarthM.gif
All things being equal, it certainly appears necessary that, if that radiation is not getting out, the entire curve must move higher, i.e. surface temperatures must rise, in order to get the same area under the curve one would get if the divot were not there, i.e., to establish equilibrium of outgoing radiative energy with incoming.
So, clearly, the GHE must exist, and CO2 must contribute to it.
But, what does this say of the dependence of the GHE upon the concentration of CO2? Is it a monotonic dependence in which more CO2 will always take out more of the spectrum, requiring greater surface temperature to preserve the integrated area? Or, is there a point of diminishing returns? Perhaps even an inflection point, where the divot starts to shrink, and the impact of greater CO2 concentration actually produces net cooling? Is the functional dependence perhaps something like this:
http://i1136.photobucket.com/albums/n488/Bartemis/co2surftemp_zpsd400ef15.jpg
whereby the effect is always positive (secant line) but locally negative for a given atmospheric state (tangent line)?
In Vonk’s write-up, he explains that the cartoon explanation of the GHE, that the surface radiates IR energy up, which is blocked by the CO2, and half of which then radiates back down, is wrong. (Actually, we can see immediately from the spectrum above that this is incorrect, as the divot could never be deeper than 50% below the asymptotic blackbody curve, yet here, it is much deeper).
The intercepted surface radiation is generally not directly re-radiated. The mean time to re-radiation is much longer (by orders of magnitude) than the time to collision with other atmospheric particles. When collisions occur, energy is exchanged, and excited CO2 molecules pass their energy along to the other atmospheric constituents. Some of the intercepted surface radiation is re-radiated, but most is passed along to other atmospheric molecules.
But, this is a two way street – energetic atmospheric molecules pass on their energy to excite the IR emitting modes of the CO2 molecules. When those CO2 molecules so excited emit, they are acting to cool the atmosphere.
Ultimately, for a given solar input, surface radiation, and atmospheric composition, a steady state is reached. In this steady state, CO2 molecules are both heating and cooling the atmosphere – heating it by intercepting surface radiation, and passing it along to other atmospheric constituents, and cooling it by accepting energy from those atmospheric constituents and radiating it away.
So, if we have reached a steady state, and we increase CO2 concentration, what happens? Increasing the concentration increases the amount of surface radiation intercepted. But, it also provides more outlets for other atmospheric constituents to relieve themselves of their pent-up energy. Actually, more so, because the surface radiation is only coming from one direction, while the other atmospheric constituents are coming in from all sides.
So, do we get greater heating, or greater cooling? Or, might we be at a point where there is no net change, where the greater heating and cooling potentials essentially cancel each other out?
I suspect it is the last, that we are at a point where they essentially cancel out. I will give my reasons in another post sometime, but will put this out for others to ponder for now.
Bart,
In general, I do follow your reasoning with only a few points where I have comments:
According to Jeff Id, the ratio re-emission to collission for excited CO2 at 1 bar air pressure is about 1:10,000:
https://noconsensus.wordpress.com/2010/08/17/molecular-radiation-and-collisional-lifetime/
At lower air pressures that shifts towards less collissions and thus more re-emissions.
That there is increased backradiation by increased CO2 was actually measured at Barrow and Oklahoma:
http://newscenter.lbl.gov/2015/02/25/co2-greenhouse-effect-increase/
and outwards more IR retention in the CO2-band was measured by satellites. Thus the effect is going both ways, not necessary 50/50.
If the absorption / radiation / collission by CO2 is acually cooling or heating the atmosphere is mainly a matter of re-radiation/collission ratio. That is more collission at lower heights (the troposphere) and more (outgoing) radiation in the stratosphere.
More CO2 in general will give more warming, as can be seen in the outgoing spectra of Modtran. Modtran is a reduced resolution calculation program based on Hitran. The latter was developed for the calculation of the absorption/transmission of any mix of GHGs at any height of the atmosphere and is based on data obtained in laboratory conditions. The total calculation is from using the layer by layer (=pressure) spectra up to the desired height. One can make the calculations by choosing a lot of parameters of greenhouse gases, water vapor feedback, clouds or not, rain or not and the “1976 standard atmosphere”, that is with all the measured parameters of clouds and rain of the year 1976. See:
http://climatemodels.uchicago.edu/modtran/
For 280 ppmv, standard atmosphere, no clouds or rain, fixed RH:
upward at 70 km height: 268.564 W/m2
For 560 ppmv, standard atmosphere, no clouds or rain, fixed RH:
upward at 70 km height: 265.613 W/m2
2.9 W/m2 more are retained in the cloud free atmosphere for the same ground temperature for a CO2 doubling. By increasing the ground temperature with about 1 K one reaches the same outgoing energy as for 280 ppmv CO2…
Thanks for looking, Ferdinand. I am trying to reason this out. I am certain the impact is essentially nil for reasons you and I do not need to go into in this discussion 😉 So, the question becomes, why is it essentially nil?
It seems pretty straightforward to me – if greater concentration is taking out increasing amounts of TOA radiation, then there must be heating. I think this is why the AGW advocates hold onto the hypothesis so tenaciously. They are just certain that, if less radiation is making it to space in that band, there must be heating. And, I would have to agree at this point in time. There does not appear to be a way around it.
So, the question then becomes, what are the weak points in that argument? The most obvious, and first I want to plumb, is that while a given level of CO2 produces a particular gap, it is an assumption that increasing concentration will produce a greater gap, and it is projected to do so in logarithmic fashion. But, it is not proven that this is so, or at least not yet to my satisfaction.
There are studies in which this has been tested, to some degree or another, so what do they say?
You bring up the one that is looking at the downwelling radiation at the surface. But, it is TOA that we are interested in. It stands to reason that, if other atmospheric components are thermalizing CO2 in greater profusion, then there should be more downwelling radiation in any case. So, this test is not really applicable.
I don’t think the question can be resolved by models, because they are based on present knowledge that assumes monotonic increase in the gap.
I have some papers that have looked at actual TOA radiation, e.g., here. This work appears to show increasing attenuation of TOA radiation in the CO2 band.
One objection that could be raised is that it covers only one area of the globe in the central Pacific. But, there are some other suspicions I have regarding the way the data are processed. I am not yet ready, however, to air those suspicions. If I make a breakthrough before this thread gets locked out, I will post it, so you may want to check back from time to time.
Any other comments are welcome.
Thanks, Ferdinand. I have a longer response, but it is held up in the queue. If and when it appears, this comment will make more sense. If this comment gets held up, well then, it will all come together.
In summary, I consider the ground test to be inapplicable – we need TOA differentials. Nor can I rely upon analysis tools which assume the relationship to be proved – that results in a circular argument.
I pointed out a paper that does purport to show changes in TOA radiation in line with expectations, but there is a problem – it is not a controlled experiment, in which concentration and temperature can be varied independently. So, the cause of the observations could be the concentration, or it could be the rising temperature, and the sensitivity of the emissivity curve with respect to it. If it is the former, and the concentration causes the temperature to rise, then that makes things even more difficult to separate.
Ideally, what we would like to see is a measurement in which the two quantities are going in opposite directions. Unfortunately, the last time that happened, between about 1940 and 1970, we didn’t have the means to make measurements. Perhaps, in the years to come, if we get the cyclical downturn in temperatures I am expecting, we will be able to get information that will allow us to separate the two variables.
Climate models are trick of maths. Getting that maths trick into the model, in the way they did, explains all one need to know about climate models.
There is a real danger with complex models that the output will conform to preconceived expectations and adjustments made to underlying data and assumptions until the “correct” result is produced.
I would be interested to understand projections made with slightly skewed but entirely plausible data and assumptions. Running the model with a small range of inputs to get a range of futures does not eliminate bias.
Having said that, consuming (oil, gas, coal) in a few hundred years which has taken several hundred million years to lay down seems likely to have an impact on climate. Whether we should seek to reduce or globally mandate carbon and other emissions reductions (thus far unworkable) or simply adapt is a different issue.
“Why Climate Models Run Hot”?
Take a clue from Henry “Henny” Youngman, who once asked,
Q: “Why do husbands die before their wives?”
A: “Because they want to!”
CACA acolytes like it hot, since the real range of ECS from 0.0 to 2.0 degrees C isn’t scary enough to maintain funding levels, hence the range has to stay where it has been since first invented 40 years ago, ie 1.5 to 4.5 degrees C.
I like Rud’s approach but would expand it a little.
The road to global warming has a number of “Iffy Bits”. Here are some.
1. The difference between Boltzmann inferred earth temperature and actual. We have several alternative explanations such as the atmosphere –gravity effect and work done by convection.
2. The effect of collisions and water vapour on CO2 GHG effect.
3. The magnification of warming by water vapour, humidity evidence and hot spot evidence. Positive vs Negative feedbacks.
4. The observational warming/ fiddled raw data/massaged data/UHI/etc
5. Attribution
6. Why are the failed models not binned?
7. Why is there a hiatus?
8. What are the predictions, timescales and consequences of failure?
Stay tuned for another guest post torrow, per CtM, that fleshes out some of your line of thought. CtM had noodled on it for years, and myndraft has him thinking of an SKS antidote website, perhap another subsection section here like sea ice.
Normally, to find the effect of one parameter you can choose two methods. Both lead to isolation of either the parameter you want to measure or the interference parameters. A little like finding a new planet from the existing orbit variations of a nearby planet from Einstein’s general relativity.
So find a low humidity region and measure the effects or look for a small effect in a high humidity region (bloody difficult). Or think outside the box and measure the effects on another terrestrial body.
There are much simpler, more macro sound bites. Which bite much harder.
Since there is zero correlation between geological history levels of CO2 and temperature Tyndall’s experiment proved nothing. I.e. The 800 year lag.
“For example, the last Thames Ice Fair was in 1814.”
On a warmist site, I read a comment by one of the biggies there that the Thames now flows more swiftly at the ice fair location site due to man-made changes to it. (Please correct this if it is wrong.)
Its true. Rebuilding of London bridge
Didn’t that relate to bridge piers being closer together in the past than today’s modern designs that have a larger span between piers? The older designs would be easier to block with ice, at least so went the theory. (You could also just as easily claim similar volumes of water pushed through a smaller gap would move faster, thus making ice build-up less likely, could you not?)
Absolutely correct. The fact that this is ignored when attempting to ‘disappear’ the Little Ice Age is quite telling.
“Didn’t that relate to bridge piers being closer together in the past than today’s modern designs that have a larger span between piers?”
Yes, that’s what I remember reading.
CheshireRed July 6, 2017 at 1:53 pm
Didn’t that relate to bridge piers being closer together in the past than today’s modern designs that have a larger span between piers? The older designs would be easier to block with ice, at least so went the theory. (You could also just as easily claim similar volumes of water pushed through a smaller gap would move faster, thus making ice build-up less likely, could you not?)
However the gaps were so small that they could easily be blocked by ice washed down from upstream, here’s a contemporary illustration from 1814:
The main point why most models are running hot is that most models were developed in the years ’80 and ’90 of the last century, when there was an increase in temperature between 1976-2000. As all warming was attributed to CO2, they needed a cooling “knob” to explain the cooling in the period 1945-1975, when CO2 was slowly increasing. That they found in human aerosols, mainly SO2 emitted from coal and oil use.
See the discussion in the early days at RC:
http://www.realclimate.org/index.php/archives/2006/02/an-aerosol-tour-de-forcing/
with my comment at #6.
As the cooling by SO2 aerosols is just an estimate, one can take that higher or lower at any level, where the opposite influence of CO2 must follow. In all cases on can fit the model to the 1900-2000 range, including the 1945-1975 cooling.
Problem is that the 1945-1975 cooling can be explained that way, but not the 2000-2014 “pause”, as SO2 didn’t change much, only shifted from the western world to S.E. Asia. That makes that those models with the highest influence of SO2 aerosols, and thus from CO2, now run hottest…
See further:
http://www.ferdinand-engelbeen.be/klimaat/oxford.html
Ultimately though they had ignored other natural factors and had sulphates as there pet theory. Sulphates don’t even explain the 1945-1976 period because China has warmed despite huge increases in these.
Also …
4. Annual changes in atmos co2 are driven by annual fossil fuel emissions
https://papers.ssrn.com/sol3/papers.cfm?abstract_id=2997420
Jamal:
The IPCC carbon budget concludes that changes in atmospheric CO2 are driven by fossil fuel emissions on a year by year basis.
That is not what the IPCC says. Their graph only shows averages within wide margins of error and year by year variability.
Changes in the atmosphere are driven by human emissions at one side and variable sinks at the other side, which in average are driven by the total CO2 level above steady state for the current ocean surface temperature (NOT the human emissions of one year) and which variability in sink capacity is largely dependent on the influence of temperature variability on (tropical) vegetation and to a lesser extent ocean surface temperatures.
Ristvan
In the models,
What allowance is made for the annual transfer of heat by atmospheric transport. The primary factor in Arctic warming, was the heat transported in from warmer locations.
What allowance or consideration is there for a variance in the volume of atmosphere available for transport This volume varies annually, with variations on the destination of the atmospheric flow and heat.
Regards
Mod – A rather long post (apologies for that, but there was a lot to write) of mine appears to have been waylaid. Can you see if you can find it? Thx…
http://tyndall1861.geologist-1011.mobi/
Does the new team get conferences in pleasant locations, funding for life and groupies?
Thought not.
I won’t hold my exhaling of life giving.. sorry, polluting gas.
I guess that the models run hot because at the height of the warming they decided that correlation meant causation. The rate of CO2 increase/warming was baked into the climate models.
Now there is no correlation but the models continue to show one.
Point 3 is all about the suspected feedback of vapor. If temperatures go up just mildly, vapor will increase, and as it is a super powerful GHG, climate disaster takes place.
That is why my modest analysis of nocturnal cooling patterns may be somewhat relevant. As it shows, there is a massive correlation between cloud condition and night time cooling, which necessarily puts the cloud forcing to a magnitude corresponding to the total(!) GHE.
example Parkersburg, WV
http://i736.photobucket.com/albums/xx10/Oliver25/parkersburg1.png
(average cooling relative to cloud condition, starting with sunset, initial temperature = 1, x scale gives minutes x10)
http://i736.photobucket.com/albums/xx10/Oliver25/parkersburg%20rel%20humid.png
(average cooling relative to rel. humidity, starting with sunset, initial temperature = 1, x scale gives minutes x10)
On the other hand however, there is no correlation between cooling rate and relative humidity, which leaves a couple of conclusions.
1. The cloud effect, which may be correlated to relative humidity, is independent from this correlation. In other words, clouds ARE the ONE driving factor.
2. Vapor on the other side, will not have any effect on night time cooling, which means it does not act as GHG at all. That falsifies the biggest chunk of the “GHE”.
3. This is not of a surprise, as point 1 already accounts for the “GHE”. It’s clouds, not vapor.
We can independently check this insight by looking at our planet. We know that by comparison to a PBB earth is about 9° Centigrade warmer (288K vs. 279K) on average. This gap is however lower at the equator – roughly only 5° Centigrade (27°C vs. 22°C). So the (gross) GHE is at its lowest, where we have the highest concentration of the strongest perceived GHG. This is impossible, unless of course, we give up the idea vapor was a GHG.
Surprisingly temperatures in the very dry Sahara dessert are even higher than at the equator. Again this fact must be wrong, according to the theory of a GHG vapor. In the wide absence of vapor, the dessert must much colder, which it fails to do.
So .. we have a theory falsifying reality, or the other way round, for the more rational thinkers.
Not to disagree with your overall premise re. clouds, however, while daytime T is higher in the Sahara, at higher latitude than the equatorial moist tropics, nighttime T is a lot lower.
Right, daily temperature variations are higher in the desert, like up to 20°C. That is just the same as anywhere (except for sea bound places), when the sky is clear. Of course in the desert the sky is clear most of the time. It is a fascinating fact, how vapor, in other words humidity, will not play any role in that either. Which of course it had to, if it was a GHG.
However, what I was actually talking about were average temperatures, and these may reach 28-29°C in the desert. That is despite less solar input (compared to the equator), some elevation (245m might cost about 2°Centrigrade in this case), and again stronger temperature variations, which cause relatively higher emissivity at any given average.
https://en.wikipedia.org/wiki/Faya-Largeau
(Rud, this is a great example of the sort of “basics” article I have suggested a few times ought to be a part of an introduction to the debate section here at WUWT. An addition to the “drop down” menu up top, I imagine, which newbies who come here can immediately and easily go to for help in understanding the basic points of contention, and perhaps for some lexiconic familiarity and the like. (I suggest ‘Watts Light ~ Basics’ as a heading).
My hunch is that many “civilians” end up here at some point, but drift away without actually learning much because they feel overwhelmed by the apparent expertise gap they face. A handful of articles like this one (perhaps adapted a bit in this case to the specific purpose ) could rather easily be assembled “collectively” I suspect, because there are so many writers who contribute here that are very good at “keeping it simple” when they wish to . . and those newbies would have a way to get acclimated, and ask some “dumb” questions perhaps (and see the results of previous inquiries in the comment sections), without feeling they are interrupting/burdening the “mainline” discussions/authors.
So . . I want you to push for it . . ’cause the ogre might listen to you ; )
See tomorrow’s guest post, I completely agree with your general observation. Now lets do something about it. That requires positive input, not just negative criticism. So get busy yorself.
I have begun, ristvan . . that’s an example of “positive input” right there, to me . . It’s not something I can make happen, so I’ve been trying to get some other people thinking about such a “section”, and how it might be organized/presented, and how the material might be collaborated on in such ways as to make it “civilian” friendly, yet expert acceptable . . and be as uncontroversial as possible, and so on. (When I said “collectively”, I meant it ; )
John,
Remarkable that you’re willing to be educated about atmospheric physics and chemistry but not biological physics and chemistry, ie the fact of evolution, which cannot help but happen given the genetic code.
Gabro,
To me, you are as the climate alarmists, suggesting I “educate” myself about climate change being a fact . . meaning essentially that I ought to memorize some orthodoxy-centric pablum and accept it as absolute truth. I have educated myself about Evolution theory (from a very young age, and saw it as virtual fact until just a decade or so ago), but have come to have the distinct impression it’s become a “settled science” realm, that went the same way “climate science” would go a few years later; Skepticism free ; )
John,
You have it completely back-a$$ward. Creationists are as CACA adherents.
As all scientists here know full well.
I told you the truth, you are as the climate alarmists to me. And I have asked you things like; How could it be a “scientific fact” that what we see in reality-land, with regard to something like “domestic” species that have evolved substantially with no new genetic coding coming into existence, is not what we are seeing evidence of in the fossil record?
You having great faith that something else happened, is hardly worthy of being called a basis for scientific certainty, in my book . . ; )
John,
Domestic species do indeed have new genetic coding, but mostly they’re the result of selective breeding, favoring certain genetic traits, such as shorter legs, over others. Same thing happens in the wild, when there is selective pressure in one direction.
Both adaptation and natural or artificial selection are evolutionary processes. But they’re not the only evolutionary processes. As would be obvious to a rational person.
There is no way, given the genetic code, that novel sequences cannot arise. It’s built into the system. One important way that that happens is by whole genome duplication, so that the old coding is preserved, but enormous amounts of material are now available for experimentation.
This has all been explained to you at great length, but you can’t handle the simple truth.
John Knight,
Wow! This is a real treat for me, and yet another benefit of reading WUWT, where so many creationists congregate.
I’ve never actually met a creationist, so am all the more excited at the possibility of finding out what you actually believe, when all of reality is so obviously arrayed against you.
I’d really appreciate your enlightening me on these aspects of creationist belief, as I’ve been able to ascertain them.
1) Please tell me what evidence you adduce for earth being only about 6000 years old, rather than the 4.6 billion years shown by every line of physical evidence. Thanks!
2) Please tell me what evidence you see for a global flood, covering the highest mountains, a mere 4500 years ago, which necessitated tens of millions of species being sequestered on a boat for months and months, cared for by a handful of humans. Thanks!
3) Please tell me what evidence you have that evolution does not occur. Do you agree with professional liars that genomes are fixed and immutable, or do you accept the fact that nothing is easier than changing genomes through a whole variety of mechanisms, as repeatedly observed every day in the real world? Thanks!
4) Please tell me what evidence you have that organisms don’t adapt to their environments via natural selection, as seems unavoidable, given genetic diversity and differential survival and reproductive success. Thanks!
5) Please tell me how creationists explain away the fact that new species have been seen arising from old ones by a variety of evolutionary processes which take only a single generation, such as hybridization and polyploidy. And how species separated by some barrier to interbreeding evolve into new species, simply by stochastic processes, without natural selection. Thanks!
6) Please tell me what evidence you have that incremental changes cannot lead over time to the development of new species. Is there some barrier that stops adaptation and other genetic change from eventually creating new species, as has been observed over and over and over again in reality? Thanks!
7) Please explain why every possible line of scientific evidence shows the fact of evolution, i.e. Fossils, biochemistry, molecular biology, anatomy, embryology, biogeography, genetics, etc, yet you chose to d@ny these facts? I’d really like to know upon what scientific basis. Thanks!
I’m really excited to be able to communicate with a real, live creationist in this forum. Thanks to you, to Ant@ny and the m@derators for providing me with this rare opportunity to find out how prescientific believers think.
Gabro,
So, your basic argument is; You think it could have happened, and hence it did happen?
Not scientific anything, to me, kiddo ; )
Willy,
I don’t argue phantom evidence and reasoning, nor do I consider sweeping generalizations about “every line of physical evidence” anything worthy of consideration. I grew up ; )
I get that there is essentially ZERO skepticism (among atheist scientists anyway) about the grand stories they tell of the distant past, because we can confidently assume that “running things backward in time” indefinitely is a valid proxy for observation (and once upon a time I saw things that way myself) . . but if there is a God, that’s obviously (I feel) not a valid assumption. Hence, much assuming about the distant past is done essentially without any significant “competition”. There simply HAD to be an Earth (or it’s eventual components coming together “naturally”) 4.5 billion years ago, many assume, and see ALL evidence as necessarily comporting with that supposed fact, without hesitation. One or another such “hindcast story” is assumed to be ultimate truth . .
Please consider, carefully; Faith in the nonexistence of God is, by definition, faith in something imagined to be so . . while faith in the existence of God is not . . since God’s can, by definition, make themselves known, if they exist.
Readers, please note this (to me) blatantly mindless or disingenuous BS;
“Domestic species do indeed have new genetic coding, but mostly they’re the result of selective breeding …”
Now, for the umpteenth time, I am faced with a person who (I believe) knows damn well I didn’t mean just any old genetic mutations, but the actual coming into existence of new functional genetic coding that caused a significant change in the species. (This would not be happening over and over if this person was informed and honest, it seems to me.)
And note how the word games become the focal point of the discussion, while the underlying point of contention just gets lost in the dithering . . like CAGW theory ; )
JohnKnight July 6, 2017 at 9:09 pm
Dunno to what you refer, but new species arising from old occurs every day.
JohnKnight July 6, 2017 at 10:50 pm
Your willful obtuseness never ceased to amaze. You were talking about artificial selection in the domestication process, so I responded to that particular evolutionary process.
However, that new, novel, innovative changes in genomes occur all the time is not the least bit in doubt. As you’ve been showed over and over again, yet still refuse to recognize or admit, novel changes in genomes not only happen continuously, but have been observed repeatedly to give rise to new species and genera. Again, this has been shown you over and over again. But clearly, you can’t handle the truth about reality.
At one end of the spectrum of genetic change, you’ve repeatedly been referred to nylon-eating bacteria, which evolve from sugar-eating bacteria by a single point mutation, the deletion of a single base pair.
On the other end is whole genome duplication, which has given rise to 30 to 80% of all plant species. Animal genomes, including humans’, also record instances of whole genome duplication.
In between are all the other sources of genetic novelty, which I’ve outlined for you time and again and which have allowed genomes to grow from a single gene per protocell to tens of thousands in the most complex organisms over the course of four billion years of evolution. Among these in the human line have been the gross chromosomal change associated with upright walking (the fusion of two smaller standard great ape chromosomes into the large human #2), and the simple mutation which led to brain growth. Again, these facts have been repeatedly brought to your attention.
Sorry, but the Bible is not a science text. For reality, check out the Work of God, not His alleged Word, actually authored by prescientific people.
John Knight:
Not surprised you couldn’t answer my questions. Predictions made by creationists are always wrong.
The entire science of evolution is founded on skepticism. Belief in the anti-scientific bible, not at all.
Science requires skepticism, which attitude can only be overcome by evidence from the real world. There is no evidence against the fact of evolution and all the evidence in the world for it.
Scientists recognize the fact that the earth goes around the sun, just as they do the fact that new species arise from old. Both facts are observations made every day, so these conclusions are inescapable.
Now if you want to be skeptical of the fact of evolution, you’ll have to present some scientific evidence against it, rather than religious faith. You won’t because you can’t, since there isn’t any scientific evidence against the fact of evolution.
New species are made from old every day in every way everywhere, in the lab and in nature. New genetic material evolves continuously and creates new species in the process. Today it’s an industrial and commercial process.
We wish we could stop pathogens from changing their genomes in every 20 minute generation, but we can’t. Thus the constant need for new antibiotics.
John,
The basic attitude of science is skepticism, while of religion is faith.
But to be skeptical of a particular scientific theory, hypothesis or discovery, you need to have specific reasons. You can adduce none in support of your opposition to the fact of evolution.
As you’ve been shown over and over, there are innumerable instances of observed evolution and even more inescapably inferred. Evolution is now an observation, not “just” a theory or hypothesis, although in science a theory requires lots of support. Same as the heliocentric theory used to be an inference or insight, but has since been observed objectively to be true. Evolution, like gravitation, has a body of theory which attempts to explain and understand it, but evolution is far better understood than gravity.
Not only is the fact of evolution constantly observed all around us, but it cannot help but happen, given the nature of the genetic code. Every individual in every generation has mutations. On average, humans are born with four, and we acquire more during our lives. If they occur in our germ cells, then those innovations too can be passed on. Evolution is a consequence of reproduction.
Since you can’t offer even a single scientific reason for imagining that evolution is not a fact, your opposition is purely religious, based upon faith rather than evidence and reason.
Willy,
We no longer need rely just on fossils, embryology, biochemistry, comparative anatomy, etc to reconstruct the history of evolution. We can look in detail at the molecular biology of genes.
We can see specifically what genetic changes allowed colonies of choanocytes to evolve into sponges, sponges into radially symmetrical animals, radials into bilaterally symmetrical animals, bilaterians into deuterostomes, deuterostomes into chordates, chordates into vertebrates, vertebrates into bony fish, bony fish into lobe-finned fish, lobe fins into tetrapods, early tetrapods into amphibians, amphibians into amniotes, amniotes into reptiles and mammal-line animals, protomammals into mammals, egg-laying mammals into marsupial and placental ancestors, ancestral placentals into modern placentals, placentals into primates, primates into the monkey-ape line, lesser apes into great apes and great apes into humans.
Not every change has been discovered, but key genetic innovations in each of those transitions have been identified. The genetic alterations confirm observations from rocks, etc.
Five year-old technology permits humans to take precise control of our own evolution and that of other species, to include extinction.
https://www.wsj.com/articles/the-gene-editors-are-only-getting-started-1499461756
Gabro July 7, 2017 at 5:33 pm
Erratum:
In the above, please read “choanoflagellate” for “choanocyte”. The former are the unicellular ancestors of the feeding cells of sponges, ie choanocytes. Both types of cell have collars to capture bacteria upon which to feed.
“New species are made from old every day in every way everywhere, in the lab and in nature.”
Bullshit, I say. Just name games, played by some whose entire careers and reputations depend on churning out such meaningless crap.
John,
Not name games. Just the facts.
You’ve been shown hundreds of instances of new species made in the lab and evolved in the wild, over and over and over again, repeatedly, without reality penetrating your brainwashed noogin. Businesses nowadays even patent the new species they make. It’s a big industry.
Here’s just one of the innumerable patents issued just in this century for new species, in this case of a plant (arguably in fact a new genus):
https://patents.google.com/patent/WO2004057947A1/en
New species are now so common that species and genus distinctions are an active area of patent law:
http://www.bitlaw.com/source/mpep/2131_02.html
When will you learn to quit spewing lies out of complete, total and utter ignorance?
Truly a hopeless case of willful blindness. You simply can’t handle the truth.
Another promising lab technique is reprogramming the genetic coding of cells to be implanted in (for now) animals and (eventually) humans:
https://www.sciencedaily.com/releases/2014/08/140825100049.htm
Genetic material is not immutable, as you so ignorantly imagine.
The climate simulations started as existing weather simulations but were modified to simulate climate and to execute in finite time. Accordingly they increased the spatial and temporal sampling intervals. In my experience such an increase in the sampling interval can cause instability which dominates the results So the simulated warming could be caused by the numerical instability. Another thing that they must have done is hard code in that an increase in CO2 causes warming. Hard coding in that CO2 causes warming begs the questions and renders the simulations as usless
That’s the problem with computer simulations. At best, they only tell you the implications of your assumptions. They don’t tell you if the assumptions are any good.
As always, a pretty interesting discussion here through integration of knowledgeable, thinking participants’ contributions. If I had a criticism of it, it is that it is nearly all physics and inorganic chemistry buffs attacking the subject of global warming. Even Gavin Schmidt’s ‘evidence’ that the models are all running cold is the same stuff.
There seems to be a big elephant hiding in plain sight because it isn’t ‘hard science’ stuff. I’ve mentioned it a number of times in several posts but my comments didn’t even slow down the main stream stuff. The elephant is the big surprise of an unexpectedly rapid and widespread greening of the planet. Could someone kindly correct me on a few points I’ve tried to make concerning its effect?
1) It is exponential in character: concentric fringes grow inward into arid regions, first fringes are growing more robust, entirely new ones sequester more, reducing the trend in added CO2. Plus added biocarbon to all plants everywhere else. Plus phytoplankton doing the same thing in the oceans (think Cliffs of Dover for magnitudes).
2) It is endothermic (cooling)! I’ve read here a lot of iffy stuff about CO2 causing cooling, but here we are, expansion of life is a refrigerator. A negative feedback caused by a big carbon sink.
3) The plant stomata are reduced, making plants more resistant to drought, preserving moisture, retaining more in the soil.
4) Greening, an unappreciated reason models running cooler and… just maybe.. a partial factor along with natural variation creating the dreaded “PAUSE” with which it coincides! Da daaaa!
Note, our antagonists have noticed this more than we have, jumping all over it with a flurry of papers on how horrible man caused greening is for the planet!
Oops… models running hotter!
I have read the main post and many of the comments, but didn’t catch anybody actually explaining why the models run hot. In other words, the whole point of this exercise.
My own opinion on why the models run hot is simple: They don’t model the Earth, as it actually works; instead they model an idealised Earth which is built like an onion.
Their idealised Earth is built like an onion, whereby heat only transfers from layer to layer by “radiative forcing”. The models ignore the much larger effects of conduction (from the surface to the atmosphere) and convection (within the atmosphere). Any localised heating effect from the “CO2 blanket” will be transferred into the higher atmosphere and goes into cloud formation. The increased cloudiness will prevent further heating at the surface.
My opinion is that the Equilibrium Climate Sensitivity to CO2 increase must therefore be zero for this reason. In other words, the Earth’s temperature is completely unaffected by the CO2 level.
The difficulties of experimentation have led to the exaggerated importance of modelling but observation must always be the reality check.
During the twentieth century we had warming at lower levels of CO2 followed by identical warming at higher levels of CO2. What do these observations prove? Nothing.
Adding a model that demonstrates correlation suddenly justifies the global warming scare. This is getting science back to front.
Now, back in the real world, CO2 continues to increase but the warming has stopped. What does that prove? If anything, it suggests the model is wrong.
Rud,
A question on your examination of point 3.
On 8/3/2010 and 14/10 2014 on WUWT,there were discussions of the logarithmic effect of increasing CO2 on global temperature.” Diminishing effect of increased CO2 etc.”
Since Tyndall and Fourier and others, there has been acknowledgement that the effect of increasing CO2 is negatively logarithmic.
This is famously confirmed in TAR3.See also Wikipedia- “Radiative Forcing”.
However it is claimed that the acknowledgement in AR5 -WG1 (AR4 also?) does not find its way into the Summary for Policymakers.
There now seems to be resistance to the claim of logarithymic effect across the full concentration of CO2 into the future.
At page 8 of the AR5 Summary for Policymakers-
“Multiple lines of evidence indicate a strong, consistent almost linear relationship between cumulative CO2 emissions and projected global temperature change to the year 2100 in both the RCPs and the wider set of mitigation scenarios analysed in WG111 ( Figure SPM 5b).Any given level of warming is associated with a range of cumulative CO2 emissions and therefore e.g. Higher emissions in earlier decades imply lower emissions later.(2.2.5 Table 2.2)”.
Any thoughts?
Well the weather’s changed after an unusually calm dry month and wind turbine owners looking down in the mouth-
http://www.adelaidenow.com.au/news/south-australia/possible-rainfall-up-to-70mm-forecast-for-adelaide-mount-lofty-ranges-by-the-end-of-monday/news-story/e83faa9e6fe4cfed3712d1037dac36e5
but do watch the priceless video where it seems our weathermen are going to use 8 million laptops and climate models to help them better forecast the weather.
How many models are required for F=ma ? When we actually know something there is one model.