Guest Post by Willis Eschenbach
In my peripatetic meandering through the CERES satellite data, I’ve been looking at the correlation between the temperatures in the NINO3.4 region and the temperatures of the rest of the planet.
The NINO3.4 region is an area in the equatorial eastern Pacific Ocean. It covers five degrees north and south of the Equator, from 170° West to 120° West. Temperatures in that area are used to measure the strength of the El Nino / La Nina phenomenon.
Now, people often discuss procedures like “removing the effects of the El Nino from the global temperature record”. What they mean is that they have noted the similarity between the temperature of the NINO3.4 region and the global temperature. Figure 1 shows that relationship as seen in the CERES data.

Figure 1. Surface temperature of the globe (blue) and of the central Pacific ENSO3.4 area (red). Note the large “El Nino” event at the end of 2015. Both datasets are normalized (set to a mean of zero and a standard deviation of one).
Seeing this relationship, people have “removed” the NINO3.4 temperature variations from the temperature record. They have done this by subtracting out, in one form or another, the variations that are “caused” by the El Nino swings. However, I have disagreed numerous times with this procedure. Let me propose a more encompassing way to understand the relationship shown in Figure 1.
This is to note that although there are areas of the surface which show a good positive correlation to global temperatures, there are also areas that show a good negative correlation to global temperatures. Figure 2 shows this relationship on a gridcell by gridcell basis. It displays how well the temperatures in each gridcell agree or disagree with the global average temperature variations shown in Figure 1.

Figure 2. Correlation of each gridcell with the global average temperature. Note the large areas of negative correlation (green and blue)
Looking at that, I ask you to reconsider the idea that we can simply subtract out the temperature variations in the NINO3.4 area (blue box) from the global temperature … clearly, the relationships are far from simple. Is the fact that certain areas correlate well with the global variations a sufficient reason to “remove” them from the temperature record?
And if so, why limit ourselves to the ENSO3.4 area of the Pacific? Why not use a much larger area of the Pacific and “remove” half of the Pacific from the temperature record?
Setting those questions aside, the overall pattern in the Pacific is clearly related to the heat which is moved by the El Nino / La Nina pump. These two phenomena act together to pump warm Equatorial water across the Pacific in a westward direction. Once this warm surface water hits the Asian mainland/islands it splits and moves toward the two poles.
Now, many people say that this shows that the El Nino / La Nina is causing the global temperature changes. I say that the causation is going the other way. When the earth warms and excess heat accumulates in the eastern tropical Pacific, it triggers a cycle of the El Nino / La Nina pump. This pump moves warm water to the poles, where it is lost to space. Overall this cools the planet. The results of this pumping action can be seen in Figure 2 as the green areas in the western Pacific heading towards the north and south polar regions.
In other words, the El Nino doesn’t control the temperature—the temperature controls the El Nino.
We can look at this from another perspective. Rather than comparing gridcells to the average global surface temperature as in Figure 2, we can compare gridcells to the average NINO3.4 area temperature. Figure 3 shows that result.
 Figure 3. As in Figure 2, but comparing ENSO3.4 area temperatures with gridcell temperatures. Note different color scale than that used in Figure 2.
Again, a most interesting result. It makes the El Nino pattern even clearer. Note that both the Western Pacific and the North Atlantic move in opposition to the NINO3.4 area.
The source of the pattern seen in Figure 3 is clear. It is driven by the El Nino / La Nina pump. When enough heat has accumulated in the eastern Pacific, the El Nino / La Nina pump pushes warm water first westward, then poleward. This cools the eastern Pacific and warms the western Pacific. In the South Pacific, you can see how it goes around Cape Horn at the south end of South America.
The oddity from my perspective is the North Atlantic. It moves in opposition to the NINO3.4 area, but the physical nature of the connection (or teleconnection) between the two is not clear to me.
In any case, I wanted to look at how temperatures in the areas in blue changed with respect to changes in the NINO3.4 temperatures. I restricted the analysis to the areas with a correlation more negative than – 0.3. Those areas are outlined in Figure 4 below. It is the same as Figure 3, but with the most negative areas outlined by the gray contour lines.

Figure 4. As in Figure 3, but with the gray contour line at a correlation of – 0.3.
Note that the North Atlantic is included among the areas with a strong negative correlation to the NINO3.4 area. To see the difference between the positively and negatively correlated areas shown in Figure 4, I graphed them up in Figure 5.

Figure 5. This shows the two areas outlined in Figure 4 above. The red line shows the average of the NINO3.4 area, shown as a rectangle in Figure 4. The blue line shows the average of the areas shown in blue and outlined with a gray contour line.
Dang … I certainly didn’t expect that nearly perfect mirror-image. When the NINO3.4 area warms up the North Atlantic and the other areas cool down, and vice versa.
So this highlights the problem. Given that we have an alternating phenomenon wherein the North Atlantic cools down when the Eastern Pacific warms up, and vice versa … just exactly how should we “remove” this phenomenon from the global record?
And more to the point, why should we remove it? The El Nino / La Nina pump is a central part of the natural thermoregulatory mechanisms that keep the temperatures within a very narrow range (e.g. ± 0.3°C during the 20th Century). The Nino pump kicks into gear whenever excess heat accumulates in the equatorial Pacific waters and moves that warm water to the poles.
As such, “removing” the El Nino / La Nina / North Atlantic signal from the global signal is cutting out a vital emergent climate heat-removing mechanism … I don’t even have a name for what remains once that radical surgery is performed.
=================
Here, I’m putting the finish touches on this post and getting some needed hydration before going back to my current fun … driving a 1.5 tonne excavator, leveling an area on our tilted patch of dirt in order to make a level patio garden … big boys do love our big toys.
A summer’s day, an excavator, and red-tailed hawks circling in the distance … what’s not to like?
Best to all,
w.
PS: If you comment please QUOTE THE EXACT WORDS THAT YOU ARE DISCUSSING, so we can all be clear about your subject.
Just a thought. Is it possible that the thermal expansion in the Pacific drives water North into the Arctic ocean and pushes cold Arctic water out into the Atlantic . I immediately see problems with the idea but I’ll throw it out there anyway.
This pattern is certainly driving warm surface air, and likely warmer surface waters into the Arctic from the Bering Sea region. ..https://earth.nullschool.net/#current/wind/surface/level/overlay=temp/orthographic=110.92,83.39,819
https://youtu.be/S3D69cIMOx4
As it happens i animated a years worth of nullschool ssta aug 14 to october 15.
Primarily i was interested in the cooling NA at the time but the perspective captures the building El Nino at the time.
As has happened every year since (though last year was a weaker effect), my opinion is the labrador current gains additional energy april/may which overpowers the Gulf Stream.
Its usual track should be to flow south west down the US coast….a south east component i belive flows under the north east bound GS/North Atlantic drift.
This results in a dissection of the usual NE flow of warm water.
33% or more of all the fresh water that flows into the arctic circle emits from the Hudson Bay. I have tried to find runoff volumns of rivers that supply this but drawn blanks.
Due the time of year that this overpowering effect occurs, i feel icemelt can be discounted as the greatest melting occurs later yet by june july, the maximum cooling appears to be met.
Snowmelt into Hudson Bay would be very seasonal,probably peaking in June.
Yes, but i imagine the lab current would be fed by some arctic ice and that small bit of ice to its east called Greenland…..
The cooling of NA is also seasonal as i observed the last 3 years.
Not sure how much data there is though? Osnap is too new….Rapid array, too far south…
At the Earth Nullschool website there is a small word located at the bottom of the settings:
Click it and one is taken to a page that has this explanation, and warning.
Earth Nullschool is a magnificent tool; but not all of nullschool is actual data.
Their SST is calculated from the daily average (1981-2011) and updated, daily; using data from the “Marine Modeling and Analysis Branch“.
Which has this current note:
Defining a change in source data March 14th, 2017. Only the data source may have changed November 1, 2016.
Following the trail, one comes to another list of data sources and problems, finally one comes to a page with this tidbit:
The Real Time Global RTG-SST-HR description includes this:
Where model ends and actual observations enter are very unclear.
Your animation is of Earth nullschool presentation, not necessarily that of actual Earth SST.
As various NOAA/NASA products get better at collecting real time information and allowing user’s download of same, then Earth nullschool’s truly impressive display will increase in accuracy.
Right now, Earth Nullschool is hobbled by the data they have access to and the frequency it is updated. SST data is modeled first, then possibly updated later; with a frequency of once per day.
Exept i use the ssta not sst?
Plus bear in mind the animation was primarily a retrospective one, i guess i took most of the images off the site starting august 2015. Almost a years worth of images were copied well after the date they represent.
Thermal expansion is much too small to make these movements happen. The IPCC likes to pretend that ocean temperature changes occur from the surface to the bottom, but, in fact, there are ocean layers and surface temperature changes only cover the first ~100-200 m of the surface waters.
higley7 search this site for “ocean upwelling”. Numerous articles on deep ocean upwelling contradict that assessment.
I calculated expansion of the ocean top 100m 1F would expand about 8″. But it would actually be only need to be about .3F for the 300m thermocline.
the El Nino / La Nina pump pushes warm water first westward, then poleward
Try as I may, I don’t see any red flow towards the poles near the Asian mainland. I see green and blue. What am I missing?
The Kuroshio Current.
The warm Kuroshio runs into the cold, counterclockwise Oyashio Current from the Arctic Ocean off Hokkaido, where the Kuroshio turns east to form the North Pacific Drift, which heads south off North America as the cold California Current.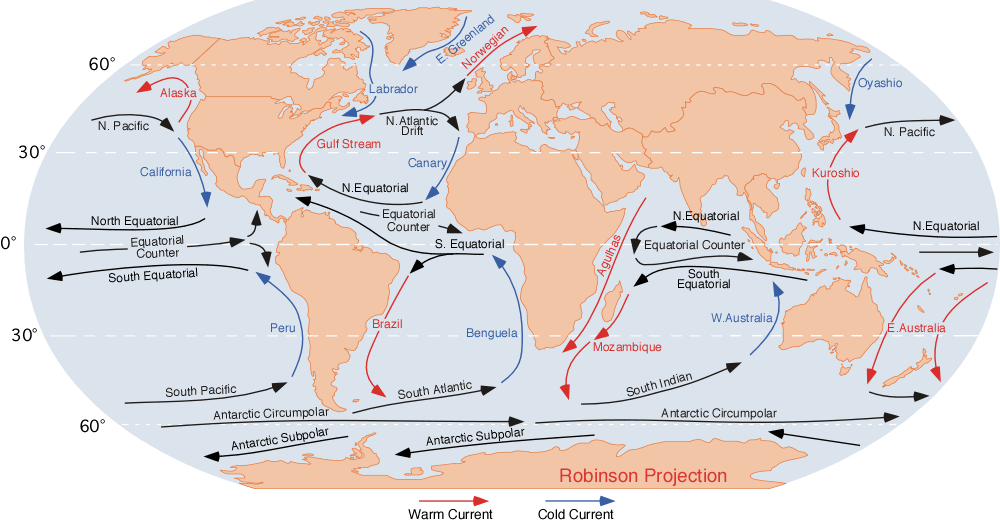
Much the opposite happens on the other side of the Pacific, where the (relatively) warm, counterclockwise Alaska Current flows north along BC, then west in the Gulf of Alaska. It can slop into the Bering Sea, bringing famously horrible WX to the Aleutian Islands.
Here is my problem:
If the Kuroshio Current is what brings the warm ENSO water towards to pole [and similar in the SH] then one would expect its temperature to be positively correlated with the equatorial ENSO temps, but Fig. 2 and 3 show the temperature to be negatively correlated, i.e the warmer ENSO is, the colder Kuroshio is.
The Kuroshio, like the Gulf Stream, is a Western Boundary Current.
lsvalgaard June 24, 2017 at 12:35 pm
The more heat blown off in an El Nino, the less there is available to be carried northward by the Kuroshio.
Also, in La Nina years, the heat stays in the WestPac instead of moving eastward, thanks to the strong winds from the east, leaving more warmth available to feed the Kuroshio.
Besides the great loss of heat to the atmosphere over the West Pacific warm pool, there is considerable transit time for parcels of water from the Nino3.4 area to reach the Kuroshio off the coast of Japan. Willis’ graph shows only the correlation for zero-lag, thus displaying the negatively-correlated phases of the hemispheric circulation subject to ENSO oscillations.
I agree with Dr. Svalgaard’s confusion here, the negative correlation means that the water is relatively cooler during El Nino and warmer during La Nina. I just assume Willis was describing where the heat went during the waning of El Nino.
I don’t like the pump analogy or describing the entire ENSO process in a way that ascribes it to any one phenomenon during a single phase. ENSO is a continuous complex oscillating system. Just one such process on the entire global climate oscillating system.
http://www.nonlin-processes-geophys.net/17/431/2010/npg-17-431-2010.pdf
That paper is a must read.
I find the correlation with the Amazon and a lesser extent the Congo to be interesting. This probably stresses the importance of clouds in this relationship. Doing this analysis with MSLP (mean sea level pressure) rather than temperature could be extremely insightful.
http://shadow.eas.gatech.edu/~kcobb/seminar/reason00.pdf
Robert,
Regrettably, GCMs don’t do clouds.
Robert Turner:
The confusion here patently arises from the mistaken premise that, in hemispheric gyres that take many months to complete a circuit, monthly temperatures anomalies throughout the circulation should should be uniformly positively correlated (i.e., in phase) with those in the Nino3.4 region.
Such a phase relationship would require the circuit transit time to be shorter than a month. Because of the greatly longer transit time, there are parcels of water from the previous cooler phase in the Nino3.4 region that show up well downstream of that region in the snapshot view presented in the figures here. There is no need to resort to anything more sophisticated than the material (Stokes) derivative of temperature anomalies to clear up this confusion.
Such a phase relationship would require the circuit transit time to be shorter than a month.
I stuffed up my post but in essence it was that the similar period in anti-phase relationship may be better explained by completely different approach or it may be coincidence and unremarkable. The two vast water bodies (Pacific and Atlantic) do not appear to be significantly connected directly. But I suggest people are looking in the wrong place for the wrong connection. If you consider them as separate systems there is another connection. Both are heated by the same sun, they have different patterns in time in cloud formation that effects the distribution of insolation at the water surface, and the currents generated in each are constricted differently by their underlying and surrounding land. These differences may not actually be significant determinants of the period of the observed circulations. They are each dynamic systems with a natural frequency in one or more modes of oscillation under the same driver, the sun. It is quite possible that a natural frequency of one equals one of the other. The small constricted direct connection of the water bodies, if not enough to force the oscillations in the other may still be enough to influence the phase of the oscillations such that at least for a substantial period of time they are anti-phase as observed. Such a result would not be a surprise to an engineer dealing with vibrating systems that are tenuously connected.
BTW, no matter the inverse zero-lag correlation with the Nino3.4 region, the Kuroshio nevertheless is quite consistently warmer than the waters surrounding it off Japan.
Here is an example of why I think that solar variability is more likely the control knob on climate than CO2, if there even be such a thing. ?w=625&h=413
From Solar Cycle 22 to 24, sunspot area fell by a factor of two. Still a small part of the sun’s surface, but the climate system amplifies solar effects. As does time. Eleven years of fewer photons of all energies striking earth adds up.
The most energetic photons fluctuate the most, ie those which make and break ozone and penetrate farthest into the oceanic depths.
but the climate system amplifies solar effects
This is a baseless assertion unless you can tell us how that might work.
Reams of research show not only how it might work, but how it does.
Amplification of insolation by feedbacks is how ice ages work.
https://experts.umich.edu/en/publications/amplification-of-obliquity-forcing-through-mean-annual-and-season
Amplification of insolation by feedbacks is how ice ages work.
Your link says:
“(1) Local reductions in air temperature enhance precipitation as snowfall. (2) An intensification of the winter meridional insolation gradient strengthens zonal circulation (e.g. the Aleutian low), promoting greater vapor transport from ocean to land and snow precipitation. (3) An increase in the summer meridional insolation gradient enhances summer eddy activity, increasing vapor transport to high-latitude regions.”
So you claim that this is the explanation for global warming due to the sun.
I claim what I plainly said I claim, which is that the climate system on earth can and does amplify tiny variations in insolation with important climatic effects, indeed in solar activity in general, not necessarily just with reference to incident radiation at the surface.
You still have not specified a viable physical mechanism for you claim, which then is still just an assertion.
But I have. And it’s not a controversial statement.
The climate system of Earth does obviously amplify slight changes in solar activity.
Insolation is solar energy arriving at the surface. Axial tilt and other orbital and rotational mechanics affect insolation, even assuming constant solar radiation and magnetic effects, which is not in fact the case. Albedo is a positive climatic feedback effect. I don’t see how you can d@ny the fact that phenomena on Earth affect the impact of solar activity on climate.
The sun is a variable star, but in most wavelengths, not much. But the effect of the slight variability in TSI yields huge changes, as is evident in the geological record.
But the effect of the slight variability in TSI yields huge changes, as is evident in the geological record.
You have to be clear about what TSI is. There is a difference between what the Sun intrinsically puts out [TSI] and what actually falls upon the Earth in different regions [insolation]. There are no indications in the geological record of any changes in TSI.
“What am I missing?”
The NE Pacific ‘Warm Blob’.
lsvalgaard “What am I missing?”
Phase relationships.
Nino34 has positive anomaly when the warm water built up in west Pacific warm pool flows east. This puts the WPWP in negative anomaly though it is still the hottest water on the planet.
What Willis has plotted in CORRELATION not hot water.
The major, Coriolis driven, ocean gyres drive the warm equatorial waters polewards, “the El Nino / La Nina pump” modulates that flow via wind driven surface currents.Coriolis forces are a key part of that too.
The maps show correlation not temperature. So when hot NINO3-4 occurs the last pulse of heat heading towards the poles is exhausted, ie, inversely correlated with the new hot pulse building in NINO3-4.
The maps show correlation not temperature
correlation with temperature. If positive, it means that the flow is warmer, if negative, the flow is colder.
Correlation is correlation, not “correlation with warmer”. So if Nino34 is cooler red would mean cooler. You seem to have trouble understanding what correlation is. Or you just goofed and will now spend three days arguing the toss instead of admitting your mistake. As usual.
La Nina is at stronger version of the normal SST pattern. Warm water in the western Pacific fed into higher latitudes by western boundary currents. La Nina is cool over Nino 3.4 region versus warm West. = -ve correlation. Nino reverses this.
Majority of time western boundary currents transfer ocean heat to higher latitudes, but in Ninos the heat gets trapped at the tropics causing anomalous warming.
Willis’s graphic is consistent with this and I am not sure why you are confused?
Leif, during an El Nino, the North (and South) Equatorial Currents in the Pacific slow and can reverse direction, basically starving the Kuroshio Current of its normal amount of warm water. During the trailing La Nina, the leftover warm water from the El Nino (its residuals) are returned to the West Pacific Warm Pool and carried north to the Kuroshio Current. Thus the surface temperatures of the Kuroshio Current are negatively correlated with NINO3.4 temperatures.
Hope all is well with you. Cheers.
Willis, the negative correlation between the North Atlantic and NINO3.4 temperature anomalies looks odd. What coordinates are you using for the North Atlantic? (0-70N, 80W-0 ??) Or are you using a small portion?
Cheers
Yes, ENSO is not a pump. The trade winds are pushing warmed surface water east to west all the time, and Ninos are substantially failures of the trades. The trade winds are the pump.
And the tradewinds are just a result of the dominant average mean sea level pressure.
Yes. We have a surface pressure index for south of the equator. Methinks we could use one for north of the equator too.
NH trade winds strengthen during the winter and the warm phase of the Arctic oscillation (in sea-level pressure).
The diagnosis of the ultimate driver is always complicated when there is a circular chain of reactions in a system. While the slackening of trade winds indeed precedes the onset of El Ninos, the Southern Oscillation of surface pressure (the SO part of ENSO), which drives the trade winds, is itself seemingly driven by SSTs off Darwin and Tahiti. The disentanglement of all these factors requires far more penetrating dynamical analyses than any of those attempted here.
Sky,
And as I noted, the strength of trade winds in the NH seems to be associated with the phase of the Arctic Oscillation. The cause and effect situation in ENSO is so complicated that it might well have a simpler solution.
Gabro,
That “simpler solution” is far from apparent and has escaped dynamical oceanographers for well nigh a century. Mere phenomenological “association” is not enough!
Indeed. Nullschool can help.
I try to check this every day. This is not the Pacific, but it was handy, and it shows MSLP vs Surface Temperature (not anomaly). It illustrates what I see in the Pacific which is that the correlation between surface temperature and surface pressure is much better over land than ocean.
Furthermore, even the correlation over land seems limited to the tropics. Subtropical surface pressure certainly plays a role in the trade winds.
Bottom line: even the correlation between Darwin/Tahiti pressure and sst is not convincing.
I should have speculated as to what the simpler cause might be, so as to sound less phenomenological.
As our data have improved, at least in quantity if not quality, over the past century, it has IMO become apparent that insolation is the predominant driver, in so far as there is one, of climate change on the time scales under consideration here.
There is a simpler solution(well), a collection of simple physical response to the local environment, collectively have the operation of a heat driven water pump in a global temperature averaging system. It also operates on a daily, and annual or longer time scales.
There are vast quantities of solar and rotational energy applied at the equator, and that to normalize with the poles where there is little of each of those.
P.S.- Glad to hear you have summer for your garden. Here in Western Canada I’ve had the heat on the last two nights when we would expect lows in the 50’s and daytime highs in the 80’s.
I have noticed the cooling across most of Canada in recent months. If that holds in place through the entire summer, then I would imagine that this next winter could arrive early across Canada. …https://earth.nullschool.net/#current/wind/surface/level/overlay=temp/orthographic=-87.83,53.14,819/loc=-97.801,49.509
Now that was interesting! A huge gyre about 3000 miles across covering the Eastern 2/3 of NA! Separately, I have been saying that this year’s weather reminds me of the 70’s as we have had wind like was common when I was younger and has been much reduced since the 80’s.
I recall the 1950s/60s/early70s as being similar to now. The smell of the air matches old memories as it brings the old memories forth. I would even hazard that there is likely a change in the incoming solar spectrum(?). I have been out getting lately spending several hours doing things outside. Temps have been in the low 100s, and for some reason do not feel as (hot) as similar or even slightly lower temps in past years, 2015 and prior.
60’s were much colder winters and hotter summers. I think humidity was an important factor in those differences.
When looking at historic temp data for my area I have noticed that record highs and record lows sometimes fall in the same year. Most of the record lows are from the 1950s/60s.
goldminor this may be down to personal misperceptions but i can remember going hours with no clothing on my top half in summer during the early 80’s on the east coast of scotland and not picking up much of a tan. come the late nineties and later i felt the sun actually felt different and sunburn occurred more readily.
of course this is something that may be due to aging skin,no doubt someone on here will know . i have also noticed an increase in the strength of the wind with a significant change in direction for the time of year over here . the last two years we have had more easterly winds into summer than we have seen for a long time.
the old lobster fishermen used to say wait until the end of may when the last easterly wind has passed for the summer before putting the pots out. that changed just past the mid 90’s when the early summer winds appeared more benign and more often from the west. the mackerel have also arrived later this year and last ,whereas in the same period mentioned in the 90’s they began arriving up to a month earlier than we would expect in the 80’s (i lived in iran as a kid in the 70’s so have no personal knowledge of that period where i live now).
1969’s summer, July and August was unusually cool in Pennsylvania with frequent cloudy skies.
Yes, there were the normal runs of hot humid weather; but there were long stretches of overcast days with lower temps.
Teaching swimming and lifeguard duties that summer included a lot of darn cold days. Getting a class of kids to enter the water when half of them are shivering is hard. Telling the kids the water is warmer than the air only works once.
So far June reminds me greatly of that summer. July and August will soon be upon us.
40+ years of global warming and nothing to show for it!
Very nice Willis; and your last post too.
I agree with your reasons for not removing Nino3.4, and ‘the El Nino doesn’t control the temperature—the temperature controls the El Nino.’
My work on F10.7cm & TSI ties in with ‘why the temperature goes up’ to cause an ENSO.
Much of the excess equatorial heat is evaporated off. Another tie-in…
Will there be a video of you excavating?
Bob Weber June 24, 2017, at 11:55 am
Naw … it would be too embarrassing.
w.
Not if you scraped the Mattel sticker off and painted it Cat yellow.
“I don’t even have a name for what remains once that radical surgery is performed.”
Lobotomy?
Even in my early years of following the AGW story line it never made sense why a scientist would think that removing the ENSO signal from the global temp record would be of benefit in understanding the climate system. It is too large a driver of weather patterns and climate in the longer term. They may as well have tried removing the effects of the Sun on the Earth.
My work on F10.7cm & TSI ties in with ‘why the temperature goes up’ to cause an ENSO.
They have nothing to do with ENSO.
In the classic sense of the word Leif: you’re ignorant of the relationship.
it is easy to be ignorant of a non-existing relationship.
“a non-existing relationship”?
You mean like your non-existing reasons to doubt the effect of high solar activity?
You’re going to find out otherwise. ENSOs occur under specific solar conditions.
You and everyone else is going to understand and know it as I do.
There’s so much to talk about but again you’re not a constructive workshop participant today.
Willis’ work directly ties in to parts of my work. You don’t have to like it Leif.
You mean like your non-existing reasons to doubt the effect of high solar activity?
Something that doesn’t exist does not need reasons for not doing so.
Willis’ work directly ties in to parts of my work
“ties in” is very vague. In what way does Willis’s work tie in? Perhaps that ENSO is causing TSI and F10.7?
Willis,
I’d like to suggest that you create a scatterplot of the global temperatures and the Nino3.4 temperatures. Do a linear regression and note the r^2 value, which tells us how much of the variance in the y-axis variable is explained or predicted by the x-axis variable. Do the same for your Figure 5 raw data. It is better than eyeballing the apparent correlation. If you can’t assign numbers to a problem then it is little better than hand waving.
I don’t see any vultures in your future-garden picture. Have they forsaken you?
Clyde Spencer June 24, 2017 at 12:13 pm
Call:
lm(formula = tempmon ~ nino34rem)
Residuals:
     Min       1Q   Median       3Q      Max
-0.34856 -0.08227  0.02547  0.09463  0.42749
Coefficients:
              Estimate Std. Error t value Pr(>|t|)
(Intercept) -2.308e-17  1.021e-02    0.00        1
nino34rem    1.190e-01  1.175e-02   10.12   <2e-16 ***
---
Signif. codes:  0 ‘***’ 0.001 ‘**’ 0.01 ‘*’ 0.05 ‘.’ 0.1 ‘ ’ 1
Residual standard error: 0.1415 on 190 degrees of freedom
Multiple R-squared:  0.3504,	Adjusted R-squared:  0.347
F-statistic: 102.5 on 1 and 190 DF,  p-value: < 2.2e-16
.
Willis,
So, it looks like you are telling me that only about 35% of the variance in one variable can be explained by the other variable. That isn’t what I would call a high correlation.
Well , with significant parts of the globe in anti-phase with the Nino34 region the correlation with the global average is not going to be that high. I think that the point Willis was making.
The whole problem here is the unscientific paradigm that mainstream climatology is based on: they “know” that any long term change is due to AGW and they are now trying to explain the wiggles.
This defective, a priori, assumption is why they never get anywhere.
Leif, Bob: I get a lot out of these exchanges except when the ad hominem are flying. Keep it civil, dudes because it is important debate. Cheers, and thanks Anthony, Willie, and all the rest.
Who is Willie?
You rang?
I am not Willis! Or Spartacus.
Leif, Bob: I get a lot out of these exchanges except when the ad hominem are flying. Keep it civil, dudes because it is important debate. Cheers, and thanks Anthony, Willie, and all the rest.
Let us hope that Bob takes that to heart.
Please stop projecting. I’m trying to be constructive, are you? As long as you keep interfering with my message no one is going to learn the truth about how the sun warms and cools.
Please take that to heart.
Ah well, you didn’t.
Well worth repeating
As I have understood this oscillation, the heated water moves slowly Eastward before being drawn Northward by currents toward the Arctic. The North Atlantic cool spot seems to appear concurrently or rather without any time lag if I understand correctly.
in addition i wonder if the warm pool of water in the eastern pacific drives the weather that creates increased cloud/storm levels in the north east atlantic that contribute to surface cooling ? i am hopeless at archiving the various snippets i come across around the web,but i remember noting a series of very low pressure storms in that area of the atlantic in recent years.
i also like the post by acid ohm .in addition or alternatively to the above in periods dominated by el nino this mechanism could be part of what drives the wax and wane of arctic sea ice and the approximate residence time of 30 years of the top 1500m of water in the arctic ocean. that in turn i suspect could drive the amo. if this all sounds nonsense feel free to let me know. my imagination knows little bounds, unfortunately more often than not it is not backed up with enough of the smarts :).
Troubleshooting a misbehaving feedback control system is miserable. The only way to deal with it is to break the feedback loop and deal with each of the blocks in terms of its own expected behaviour. Otherwise, you literally, and mathematically, can’t tell where in the system the problem is. Problems in all parts of the system can produce a problem with the same symptoms.
The climate is about a zillion times as complex as any control system I can think of. There is no way to isolate variables. Everything affects everything else.
I fully agree with Willis.
Some/most folks are treating the climate as a system of resultant behaviours. It is a system of emergent behaviours.
We don’t have tools to deal with emergent behaviours whereas we have wonderful tools to deal with nice well-behaved linear systems. It is those tools that are applied to the problem. It’s like the drunk looking for his keys under the streetlight. It’s not where he lost his keys but it is where the light is.
Or there is another “thing” causing both the effect in the North Atlantic and El Nino.
Aye! There’s the rub! Is it one thing, ( or set of things)? Or is it two separate things with two separate causes? That’s why I offered up Pacific thermal expansion. Whatever it is, it’s worse than we thought!
Running underneath the North American continent, there’s a large underground conduit between the Pacific and North Atlantic!
That is a more logical interpretation IMO. Willis’ figure 5 does not seem to support the idea that the Atlantic variation is a phase delayed consequence of ENSO.
Willis could probably establish this fairly easily but from that figure it seems pretty obvious that you would not get a stronger magnitude ( positive ) correlation by lagging NINO34 than he has shown with zero lag.
That suggests that there is a common driver rather than one being the result of the other.
Exactly right. The climate system is driven by spatio-temporal chaos as it strives to achieve MEP. I expect all celestial bodies do exactly the same.
I’m experiencing a ‘misbehaving feedback control system’ as a develop my own nonlinear flight model extended from the NASA F-16 subsonic model. Everything affects everything else and it is very hard to debug. I feel your pain with the climate system.
What is interesting with a nonlinear flight model those those aircraft without static stability, if you perturb the steady state flight and don’t put any correcting inputs you can end up in any state. The system is deterministic yet chaotic, it is impossible to predict in the future the state the system will be in – and that is neglecting turbulence. No wonder the weather modellers have such a hard time, and the climate modellers don’t even approximate reality to within a whopping factor of 3.
Robert Turner in an earlier comment referenced a paper http://www.nonlin-processes-geophys.net/17/431/2010/npg-17-431-2010.pdf and called it a must read. This might be the mathematics required to deal with non linear climate and emergent phenomena.
The paper deals with stochastic resonance. It is a mathematical method of dealing with a complex system with feedbacks where a small periodic forcing combined with noise can result in oscillation between two different states. This method has been applied in multiple disciplines from amplifier design to neurophysiological systems. The paper deals with applying the method to climate.
The paper deals with an energy balance model with two feedbacks, albedo and infrared emissions dependent upon temperature. The Milankovitch cycles provide the periodic forcing that is not large enough to cause the state transitions that are observed ie a 10C difference in temperature between the two states with a 100,000 year period for the last 2 million years. The weather is treated as noise which when combined with the small periodic forcing can result in abrupt state changes.
“it is important to remark that abrupt climate changes, such as those observed during the Milankovitch cycle or over the last 100,000 years are hard to explain without the idea of transition between multiple equilibria triggered by noise, which is the basic feature of stochastic resonance”.
“it is not trivial that adding noise to a system we can enhance the deterministic periodic behavior.”
Wow, dynamics. Somehow I doubt that is grant worthy as the potential to upset decades of dogma is clear..
Tiny typo in the comments below figures 2, 3, 4: ‘rectange’ in each case.
More than 97% sure this means ‘rectangle’.
Indeed, 100% sure.
Don’t worry – I certainly do typos [by mistake] too.
Auto, hoping for more rain in South London.
Dived across to France, to further empty the European Wine Lake, today – it was grey, cool, say 19C, and light showers. Ideal for me.
“I say that the causation is going the other way. When the earth warms and excess heat accumulates in the eastern tropical Pacific, it triggers a cycle of the El Nino / La Nina pump.”
When Earth is warmer there are less frequent and weaker El Nino episodes.
http://www.co2science.org/subject/e/summaries/ensogw.php
“The oddity from my perspective is the North Atlantic. It moves in opposition to the NINO3.4 area, but the physical nature of the connection (or teleconnection) between the two is not clear to me.”
El Nino episodes drive some of the largest warm anomalies to the North Atlantic, with a lag, look through e.g. 1998, 2010, and 2016:
https://www.esrl.noaa.gov/psd/data/correlation/amon.us.data
Note that there is no apparent time lag between the 2 areas. What mechanism can operate so quickly over these large distances and (preferably) take very little energy to act?
The candidate that immediately comes to my mind is cloud cover. It easily has the capability to change W per sq m rapidly, it takes very little energy to start and maintain different areas of cloud cover.
Why, though, would cloud changes select these 2 regions? First, they are both over sea not land, so many concepts like land use are out. To me with no data to support this proposition, a possible answer is changes in oceanic biota moderated perhaps by nutrient availability. There are several paths that could be proposed for testing, one involving cold Arctic water moving south to the N Atlantic and slowing biotic growth with the opposite happening equatorially influenced by wind strength. Assumes a reasonable link between growth rate and T. I have no references relating biotic activity to cloud cover. Indeed, reverse causality might be the case for much of this scheme.
But if as Willis postulates for reverse causation, high temperatures initiate his process, one has to explain why the temperatures become high, where when and why. Clouds again?
Geoff
possibly not slowing but creating cooler conditions that favour different species ? levels of calanus finmarchicus in the north east atlantic appear to be directly tied to the north atlantic oscillation. these are one of the very important species for recruitment of the gadoid species in the north east atlantic. recent years have seen an increase in recruitment ,particularly of species like cod in the north and irish seas. this suggests an upturn in the level of “good” plankton. the data for the last 5 years from the plankton monitoring program around the uk is not freely available though.
the drop off in calanus finmarchicus production when the nao is in the positive for the majority of consecutive years can be seen in past data though.
“Note that there is no apparent time lag between the 2 areas.”
Yes there is, inspect the monthly AMO data above, and also note where it does not agree with Willis’ figure 5, because that all his blue areas and not just the North Atlantic.
Yogi, you are apparently very gifted at being able to draw such conclusions by “inspecting” a table of numbers. Either that or you are just asserting something that you have not taken the time to check and maybe read elsewhere but cant’ remember where.
Willis’ fig 5 does not seem to suggest that there is lagged relationship which would produce a larger magnitude correlation than the obvious negative correlation with zero lag.
If you can produce a stronger correlation with a particular lag that back up your assertion and would certainly be worth posting.
How about a top down mechanism stating with ozone in the upper troposphere and stratosphere?
If look very closely at the graph, there is a phase difference. It is especially apparent in the early years and less apparent in latter years. X axis is years. It would be informative to see a graphic emphasizing phase difference on the order of weeks.
Greg goodman writes:
“Yogi, you are apparently very gifted at being able to draw such conclusions by “inspecting” a table of numbers. Either that or you are just asserting something that you have not taken the time to check and maybe read elsewhere but cant’ remember where.”
Crikey! do you not have the wherewithal to scan through a couple of decades of monthly anomalies and note where the nigher values occur?
https://www.esrl.noaa.gov/psd/data/correlation/amon.us.data
“Willis’ fig 5 does not seem to suggest that there is lagged relationship”
Because it is dominated by the blue regions in the Pacific which obviously would not have a lag. Willis should have plotted Nino 3.4 against just the North Atlantic.
Crikey don’t you have the wherewithal to realise that just eye-balling a table of figures is about the most unreliable way to analyse a set of data.
That’s not amateur, it’s just plain dumb. A pretty good way to ensure you see whatever you expected to see and conclude you are right. Not only that you’re dumb enough to double down on this being a good idea and rudely refer to me as Goodman.
Great science fella.
“A pretty good way to ensure you see whatever you expected to see and conclude you are right.”
The idea is to not expect anything, but to pay attention to actual values, hello?
“Not only that you’re dumb enough to double down on this being a good idea and rudely refer to me as Goodman.”
Just because you fail to perform a very simple task does not make it a bad idea. Rudely refer to you as Goodman? why have you changed your surname in the last few hours Greg? I actually copied and pasted your name as you posted it. So you now owe me an apology.
“Dang … I certainly didn’t expect that nearly perfect mirror-image. When the NINO3.4 area warms up the North Atlantic and the other areas cool down, and vice versa.”
Or perhaps you shouldn’t be too surprised. You did specifically identify areas with strong negative correlation. That is essentially a filter that says “only show me areas with mirror-image behavior”.
Other than that, I haven’t a clue as to what this correlation means — especially the stuff in the North Atlantic.
Willis,
A short comment, as I am still travelling in hot South Spain…
I think the reason may be quite simple: during an El Nino, the trade winds are silent or reversed, so there is no upwelling from the deep ocean along the coasts of Peru and Chili. As that is the pulling part of the large deep ocean overturn, the pushing part on its own is driving less hot equatorial waters from the Saragossa Sea towards the North Atlantic and the deep ocean downwelling there, thus less heat is dissipating in the N.A. than in non El Nino conditions…
If there are recent figures of the Gulf Stream current flux you my find some correlation…
Ferdinand, i’m not quite following your logic. How is it (exactly) that upwelling in the eastern pacific is affecting currents in the atlantic? thanx…
BTW, i think it’s Sargasso Sea (funny how the english goes once you cross the border into spain… ☺)
Cooling N Atlantic is driven by interuption of the Gulf Stream by the Labrador current.
This may be a function of weakening GF flow or increased Lab flow.
The Gulf of Mexico has often had reduced ssta whereas the GF has been elevated (perhaps water ‘backing up’ as not exhausting into NA effectively)
The cold blob in the NA can quite easily be seen to originate from the point where the lab current intersects the GF.
This can be seen in the vid i postex earlier, and current nullschool images as this effect is strong again this year.
Last year it was not so much.
Apologies, for GF read GS (bit early on a sunday!)
Fonzie,
Indeed, not much English in Spain, or any other language for that matter and the rest of my geographic knowledge sits in my home computer…
The THC (thermohaline circulation) is pushed by winds over the Gulf Stream and the increasing density of colder and saltier waters near the ice edge in the N.E. Atlantic. These waters sink there into the deep and circulate around half the world to be pulled up by off land trade winds along the coasts of South America. That is the pulling part. The latter to the joy of the fishermen there.
If the pulling part stops (and the fishermen weep) during an El Nino, the law of communicating vessels may work and the sink rate at the N.E. Atlantic may be reduced as there is no pulling at the other side of the world.
I am just speculating a bit, but propagation of flux changes in liquids is extremely fast, even over half the world…
O.K., gotcha (i just needed a few more dots to connect the big picture)… So, in essence, el ninos slow down the gulf stream and la ninas speed it up(?)
I suspect the force of winds, the absence of winds, and the direction of the winds play a role in the amount of heat ejected into the atmosphere from the oceans.
Nino3.4 (& 1-2) evaporated water vapor, and resultant precipitation and weather disasters, and in general the speed of the hydrological cycle are factors relating to Willis’ work, affecting warming and cooling during ENSOs that flows north-easternly sometimes all the way to Greenland and Europe, affecting snow accumulation and heavy rain events.
The lack of direct correlation of Nino34 and the NA isn’t a problem when you consider the time it takes for the transport of OHC to the NA region. The longest time-dependent trek for sub-surface OHC is to the poles. The repeated melting of arctic ice through the decades coincides with several years after periods of higher solar activity, and vice versa.
The higher WV heat content during ENSOs results from higher evaporation from the warmest areas in the equatorial Pacific. The OHC-SST-atmosphere energy exchange is driven energetically like a pump by the variable amount of incoming solar energy at the top of the ocean.
TSI is cyclical yet aperiodic, like a highly variable frequency and amplitude modulated heater, due to changing sunspot magnetic activity. The energy entering the ocean is also a function of the cloud cover over the area, a function itself of prior incoming solar energy, adding a short-term time element.
One of the most interesting phenomenon I found is that the Nino3.4 region seems to never exceed about 3.5 in it’s min-max spread, something I think is associated with the overall min-max range of TSI over time.
http://climate4you.com/images/PacificEquatorialSSTanomaly.GIF
http://climate4you.com/images/NOAA%20SST-Nino3-4%20GlobalMonthlyTempSince1979%20With37monthRunningAverage.gif
I track TSI and the ENSO regions daily and have found matching trends, sometimes perfectly in phase daily, but usually an imperfect 7-14 days coherence.
When TSI drops during a solar rotation, and the last clouds generated from the previous solar blast are gone, the skies clear, UVI and insolation in general increase on the ocean surface, warming it.
The whole system is super sensitive to variable solar activity.
I think Willis captured parts of the response to it.
I’ll answer any sensible question.
“that the Nino3.4 region seems to never exceed about 4.5 in it’s min-max spread”, re: second image, ie, 1983-85, 1988-89, 1998-99, 2010-11, and 2016
One ENSO during the SC rising phase and one after the cycle peak, except 1991, muted by Mt. Pinatubo.
I track TSI and the ENSO regions daily and have found ….
Sensible question : how do you “track” that, can we see some evidence of that claim, either a graph or some correlation figures.
Greg, great question. All my plots and analysis are in a 70MB spreadsheet and dplot folder, which I am eager to give out when I’m done documenting it. “It” is a lot of work. In the interim I’ll describe my process and give out a practical way to keep up on it.
Plot daily SORCE TSI and NOAA DSD to compare to each other and ocean data product images.
Scale TSI from 1359 to 1362.5, scale the NOAA daily F10.7cm, SSA (area), and SSN numbers on the other axis to 3000. Make an updating plot for the most recent 90-days, with TSI trendline.
Collect every day the following images and post against the 90-day solar plot, adjust the solar plot size until the time scales are perfectly aligned. The daily CDAS data is posted by Levi Cowan at tropical tidbits as product images, shown below.
Now you’re in business for ongoing visual observations. At some point I’ll secure the actual daily CDAS data and make my own plots and correlations – CDAS is not as simple as a text or json file.
http://www.tropicaltidbits.com/analysis/ocean/global.png
http://www.tropicaltidbits.com/analysis/ocean/nino12.png
http://www.tropicaltidbits.com/analysis/ocean/nino34.png
http://www.tropicaltidbits.com/analysis/ocean/gomssta.png
http://lasp.colorado.edu/data/sorce/total_solar_irradiance_plots/images/tim_level3_tsi_24hour_3month_640x480.png
Beyond 90 days I use annual plots, 2003-2017, and one Oct 2015 to June 2017 to compare against NCEP CFSv2 Global 2 meter Temperature anomaly charts made by WeatherBell’s Dr. Ryan Maue.
The bigger picture question is where did the heat come from for the ‘super El Nino’ of 2015-2016?
http://www.bom.gov.au/climate/enso/monitoring/nino3_4.png
It came from the overall 7 year rise in TSI through the solar cycle, but specifically it was directly caused by the TSI peak of early 2015:
The SC24 TSI peak occurred in February 2015, exactly 12 months after the monthly peaks in 2014 of both F10.7cm flux and SSN, due to the transport time of the sunspot plasma to the poles.
2015 1 1361.5359
2015 2 1361.8859
2015 3 1361.6749
2015 4 1361.6690
The high solar energy peak deposited a huge amount of heat under the ocean surface:
http://www.cpc.noaa.gov/products/GODAS/mnth_gif/xz/mnth.anom.xz.temp.0n.2015.04.gif
The temperature rise from that F10.7-TSI-OHC-SST process peaked in February of 2016, in one year.
Two one year lags, one from the sun, one from the ocean. Hence the 1-2 year spikes in Nino3.4 a few years after the cycle sunspot peak:
http://climate4you.com/images/NOAA%20SST-Nino3-4%20GlobalMonthlyTempSince1979%20With37monthRunningAverage.gif
The high solar energy peak deposited a huge amount of heat under the ocean surface
This is what the Earth actually received from the Sun:
http://www.leif.org/research/TSI-SORCE-Received-by-Earth.png
The variations you are overinterpreted are not even visible on this scale.
due to the transport time of the sunspot plasma to the poles
No, that is not how it works.
The very large [and dark] sunspots in 2013-2014 depressed TSI. As the spots decayed, their magnetic flux hung around for a couple of years [this is normal] which led to an increase in TSI and in the mean field of the Sun [upper curve]:
http://www.leif.org/research/TSI-SORCE-Cycle-24.png
But those changes are so minuscule and so short-lived [less than 1/1000 of what we get from the Sun every day] as to have no measurable effect on the climate.
To put the variations in even better perspective:
http://www.leif.org/research/TSI-SORCE-Received-by-Earth-2.png
A pretty good example from earlier this year.
Thanks for the reply Bob. The latter part does seem similar, the rest not so much.
I suggest you look at correlation coeff, it’s easy to shift things back and forth mentally and convince oneself that is more of a match than there is really. Also try inverting TSI and see whether the early part still seems to match.
It’s certainly interesting. Is that typical of just a hand picked one which look quite good to illustrate the point?
Greg the coherence varies with conditions. I had earlier posted a longer comment that’s in moderation, explaining the process I use involving 90-day TSI with a trendline. There are irregular periods of coherence that seem to operate upon a few basic rules, with very strong directly linear correlation when there are sharp sustained changes in TSI up or down, where the impacts depend on time of year and location. It’s a recurring series of self-similar events that takes practice to evaluate, that as you can see isn’t perfect.
Leif the message I’m getting here from you is TSI changes are not registered at the earth, but yet you’ve still claimed there’s a 0.1C solar cycle influence (it’s higher IMO).
Annual TSI changes are correlated with annual SST changes. This was crucial in my forecasting within 3% the Had3SST drop in 2016 from the annual drop in TSI.
SORCE TSI in SC24 peaked annually in 2015, after seven years of increase.
Year 1au TSI
2015 1361.4321
2014 1361.3966
2013 1361.3587
2012 1361.2413
2011 1361.0752
2003 1361.0292
2016 1361.0073
2004 1360.9192
2010 1360.8027
2017 1360.7926
2005 1360.7518
2006 1360.6735
2007 1360.5710
2009 1360.5565
2008 1360.5382
The TSI peak in Feb 2015 happened only one month after the solar perihelion, giving the peak months nearly the maximum possible effect for the year, negating your seasonal variation argument.
2015 1 1361.5359
2015 2 1361.8859
2015 3 1361.6749
2015 4 1361.6690
2015 5 1361.4732
2015 6 1361.3152
2015 7 1361.4622
2015 8 1361.1664
2015 9 1361.1063
2015 10 1361.3139
2015 11 1361.3646
2015 12 1361.2527
The real solar cycle influence.
Study this to learn about TSI and solar activity:
http://www.leif.org/research/EUV-F107-and-TSI-CDR-HAO.pdf
The anomaly in 2015 has an explanation:
http://www.leif.org/research/Non-Conforming-SC24-x.pdf
Note that the it is possible that SORCE TIM has a calibration problem [see the other link]. We are looking into that at the moment. The problem is not important for the overall explanation [the dip
Leif,
“No, that is not how it works.
The very large [and dark] sunspots in 2013-2014 depressed TSI. As the spots decayed, their magnetic flux hung around for a couple of years [this is normal] which led to an increase in TSI and in the mean field of the Sun [upper curve]”
We practically mean the same thing. I added the times and conditions defining the events.
The decayed flux from the sunspot peak in 2014 took a year to transport to the poles (your ‘hanging around’). The magnetic flux that decayed from the sunspot peak in 2014 flowed to the poles and by early 2015 provided the maximum magnetic potential for TSI.
http://wso.stanford.edu/meanfld/mf.long.gif
Looking at the flow plots below, notice the gray areas. They start after a sunspot area decays at lower latitude, and thereafter the flux moves to the higher latitude pole. For SC24, the gray area began after the 2014 SSN peak, and when the flux reached the high latitude in early 2015, the second SC24 TSI peak happened. If you go back through each solar cycle the pattern repeats at alternating poles every the time the flux reaches high latitude.
http://wso.stanford.edu/gifs/all.gif
The magnetic flux that decayed from the sunspot peak in 2014 flowed to the poles and by early 2015 provided the maximum magnetic potential for TSI.
No, we do not mean the same thing. The polar fields are not controlling TSI and have nothing to do with TSI.
Leif the message I’m getting here from you is TSI changes are not registered at the earth, but yet you’ve still claimed there’s a 0.1C solar cycle influence (it’s higher IMO).
The message you should have been getting is that TSI received at the Earth [this is the solar energy the Earth and the climate system actually get] varies like this:
http://www.leif.org/research/TSI-SORCE-Received-by-Earth-3.png
The lower panel shows the top of the upper panel magnified. You can see there is a tiny variation [THIS is the message]. That is what caused a 0.05 degree variation [0.9/1361/4*288] of global temperature over the solar cycle [from 2008 to 2015]. What is below this portion raises the global temperature by some 250 degrees.
“But those [TSI] changes are so minuscule and so short-lived [less than 1/1000 of what we get from the Sun every day] as to have no measurable effect on the climate.”
and
“That is what caused a 0.05 degree variation [0.9/1361/4*288] of global temperature over the solar cycle [from 2008 to 2015]”
Note this is a THEORY that these small TSI changes matter so little according to one formula. Where is the real world test for such claims? I’ve completely tested my solar theory formulas and models.
I have real world data as evidence that the earth’s ocean is very responsive to changes in TSI. I present my evidence. Where’s your evidence that it doesn’t other than repeating the same old unproven dogmatic canards based on theory based on one mathematical formula?
The sun provided all the entire energy for the great 2008-2016 SST spike, all 0.6C.
“Note that it is possible that SORCE TIM has a calibration problem [see the other link]. We are looking into that at the moment. The problem is not important for the overall explanation”
I noticed the variation in correlation of TSI to F10.7cm in 2015 and account for it in my 90-day model. The problem was not important for the overall explanation of my works either.
***
“‘The magnetic flux that decayed from the sunspot peak in 2014 flowed to the poles and by early 2015 provided the maximum magnetic potential for TSI.’
No, we do not mean the same thing. The polar fields are not controlling TSI and have nothing to do with TSI.”
It is a matter of solar data and observational fact that the sunspot number peak in every solar cycle generates the maximum plasma flow to the pole, observable below, that generates the maximum TSI when the plasma reaches the pole. It’s in the data. All you have to do is go through the data to discover a basic temporal relationship: TSI peaks after SSNs and F10.7 peak. It has to do with sunspot decay and plasma flow time.
http://wso.stanford.edu/gifs/all.gif
I did not say “The polar fields are controlling TSI” – I said the cycle TSI peak happens when the SSN peak plasma gets to the pole, a fine distinction. The whole sun electromagnetic field, TSI, is at it’s max right at that time. It’s in the data. You can’t credibly say the process has nothing to do with TSI. It has everything to do with TSI.
There are no perfect cyclical trend regarding climate, as changes in one place and time will have a multitude of knock-on effects in other places in varying aperiodic time frames. Lack of fine granularity in our measuring systems only makes detecting any coherent signal more difficult.
Well I have to say I prefer that description to the usual idea that it “piles up”. Water does not pile up .
This is contrary to the usual explanation and I think it requires more than a simple assertion.
A lens of lighter, warmer water accumulates in the west Pacific warm pool ( NB it’s not ‘piling up’ it is lighter ) and at some point the westward trade winds along the equator collapse and Kelvin waves , a form of soliton wave, propagate eastwards along the equator bringing the notably warmer waters back accross to the east Pacific.
Warmer waters lead to atmospheric convection either side of the equator and the return path of these Hadley convection cells cause surface air to move towards the equator. The Coriolis force acts to deviate this air flow in a westerly direction, thus leading to a restoration of the trade winds which push warm surface water back to the WPWP.
The question is : what triggers the collapse of the trade winds and start of an El Nino event?
Westward and eventually poleward circulation is the norm, driven by both atmospheric and oceanic Coriolis drive currents. The temporary El Nino events are the exceptions. The real question is what triggers them.
Mainstream thinking on this seems to be basically “they create themselves”. As if that was an answer.
I suggest that it is long period tidal patterns acting on the top of the thermocline.
Greg, if i’m not mistaken (it’s been a while), it’s the slackening of walker cell “trade” winds that trigger an el nino. It seems these winds slow down after a solar max due to less of a pressure differential between the cool upwelling waters in the east and the warmer waters to the west. While you may be correct, water doesn’t so much pile up in the west, warm water does get forced downward by the trades. Once those trades lessen, the warm water springs back up and east over cooler water, hence an el nino…
i also think that there may be two things running here. You can only have so much warmer, lighter water sinking down in the western pacific before it all springs back up anyway. The lessening of walker cell “trades” just triggers that happening at a certain time…
One more thing… Once an el nino has been triggered (and waters begin moving back east), the cool upwelling in the east also ceases. Hence no pressure differential from east to west (and thus no walker “trades”)…
Variation in solar radiation also affects air pressure directly, but expanding or contracting the atmosphere.
No, it forms a lens : both deeper and above mean sea level. You can compare it to a ship. The ship as a whole is less dense than sea water and thus floats but part of it is above water and part of it below.
The slackening ( and later strengthening ) of the Walker cells is what gives a positive feedback leading to the collapse of the trade winds. It tends to make snap into one state or the other, like the positive feedback of the spring in a light switch.
Saying this is the cause seems to be confusing cause and effect. It is a feedback but it is not the trigger: the underlying cause.
Greg, i think it is more than just a “lens”. The water in the western pacific is forced down by trades (walker and hadley) into the thermocline. All that lighter warm water being pinned down into the depths until the walker winds slacken and the whole mass of warm water springs back up (and then shoots east along the equator)…
Fonzi,
That’s how I see it, and the sun is in on every step of the process, from heating the water less or more, to decreasing or increasing atmospheric pressure, affecting surface pressure and winds. Then there’s the effect of highest energy UV on the ozone layer.
It’s the sun, (Stupid to imagine otherwise)!
i also might add that the slackening of the walker “trades” slows down the upwelling in the east. The slowing down of the THC creates a situation where you have a mass of warm water in the depths (in the west) sitting beside a mass of cool water. At that point, there’s no place for the lighter, warmer water to go but up and over…
(Gabro, thumbs up… ☺)
Fonze: “All that lighter warm water being pinned down into the depths until the walker winds slacken and the whole mass of warm water springs back up”
It is not ‘pinned down’ by trades it is the weight of the water column which pushes it down. Like I posted above somewhere, it’s like a ship being, as a whole, less dense than sea water; yet part of is deeper than the mean surface and part of it is above the surface.
When there is a volume of less dense warm water, it displaces some cooler water ( pushed down ) and the sea level is locally higher. All else being equal the mid height of the warmer lens will be at the same height as mean sea level.
In the case of ENSO there will also be barometric pressure also causing differences in height.
“It is not ‘pinned down’ by trades it is the weight of the water column which pushes it down.”
Correct. However, it is the trades which add to the weight of the water column by pushing water west. Should the trades suddenly cease, then what you have is a column of warmer, lighter water than the cooler, denser water to the east (which in turn will cause the warmer water to upwell)…
Still don’t know where you’re going with your lens analogy here. You’ve got to remember that the waters in the western pacific form the beginning of the thermohaline circulation. They are not forming a lens, rather, they are sinking into the depths of the ocean. This due to the upwelling in the eastern pacific (also caused by trades)…
When the walker “trades” slacken/ cease, the whole THC process reverses. Cooler denser water heads west, warmer lighter water heads east (and we get an el nino)…
The heat precedes the trade winds by 1-2 months, h/t Bill Illis
http://s32.postimg.org/do08t5xlh/EEUOHC_vs_Trade_Winds_Apr16.png
Thanks, I think that supports what I just posted above: that the trade winds are a feedback not the cause.
“Water does not pile up .”
It certainly does. That’s how we get waves. Very strong cyclonic winds cause sea water to “pile up” against a coastline sometimes several metres above normal tide height. ENSO conditions lead to variations in sea level at Kiribati and the Marshall Islands- see my analysis of this at https://kenskingdom.wordpress.com/2015/11/01/pacific-sea-levels-warming-enso-or-wind/.
In the recent El Nino, sea levels in Indonesia and the Great Barrier Reef were lower, exposing coral to the sun and (IMO) a greater cause of coral bleaching than the higher sea temperatures.
Planet Earth is not perfectly spherical and the gravitational force around the globe is not perfectly uniform. As I understand it, the globe’s largest deviation from a sphere occurs southeast of India where it is around 300 feet lower; and the highest deviation is around Indonesia. So evidently under the influence of gravity, water can “pile up” with respect to a sphere; but then there is no gain in potential energy from doing so since gravity sustains that deformation.
cyclonic winds are caused by a cyclonic depression, it is the cyclonic depression ( deep barometric low ) which causes the sea level to rise. That can indeed be several metres high and does not need the presence of land to happen.
Greg: I think Bob Tisdale deals with this rather well.
“Water does not pile up.”
Ah, but it does. As Bob points out, the El Niño is a time when particular wind conditions exist. Sometimes the winds push water west towards Indonesia. The channels into which it pushes are far smaller than the open ocean channels. This creates a local ocean level rise of about 18″ in the W Pacific east of Indonesia.
This ‘bump’ provides the impetus for the flows north and south, involving the water than can’t make it through to India. It is quite possible therefore than the El Niño is the result of the ‘evacuation’ of the E Pacific, with water pulling up (see excellent flow charts of the sub-surface waters).
When the winds blow the other way, the sea level in W Pacific drops 18″ and we get the current situation: El Niño conditions, Great Barrier Reef sea level way below normal bleaching the coral, and several inertial water flywheels continuing their merry way in the oceans.
The flows are not rigidly connected because wind and inertia does allow water to pile up for a time. The alarm that said some Pacific Islands were ‘sinking first’ was merely reporting on the wind-surge at the West end of the Pacific. When the sea level drops, no one points it out on the BBC. ‘Off message’.
When the GBR water level returns to normal, the bleaching will reverse and the local sea level rise will be ‘unprecedented’! All this conveniently supports the notion that AG CO2 is the cause of everything ‘bad’. The real link between CAGW and CO2 is, of course, ‘grants’.
Should have read ‘flows are NOT rigidly connected’
Crispin in Waterloo but really in Ulaanbaatar June 24, 2017, at 8:56 pm
Fixed. I hate typos.
w.
Crispin, the ocean gyres are not inertial flywheels, they are the result of the “fictitious’ Coriolis forces. These apparently rotational forces are an illusion of the way we look down on the map or a globe as static object and expect it be an inertial , non accelerating frame of reference when in fact it is a rotating body. It is indeed the inertia of the water which wants to continue travelling in a straight line which causes it to circulate in opposite directions in the northern and southern basins in the Pacific ( and other oceans ).
The rotation of the gyres is driven by the rotation of the earth and the continents interacting with the water. It is not a body of water acting as a flywheel, though it is ultimately an inertial effect.
Kuroshio current is part of that circulation.
Greg
I was not considering the Coriolis at all. I was really referring to wind and inertia.
When the Pacific is driven West there is considerable wind pressure and water inertia that is visible in the form of a rise in sea level. It is not a large amount as a % of height, but is does cause the seal level to ‘appear to rise and stay there’ for a while.
A storm surge is nothing more than that so I am not describing something novel. So I am providing two mechanisms: the source of the (temporary) rise in sea level in the W Pacific at the choke point, and a mechanism for increasing the flow rate to the north and south.
A third and speculative point is that the sea level will drop in the E Pacific so it is possible that, water wanting to flow downhill, the El Nino upwelling may be powered in part by the wind and elevation in the West. Bob Tisdale has charts showing the flows of warm water involved.
Chrispin.You should consider Coriolis. Hadley convections is in N/S direction, it is Coriolis force which turns this into a E-W trades, which in turn drive the surface currents along the equator. The deeper movement : the ocean gyres are also Coriolis. Not to be swept aside when thinking about all this .
In addition to atmospheric winds tidal currents also move water. In normal years both the wind and the tidal current travel from east to west. When the warm water hits land in the west pacific it does two things. It moves north or south, or it goes down. If you look at temperature depth profile of the West pacific the water water isn’t just at the surface warm water goes down to about 300ft.
So in a sense the water dies bile up in the west pacific during normal years.and sea level can be a little higher but most of the warm water piles down. In contrast on the east pacific cold water is pushed to the surface and then moves west By the time it has reached land in the West pacific it has warmed up substantially.
So what triggers an el nino? Simple the the tidal current is not constant. from time to time it weakens. When that happens the deal warm water in the west pacific moves up and spreads out. The current is no longer strong enough to pull it back down . Eventually this warm water spreads out enough too interact with the wind causing the winds to to change from east to west direction o west to east direction. and you get a el nino. Note also that in periods of high solar activity enough warm water my build up that tidal currents will not be able to contain it which could also trigger a el nino.
Tidal currents are governed by the orbits of the moon and earth. The Moon has a 18 year orbital cycle with matches nicely with the approximate 17 to 20 major E nino cycles. The sun also have a 11 year sunspot cycle which affects surface weather. So when you factor in the orbits, solar activity and the tidal currently the timing between el ninos nines makes sense
The cooling of NA is also seasonal as i observed the last 3 years.
Not sure how much data there is though? Osnap is too new….Rapid array, too far south…
Yet another good article, but I had a question about one sentence, which is a conclusion of your article:
“In other words, the El Nino doesn’t control the temperature—the temperature controls the El Nino.”
I had always thought El Ninos were part of the oceans’ effect on moderating the climate — slower warming than the land, and slower cooling than the land, and regular releases of excess heat into space as a negative feedback to warming.
It made sense that the more warming there was in the years before an El Nino, the more heat would be released during an El Nino.
I always assumed the 1998 El Nino was so big due to the warming in the 1990s
… but then the equally big 2015/2016 El Nino was puzzling, since there was supposedly no warming in the prior dozen years.
Whatever causes climate change, the climate has been getting better and better in my 60+ years so my only wish is “give me more of that CO2” !
When I started reading about global warming online in 1997 I immediately did not believe the predictions of runaway warming … and still don’t … but now I can’t believe after minimal global warming since the early 2000s that so many people still believe in runaway global warming.
A kid who was watching The Day the Earth Stood Still movie the other day asked me why so many people report seeing UFO’s, but none of the aliens flying them ever want to meet us?
My answer was that the aliens probably think we are too stupid to talk to, since we think CO2 is an evil gas that is going to end life on his planet, and we would probably shoot them like in the movie.
He didn’t get my sarcasm about CO2.
It then occurred to me … that is exactly what he was taught about CO2 in elementary school.
And he will probably always believe it !
Climate blog for non-scientists:
http://www.elOnionBloggle.Blogspot.com
Whatever atmospheric warming might have occurred in the 1990s had little to no effect on the super El Nino of 1997-98, just as the lack of warming had little to no effect upon the super El Nino of 2015-16.
What matters is the sun shining on the West Pacific Warm Pool and tropical Pacific in general. During cycles of greater solar activity, the Pacific stores more heat. When the warm water progresses east and is released, El Ninos are stronger after more powerful solar cycles.
It’s the sun.
http://www.drroyspencer.com/2016/01/what-causes-el-nino-warmth/
Gabro, this link is a gem by dr roy… Often overlooked is the fact that the equatorial pacific acts like the earth’s air conditioner. During el nino conditions that a.c. breaks down. Much of the warmth that we experience during an el nino is just simply the atmosphere not being adequately cooled by the ocean…
Fonzi,
I hate it when the air conditioner breaks down in the tropics.
If so-called “climate scientists” bothered to look at the globe, even they might be struck by the vastness and depth of the tropical Pacific. They might, if they actually were scientists, go on to imagine the gigantic capacity of those waters, covering half the planet’s circumference, to absorb the heat of incoming sunlight, then to move it around and release it.
The turning of the earth, the sun shining on it, the power of water and wind, these titanic forces show a fourth molecule of CO2 out of 10,000 dry air molecules to be as nothing. Nothing at all. Less than nothing. Contemplate the whole system, not the radiative effect of a tiny component of the mighty evaporative, current, convective liquid, solid and gas, wet and wonderful hydrological, oceanographic, atmospheric system.
The tropical Pacific Ocean covers about a sixth of Earth’s surface.
As soon as Isvalgaard appears in the posts I leave. An arrogant person.
No – just someone who knows his subject (the Sun) backwards, and refuses to be kowtowed by ignorance.
Toneb, that may be so but the way he responds is highly irritating
Toneb, svalgaard doesn’t even know the meaning of “equilibrium state temperature”. (how can he possibly know the affect of the sun on earth’s temp without knowing that?)
+10
James Fosser June 24, 2017 at 3:06 pm
He’s already appeared. Begone.
w.
Yes, that was a bit like replying to someone’s comment by saying ” I not even going to reply to your comment.”
Not to say that Isvalgaard isn’t a bit too sure of himself a lot of the time. He often gives the impression he thinks he is communicating with freshmen undergrads in his comments. Probably an occupational trait.
“Dang … I certainly didn’t expect that nearly perfect mirror-image. ”
Why not? There’s only so much energy to go around, so when one place warms, another one cools. Isn’t this just the inevitable consequence of Conservation of Energy?
The surface is not a closed system therefore C of E does not apply.
Greg.
In LTE, COE must apply. To/from the surface, to/from the atmosphere and to/from the planet, even over relatively short time scales. There’s no getting around this. Any NET transfer of energy from either the surface to the atmosphere or from the atmosphere to the surface would cause one to cool and the other to warm indefinitely. Since both arrive at a steady state average temperature, the NET energy transfer between the surface and the atmosphere in LTE is exactly zero. Both have stored enough energy to achieve a specific temperature and both are receiving exactly enough new energy to offset what its emitting. The only complication is simple to handle which is that the atmosphere emits both up into space and back down to the surface in roughly 50/50 proportions owing to geometric considerations.
Woweee-wow, that anti-correlation is fascinating! Begs for an explanation….does our “settled science” have any explanation? Seems to me if you can’t identify/ explain phenomena like these, then it’s harder to believe in other “settled” conclusions.
Do climate simulations replicate this result?
What’s with the 0 month lag?
The lag is 3 months. This has been very clear since the beginning of any discussion about the ENSO.
And the north Atlantic appears to have an 8 month lag.
Start over.
Now what drives the ENSO? The temperature of the water itself which circulates east-to-west at the surface but 200 metres down, there is the strongest current on Earth in terms of how much water volume moves in it.
It circulates the water west-to-east (opposite to the surface) until it runs up against the Galapagos Islands at which point the force of the water flowing in from behind forces it to the surface. This is the start of the ENSO. This 200 metre depth current is what drives the ENSO. You can see what it is going to do as much as 8 months before the global temperature impact occurs.
Anybody see a Super El-Nino coming here? April 2015. Nino 3.4 peaks in November 2015 and global temperatures peak in February 2016 (3 months later, not 0 months later – and this has been the same pattern over the last 150 years – yeah 150 years).
http://www.cpc.noaa.gov/products/GODAS/mnth_gif/xz/mnth.anom.xz.temp.0n.2015.04.gif
Nino 3.4 projection from 7 months ago. How close did I come? Bang on that is.
Very nice. Feb-April 2015 were the three peak TSI months of SC24.
2015 1 1361.5359
2015 2 1361.8859
2015 3 1361.6749
2015 4 1361.6690
Bill Illis June 24, 2017 at 4:14 pm
I always start with the current condition before I start evaluating the lagged condition. It appears you don’t like that … not sure why.
Well … no. Not according to the CERES data. The cross-correlation function for the two curves shown in Figure 5 reveals a lag of … wait for it …
0 months.
w.
Great, you’ve already done it. Would you care to post the CC fn it would be interesting to see. How does the claimed 8mo correlation compare to zero lag ? As I commented above it does not look like a lagged relationship but figures would be good to see.
That is a key indicator of whether this is a common driver or ‘teleconnected’ causation.
Here are the RSS-UAH Lower Troposphere versus the Nino 3.4 Index with Zero Lag.
I am using a volcano-adjusted Lower Troposphere temperature here (unadjusted is shown as well) because the El Chichon eruptions in 1982 cut-off the impact of the 1982-83 Super El Nino and the Pinatubo eruption of 1991 also cut-off a large El Nino at that time.
There is clearly an on-going lag impact here whether surface temperatures or lower troposphere.
Regarding what I said about an 8 month Lag of the north Atlantic compared to the Nino 3.4 Index, it needs a qualifier in that it sometimes or often lags behind the ENSO by 8 months.

This is not consistent but it shows up often enough, especially in the larger ENSO events. (Maybe I am just seeing things but it seems to do so a lot although there is still lots other variability). Nino 3.4 vs the AMO back to 1979.
We can go way back with these two measures. AMO goes way way back but I think the Nino 3.4 Index is only accurate enough back to 1871.
Can you show that an 8mo lag produces a larger magnitude correlation than 0 lag? Figure 5 looks more like a mirror image than an inverted lag relationship.
Hi Bob and Willis,
Thank you both for your work.
I get a four month lag vs Bob’s three, but let’s define my lag – it is the lag of Global UAHLT temperature after Nino3.4 temperature.
https://wattsupwiththat.com/2016/07/01/spectacular-drop-in-global-average-satellite-temperatures/comment-page-1/#comment-2250067
Based on the previously-discussed relationship, I compared the actual UAHLT global anomaly with a projected UAHLTcalc, calculated from Nino34 divided by 3, wherein Nino34 leads UAHLT by 4 months.
The relationship does not work well during the 1982-83 El Nino, allegedly because of the El Chichon volcanic eruption.
Note the projection over-predicts to the negative several times, especially after the 1997-98 El Nino.
https://www.facebook.com/photo.php?fbid=1030302183714010&set=a.1012901982120697.1073741826.100002027142240&type=3&theater
https://wattsupwiththat.com/2017/01/23/december-2016-global-surface-landocean-and-lower-troposphere-temperature-anomaly-update-with-a-look-at-the-year-end-annual-results/comment-page-1/#comment-2404993
My work suggests that The Pause would extend back to 1982, were it not for two huge volcanoes in 1982 and 1991; Bill Illis’s work suggests The Pause extends back to at least 1958.
Since there was global cooling from about 1940 to 1975, one could conclude that there has been no net global warming since about 1940.
Regards, Allan
https://wattsupwiththat.com/2016/11/16/october-2016-global-surface-landocean-and-lower-troposphere-temperature-anomaly-update/comment-page-1/#comment-2342825
NOT A WHOLE LOTTA GLOBAL WARMING GOIN’ ON!
[excerpt} … Bill Illis has created a temperature model that actually works in the short-term (multi-decades). It shows global temperatures correlate primarily with NIno3.4 area temperatures – an area of the Pacific Ocean that is about 1% of global surface area. There are only four input parameters, with Nino3.4 being the most influential. CO2 has almost no influence. So what drives the Nino3.4 temperatures? Short term, the ENSO. Longer term, probably the integral of solar activity – see Dan Pangburn’s work.
Bill’s post is here.
https://wattsupwiththat.com/2016/09/23/lewandowsky-and-cook-deniers-cannot-provide-a-coherent-alternate-worldview/comment-page-1/#comment-2306066
Bill’s equation is:
Tropics Troposphere Temp = 0.288 * Nino 3.4 Index (of 3 months previous) + 0.499 * AMO Index + -3.22 * Aerosol Optical Depth volcano Index + 0.07 Constant + 0.4395*Ln(CO2) – 2.59 CO2 constant
Bill’s graph is here – since 1958, not a whole lotta global warming goin’ on!
My simpler equation using only the Nino3.4 Index Anomaly is:
UAHLTcalc Global (Anom. in degC, ~four months later) = 0.20*Nino3.4IndexAnom + 0.15
Data: Nino3.4IndexAnom is at: http://www.cpc.ncep.noaa.gov/data/indices/sstoi.indices
It shows that much or all of the apparent warming since ~1982 is a natural recovery from the cooling impact of two major volcanoes – El Chichon and Pinatubo.
Here is the plot of my equation:
https://www.facebook.com/photo.php?fbid=1106756229401938&set=a.1012901982120697.1073741826.100002027142240&type=3&theater
I agree with Bill’s conclusion that
THE IMPACT OF INCREASING ATMOSPHERIC CO2 ON GLOBAL TEMPERATURE IS SO CLOSE TO ZERO AS TO BE MATERIALLY INSIGNIFICANT.
Regards, Allan
_____________________________
https://wattsupwiththat.com/2016/07/01/spectacular-drop-in-global-average-satellite-temperatures/comment-page-1/#comment-2250667
I plotted the same formula back to 1982, which is where I (I think arbitrarily) started my first analysis. Satellite temperature data began in 1979.
That formula is: UAHLT Calc. = 0.20*Nino3.4SST +0.15
It is apparent that UAHLT Calc. is substantially higher than UAH Actual for two periods, each of ~5 years,
BUT that difference could be largely or entirely due to the two major volcanoes, El Chichon in 1982 and Mt. Pinatubo in 1991.
This leads to a startling new hypothesis: First, look at the blue line, which shows NO significant global warming over the entire period from 1982 to 2016. Perhaps the “global warming” observed after the 1997-98 El Nino was not global warming at all; maybe it was just the natural recovery in global temperatures after two of the largest volcanoes in recent history.
Comments?
Regards, Allan
https://www.facebook.com/photo.php?fbid=1030751950335700&set=a.1012901982120697.1073741826.100002027142240&type=3
Now I remember – it’s terrible getting old.
Bill’s 3-month lag is between NIno34 anom and TROPICAL UAHLT anom.
My 4-month lag is between Nino34 anom and GLOBAL UAHLY anom.
Global temperature tracks ~1 month after Tropical.
Alan
I did some work on the climate response to Mt Pinatubo and found that within a month or two of the eruption there was an excess of incoming solar energy: ?w=843
https://climategrog.wordpress.com/2015/01/17/on-determination-of-tropical-feedbacks/
UAH TLS gives us a clue to the volcanic effects; The two volcanoes produced two persistent downward steps in TLS ( after the initial peaks ). This implies less radiation getting blocked in the stratosphere and making it into the lower climate system.
I think this is evidence of , not just “recovery” but an actual warming effect produced by these eruptions. This is likely due to destruction of ozone ( which was SO2, not CFCs ) and probably natural purging of built up anthropogenic stratospheric pollution along with the volcanic aerosols.
That is my view and it seems to go in the same sense as what you are saying.
Don’t think I’ve ever seen someone use a track hoe to ‘level’ an area, front loader maybe, tractor or bulldozer with an articulating blade sometimes but mainly a grader. My 1948 collectable grader works fine, check the fuel and fill the hydraulic tank! Keep up the good work Willis.
My Ford 1810 compact 4wd farm tractor has a detachable 770b hydraulic loader bucket with 1100# breakaway, plus a 7 foot reversible/angleable grader blade for the leveling rear 3point implement hitch. Together, leveling that patch would take about an hour including moving dirt spoil to wherever.
Both tools used to cut about 3 miles of reasonably level ‘roads’ through the woodlots for firewood removal (snake out using tractor with logging chains/tines), hunting ATV access, and dirt bike/snomobiling once the trees within the lanes were cut out. Took four years, mostly in winter, to mark and cut the lanes and summer bucket out problematic flush stumps.. Then used the 3pt hitch 6 foot brushhog to maintain the trails every couple of years from saplings, small deadfall, and multiflora rose. Main brushhognuse was pasture maintenance and corn stubble shredding prior to plowin or notill planting. More than enough natural dead tree firewood each year to provide for three farm families heating mostly with wood in winter, plus sell some cut/split into the local town.
There is an elephant here nagging me to point out the following. HadSST don’t follow RSS that well. Individual NH and SH don’t either. Crutemp (land) does after detrending slightly ( adjusting for similar linear trend) but not as well as all three combined.
There is no physical reason for the discrepancy.
“Dang … I certainly didn’t expect that nearly perfect mirror-image. When the NINO3.4 area warms up the North Atlantic and the other areas cool down, and vice versa.”
Your figure 5 blue line is getting drowned out by all the other blue areas, it does not represent the timing of North Atlantic anomalies well.
Can anyone explain the Brazilian current? I expected it to be warm but when I dove off Cabo Frio (there’s a hint in that name I didn’t take) I froze my equipment off. Where is that warm tropical water heading South along the Eastern edge of a continent as it should do?
Good question, Robert. Almost all of the equatorial warm water striking South America flows north, because of the geometry of the equatorial area of eastern South America. As a result, there’s no significant south-flowing current as there is in the Pacific.
Regards,
w.
The Brazilian Current is a “warm” current, but the term is relative to surrounding water temperatures and that of the part of a gyre from which it springs. As with all western boundary currents in the SH, it flows north to south, ie poleward.
Please see the map I posted above. Thanks.
https://en.wikipedia.org/wiki/Brazil_Current
Close in to shore, it’s possible for water temperature to differ from that of the current farther out, as well.
Cabo Frio has got it’s name (‘Cold Coast’) because of it’s underwater topography that in combination with prevailing winds during seasons results in a strong cold upwelling. That has given it it’s name. For it’s relative coolness it is a popular resort for the nearby Rio de Janeiro.
The literal translation of ‘Cabo Frio’ is ‘Cold Cape’.
Am I on the right page here?
http://di2.nu/foia/foia2011/mail/0248.txt
I notice the split between cold and warm areas in the Pacific is across a north south axis whereas in the Atlantic it is across an east -west line. These are dynamic systems with no obvious connection between them via their water bodies. So I would look at this as two separate systems in which the water bodies respond to broadly similar thermal forcings but within different geographic constraints – shapes of land masses, depths of the seas and shape of ocean floors. The latter affect the masses of the water bodies and their flows. Other properties such as salinity are also different between them. Therefore I would expect them to respond differently to the same external thermal forcings. It may be only by coincidence that the differences between the properties of the water bodies and the physical constraints on their dynamic behaviour result in an anti-phase relationship. The relationship is with the forcings, not between each water body.
I’m replying to myself to add a postscript. Another factor would be the behaviour of the atmosphere (primarily cloud cover) over each water body may also differ such that, other factors being equal, solar forcing is modified at the surface of each water body differently in a cyclic way.
Unlike the rest of us, who only reply to ourselves because the dog just doesn’t listen anymore.
“Unlike the rest of us, who only reply to ourselves because the dog just doesn’t listen anymore.”
LOL 😉
“In my peripatetic meandering through the CERES satellite data…”
Sounds painful! I’ve heard if it lasts more than a few hours you should have a doctor look at it, it can be very dangerous.
Try Viagradril. If your erection starts sneezing, call your doctor for an over the phone high five!
What’s an erection?
What’s a pup-tent in the morning?
It’s like an election, only different.
“What’s a pup-tent in the morning?”
A happy day?
“What’s a pup-tent in the morning?”
A happy day?
Sort of like a Trump Presidency.
Here’s my problem.
http://www.bbc.com/future/story/20150623-why-looking-at-the-light-makes-us-sneeze
I would love for my erection to start sneezing.
IMHO, “photic sneezing” really doesn’t hold a candle to “penile sneezing”.
Wait.
I could have that wrong…
wonting (sic)
It seems to me that since the major surface areas that are negatively correlated to the NINO3.4 temperature are over oceans rather than land, the removal of NINO3.4 temperatures from the temperature record just provides an interesting, normalizing statistic for us living on land.
To be more accurate, one could track the average departure for each grid cell over many El Ninos, and then add or subtract accordingly for your region.
Thanks Willis.
Idea 1:
The cold Atlantic is water pushed out of the Arctic as happened a few years ago when the inflow through the Bering Strait was strong, relatively, melting the ice NW of Alaska and the hearts of polar bear savers everywhere.
Idea 2:
What is the distribution of temperature measuring points? Could it be that the sampling of the ‘global temperature’ prior to ‘infilling’ is such that ‘removing the El Niño’ results in something closer to the global average in non-El Niño years?
In other words it ‘usefulness’ could be an artifact of sampling inhomogeniety.
The same could of course apply to the numbers you used as inputs. If they are similarly gapped, I the output can create correlation numbers that are not really there.
However, I agree with the position that subtracting anything is not justifiable. The implication of leaving in all readings is that the instantaneous average global temperature is a heck of a lot more variable than anyone wants to admit, especially on the AGW side.
Think about what the claims are: they ‘have detected the AG signature in the global temperature. Really? Not if the actual temperature is used.
The only way to subtract the El Niño is to misrepresent what the measured temperature is. How is that helpful in identifying AG influence? Who says the El Niño is not ‘human influenced? How can humans emitting CO2 influence the temperature of only select parts of the ocean surface.
Conclusion: the surface temperature of the Earth is a lot more variable than previously assumed, and there is zero chance of identifying the influence of AG CO2.
I see a lot of comments about how the two things can effect each other. It appears that a third thing is causing both since they are occurring at the same time.
“We’ve done over 1400 shows, so it’s not surprising one could eat, suck or blow.”
— KPIG.com
Bringing you pure pork goodness since the FCC shut down KFAT.
El Niño is an effect.
Not a cause.
It is a pattern of how heat is released.
A simple look at units should clue you in.
Oh come on Steve!
CO2 is an effect.
Not a cause.
A simple look at the timeline should clue you in?
The climate has no beginning or end. It is continuous and everything affects everything else. That is why you cannot model it, because you cannot produce an initial state (and of course because you don’t understand it well enough, but that is actually a less important point).
Saying one element is an “effect” is simply nonsense, literally.
There are two distinctive fallacies with this type of studies, namely the basic temperature data and (2) ENSO. The data present high variability in space and time. Such data can be used to infer something at individual station level without modifying but averages over a region have their inherent defects. Also, ENSO is not new this is part of science of meteorology. The global warming and ecological changes form part of trend but not influenced by the ENSO system as such but effected by the averaging of data. This is the falacy of presenting every month changes.
Dr. S. Jeevananda Reddy
Willis, see my comment above. It may be worth adding corr fn as an update. It seems to be the crux of the argument about lags and causation.
https://wattsupwiththat.com/2017/06/24/the-north-atlantic-seesaw/comment-page-1/#comment-2534874
OK, here’s the deal.
Earth is a liquid water planet. No other planet in the solar system has liquid water on its surface. This is the most important fact about our planet and its climate system.
Regardless of the configuration of the continents, Earth almost (probably always) has a water hemisphere and a hemisphere with substantial amounts of land. IOW, there has in effect always been a Pacific Ocean-equivalent.
Earth’s climate system is driven by the sun shining on this half-world ocean. Nothing else matters much. More sun for decades, centuries, millenia, etc, and there will be warming. Less and there will be ice.
Ocean circulation moderates these heat transfers and regimes.
CO2 above ~200 ppm isn’t even in the picture.
I couldnt agree more.
Similarly I agree and add to it two points:
First is that we all tend to agree that the atmosphere/water interface is around 70% of the earth’s surface: but in fact when the close interface between air and plants is considered the actual area is huge.
Second is that very little is said about the vaste reserves of energy beneath our feet which intermittently makes its presence known in volcanic and tectonic activity. Do we really know what is happening in the depths of the mid pacific when these El Nino events occur?
Is this a case where the unknown is conveniently ignored or perhaps considered a constant in the calculations with no influence on anomalies.?
As usual, clear and thought provoking. Not something I know much about or am capable of knowing much about. Two thoughts though.
1. You refer several times to “global temperature”. I agree, there probably is such a thing. But I’m far from sure we’re measuring it “properly”. What we probably want is a metric that tells us how much heat energy is available to the surface of the Earth. What we have is a guess at the integrated sum of surface temperatures across the planet. I doubt those are the same thing. How different? I don’t know. But the difference may be significant.
2. It’s pretty well established that tropical and mid-latitude wind patterns change worldwide during El Nino. e.g. less Atlantic tropical storm activity. Perhaps the North Atlantic temperature anomaly is simply a reflection of the altered wind patterns?
Re your excavator. I got to watch guys who know what they are doing with those dig up my street last Summer to replace a km or so of water and sewer lines. It’s amazing how precisely they can control a large bucket on the end of a long set of lever arms. They did, nonetheless, manage to cut my phone line once and my power line twice.
“What we probably want is a metric that tells us how much heat energy is available to the surface of the Earth. ”
Well in that case you do NOT want to be using an average temperature of different physical materials whose specific heat capacity. Temperatures are NOT additive quantities and thus can not be averaged.
Mean temps only have a statistical meaning as in the probability of finding a particular temperature if you land somewhere on Earth . They are NOT suitable for energy budget calculations.
https://judithcurry.com/2016/02/10/are-land-sea-temperature-averages-meaningful/
Greg:
Right on. The use of an intensive metric to report an extensive quantity is a fundamental error.
Averaging temperatures measured in different parcels of air with different water vapour contents is pointless. What is it supposed to indicate?
As an ‘indicator’, maybe it tells us what to wear today but we have people reporting the average global temperature to 0.001 degree precision from temperatures measured (at best) at 0.02 without any consideration of the enthalpy of the air involved. The absolute humidity varies enormously.
Can we propose a metric that has meaning? Can the OCO Satellite measure H2O as well?
In the update to that article on C Etc. I suggested possibly weighting land and sea temps before averaging together. It’s still technically, fundamentally wrong but trying to get the whole of humanity to realise that global temps are BS at this stage may be too late. It’s a hack to reduce the error.
For my money you’d be better off just using SST and maybe OHC if you want a calorimeter. Land is 30% and if you downscale it a factor of two that 15% and you may as well just leave it out.
The oceans capacity to store heat is probably no greater than the suns ability to fill it with energy, the oceans are not more powerful than the sun so it cannot just decide to take in more energy whatever the sun decides to do. the energy going into the oceans is constrained by the level of solar radiation which means that you can have less energy entering the oceans if there are more clouds but you cannot have more radiation entering the oceans without clouds unless solar radiation increases and solar radiation did not increase before the last el nino that we have had so where did this extra heat come from which made this latest event apparently larger than the last. Is it because the oceans can store more heat than the land(filled to the same extent as the land even though the ocean can store more heat than the land) or ocean currents (controlled by the level of solar radiation also). The real global temperature is determined by the level of solar radiation falling on the land plus the amount of solar radiation entering the oceans, the large positive anomalies of the oceans relative to the land are false and do not indicate that the earth is heating up at all.
Willis,
Regarding your Figure 1, exactly what data have you used? The global data seems to trend distinctly up over the period compared to the NINO3.4 data.
When I go the the CERES data page, download their latest data (CERES EBAF Ed4 Sfc) and plot it, the two curves (global and NINO) seem to correlate much more tightly over time than what your plot appears to suggest:
Ah, so this is temperature “anomaly” data. Willis constantly refers to temperature and I suspected that it was ‘anomalies’. I intended to ask.
Willis – Interesting Post – I am from Western Australia and I have noticed over the last 12-24 months a persistent and anomalous cloud band streaming SE from the west side of south east Asia and Indonesia across Western Australia’s Pilbara Coast. There are some traces of it in today’s satellite photo but it is by no means as dense as it has been in the past two years. The climate of the southern west coast of WA has also been much more influenced by tropical cloud bands than the typical winter frontal events over the last few years. The normal alarmists are saying this is the end of the world due to climate change but I am thinking it is pretty natural climate variation (we only have a 200 year record of weather here as the place was only settled in 1829). The distribution and extent of cloud cover I would think correlates closely with the green and blue anomalies highlighted in several of your figures. It may be something that links this post with your views of thermal regulation by thunderstorms and cloudiness in tropical latitudes if you want look at correlating these anomalies with cloudiness.
@ Willis Eschenbach
“The oddity from my perspective is the North Atlantic. It moves in opposition to the NINO3.4 area, but the physical nature of the connection (or teleconnection) between the two is not clear to me.”
Hypothesis:
The Gulfstream moves water north along the east coast of North America. Some of the water go east, south the west coast of Europe, North Africa and back west. Some of the water continues north of Scandinavia and below the Arctic icecap.
If the water isn’t allowed to continue under the icecap to the North Pacific, could that influence the temperature in the North Atlantic?
At El Niño conditions, the east-west equatorial current in the Pacific is slowed or reversed. If the Kuroshio is slowed because of this, the current under the icecap from the North Atlantic could speed up leading to lower temperatures in the North Atlantic.
At La Niña conditions, the east-west equatorial current in the Pacific is strong. If the Kuroshio is also strong because of this, the current under the icecap from the North Atlantic could slow down leading to higher temperatures in the North Atlantic.
As the influences are mechanical, they are instant, so the anti-correlation would be without lag.
To falsify this hypothesis, you need to check the speed of the ocean current in the Arctic and compare it to the El Niño/La Niña conditions.
Osnap data may help there, but is as yet unreleased from its deployment.
It is possible to track Argo bouys via a filter on google earth, a data savvy type may be able to extract velocities from this and get all kinds of info??
I write “equatorial current”, and I don’t mean the actual “equatorial counter current”. I mean the current just north and south of the Equator.
John Harmsworth
Basically the Gleissberg is 86-87 years but there is an upturn and downturn of the sine wave, e.g. as I discovered in Alaska,
http://oi60.tinypic.com/2d7ja79.jpg
admittedly I was out by a little more than 1-2 years with the minimum [of maxima)] having been reached in 2014-2015
Taking into account that the GB is a sinewave, you can count back about 1/2 GB = 43.5 years ,
i.e. 2017.5 – 43 = 1974.
You observation that the weather / smell is similar to 1974 makes therefore perfect sense [to me],
however, don’t make the mistake of thinking it will get warmer. You must start counting back now (i.e. 2017.5) from 1974 down to the sixties if you get my drift….
Excellent analysis, and I think you are right. The temperatures may well cause the El Nino / La Nina, but I have problems with this statement:
The problem is that if El Nino / La Nina works as a regulator for the pacific, the effect for the globe as a whole will be the opposite.
If some local temperature regulator causes the temperatures to be more evenly distributed around the globe, the heat radiation to space will decrease and the global temperatures will rise.
This is because the radiation is governed by Stefan-Boltzmanns law where the radiation increase with the fourth power of temperature. This means that a small increase in temperature cause a lot more radiation. A globe with large temperature differences will on average be cooler than a globe with even temperatures, all others held unchanged.
/Jan
“When enough heat has accumulated in the eastern Pacific, the El Nino / La Nina pump pushes warm water first westward, then poleward. This cools the eastern Pacific and warms the western Pacific. In the South Pacific, you can see how it goes around Cape Horn at the south end of South America.”
Are east and west mixed up here, or what am I missing ?
I wondered that, but IMO it refers to conditions after an El Nino has formed.
I think that is what he intended to write. It’s Willis’ rewrite of ENSO.
Willis wrote: “And more to the point, why should we remove it? The El Nino / La Nina pump is a central part of the natural thermoregulatory mechanisms that keep the temperatures within a very narrow range (e.g. ± 0.3°C during the 20th Century). The Nino pump kicks into gear whenever excess heat accumulates in the equatorial Pacific waters and moves that warm water to the poles.”
If the ENSO “pump” moves warm surface water from one location on the surface to another, then it has nothing to do with the thermoregulatory mechanisms that control our temperature. The only way to get rid of heat is to radiate it to space, mostly from the upper troposphere. Does CERES show an increase in net inward radiation during the warming phase of the recent El Nino and a decrease as the temperature fell? If not, then ENSO is about variation in where heat is located within the climate system (internal or “unforced” variability), not about long-term regulation of our planet’s temperature. Temperature change forced by a change in the radiative balance across the TOA should NOT be removed from the temperature record, but internal variability can be.
Figure 3 clearly should that unusually high (or low) temperatures near the Nino3.4 region are associated – with no lag – with unusually low (or high) temperatures elsewhere elsewhere in the Pacific. This is consistent with the idea that warming is associated a change is heat flux on the surface. Looking for lagged relationships may help demonstrate where unusual heat is transported to. However, when planet surface AS A WHOLE is up to 0.5 K cooler after an El Nino ends and La Nina starts – and if this is not due to increased radiative cooling to space – then heat transfer between the surface and deeper ocean must be involved. In the absence of an El Nino, the Eastern Pacific is cooled by the upwelling of cold water off of South America, and winds normally carry that cold water across the Pacific as it is gradually warmed by the sun, to the Western Pacific where it is buried by downwelling. (Some of the normal westward flow occurs on the surface, beginning with surface flow towards the equator in the East and away from the equator in the West. That is why some places in the Western Pacific are cold when the Eastern Pacific is warm. However, movement on the surface can’t change the MGST: Only changes in vertical flux can change surface temperature. Those vertical changes can be changes in radiation (changed OLR or reflected SWR) or in upwelling and downwelling
“Now, many people say that this shows that the El Nino / La Nina is causing the global temperature changes. I say that the causation is going the other way.”.
Yes.
http://www.drroyspencer.com/2016/01/what-causes-el-nino-warmth/
This recognises the anti-correlation Willis points out.
“…during El Nino, there is an average decrease in the vertical overturning and mixing of cold, deep ocean waters with solar-heated warm surface waters. The result is that the surface waters become warmer than average, and deeper waters become colder than average.”
“In a sense, the deep ocean provides an air conditioner for the climate system, and during El Nino the air conditioner isn’t working as hard to cool the atmosphere.”
“Since the atmosphere responds to surface heating, anomolous warmth in the upper ocean layers gradually heats the atmosphere, mainly through increased precipitation heating in response to large rates of evaporation from the warm surface waters.”
afonzarelli: If ENSO is due to changes in heat transport within the ocean – as Roy suggests – and not to changes in radiative imbalance at the TOA, then ENSO is internal variability within the climate system that produces short-term fluctuations. It is therefore perfectly sensible to remove the ENSO signal from temperature records to clearly see the long-term change produced at the TOA by rising GHGs – a change that is being obscured by these fluctuations.
However, Roy raises the complication ENSO is also associated with a change in albedo. Albedo is part of the radiative imbalance (forcing) at the TOA.
Willis,
in general you are right if you use the real time response as you did.
but bob tisdale did show how it works: the indian and atlantic ocean does “follow” the el nino with a lagged response of around 3 months…
The el nino is a bit more complex then that… what you show is it’s “loading pattern”, which is well known (and that’s where you are correct)
In response to prior comments above
“But those [TSI] changes are so minuscule and so short-lived [less than 1/1000 of what we get from the Sun every day] as to have no measurable effect on the climate.”
“That is what caused a 0.05 degree variation [0.9/1361/4*288] of global temperature over the solar cycle [from 2008 to 2015]”
Note this is a THEORY that these small TSI changes matter so little according to one formula. Where is the real world test for such claims? My solar theory formulas and models are real-world tested.
The sun provided all the energy for the great 2008-2016 SST spike, all 0.6C.
“Note that it is possible that SORCE TIM has a calibration problem [see the other link]. We are looking into that at the moment. The problem is not important for the overall explanation”
I noticed 2 years ago the variation in the correlation of SORCE TSI to F10.7cm over time and account for it in my 90-day model. The problem was not important for the overall explanation of my works either.
***
“‘The magnetic flux that decayed from the sunspot peak in 2014 flowed to the poles and by early 2015 provided the maximum magnetic potential for TSI.’
No, we do not mean the same thing. The polar fields are not controlling TSI and have nothing to do with TSI.”
Yes we do mean the same thing except you haven’t acknowledged the data I presented nor its meaning.
It is a matter of solar data and observational fact that the sunspot number peak in every solar cycle generates the maximum plasma flow to the pole, observable in the image below, flow that generates the maximum TSI when the plasma reaches the pole. It’s in the data. All you have to do is go through the solar data to discover a basic temporal relationship: TSI peaks after SSNs and F10.7 peak. It has to do with sunspot decay and plasma flow time. The 2014 sunspot peak created the 2015 TSI peak.
http://wso.stanford.edu/gifs/all.gif
I did not specifically claim what you said. I did not say “The polar fields are controlling TSI” – I said the cycle TSI peak happens at the time when the SSN peak plasma gets to the pole”, a fine distinction. The whole sun electromagnetic field, TSI, is at it’s max right at that time. It’s in the data. You can’t credibly say the process has nothing to do with TSI. It has everything to do with TSI.
Note this is a THEORY that these small TSI changes matter so little according to one formula
According to a well-established physical law https://www.youtube.com/watch?v=8hJx2Kjtz0U
I said the cycle TSI peak happens at the time when the SSN peak plasma gets to the pole”, a fine distinction. The whole sun electromagnetic field, TSI, is at it’s max right at that time. It’s in the data. You can’t credibly say the process has nothing to do with TSI. It has everything to do with TSI.
What you are trying to say is that TSI is maximum at solar maximum. The polar fields also reverse at that time, but this is just a timing thing, not a cause. The plasma flow has nothing to do with this. The typical time for the flow to go from the sunspot zones to the polar region is about two years and it takes several such consecutive surges of magnetic flux to reverse the polar fields. But again, nothing to do with TSI. Here you can see the latest reversal: http://jsoc.stanford.edu/data/hmi/polarfield/
electromagnetic field, TSI,
TSI is not the ‘electromagnetic field’ of the sun, but the energy flux. Here is what an electromagnetic field is https://en.wikipedia.org/wiki/Electromagnetic_field
Other ways to “smooth out the ENSO” cycles from the global temps are possible, rather than simply subtracting off a weighted ENSO index, like NINO 3.4, as Santer et al (2014) did.
In sea-level work, sometimes analyses are done using just tide gauges from locations where vertical land motion is thought to be very low, e.g., Jerry Mitrovica’s list of 23 (or view thumbnails), or Simon Holgate’s list of nine (or view thumbnails).
Analogously, you could make an ocean temperature index which simply excludes the orange and blue regions in Willis’s map.
Alternately, for sea-level work you could smooth out the strong effect of ENSO on some Pacific tide gauges by calculating a weighted average which includes gauges at both the eastern and western sides of the ocean, which see opposite effects on sea-level from ENSO as the Pacific “sloshes” back and forth. That would cause the opposite-sign ENSO effects cancel in your average. For example, a weighted sea-level average of about 55% San Diego plus 45% Kwajalein should exhibit very little ENSO signal, even though both locations are strongly affected (in opposite directions) by ENSO. (Note: I’m just guessing at the percentages, I haven’t calculated them.)
http://www.sealevel.info/1820000_Kwajalein_San_Diego_2016-04_vs_ENSO.png
Analogously, one could weight different areas of the oceans differently in a “global average” ocean SST index, giving a bit more weight to the ocean regions which are negatively correlated with ENSO, and a bit less to the ocean regions positively correlated portions, until the ENSO signal disappears in the “average.”
One possible refinement: For temperatures, you might be able to do even better at erasing the ENSO signal by applying a modest time-shift to some regions, before calculating your average, to account for delays in the ENSO signal. (For sea-level, that’s not necessary, because when the incompressible water “sloshes up” in one place, it “sloshes down” in another, simultaneously.)
Willis, there is a problem with your interpretation Nino3.4 and El Nino. If you look at either of your two maps you can’t help noticing that this is the warmest body of water anywhere on earth. How did it get that way? There is no sign of how it was done in the graphs. Fact is that we are looking at one phase of the El Nino formation that did not begin in the Central Pacific Ocean. I am fairly sure you did not read my book so let me put it together for you. The source of this very warm water is the Indo-Pacific Warm Pool, which it emptied because it now looks blue on your chart. But the real beginning of an El Nino event is further back and begins with the trade winds. They blow from east to west and drive warm Pacific waters up into a bulge we call the Indo-Pacific Warm Pool. Eventually the trades reach a limit of how much water can be pushed up and gravity flow in reverse begins. It goes down along the equatorial counter-current that starts at the warm pool, crosses the ocean along the equator, and hits South America, There it splits north and south parallel to the coast. Its warm water now spreads out, warms the air above, warm air rises, joins the westerlies, and we notice that an El Nino has arrived. This happens mainly along the California coast because the Andes block the westerlies in South America. But any water that runs ashore must also retreat. As the El Nino wave retreats water level in its wake goes down as much as half a meter. Cold water from below will then fill that vacuum and a La Nina gets started. This is a dynamic situation and can be followed because of constantly occurring temperature changes. The Nino3.4 maximum happens wqhen the batch of warm water from the Ind0-Pacific Warm Pool has reached the Mid-Pacific. There is a time delay after this until it has reached far enough along the coast and sent up the warm air we take take to be the arrival of the El Nino. What happens next? The warm air gets carried across the US, Mexico and the Atlantic ocean and then gets registered in Europe with a time delay. . It continues further eastward and is detectable also in Japan with an additional time delay, required for the westerlies to get there. The US, Mexican, European, and Japanese records of global temperature trace out the same ENSO oscillation of which the first memnber is the Nino3.4 we picked up in the Central Pacific. This keeps repeating but the frequency may be variable. BEST once showed these parallel ENSO waves recorded by different national observatories. Going back to the La Nina we saw starting, when it crosses the Pacific it is followed quickly by the next El Nino that the trade winds have been building up up to follow the same path its predecessor did. From figure 15 in my book I judge the average ENSO period , the space between two peaks, to be about four years but it can be changed by other things happening in the ocean. Many dynamic aspects of this systems have not been properly studied. The westerlies that carry it all over the world, for example, are a blanket of contiguous and parallel El Nino waves, And something else occurs to me that is not well studied – the30 degree temperature maximum for the oceans. I think that getting those Argo measurements out to prove it is deserving of name recognition for you.
Arno Arrak wrote, “And something else occurs to me that is not well studied – the30 degree temperature maximum for the oceans.”
I’m impressed by your very in-depth knowledge about ENSO, Arno.
But the topic of the apparent “thermostat” limiting ocean temperatures has been studied by Willis, and before him by Lindzen, and before him by Ramanathan & Collins.
Willis wrote about it two years ago, here on WUWT. It is a particularly wonderful piece of work:
http://wattsupwiththat.com/2015/06/03/albedic-meanderings/
I’m less well acquainted with Lindzen’s work; for info see:
http://www-eaps.mit.edu/faculty/lindzen/adinfriris.pdf
https://judithcurry.com/2015/05/26/modeling-lindzens-adaptive-infrared-iris/
For Ramanathan & Collins see:
http://lightning.sbs.ohio-state.edu/geog5921/paper_thermostat_Ramanathan1991.pdf
http://www.nature.com/nature/journal/v358/n6385/pdf/358394a0.pdf
For the sake of balance, here are links to SkS’s arguments against such a mechanism:
https://skepticalscience.com/infrared-iris-effect-negative-feedback.htm
https://skepticalscience.com/tropical-terhmostat-limits-sea-surface-temperature-to-30C.htm
(Beware: I do not consider SkS a reliable source.)