
Guest essay by Eric Worrall
h/t James Delingpole / Breitbart – University of Manitoba has a new term for excess sea ice; they now call it “climate change”.
Large Canadian Arctic climate change study cancelled due to climate change
The Science Team of the Canadian Research Icebreaker CCGS Amundsen has cancelled the first leg of the 2017 Expedition due to complications associated with the southward motion of hazardous Arctic sea ice, caused by climate change.
This regrettably postpones the much-anticipated Hudson Bay System Study (BaySys) involving 40 scientists from five universities across Canada. Timing was key for this $17 million, four-year, University of Manitoba-led project.
The need to deal with extreme ice conditions in the south meant the ship would arrive too late on site to meet research objectives.
…
The decision to terminate the 2017 program has significant impacts on partners and the large number of graduate students involved.
“Considering the severe ice conditions and the increasing demand for Search And Rescue operations (SAR) and ice escort, we decided to cancel the BaySys mission. A second week of delay meant our research objectives just could not be safely achieved – the challenge for us all was that the marine ice hazards were exceedingly difficult for the maritime industry, the CCG, and science,” says Dr. David Barber, Expedition Chief Scientist and BaySys Scientific Lead.
…
Read more: http://news.umanitoba.ca/large-canadian-arctic-climate-change-study-cancelled-due-to-climate-change/
At least we now have an answer to the question “What do Arctic researchers do if they are stuck in port for two weeks?”. The answer is they find new ways to torture the English language.
So there is no warming and melting of the ice up there. It is just moving south.
Currents is a sign of CO2?
It’s all the winds fault.
The miracle of Global Warming…Now it causes To Much Ice
Soon Global Warming will cause too much cooling… oh wait they did that one already.
That is the current “thinking” at the moment.
“Thinking”?
Most call it something else: “Making stuff up”.
Didn’t a well known new ocean liner get sunk by ‘southward moving ice’ about 100 years ago .
Don’t wake Leonardo, he’ll only say it’s weather.
Must have been a real hell on earth when CO2 was in the 1000’s
Especially for those who have to keep the grass trimmed “just so”….
Probably finding the weather too cold and migrating south to find a warmer home.
Too much ice – it’s climate change.
Too little ice – it’s climate change.
That’s real science for you!
Bratby;
That’s real money for you!
I.e., the house always win.
And by house, I mean government and the crony capitalism that funds it.
And by win, I mean more of my income…
Straight outta Paul Daniel’s Victorian Bunko Booth sketches. ‘Heads I win, tails you lose’. This scam has now gone beyond parody…again.
“That’s real science for you!”
I think it is called obsession when one sees human-caused climate change in everything.
These people are walking around in a nightmare world where CAGW is here and now. It must be scary living in their world.
Sadly, TA, and in all seriousness, imagine how all the elementary school children being introduced to that “nightmare world” by their classroom teachers and misguided curricula must find living in today’s scary world. We are doing them a great disservice akin to child abuse by filling their heads with Al Gore’s “we’re all gonna die” nonsense at ages as young as five or six. And then we wonder why some of them act as if they don’t give a damn about anything anymore to the point of torturing the helpless, old, and infirm?
Good points, Rod.
The alarmists are scaring a lot of people and causing some of those people to overreact based on false assumptions.
The Lefty psycho who started shooting up the ballpark had attended Climate Change marches (in DC, I think), among other things. I don’t know which leftwing issue agitated him to the point of attempted murder. Probably all of them. He just snapped. He heard one too many liberals advocate violence against Republicans one too many times.
Getting back at our kids because we were scared of ” The Coming Ice Age”
In my parents generation it was the Atom Bomb.
At least the atom bomb existed.
Good point, MarkW. The atom bomb was a *real* threat.
The claim that the gospels are accurate because they were written so close to the time of the events is brought into question by what we witness the climate extremists doing. They rewrite the history, they hide declines, they claim there will be no ice due to “climate change”, then they blame too much ice it’s due to “climate change”. The climate believers, no matter what the event blame “climate change”. Just like no matter the outcome, it’s all “God’s plan”.
20/20 hindsight is a wonderful thing.
Meanwhile, Greenland’s snowpack increase remains unnoted by the MSM. Their misrepresentations of facts and deliberate omissions of pertinent facts are the earmarks of agenda-driven propaganda.
hunter
Certainly Al Gore’s god (his wallet) is giving him the message. His new movie is out soon, I cant wait.
http://www.breitbart.com/big-government/2017/06/09/al-gore-says-god-told-fight-global-warming/
I’ve wondered just how long and how many retellings of the gospels there were before the first written account that we actually have. Dead Sea Scrolls? Many generations of priests telling various congregations various things? How many copies of copies were there before one landed in an archive some place? What was left out of the 5th century bible?
I’ve never seen an accurate reporting of any story I’ve been involved in so why should we think these are the exception – aside from belief that is. Not discounting belief by any means but it would be nice to know what actually happened and was said.
There are differences. The Gospel authors were not chasing billions of denarii of Roman Imperial funding 🙂
A fragment of John’s gospel has been dated to between 100 and 125AD. Most scholars believe John was the last of the gospels to be written. It’s quite possible that the biblical traditions of the gospel’s being written by men who actually knew the apostles is correct.
There have been no substantive differences found between what’s written in the Dead Sea Scroll’s and the modern Torah.
Jesus had his ministry, died, and was resurrected, and plenty of people knew about it. They headed off in all directions to spread the good news.
And then the written accounts arose. They were consistent, and were recognized as accurate.
Extra-Biblical evidence corresponds. And in all of this, there is no evidence that the “Telephone Game” phenomenon occurred; that an admired figure had legends grow like a fish story; if so, we would have the successive generations, like historically the story of Robin Hood just kind of emerges across generations from a few contributing, less-developed story lines.
This is a matter of history.
Every civilization believing in one God or the other has throughout history sooner or later disappeared, from this we should have learned by now that we can’t rely on religion to survive ….
Too much ice – it’s climate change.
Too little ice – it’s climate change.
That’s real science for you!
No, too much talk — THAT’s climate science for you. (^_^)
Fire and Ice
BY ROBERT FROST
Some say the world will end in fire,
Some say in ice.
From what I’ve tasted of desire
I hold with those who favor fire.
But if it had to perish twice,
I think I know enough of hate
To say that for destruction ice
Is also great
And would suffice.
But fire is where the Grant Money is to be found!
Just the right amount of ice – It’s climate change too.
Dave Barrow
Just the right amount of ice to keep my red wine chilled.
It is summer here now in South London, and we had +23 C today.
Shorts – and maybe the fan again tomorrow . . . .
Kids won’t know what real heat waves – up to ohhhhh – +26 C, is, you know!
Auto.
Mods.
/Sarc
[Except about chilling my red wine. That is straight up truthful. It is French, a Vin de Table, and I have imbibed the same brand for over a decade [probably a decade and a half, now!].
What’s the just right amount of ice? — *crickets*
Where’s Goldilocks when you need her?
“Climate changes” doesn’t count!
According to THEIR rules:
—the fear…the danger… is warming. It HAS to be warming. The earth has been around for 4.6B years. And it’s been undergoing “climate change” for…..4.6B years.
—the fear…the danger…is that it is caused by co2….nothing else….none of the other 100 identified variables. It HAS to be co2.
—the fear…the danger…is not regular old co2. For this exercise in absurdity to be meaningful the globe-altering co2 HAS to be man-made. (we can’t change other sources)
So….it has to be PROVEN warming…..it has to be PROVEN to be caused by co2…and ONLY co2…..and it has to be PROVEN to be ONLY co2 caused by man.
These are THEIR rules!
Hilarious!
Another “ship of fools” to partner with Professor Turkey’s (Professor of Climate Change (no less!) at the University of NSW) disastrously failed mission to Antarctica a year or two back.
a report i saw at Iceagenow.info said the ice was up to 16ft? thick..so I guess calling it “rotten ” wont wash this time?
Could be called “more rotten”
/sarc
Just because there are some thick chunks, it doesn’t mean it’s all thick.
On the other hand … the ice conditions off Newfoundland are unusual this year, so much so that some fishermen are getting desperate. link Usually they can rely on being back on the water in March. They’re out of money and taking stupid chances.
The ice is said to be 4-8m thick. That is multi-year ice that has been building up since 2007. It is reasonable to assume that this year’s pattern will continue for a few years at least.
A danger is that if the current flow does not clear out by the time it starts to freeze again, it will greatly increase the freezing rate west of Greenland.
I think it matters where you’re measuring. In the late 1970s, in the Canadian Arctic Archipelago, when it was quite cold, we measured the ice daily so as to be able to call in air transport before the ice got too thin to land on. By this time of year, it was usually down to 1 meter thick. link
Crispin in Waterloo June 15, 2017 at 11:08 am
The ice is said to be 4-8m thick. That is multi-year ice that has been building up since 2007. It is reasonable to assume that this year’s pattern will continue for a few years at least.
The point is where has it been building up, there wasn’t any there last September. So where did it come from?
I think that honor should only have gone to them had they actually chosen to go anyway. At least they showed some sense in that regard, even if their stated reason for canceling was senseless.
How many “Ships of Fools” will there be before the Warmunists learn to check data on the polar icecaps before they depart?
https://youtu.be/5qY5_zJ23Qk
“Ship of Fools” part duh. Excuse my French.
That extra 2 weeks will give them time to mix more drinks, they have plenty of ice.
And write several more papers for peer-review. Easy, since all their peers are right there.
Albert Einstein Quote – Insanity: doing the same thing over and over again and expecting different results.
Griff will be along soon to say he was right about ice loss.
Griff will be along soon to say he was right about ice loss.
There’s an echo in here…
I posted from my mobile phone, on a bumpy train ride home, with fat bass player fingers.
there’s an echo in here… .. .
you can say that again.
Patrick MJD June 15, 2017 at 1:30 am
“Griff will be along soon to say he was right about ice loss.”
yes Patrick and he will be correct. At first the ice was lost-now it has been found.
See ice loss…..
michael (hiding behind garbage can lid)
Yes, the state of arctic sea ice this year is not good, sadly: thin, broken, dispersed and of record low volume.
A new record low or low in the ‘top lowest’ seems likely, but the rapidly changing state of the arctic makes things uncertain.
So: is this ice due to exceptional cold? A shift in the climate toward colder conditions? No.
It does seem to have something to do with this year being exceptional stormy across the arctic and the high level of ice export/dispersion
Most people call this weather, not climate change.
Griff: – are you admitting that the way we’ve been measuring sea ice is completely dependent upon wind?
From what I understand, the surface area is broken out into grid segments where we’ve been measuring sea ice. And for each segment, if there is 15% ice coverage then the entire grid area is added to the total. This means that the same amount of actual sea ice can be ‘measured’ in a range of six times its actual area. It all depends on how the wind is distributing it.
Thomas Homer
That is essentially true for “sea ice extents”. “Sea ice area” invokes more stringent rules, so the daily sea ice “extents” numbers are about 15% higher than sea ice “area” numbers. It’s best to only compare equal values to equal sources for equal values, since each sea ice laboratory in each different country and university have slightly different rules and standards for interpreting the common satellite daily values.
Thus, I use the daily Sea Ice Area values from University of Illinois Cryosphere Lab – who (used to) issue daily Arctic and Antarctic sea ice areas and anomalies. This allowed direct comparison between Antarctic and Artic sea ice for “sea ice area” using identically processed original data in the same lab. Unfortunately, the Cryosphere program stopped useful updates after multiple failures in April 2016.
And right on cue the paid troll cruises in and drops his predictable nonsense dressed up as defense of his climate religion.
Griff, record low volume over what period? There were camels, beavers, and deer living on Ellesmere Island 3.5 million years ago, and there was no Arctic ice cap. http://phenomena.nationalgeographic.com/2013/03/05/the-giant-camels-of-the-prehistoric-high-arctic/
In fact, temperatures have been below average in the arctic this spring after a mild winter. http://ocean.dmi.dk/arctic/meant80n.uk.php
If it was thin and broken, there would have been no need to cancel the trip.
The ice is currently greater than it was in 2012, so in 5 years, there has been no ice loss, hardly a record.
As always, Griff sees what it is paid to see.
Doesn’t look particularly thin to me:
http://www.cpom.ucl.ac.uk/csopr/seaice.html
Please note Griff, this is real data.
Randy S
Great find. And what about all that biomass frozen in the permafrost? I wonder how it got there.
Griff,
Arctic sea ice is about average for this time of year, despite the last two year’s lower than average minima, thanks to the super El Nino.
But it’s ahead of the record low year of 2012 and liable to remain so unless there are yet again August cyclones, which have produced all the lowest ice years at least since 2007.
IOW, the records are because of weather, not “climate change”. Three year averages since 2007 have averaged about the same. IOW, Arctic sea ice extent bottomed for three such intervals, and is liable to do so again in 2016-18, despite being off to a “bad” start last year. Then the bottoming might continue or turn up. Least likely is for extent to resume declining.
Not that less ice is a bad thing. It’s better.
Griff,
you need to contact the 40 odd wannabe sailors and tell them that somebody is pulling their respective legs … in the real world sea ice is below normal & there is no good reason to cancel the cruise.
The big question Griff:
Who is behind the conspiracy to eliminate/cancel the research expedition … who is afraid of the vast scientific knowledge that would have been gained as a result of 40 guys spending a few months on a boat in the arctic and sub arctic?
There are real villains out there somewhere and I nominate you to find out who is behind this sea ice disinformation campaign (start with the elder Koch brother … he has shifty eyes).
griff appears to be one of those alarmists from the asif that looks at images from a satellite with resolution of 250 km and thinks the smaller pieces of ice he can see are tiny.
he also thinks ice volume is measured, when it is not.
Chimp June 15, 2017 at 3:02 pm
Griff,
Arctic sea ice is about average for this time of year, despite the last two year’s lower than average minima, thanks to the super El Nino.
Actually it’s about 2 standard deviations below average (~1 million km^2 below).
Note that the scientists, Barber, said in 2009 that all the multi year ice was effectively gone, and only “rotten ice” remained. Now he says that this ice is mostly multi year ice, and proves warming.
That which was lost is now found. Let there be great rejoicing!
CAGW can do anything!
TA
In the right (AKA ‘wrong’) hand CAGW is the ultimate solvent.
Better than water, it gives you the solution you need – whatever you need a grant for.
‘Miraculous’ is a very poor descriptor . . . .
Auto
Mods – this is serious [or utter carp for true believers . . . .]
Happy Friday – soon.
I think he’s saying that he’s been walking on water again.
Find myself stuck on Poe’s law again. There is simply no way to parody something that brain-dead which makes it clear that humour is intended. That there are people posing as scientists sitting around seriously discussing these things is the actually alarming thing about alarmism.
Yes, and this little exercise alone is costing a mere $17million. But no doubt they will put the money to good use somewhere.
How about something along the lines of “Truth in English Composition”?
That is what I am afraid off. Since they were unable to do actual experiments based on observations, they will conduct the “experiments” on their computers using fake data and models.
barryjo
Consider also ‘steaks & beer in a Canadian bar’.
Auto
Auto, at least spending money on ‘steaks and beer’ provides a positive benefit to the local Canadian economy.
Again?
‘CCGS Amundsen re-routed to Hudson Bay to help with heavy ice – Worst ice conditions in 20 years force change of plans to icebreaker research program’
CBC News Posted: Jul 22, 2015 6:56 AM CT
“A carefully planned, 115-day scientific expedition on board the floating research vessel, the CCGS Amundsen, has been derailed as the icebreaker was called to help resupply ships navigate heavy ice in Hudson Bay……..
…….Johnny Leclair, assistant commissioner for the Coast Guard, said Tuesday conditions in the area are the worst he’s seen in 20 years……”
http://www.cbc.ca/news/canada/north/ccgs-amundsen-re-routed-to-hudson-bay-to-help-with-heavy-ice-1.3162900?cmp=rss
“in the area are the worst he’s seen in 20 years……””
So, LOTS of sea ice is “the worst” ????/
Then why the heck are they being so alarmist about a mythical decrease in sea ice.
The cognitive dissonance rattling about in their empty skulls must nearly deafen them !!
I assumed he meant the worst from the CAGW research-grant-seeker’s point of view.
Hey now, that quote was from Johnny Leclair, assistant commissioner for the Coast Guard. He’s no model loving ‘Climate Scientist’, he has to do his job in the real world.
And there’s nothing quite like needing to deal with reality to bring the ‘Climate Crises’ into perspective.
~¿~
Green Sand
Not quite! This didn’t occur in Hudson Bay. A thick but relatively small volume of ice broke off from northern Atlantic waters and flowed south, ending up off the Baie Verte Peninsula, Newfoundland, trapping some fishing vessels there. The research vessel, itself an ice breaker, was redirected to help out.
Ice conditions in Hudson Bay aren’t extreme this year and the research ship wasn’t trapped by ice at any stage. In fact, observations from the main sea ice extent databases (NSIDC, DMI and JAXA) suggest that Arctic sea ice overall is currently at around its 3rd lowest extent on record for the time of year.
3rd lowest extent…..so it’s improving and not as low as it was in the past
Latitude
B-b-b-but what’s the anomaly?
Finally an accurate description of what actually happened. I agree with most of what is posted here including the AGW is total BS but really guys read a little before making dumb ass comments.
I seem to recall reading somewhere that these people mentioned ‘thick, multi-year ice.’ I thought all the multiyear ice had long since melted away, according to the same mindset / people?
I don’t think Hudson Bay ever has multi-year ice as all it’s ice melts away every year.
This didn’t happen in Hudson Bay. It happened in Newfoundland. The ice in question is multi-year ice from much further north in the Atlantic that broke off and flowed south.
DWR54 June 15, 2017 at 4:15 am
The ice in question is multi-year ice from much further north in the Atlantic that broke off and flowed south.
OK, but who is to say how old multi-year ice should be? 5 years? 10 years? The Arctic is an open sea with constant currents coming in and going out and the ice is always on the move. While the land ice sheet on Greenland goes back 110,000 years and that on Antarctica is over a million years old, the floating ice sheets at both poles could not have formed until the sea level came up at the beginning of this inter-glacial. The Antarctic Ice Shelves appear to be around 10,000 years old but I really doubt that multi-year ice in the Arctic could survive many years of constant motion.
Stephen Skinner
I think that’s what the scientists are suggesting too. That multi-year ice that broke off and drifted south to Newfoundland will melt out completely over the next few months. That’s another substantial quantity of multi-year Arctic sea ice gone.
In the meantime, wherever that multi-year ice broke away from, is radiating away lots of ocean heat.
“The ice in question is multi-year ice from much further north in the Atlantic that broke off and flowed south.”
And where, please does that come from? The ice off New Foundland comes from Davis Strait-Baffin’s Bay which is completely ice free in late summer. No multi year-ice there. Of course it might be growlers or bergy bits, i e smallish chunks of glacier ice from Greenland, but one would think that “climate scientists” would know the difference.
Stephen S
Rule of thumb, 2 m per year. The 8m thick ice is probably 4 winters old. It could be older but that is academic. What matters is that what used to be thin 1 year ice has been replaced by thick multi-year ice. Either something is breaking up ‘additionally’ or the area covered by ice is extending and retreating on a cycle that is longer than a year.
It has.
See end of this for NSIDC data on that.
https://nsidc.org/arcticseaicenews/2017/05/warm-arctic-cool-continents/
“At the end of March, ice age data show only a small remaining coverage of old (5+ years) ice. Since 2011, the oldest ice has comprised less than 5 percent of the total ice cover. During the mid-1980s, such ice made up nearly a third of the ice.”
Actually the area of multi-year ice has increased markedly the last few years, so NSIDC has had to redefine multi-year ice to be >5 years old (i e from before 2012) in order to get a scary result.
http://www.aari.ru/resources/d0015/arctic/gif.ru/2017/20170530.gif
Red is multi-year ice.
http://www.cpom.ucl.ac.uk/csopr/sidata/thk_28.png
“due to complications associated with the southward motion of hazardous Arctic sea ice, caused by climate change….” &f=1
&f=1
eh?
which part of the sentence does the pejorative apply to?
Well ,icebergs were drifting south of Newfoundland in april 1912 .One sunk the Titanic.does this mean the ice was melting earlier than usual&therefore further south , earlier than now??
1912 was a very bad year for icebergs, actually.
So has 2017 been so far.
So the ice moved south. No doubt water currents since 90% is submerged, water is denser and more viscous..which prompts me to ask if these currents are driven by CAGW?
Simpletons who claim warmth is causing the ice to break up never set foot (or anchor) where the ice formed. It has not gotten above freezing there so the whole climate issue is bunk. Unless they have proof of mechanisms for alteration of ocean currents from increased air temperatures.
-‘Dr. Barber noted that, “Climate-related changes in Arctic sea ice not only reduce its extent and thickness but also increase its mobility meaning that ice conditions are likely to become more variable and severe conditions such as these will occur more often.”-
According to cryosphere today Hudson bay has had near normal ice conditions:
http://arctic.atmos.uiuc.edu/cryosphere/IMAGES/recent365.anom.region.13.html
“Dr. Barber noted that, “Climate-related changes in Arctic sea ice not only reduce its extent and thickness but also increase its mobility meaning that ice conditions are likely to become more variable and severe conditions such as these will occur more often.” How can you miss with predictions like these? The word “likely” gives you a free pass. Your prediction is spot on no matter what happens!
Indeed. And ‘more variable’ means what? It cannot be measured.
Sorry but this is joke is not original. In February 2014 Tim Blair of the Daily Telegraph noted that his “Touareg is axle-deep in climate change”: http://www.dailytelegraph.com.au/blogs/tim-blair/tim-vs-the-polar-vortex-part-ii-the-dawn-of-sean/news-story/56a0b1d8fa5ba94b426ad863d1665bf7
But it’s worth reading part I first, to get the whole hilarious story in context:
http://www.dailytelegraph.com.au/blogs/tim-blair/tim-vs-the-polar-vortex/news-story/836b44667746bed60ddb195a72f4271b
Highly recommended …
https://www.infowars.com/epa-cleared-in-agency-caused-environmental-disaster-despite-officials-admissions/
So……because Arctic Sea Ice Extents are much thicker and larger than anticipated, this Leftist research project designed to prove Arctic sea ice is declining at “unprecedented and dangerous” rates has been postponed…
I call this type of Leftist spin: the Immutable Law of Leftist Irony (or ILLI for short)…
As both the PDO and AMO willbe in their 30-yr cool cycles from 2019, we’ll see many more examples of ILLI being manifested….
Eventually, the Left will lose all credibility as all their dire climate predictions become increasing devoid of reality.
Arctic sea ice extent this year is not “much thicker and larger than anticipated”. In fact it’s currently at its 3rd lowest extent on record for the time of year (red dot):
http://ocean.dmi.dk/arctic/plots/icecover/osisaf_nh_iceextent_daily_5years_en.png
The ice in question here is a ‘flow’ of multi-year ice that broke off from much further north in the Atlantic and drifted south through open water to Newfoundland, where it trapped some fishing vessels.
It’s higher than it was in 2012, no ice loss in 5 years.
Nonsense. The ice in question is a patch of thick first year ice (>1.2m) that was torn off the pack ice of southern Labrador and driven south by storm winds, mixing thick icebergs from glaciers with it and compressing the lot against the north shore of Newfoundland and into the Strait of Belle Isle. You can see the missing Labrador chunk on the ice charts and it’s instant arrival off Newfoundland, for Pete’s sake.
Note that icebergs also get caught up in High Arctic ice and if that ice survives the summer, it becomes multiyear ice with icebergs incorporated.
My point is that If there had been patches of several metres thick multiyear ice mixed in with that Labrador ice, the satellites would have picked it up – it’s what they are designed to do. The ice charts show no such patches of multiyear ice flowing down from Baffin Bay.
They do, however, show an extensive field of icebergs, which are NOT multiyear ice but very thick bits of glaciers. It’s possible, as I’ve said, that satellites cannot distinguish between icebergs and SMALL bits of multiyear ice. However, no one else over the last few months (including the Coast Guard) have suggested this could have been the case.
If that’s at the root of the argument, let’s say so and ask the ice experts: Can satellites distinguish between icebergs and small patches of thick multiyear ice?
Now prove to me that the multi-year ice is not just icebergs that calved in Greenland and traveled southward with winds. IIRC there were reports of an unusual abundance of icebergs a short while back. This should be easy to ascertain because there are hundreds of satellite and aerial photos taken every day. I haven’t seen any data on the samples from the “thick” ice that could prove origin re salt water/fresh water origin. Let’s see the data. Also, prove to me that the multi-year ice piled up against the Arctic islands made it all the way to NFLD without wiping out all the still present ice along the required path. I’d be surprised if Barber’s rotten thick ice would have survived the journey. Com’on “experts” – show us your data.
When ice dies it becomes water.
It is then reincarnated as ice.
This is not climate change, it is the spiritual journey of hydrogen and oxygen.
” I haven’t seen any data on the samples from the “thick” ice that could prove origin re salt water/fresh water origin.”
You don’t have to take samples for that. It is fairly easy to see the difference (glacier ice is bluish) and experienced ice navigators take great care to avoid hitting growlers when moving through mixed ice, since glacier ice is much harder than sea-ice and can cause hull damage (Lindblad Explorer sank after hittig a growler).
susanj
The reports from the scene of trapped fishing vessels are uniform in saying the ice is 5 to 8 metres thick. There is no 8 metre first year ice.
That’s so many of the fishing boats that took a chance are being damaged. Unprecedented, they say, whatever that means to them.
“There is no 8 metre first year ice.”
Sure is when it is compressed by wind. I’ve seen 3 meter thick ice ridges in a lake less than 10 miles across.
If you look at other sea ice graphs the situation does not look so good. And remember, the arctic saw a stormy winter which has spread the ice out…
https://seaice.uni-bremen.de/sea-ice-concentration/time-series/
http://nsidc.org/arcticseaicenews/charctic-interactive-sea-ice-graph/
I’m raising a dozen crows for you to eat in a few years.
A few months ago you were predicting that the summer lows would break all records by a large amount.
Now you are content to merely whine that the levels are below average.
Griff, why do I think of the beginning of this whenever you post?
So Griff is now saying the Ice Coverage is whatever you measure minus a Griff factor for wind spread. That is because there was no wind before in history and he is in control of what the spread factor is. So what we need is a Griff graph with his wiggly line to show Griff wind spread and you subtract that away from the other wiggly line and hey presto Griff Ice coverage.
Wonder if I can fly this with the taxman my income is what I earn minus my own wind spread factor?
Griff,
Arctic sea ice extent is presently about average for the past five years at this point in the melt season. It was higher on June 14 than for 2016 and 2012, about the same as 2015 and lower than 2014 and 2013.
Whether it proves a low or a normal year will depend upon the weather in August, as you’ve been told over and over again. But a new record, beating the 2012 low, which you claimed was a “sure” thing this year, remains a long shot. Maybe with two August cyclones, but the odds don’t favor that.
Don
I’m raising a dozen crows for you to eat in a few years.
But will you have the heart to kill them and prepare and cook them, in a few years time when Arctic ice recovery becomes indisputable? You may be quite attached to them by then.
SAMURAI,
I’m glad some of us still have a job.
rebelronin 🙂
There’s an element of justice in this. A few years back, when a shift in wind patterns meant that most of the multi-year ice was blown out to lower latitudes where it melted away, the warmists claimed that climate change and warmer Arctic temps were the cause. Now a shift in wind patterns mucks up their summer holidays,ho hum.
I wrote about this a couple of days ago. I’ve been watching the East Coast ice since January in relation to polar bear sightings and I saved a number of relevant ice charts.
Heavy sea ice off Newfoundland and southern Labrador has been an issue for months: it brought record-breaking numbers of polar bear visitors onshore in early March and April https://polarbearscience.com/2017/04/03/east-coast-crawling-with-polar-bears-since-early-march-thanks-to-the-pack-ice/
Since April the thick ice and abundant icebergs have hampered the efforts of fisherman to get out to sea and for the ferries to run.
As my post shows, you can see the ice developed in place from thin first year ice in March to thick first year ice off the southern Labrador coast (as it does every year). But a big storm in late May drove a big piece of thick first year ice against the north shore of Newfoundland, mixing icebergs in with it.
This suggests either Barber can’t tell multiyear pack ice from glacier ice (from icebergs) OR satellites cannot tell multiyear pack ice from icebergs, because the CIS ice charts show no sign of “old ice” (ie multiyear ice) until after the May storm – just lots of icebergs.
Look at the chart for June 1: it’s the first (or one of the first) to show “old” ice (brown on the CIS charts) but its a small bit off central northern Newfoundland, not in the Strait of Belle Isle or off the Baie Verte peninsula (where fishermen were rescued when their boats got stuck in the ice) where the icebreakers were working.
Those small areas marked as “old ice” (which is multiyear ice according to the CIS glossary) on these charts in June are almost certainly thick compacted first year ice mixed with icebergs (a classification not listed in the ice chart legend), not traditional multiyear ice as seen in the High Arctic. I expect CIS used “old ice” for this unique mix simply because they didn’t have a category for it on their charts (and because it was as thick as traditional multiyear ice).
In fact, for months, everyone on the East Coast has been commenting about the extensive field of icebergs (including the Coast Guard and the media) as well as the thick, compressed first year ice (corroborated by the ice charts), only to have Barber pop up to tell the world that thick multiyear ice from the High Arctic somehow scurried down the coast of Labrador without satellites or anyone working the ice noticing.
I don’t buy it. If some independent evidence exists to corroborate Barber’s opinion, I’ll make a retraction. But until then, I stick by my take on this fiasco: Barber was grandstanding because his research project was scuttled and that took away opportunities for future media attention (likely the press release on East Coast ice simply replaced the one he planned to issue about Hudson Bay ice later in the summer).
Have a look and see what you think: you need to see the charts for yourself.
https://polarbearscience.com/2017/06/12/heavy-ice-off-east-coast-2017-caused-by-winds-cold-temperatures-and-icebergs/
Dr. Susan Crockford
Thanks Dr. But your alarmist colleagues are not likely to apply much in the way of critical thinking to this issue. They have a social position on the climatocracy to maintain. Instead they will become apologists for the climatocracy, making climate blaming excuses.
Hunter,
You are right of course. But that’s not why I do it. I do it for the rational, thinking people out there (even those too timid make themselves known) – to help clarify the science of what’s going on.
There is just as much science in understanding that storm winds can mix thick first year pack ice with icebergs and compress it against a shoreline to make something that looks like multiyear ice, as there is in making up a story about thick multiyear ice traveling (unseen) down from Baffin Bay to wreck havoc on shipping traffic.
oops!
I said this to Hunter: “There is just as much science in understanding that storm winds can mix thick first year pack ice with icebergs and compress it against a shoreline to make something that looks like multiyear ice, as there is in making up a story about thick multiyear ice traveling (unseen) down from Baffin Bay to wreck havoc on shipping traffic.”
When I meant this: “There is MORE science in understanding that storm winds can mix thick first year pack ice with icebergs and compress it against a shoreline to make something that looks like multiyear ice, as there is in making up a story about thick multiyear ice traveling (unseen) down from Baffin Bay to wreck havoc on shipping traffic.”
Time to go back to bed….
[The mods are sympathetic: Dr C’s “bedtime” that far north would include too many hours of low levels of light outside – too much light to go to sleep, but too little energy to actually heat things up outside. .mod]
The Wizard of Oz clip was not aimed at Dr Susan Crockford but to complement hunter’s comments.
Dr., thank you for your insightful reply.
susanjcrockford June 15, 2017 at 2:52 am

There is just as much science in understanding that storm winds can mix thick first year pack ice with icebergs and compress it against a shoreline to make something that looks like multiyear ice, as there is in making up a story about thick multiyear ice traveling (unseen) down from Baffin Bay to wreck havoc on shipping traffic.
Except of course that the thick multiyear ice resulting from the breakup in the Lincoln Sea (3-5m thick) and flowing south through the Nares strait can readily be seen via the MODIS satellite imagery. Normally this strait is blocked until later in the year, this year it is not.
Barber’s team were actually able to sample the ice and determine that it was multiyear not thick first year ice:
“Barber and his team began using their equipment on board the icebreaker to take samples and analyze the ice.
They determined it was multi-year ice, not typical of the northeast coast of North America and most likely from the High Arctic. Chunks measured between five and eight metres thick.”
Here’s MODIS showing the Nares Strait last year:
and this year:
If you don’t mind me saying Dr., Griff will be along soon to insult you again.
Thank you, Dr Crockford, for explaining so clearly what is happening. Your input is what I would have expected of ANY scientist 30 years ago, but only of a few brave scientists today…
Thanks for that alternative explanation of what is going on in the Arctic, Dr. Crockford.
Lots of polar bears roaming around! 🙂 Life is good!
Of course there would not be this “lost opportunity” if the Canadian Government had built a couple more ice breakers like it promised years ago. If only those fishermen and ferry travelers would just stay in port we could have had one of our few icebreakers act as a party ship for research (if what I saw on Big Bang Theory is correct)
You are 100% correct. There is no way for central Arctic ice to make its way down into this area. It is blocked off by islands and the currents are all wrong. You have described it correctly.
Griff has been making the same silly claims about ice teleportation from the central Arctic. It is amazing how deluded some people are when there pet theories are falling apart.
Dr. Crockford,
Thank You for sharing your knowledge, reason, and wisdom!
“Except of course that the thick multiyear ice resulting from the breakup in the Lincoln Sea (3-5m thick) and flowing south through the Nares strait can readily be seen via the MODIS satellite imagery. Normally this strait is blocked until later in the year, this year it is not.”
However since it takes the best part of a year for ice to drift from the Nares Strait to New Foundland the fact that the North Water stretches a bit further north this spring is of course utterly irrelevant. And as for the “breakup of ice in the Lincoln Sea” here are two maps showing the extent of multi-year ice in Nares Strait on May 31 2016 and May 30 2017:
http://www.aari.ru/resources/d0015/arctic/gif.ru/2016/20160531.gif
http://www.aari.ru/resources/d0015/arctic/gif.ru/2017/20170530.gif
Notice any change?
tty June 15, 2017 at 1:02 pm
“Except of course that the thick multiyear ice resulting from the breakup in the Lincoln Sea (3-5m thick) and flowing south through the Nares strait can readily be seen via the MODIS satellite imagery. Normally this strait is blocked until later in the year, this year it is not.”
However since it takes the best part of a year for ice to drift from the Nares Strait to New Foundland the fact that the North Water stretches a bit further north this spring is of course utterly irrelevant. And as for the “breakup of ice in the Lincoln Sea” here are two maps showing the extent of multi-year ice in Nares Strait on May 31 2016 and May 30 2017:
Notice any change?
Yes even at that low resolution you can see the point I made that last year the Nares strait was covered with fast ice whereas this year it is open and ice is flowing through from the Lincoln sea, it’s much easier to see that using MODIS using the links I posted.
Of course, as I said the North Water comes a bit further north this year. But where is the missing multi-year ice now supposedly near New Foundland?
tty June 17, 2017 at 9:58 am
Of course, as I said the North Water comes a bit further north this year. But where is the missing multi-year ice now supposedly near New Foundland?
You’d have to look at MODIS because the Russian data you posted doesn’t cover that area.
The thing is that a lot of folks appear either wish to forget [Barber being a nice example] or don’t realize that this is the second year in a row the Amundsen based expedition to the Canadian Arctic has been cancelled. Last year was also due to higher than expected volumes of sea ice which caused the ship to be diverted to what it is meant to be doing in the first place – ice breaking.
A neighbor of mine is the master of Canada’s second largest ice breaker. He has been telling us about running into ever more multi year ice for a few years now – in July- August no less. That’s boots-on-the-ground observations vs. Barber’s fabulations.
Gin, tonic, climate change and a slice of lemon please – go easy on the climate change.
How shameless can the climate hucksters get?
Very.
They have no shame;
http://www.smh.com.au/business/consumer-affairs/energyaustralia-announces-19-per-cent-increase-to-electricity-prices-in-nsw-20170615-gwrto3.html
Austrailians politicians seem to be on the path to self destruction, and are taking Australia with them.
New leadership is required.
‘Chief Scientist’! More like Chief Knucklehead.
I wonder how much of the $17 millions is irrevocably lost because commitments have been made and delay and/or cancellation will have no or little effect.
At least the Ship Of Fools didn’t go out into the natural habitat of the polar bears and penguins and disturb them. Don’t you deniers goof on me, I have a refrigerator magnet, purchased at Seaworld in Orlando, that shows polar bears and penguins together, and refrigerator magnets are Real Science. Just Saying.
Hey, we have them on video, it must be true!
http://i34.tinypic.com/2qk8e38.jpg
Good one, steve!
I have just left this message on the UM site
…Is it a prediction that Arctic Ice will expand southwards due to Climate Change? I thought it was expected to shrink……
I don’t expect it will survive moderation…
“Students aren’t going to know what ice free Arctic looks like”
HAHAHAHAHA
James Bull
PS I’m still laughing
These “scientists” might as well call it manbearpig. Works the same. The truth is that a lot of what happens with arctic sea ice is climatologically meaningless. It’s mostly down to weather, and to what phase of the PDO and AMO we are in. Currently, the PDO is in its cool phase, but the AMO is in its warm phase. That will change in the mid-20’s, when both will be cool for the next decade or so.
It’s almost as if absolutely positively nothing disproves their ‘settled’ theory – and the grant money keeps rolling in. How amazing.
Yea, the acolytes are blaming the proliferation of ice on global warming. It is hilarious to watch them twist hot and cold to conform to their narrative.
Was that intrepid Antarctic explorer Chris Turney involved?
philjourdan
Please refer to the original story (from James Delingpole’s link): http://www.winnipegfreepress.com/local/u-of-m-climate-change-study-postponed-due-to-climate-change-428030543.html
No one is suggesting a “proliferation” of Arctic sea ice this year. All indicators are that Arctic sea ice is currently at about it’s 3rd lowest extent on record for this time of year.
The ice in question is multi-year ice from much further north in the Arctic. It broke off from there and drifted south across open water, ending up on the north coast of Newfoundland Island where it trapped some fishing vessels. The scientists’ ship happens to be an ice-breaker, so the Canadian Coast Guard diverted it from its research mission in Hudson Bay to assist with the situation in Newfoundland.
So it’s the breaking up and drifting of the thick, multi-year ice in the high Arctic that the scientists are referring to when they say their research was interrupted by ‘global warming’.
However, as happens every year after mid-August (August 12 was the date Dr Curry observed re-freezing each night of lead water), exposed open ocean waters lose more heat over 24 hours of exposure than is gained by solar absorption during the ever-shortening arctic daylight.
You may want to read Dr. Susan’s post above. Perhaps Barber isn’t the expert he pretends to be
Silly nonsense, Griff. The ice would have to cross over islands or through completely blocked and very small gaps for your claim to be correct. But hey, we already knew you were delusional so this claim is not at all surprising.
Except this year they are not blocked as is shown by satellite imagery. Here’s the path that is followed as illustrated by the track of a very large ice island (60m thick, ~250km^2) from the Petermann glacier a few years ago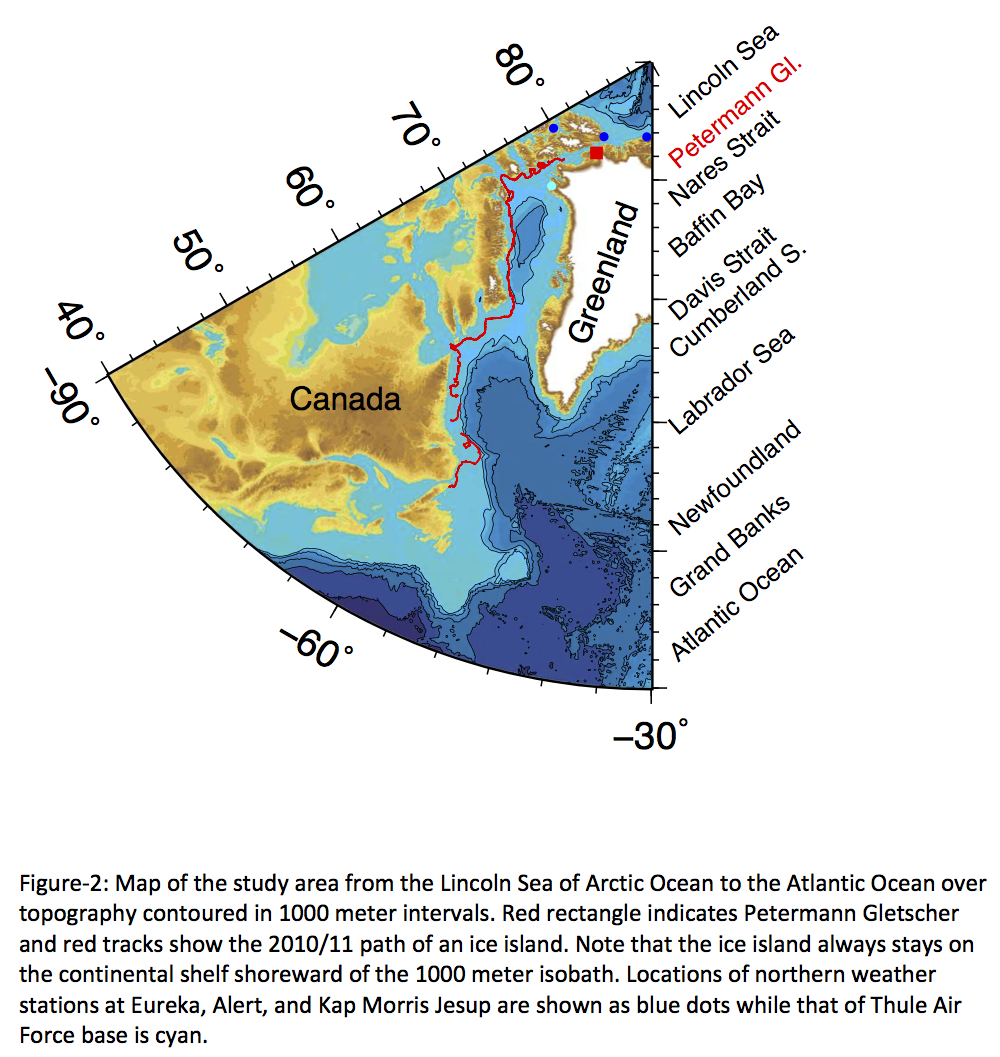
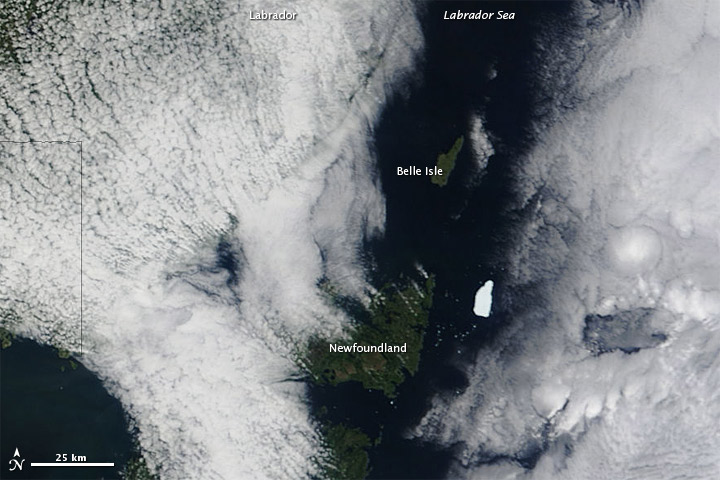
Here’s a shot of a remnant of the ice island off the coast of Newfoundland (where you claim it can’t get to), note it’s as big as Belle Isle.
Sorry Phil., but the Nare’s Straight is too narrow to move much ice through and it is blocked by the thickest multiyear ice to its north. You might get a few chunks of ice to make it through but nothing substantial. Your pictures tell us nothing of ice movement throughout the year.
http://osisaf.met.no/p/osisaf_hlprod_qlook.php?year=2017&month=03&day=13&prod=Ice-Type&area=NH&size=25%25
Most of the ice around Newfoundland is much more likely to be home grown or from Greenland glaciers calving. With the large SMB increase in Greenland this year I wouldn’t be surprised if there hasn’t been more calving of glaciers.
Richard M June 15, 2017 at 9:18 am
Sorry Phil., but the Nare’s Straight is too narrow to move much ice through and it is blocked by the thickest multiyear ice to its north. You might get a few chunks of ice to make it through but nothing substantial. Your pictures tell us nothing of ice movement throughout the year.
If you were talking about this time last year you would be right. However, this year it is not blocked and that ‘thickest multiyear ice to its north’ is completely broken up and is flowing through the Nares Strait. Here is a shot from the beginning of this month and you can see the fractured ice at the mouth of the strait (which is ~27km wide), observations have shown those fragments moving throughout at about 15km/day. You can get a better look at the image by clicking on the 250m pixel size.
Phil,
The Petermann Glacier is already well into the Nares Strait, so its passage says nothing about Arctic Ocean ice trying to get into Baffin Bay.
Good grief, Phil. I gave you a link where you can look at the ice each and every day. They show no multi-year ice of any substance flowing through the Nare’s Strait. They do show thick ice forming off of Greenland in early May. Most likely it is exactly what Susan described.
Richard M June 15, 2017 at 12:44 pm
Good grief, Phil. I gave you a link where you can look at the ice each and every day. They show no multi-year ice of any substance flowing through the Nare’s Strait.
My original reply to this disappeared so here’s another shot.
I suggest that you use a site where the resolution is adequate to see the ice flowing through the Nares.
The one I use is:
https://lance3.modaps.eosdis.nasa.gov/cgi-bin/imagery/realtime.cgi
You’ll see that the multiyear ice in the Lincoln sea that normally blocks the entrance to the Nares strait was already broken up and flowing into the strait in early May, and still is.
“You’ll see that the multiyear ice in the Lincoln sea that normally blocks the entrance to the Nares strait was already broken up and flowing into the strait in early May, and still is.”
Phil, I strongly suggest that you read up on the North Water polynya. In some years (e. g. in 1881 and 2017) it extends all the way north to the Fort Conger area. But it does not do so reliably as the Greely expedition found to its cost in 1882-84.
tty June 16, 2017 at 2:30 am
“You’ll see that the multiyear ice in the Lincoln sea that normally blocks the entrance to the Nares strait was already broken up and flowing into the strait in early May, and still is.”
Phil, I strongly suggest that you read up on the North Water polynya. In some years (e. g. in 1881 and 2017) it extends all the way north to the Fort Conger area.
Yes I’m well aware of the North Water, which has nothing to do with the point I made.
DWR54,
Obviously you did not read Dr. Crockford’s chronicle (linked above).
Your blathering about multi-year ice drifting down from the high arctic is hogwash.
Read her article, then come back here and issue your retraction. Right now you’re looking like a fool.
WBWilson
Having re-read it I have to say you’re right about the ‘multi-year’ bit. I got that from Dr Crockford’s article, who says Dr Barber claimed that’s what it was. The WFP article doesn’t actually quote Barber or anyone else as stating that it was multi-year ice. What it says is that the ice they encountered wasn’t the “usual sea ice”, but “thicker ice from further north”, which fits with the information posted by Dr Crockford re the wind-driven movements of icebergs, etc this spring.
It seems there is a localised proliferation of ice at this area of Labrador and Newfoundland caused by drifting ice from further north. However, it remains the case that, overall, Arctic sea ice is currently at its 3rd lowest extent on record for this time of year. That’s according to DMI, NSIDC and JAXA, all of which carry out independent analysis of satellite data.
DWR54 (at 8:21 am),
Sorry, you don’t get to concede that Barber was probably wrong about the composition of the ice and then claim he was nevertheless right overall.
This incident had nothing to do with the extent of global ice, whether it was the “3rd lowest” or not.
The premise of the all the stories that have been written about this incident has been that Barber’s climate change research was scuttled because of climate change.
It wasn’t: his research was derailed because of localized ice conditions (aka, weather) that could have happened any year. It meant the icebreaker he was counting on for transport and lodging was diverted to deal with thick ice in an area Barber had not expected to encounter it – bad luck, that.
He took advantage of the situation for his own purposes and in the process, misrepresented science.
He didn’t need to issue a press release but he did: he did it to garner publicity for his project, himself, and his cause.
He got so wrapped up in his own rhetoric and practiced hyperbole about declining Arctic ice that he did not make himself clear to reporters and in the process, he did a disservice to his science colleagues everywhere and made himself look silly.
You say: “It seems there is a localised proliferation of ice at this area of Labrador and Newfoundland caused by drifting ice from further north.” But it was NOT thick multiyear ice that drifted down from the north, since it does not show up on the charts – what drifted down was icebergs offshore and thin first year ice close to shore that thickened because of cold local conditions in the region. Newfoundland and Labrador are COLD in the winter and early spring!
Icebergs are not multiyear ice pack ice from the High Arctic: they are bits of glacier ice from the High Arctic and they routinely show up around Newfoundland and southern Labrador every year (so routinely that an entire tourist industry is built around their appearance). The Titanic was sunk by one in 1912.
What was new this year was the storm that mixed the icebergs in with the thick first year ice and compacted it against the shore of Newfoundland and into the Strait of Belle Isle.
Barber’s research expedition was not a victim of climate change or even declining Arctic sea ice. It was just bad luck.
“He took advantage of the situation for his own purposes and in the process, misrepresented science.”
That’s exactly what he did!
susanjcrockford June 15, 2017 at 11:29 am

DWR54 (at 8:21 am),
You say: “It seems there is a localised proliferation of ice at this area of Labrador and Newfoundland caused by drifting ice from further north.” But it was NOT thick multiyear ice that drifted down from the north, since it does not show up on the charts – what drifted down was icebergs offshore and thin first year ice close to shore that thickened because of cold local conditions in the region. Newfoundland and Labrador are COLD in the winter and early spring!
It wasn’t just Barber who said that:
“Five fishermen were rescued Wednesday from the Avalon Princess fishing boat, which started to take on water after getting stuck in thick sea ice near La Scie, N.L.
Trevor Hodgson, the Canadian Coast Guard’s superintendent of ice operations for the Atlantic region, said the heavy ice is more than two metres thick in some areas off the province’s northeast coast.
“We had a bit of stuff that forms over the winter, the normal ice in the area,” he said. “What we’re experiencing now is the ice that has come south through the Arctic due to melting up there.”
What’s unusual this year, Hodgson said, is the way the winds have pushed the thick pack ice towards land rather than out to sea.
Newfoundland and Labrador may be cold but not cold enough to produce more than 2m thick ice in the season.
Also the ice that’s been blown there doesn’t look much like icebergs:
There are plenty of icebergs blown there but that’s not the problem:
3rd lowest. Since 1979?
Is that before the huge growth of Arctic sea ice during the 60s and 70s, that started the whole ” coming ice age” scare?
Yeah, they should have started about 1972 instead of 1979. Things would look a lot different.
Or earlier than 1972 for that matter:
Here’s another view:
Pls cut through the crap:
In 2007 the world was told that by approx. 2014 we would have an ice fee Arctic caused by man-made global warming,
Based on best available verifiable empirical data from countries ranging from Canada through Denmark, Norway, Russia and the US, at the 2016 September minimum there was enough ice – a good volume of which we know was multi-year ice, i.e. hard and therefore older – to cover 60% of Canada / 85% of Australia, take your pick.
The rest is socio-political CAGW/CACC propaganda and should be tackled only on those terms.
storms bunched up arctic ice during winter which was sold as melting, here is all the extra ice making fools of these scintsts, not a typo
Stop burning coal and oil and save the ice. Also, Ice is bad.
Solar EUV is at record low levels for comparable Solar Cycles [in the Solar Cycle 11 year sequence].
Solar EUV causes Ozone. The Ozone layer has moved lower in the upper atmosphere.
The protective Ozone blanket is thinning. This lets more energy [heat] escape to space.
Global temperature change: -0.1C/2.5 years due to decreased Ozone.
This means -0.3C Global temperature decrease at the beginning of Solar Cycle 25.
OOPS: more climate change!
We need more CO2 …
EUV is absorbed very high up in the atmosphere, the wavelengths important for creating the ozone layer are in the UVC band not the EUV.
There are two factors here. More ultraviolet light helps form ozone from O2 in the upper atmosphere.
That additional ozone blocks some of the incoming infrared light from the sun from directly reaching the surface. The net effect with more ozone is a SMALLER greenhouse effect.
We all know that the term climate change ony came about because the global warming term seemed inappropriate in a world not actually warming. “Climate change” was thus always meaningess as a synonym for global warming. All part of the non-scientific views by a bunch of people pineing to become “planet saviors,” just lacking a planet to save.
“But Barber said once out on the water the scientists realized this wasn’t the usual sea ice, which would be relatively easy for the icebreaker to plow through, but thicker ice from further north which had broken off because of climate change.”???
http://www.winnipegfreepress.com/local/u-of-m-climate-change-study-postponed-due-to-climate-change-428030543.html
ftp://sidads.colorado.edu/DATASETS/NOAA/G02186/latest/4km/masie_all_zoom_4km.png
ftp://sidads.colorado.edu/DATASETS/NOAA/G02186/plots/4km/r08_Baffin_Bay_Gulf_of_St._Lawrence_ts_4km.png
ftp://sidads.colorado.edu/DATASETS/NOAA/G02186/plots/4km/r11_Central_Arctic_ts_4km.png
Sea Ice Extent Minimum.


The DMI ice temperature product (IST) uses three thermal infrared channels from the Advanced Very High Resolution Radiometer (AVHRR) on board the Metop-A satellite to calculate the surface temperatures in the Arctic.

http://images.tinypic.pl/i/00909/d1uvhcxoc1b2.png
Daily mean temperatures for the Arctic area north of the 80th northern parallel, plotted with daily climate values calculated from the period 1958-2002.
http://ocean.dmi.dk/arctic/plots/meanTarchive/meanT_2017.png
My Alma mater! Where they used to do real research. At least up to the 1960s Manitoba produced more petroleum geologists than any other Canadian University. Their Engineers (me among them) worked on the world’s second largest excavation after the Panama Canal- the Greater Winnipeg Floodway. In my hydrogeological work in southwest Manitoba, I discovered the extension of the north-flowing, preglacial Missouri River at a depth, IIRC, of a couple of hundred feet – identified by tan quartz pebbles, petrified wood pebbles and opalized wood. Dr. G. Brownell invented the scintillometer and airborne scintillometer and the ‘beryl meter for mineral exploration. Dr Baracos University of Manitoba in the 50s-70s, a highly decorated engineer, was, I believe, the first to calculate the maximum thicknesses of the ice sheet of the last glacial max using the principle of the triaxial stress ‘memory’ based on the Mohr Circle on pre glacial soils. Perhaps it might be interesting to do a post on how this is done.
Dang can’t make link with cell. See wiki.
+10…interesting!
Funniest is when they say that they expect conditions to get worse in the future. There you have it: climate change will cause more and more ice.
So. Researchers can only safely go to a site in the Arctic with no sea ice. Therefore anywhere they go they will find no ice. The conclusion is clear: sea ice is disappearing.
Is science not wonderful?
https://polarbearscience.com/2017/06/12/heavy-ice-off-east-coast-2017-caused-by-winds-cold-temperatures-and-icebergs/
Dr. Crockford’s comment should be elevated to a post update at least since it is both informed and informing more than simply quoting the Manitoba press.
Thank you.
Nothing less than stasis will satisfy their unease.
Nothing less that Statism will satisfy their desire.
Stalinism
After so many of exactly these kinds of incidents, it’s only natural that they would fall back on their standard ‘call it something else’ strategy – I’m just amazed it took this long. Probably, because it was too outrageous to try before – of course, at this point, they’re beyond caring.
What’s with the ice breaker and not the Mediterranean yacht anyway? Don’t these people get their own computer modelling?
Alarmist scientists have their fingers caught in their post-2007 predictions of Arctic sea ice doom due to climate change. Now Arctic sea ice has refused to melt for the past 10 years and so they have fabricated a new unnecessary pause through their alarmism. They are responding with fake propaganda and fake modeled volume, yet the ice refuses to go and keeps trapping ships.
I doubt we will have a record low this September as the melting and the temperatures have been both below average so far. Weather might have something to say to this. Since we have the big 2016 El Niño at our back, and the planet has been cooling since, I expect Arctic sea ice to continue its recovery over the next few years, much to the dismay of sea ice alarmists.
So expect lots of climate change affecting Arctic sea ice.
Arctic sea ice coverage is counter-intuitive: It definitely does NOT follow the long-cherished “Arctic death spiral” of CAGW theorists. In that catastrophic death spiral, loss of arctic sea causes increased solar energy absorption, which causes warmer Arctic ocean temperatures, which causes even more arctic sea ice losses, which ever-more open ocean to absorb solar energy, which causes …
Rather, low (below “average”) sea ice anomalies in the spring (Feb-Mar-Apr) maximum usually are followed by very low fall (Aug-Sep-Oct) minimums.
Very low and record low fall minimums are almost always followed by very high spring maximums!
High early summer and summer (Apr-May-June) anomalies are followed by very low fall (Aug-Sep-Oct) minimums. (Death spiral fantasies would require the opposite be trend be seen in both cases.)
Small sea ice anomalies in early winter and mid-winter (Oct-Nov-Dec-Jan) are generally followed by smaller sea ice anomalies in the subsequent spring and summer.
It seems more accurate to follow a “sea ice insulation” theory: Most of the year, removing the Arctic sea ice removes an insulating and reflective blanket between the warm arctic ocean waters and the freezing arctic air mass and the infinitely cold space above. This increases heat loss from the arctic ocean all year long, but significantly warms the arctic air mass due to increased evaporation and convective loss in winter. In the short arctic summer, the arctic ocean warms slightly due to increased solar energy absorption around noon each day, but not enough to overcome the year-long losses at twilight each night and evening.
The actual “average” arctic ocean extents are unknown, but very unlikely to be those found using the satellite era’s 1979 high point used to “anchor” the traditional CAGW-sponsored) 1980-2010 “average sea ice decline” linear charts. Expect a 66-70 year cycle to become obvious in the next few years.
RACookPE1978 June 15, 2017 at 11:20 am
Arctic sea ice coverage is counter-intuitive: It definitely does NOT follow the long-cherished “Arctic death spiral” of CAGW theorists. In that catastrophic death spiral, loss of arctic sea causes increased solar energy absorption, which causes warmer Arctic ocean temperatures, which causes even more arctic sea ice losses, which ever-more open ocean to absorb solar energy, which causes …
Rather, low (below “average”) sea ice anomalies in the spring (Feb-Mar-Apr) maximum usually are followed by very low fall (Aug-Sep-Oct) minimums.
Very low and record low fall minimums are almost always followed by very high spring maximums!
So last fall was the 2nd lowest minimum and was followed by the record low spring maximum.
Second lowest, since the record high that also corresponded with the beginning of the satellite era.
The big El Nino was the cause of the low ice levels, as El Ninos always do.
Why don’t you try telling the whole truth, not just the tiny sliver that supports your myth making?
Phil. June 15, 2017 at 6:44 pm
Last year was a super El Nino year. And the maximum was just barely lower than last year’s and other recent maxima.
We’ll see what happens this year. Right now Arctic sea ice extent is about average for this date during the past five years.
My kayak and I will see them through their trials.
“The need to deal with extreme ice conditions in the south meant the ship would arrive too late on site to meet research objectives.”
Guess that translates to they had to pull-up-short for the need to vomit out the beer, scotch and schnapps and take a pee and dump on the sea ice before starting the “return” leg.
Jajajajajajajajaja
Instead of cancelling the 2017 study due to excess ice, shouldn’t they be making a start on the 2018 study, ensuring they make it there in time? Hopefully someone is raisin this issue with them
Since the ship of fools I bet insurance has become more expensive for these jaunts in icy waters. A bunch of academics plus students who rock up with a boat, and expect to go where they want when they want, is a high risk.
excess sea ice they call it “climate change”, less sea ice they call it “global warming”
Susan Crockford posits that the “Multi-year ice” is actually a combination of first year ice and impacted icebergs from Greenland. Barber’s team admitted that they “Have never seen high arctic ice before”, and of course, now they are experts. https://polarbearscience.com/2017/06/12/heavy-ice-off-east-coast-2017-caused-by-winds-cold-temperatures-and-icebergs/
They would be well advised to read the report of the Nares expedition in 1874 which was the first to reach the north coast of Ellesmere land and come into contact with multi-year ice (which they called “palaeocrystic ice”). Their descriptions and illustrations are excellent and quite insightful about the processes active in the formation of multi-year ice. However like most early arctic research it seems to have been completely forgotten by the current generation of “climate scientists”.
etudiant June 15, 2017 at 1:22 pm
Thank you for this very informative link. It seems plausible that the Barber team, lacking field experience, mistook compacted ice for multi year ice.
It seems totally implausible that that is the case since Barber has made 35 Arctic field trips, he certainly knows the difference. Also they sampled the ice and tested it in the lab so certainly would be able to distinguish between FYI and MYI.
It’s much more plausible that the report omitted the word ‘here’.
There is a report quoted above which includes this statement:
‘Barber’s crew decided to take advantage of the opportunity to examine bits of iceberg ice trapped in pack ice, even though they’d never seen Arctic ice before.’
That is the basis of my comment.
Separately, differentiating between compressed local ice and rafted multi year ice from further north seems to rely on accumulated dirt in multi year ice. Is this a reliable indicator?
etudiant June 15, 2017 at 6:37 pm
There is a report quoted above which includes this statement:
‘Barber’s crew decided to take advantage of the opportunity to examine bits of iceberg ice trapped in pack ice, even though they’d never seen Arctic ice before.’
That is the basis of my comment.
That isn’t a quote from the report it’s Susan’s sarcasm.
From another report:
“Barber, a climate change scientist at the University of Manitoba, and the other scientists did what they could to help the Coast Guard rescue the vessels and carved a path for the tankers. They also took the time to study the ice that surrounded them, discovering that much of it was the multiyear ice typically seen in the high Arctic.
It was an unexpected find, said Barber, given the time of year and how far south they were. “It’s not something you would expect to see there and not something we’ve seen there before,” he said.
Some of the other reports appear to have omitted the ‘there’ which totally changes the meaning, as I pointed out above to use that to imply that Barber with 35 expeditions in the Arctic doesn’t know what MYI is, is clearly an error.
Separately, differentiating between compressed local ice and rafted multi year ice from further north seems to rely on accumulated dirt in multi year ice. Is this a reliable indicator?
I’d expect them to measure salt content, multiyear ice being lower in salt content.
“Multiyear ice has distinct properties that distinguish it from first-year ice, based on processes that occur during the summer melt. Multiyear ice contains much less brine and more air pockets than first-year ice. Less brine means “stiffer” ice that is more difficult for icebreakers to navigate and clear.” NSIDC
RE Phil
***It seems totally implausible that that is the case since Barber has made 35 Arctic field trips, he certainly knows the difference. Also they sampled the ice and tested it in the lab so certainly would be able to distinguish between FYI and MYI.
It’s much more plausible that the report omitted the word ‘here’.***
Phil, it does not matter how many field trips barber has made, He says what is to his advantage. He has called Arctic ice “rotten, after sailing in a small area. Now, he says melting and stronger winds have blown the ice southward. here you guys are talking about multi-year ice, but you should recall he was talking abut “thin” ice, so which is it?
You said they tested it. really??
Gerald Machnee June 16, 2017 at 5:10 pm
RE Phil
***It seems totally implausible that that is the case since Barber has made 35 Arctic field trips, he certainly knows the difference. Also they sampled the ice and tested it in the lab so certainly would be able to distinguish between FYI and MYI.
It’s much more plausible that the report omitted the word ‘here’.***
Phil, it does not matter how many field trips barber has made, He says what is to his advantage. He has called Arctic ice “rotten, after sailing in a small area.
He used that term to describe the ice he was sailing through in the Beaufort Sea, which although it appeared to be solid Multiyear ice to the satellite turned out to be fragmented MYI joined by thin FYI, and was therefore much weaker.
Now, he says melting and stronger winds have blown the ice southward. here you guys are talking about multi-year ice, but you should recall he was talking abut “thin” ice, so which is it?
Describing the ice on the opposite side on the continent, the thickest remaining MYI is pushed against the northern coastline towards Ellesmere Island and Greenland, which is where he suggested this ice came from.
You said they tested it. really??
You have a research vessel completed fitted out with labs with a research team on board diverted from their original mission, of course they tested it!
“Dr. Barber and his team of experts were able to use the state-of-the-art equipment onboard the Amundsen to confirm that a significant proportion of the sea ice present originated from the high Arctic.
The Sea Ice Research Team collected a comprehensive dataset on the physics of the ice, ocean and atmosphere in the area and these data will contribute to the understanding of these events and assist Canada in preparing for climate change driven increases in marine ice hazards.”
RE Phil:
***You said they tested it. really??
You have a research vessel completed fitted out with labs with a research team on board diverted from their original mission, of course they tested it!***
Of course they tested it! – Hear say.
***“Dr. Barber and his team of experts were able to use the state-of-the-art equipment onboard the Amundsen to confirm that a significant proportion of the sea ice present originated from the high Arctic.***
So what do you mean by High Arctic? Exactly where? Phil, you are saying from Ellesmere Island and Greenland. And that was multi-year ice??? Sure. If you listen to his radio interview he said the ice was “thin” and was blown out by stronger winds caused by climate change. So is that multi-year ice, thin ice, or ice broken off glaciers. Are you trying to tell me that there was thick ice on the east side of Ellesmere Island? Bullwinkle!
**The Sea Ice Research Team collected a comprehensive dataset on the physics of the ice, ocean and atmosphere in the area and these data will contribute to the understanding of these events and assist Canada in preparing for climate change driven increases in marine ice hazards.”**
Comprehensive dataset? Let’s see it.
Phil. has spent a decade working on his “tap dance around the truth” routine. Sad, really.
Gerald Machnee June 17, 2017 at 6:31 pm
RE Phil:
***You said they tested it. really??
You have a research vessel completed fitted out with labs with a research team on board diverted from their original mission, of course they tested it!***
Of course they tested it! – Hear say.
Not hearsay, they actually reported that they made such measurements!
***“Dr. Barber and his team of experts were able to use the state-of-the-art equipment onboard the Amundsen to confirm that a significant proportion of the sea ice present originated from the high Arctic.***
So what do you mean by High Arctic? Exactly where? Phil, you are saying from Ellesmere Island and Greenland. And that was multi-year ice??? Sure. If you listen to his radio interview he said the ice was “thin” and was blown out by stronger winds caused by climate change. So is that multi-year ice, thin ice, or ice broken off glaciers. Are you trying to tell me that there was thick ice on the east side of Ellesmere Island? Bullwinkle!
The presence of quotation marks indicates that the phrase ‘high arctic’ originated in the article and was not my choice of words. However others have referred to the source of the thick ice found off Labrador and Newfoundland, for example Andreas Münchow:
“The thickest ice off Labrador and Newfoundland (excluding icebergs) originates mostly in the Lincoln Sea and passes south through Nares Strait.”
He has extensively studied this and a recent paper describes ice draft measurements in the Nares strait from 2003 through 2012 .
When there was no ice bridge (like this year) they found:
“Median ice draft then was at its maximum during our 9 year observational period reaching 1.98 m while the 95th percentile draft exceeded more than 8 m. We conclude that the absence of any ice arch resulted in the southward export of a record volume of sea ice to exit the Arctic Ocean via Nares Strait. ”
http://muenchow.cms.udel.edu/papers/RyanMuenchow2017.pdf
**The Sea Ice Research Team collected a comprehensive dataset on the physics of the ice, ocean and atmosphere in the area and these data will contribute to the understanding of these events and assist Canada in preparing for climate change driven increases in marine ice hazards.”**
Comprehensive dataset? Let’s see it.
Well no doubt they will present it and write it up but their preliminary findings have been reported:
“Dr. Barber and his team of experts were able to use the state-of-the-art equipment onboard the Amundsen to confirm that a significant proportion of the sea ice present originated from the high Arctic.”
Thank you for this very informative link. It seems plausible that the Barber team, lacking field experience, mistook compacted ice for multi year ice.
I’d think that the AGW proponents here would be better served focusing on the unusually high number of icebergs, as these reflect increased ice loss from the Greenland glaciers. Is there any ongoing documentation of West Greenland ice loss?
If memory serves, there were recent reports of hazardous waste dumps getting exposed dating back to old military base from the cold war.
That might be an area that has been monitored reasonably consistently which could help improve our understanding.
“If memory serves, there were recent reports of hazardous waste dumps getting exposed dating back to old military base from the cold war.”
That is pure scare-mongering like most CAGW propaganda. Camp Century is situated in an accumulation area that has been continually ice-covered for at least a million years.
http://adsabs.harvard.edu/abs/2014EGUGA..1610721F
It is however south of the ice-divide, so in a few thousand years it will probably calve inte Melville Bay.
Etudiant
Is there any documentation of west Greenland ice loss?
Yes there is:
http://beta.dmi.dk/en/groenland/maalinger/greenland-ice-sheet-surface-mass-budget/
It’s negative loss. Greenland is gaining mass of ice and snow at the surface (where it matrers).
It’s has to be the result of Russian meddling. The last thing Putin wants, is for the west to have a four month opening to the northwest passage for cargo ships. Would raise the economic divide between the powers.
Déjà vu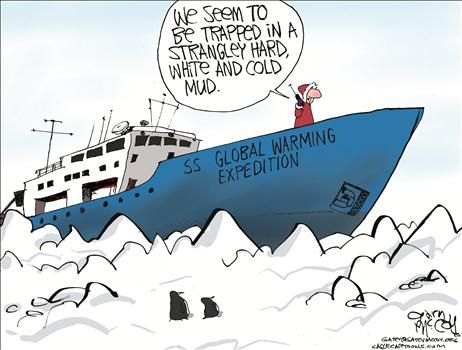
First penguin to second penguin- Suppose we should look on the bright side that finally reproducible science is beginning to sink in.
Second penguin- Yeah, just wish they’d stop trying to increase polar bear habitat though.
It might be called “iceboarding.” 😉
Oh the pain… 🙂
Warmer is better. Period.
Congress Should Break Up Hatebook into Multiple Independent Identity Facebooks
Just recently I wrote a post about being censored on Facebook for doing nothing more than being critical of the AGW theory. This following quote is my best guess at what got the article banned:
https://co2islife.wordpress.com/2017/06/15/congress-should-break-up-hatebook-into-multiple-independent-identity-facebooks/
Just starting to read the article; As I remember reading the newspaper article and University announcement, they termed it a “postponement”.
Yes, the postponement is till “next year”, so this year is cancelled.
I was amused to read postponed or cancelled as it is so typical of the climastrologists!
Inconvenient data!? No problem, we skip or fix.
The Canadians are just copycats. Australians did it first.
And if there was a safe passage, ie no ice, the headlines would read: “Clear Passage Through the Artic due to Climate Change”-
A more honest headline: SHIP TO EXPLORE VANISHING ARCTIC SEA ICE GOT STUCK IN SEA ICE
LOL . . . in a related story, Marcher’s Travel Agency is announcing that they are accepting reservations for a guided hiking tour across the future ice bridge to Russia. Customers are responsible for their own visas. 😉
There is an ice bridge to Russia every winter across Bering Strait and much else of the Bering and Chukchi Seas.
ATTN Phil
In the Canadian Press Barber said, “Barber said warming temperatures have made the ice in the high Arctic thinner. When buffeted by storms and high winds, the ice can move much more freely and travels south on ocean currents.”
Now explain this Bee S. So was this “thinner ice” against Ellesmere Island?
Quit being an apologist for a fiction writer.
And more:
“An Arctic climate change study has been cancelled because warming temperatures have filled the sea off northern Newfoundland with hazardous ice up to eight metres thick.”
As I said elsewhere, warmer temperatures sure make good ice. Soon I can get rid of my fridge, ice will be coming up my driveway!!!