Understanding multi-decadal global warming rate changes
INSTITUTE OF ATMOSPHERIC PHYSICS, CHINESE ACADEMY OF SCIENCES
A long-standing mystery is that, despite the persistently increased greenhouse gases emissions throughout the twentieth and early twenty-first centuries, the globally-averaged surface temperature has shown distinct multi-decadal fluctuations since 1900, including two weak global warming slowdowns in the mid-twentieth century and early twenty-first century and two strong global warming accelerations in the early and late twentieth century. The multi-decadal global warming rate changes are primarily attributed to multiple ocean surface temperature changes, according to research by Institute of Atmospheric Physics and Australian Bureau of Meteorology, and It is the net impact of multiple ocean surface temperature changes, rather than a single ocean basin change, that plays a main driver for the multi-decadal global warming accelerations and slowdowns. Understanding and quantifying the respective role of individual ocean basin in the multi-decadal global warming accelerations and slowdowns, under the forcing of the sustained increase in atmospheric greenhouse gas concentrations, could help achieve a more accurate estimate of the future global warming rate to better meet the global warming target of the Paris Conference reached in December 2015–no more than 1.5ºC above pre-industrial levels by 2100.
The new finding of the importance of multiple ocean surface temperature changes to the multi-decadal global warming accelerations and slowdowns is supported by a set of computer modeling experiments, in which observed sea surface temperature changes are specified in individual ocean basins, separately. The results are published in “Distinct global warming rates tied to multiple ocean surface temperature changes”, in the June 12 online issue of Nature Climate Change.

“Our results identify multiple ocean surface temperature change as a major driver for global mean surface temperature changes on multi-decadal timescales. The paramount importance of multiple ocean basins in determining the global warming rates provides a new insight to improving global and regional climate projections.” states the corresponding author Gang Huang from Institute of Atmospheric Physics, Chinese Academy of Sciences (CAS).
“The results elucidate the relative contributions of individual ocean surface temperature changes to the multi-decadal global warming rate changes, and could help improve our understanding of global warming fluctuations under steadily increased emissions of atmospheric greenhouse gases.” says Jing-Jia Luo, the corresponding author of the study and climate scientist at the Bureau of Meteorology in Australia. “It reveals a fact that we need to explore climate change in a more global perspective. This could stimulate an integrated strategy and coordinated effort toward understanding the causes of regional ocean changes.”
“Our study provides a novel perspective for understanding and projecting individual ocean basin’s impacts on global warming,” explains co-author Dr. Shuai-Lei Yao from CAS Institute of Atmospheric Physics. “While the tropical Pacific was generally regarded as a key contributor to the multi-decadal global warming rate changes, other ocean basins, including the Indian Ocean, the Atlantic and the Southern Ocean, also exert important effects. ”
The paper: https://www.nature.com/nclimate/journal/vaop/ncurrent/full/nclimate3304.html
Distinct global warming rates tied to multiple ocean surface temperature changes
Shuai-Lei Yao, Jing-Jia Luo, Gang Huang & Pengfei Wang
Abstract:
The globally averaged surface temperature has shown distinct multi-decadal fluctuations since 19001, 2, 3, 4, characterized by two weak slowdowns in the mid-twentieth century and early twenty-first century and two strong accelerations in the early and late twentieth century. While the recent global warming (GW) hiatus has been particularly ascribed to the eastern Pacific cooling5,6, causes of the cooling in the mid-twentieth century and distinct intensity differences between the slowdowns and accelerations remain unclear7, 8. Here, our model experiments with multiple ocean sea surface temperature (SST) forcing reveal that, although the Pacific SSTs play essential roles in the GW rates, SST changes in other basins also exert vital influences. The mid-twentieth-century cooling results from the SST cooling in the tropical Pacific and Atlantic, which is partly offset by the Southern Ocean warming. During the recent hiatus, the tropical Pacific-induced strong cooling is largely compensated by warming effects of other oceans. In contrast, during the acceleration periods, ubiquitous SST warming across all the oceans acts jointly to exaggerate the GW. Multi-model simulations with separated radiative forcing suggest diverse causes of the SST changes in multiple oceans during the GW acceleration and slowdown periods. Our results highlight the importance of multiple oceans on the multi-decadal GW rates.
Science Realist: What is this “finding” supported by?
Chinese:
SR: That’s IT?
Ch: That’s it.
Ch: Buy our solar and wind components.
Ch: The End.
Janice, you didn’t read the paper, did you? And PLEASE don’t argue:”Paywall!” If you don’t know the way through the wall you should not write about papers you don’t know!
From the conclusions:
“The results imply that the SST changes in global and regional oceans during the two accelerations and slowdowns are driven by complicated and distinct mechanisms, which cannot be solely explained by modelled response to external radiative forcing.”
It’s a paper that shows the (very) limitations of CMIP5-models!
The “model” of reality shows that. They are trying to find the reason the models do not work, and perhaps creating better models will do that. But so far, models have not matched reality.
Dear Snarling Frank,
The Chinese scientists above condemned themselves out of their own mouths in their summary of their “findings.”
In other words, they assert as proven what is only conjecture (that CO2 emissions drive ocean heat content). This is what they coded into their computer simulations, a.k.a. “models.” Thus, their findings are mere conjecture.
I’m willing, VERY willing, to listen to your arguments proving the Chinese research is truly robust and meaningful. Your cite from the paper’s Conclusions: ….cannot be solely explained by…. is not convincing. That statement is almost meaningless it is so broad.
Your ally for science truth (I hope),
Janice
It’s commendable that they are trying to look beyond CO2 but what is this really showing?
Global mean temp is a ( unscientific ) weighted average of land air and sea surface temps. So it goes without saying that there is a degree of correlation between SST and GMT: one is part of the other.
Well at least if they can get that message across instead of modellers pretending it is all AGW that will be major contribution. Especially from someone working form BOM.
Janice, I’m not snarling at all but I presume that somebody who writes about a paper has read it and you didn’t IMO because you only cite the press release. It’s IMO a good way to take models to show their limitations . And yes: we diverge because CO2 IS a forcing. The open question is: how strong? All the results from observations say: TCR is about 1.2…1.4 and this is not a reason for doom and gloom but the models say: TCR is about 1.8 and this is the justification for all the “mitigation hype”. Every paper that shows that the models do not work properly is a way to the truth. This paper is one of them.
Well put Frank, the amount of energy stored in the oceans by the high sunspot counts since the Dalton minimum must be taken into account, as well as the accounting for oceanic thermal storage and release patterns not yet fully understood.
The oceans have 1000 times the heat capacity of the atmosphere. 71% of Earth’s surface is ocean.
Of course the SST drives changes in global temps!
frankclimate:
Sorry, but Janice is right and you are wrong.
A model study informs about the model which is used. That informs about reality ONLY when the model is demonstrated to be an accurate representation of reality.
In an attribution study the system is assumed to be behaving in response to suggested mechanism(s) that is modeled, and the behaviour of the model is compared to the empirical data. If the model cannot emulate the empirical data then there is reason to suppose that the suggested mechanism is not the cause (or at least not the sole cause) of the changes recorded in the empirical data.
It is important to note that attribution studies can only be used to reject hypothesis that a mechanism is a cause for an observed effect. Ability to attribute a suggested cause to an effect is not evidence that the suggested cause is the real cause in part or in whole.
Richard
frankclimate,
“All the results from observations say: TCR is about 1.2…1.4…”
What “results from observations” are you talking about?
John, I’m sorry that you don’t the literature, a 1st starting point could be this: https://niclewis.files.wordpress.com/2014/09/lewiscurry_ar5-energy-budget-climate-sensitivity_clim-dyn2014_accepted-reformatted-edited.pdf
And thereafter you could read this: https://judithcurry.com/2016/12/29/internal-climate-variability-as-a-confounding-factor-in-climate-sensitivity-estimates/
If you have further questions don’t bother to ask…
The oceans are warmed by the sun, not CO2.
The sun warms the ocean, but CO2 can influence how fast that heat escapes to the atmosphere.
It can, it’s just that water vapor compensates for it at night when the surface is cooling.
Richard: “Sorry, but Janice is right and you are wrong.” So I’m afraid you do not accept that CO2 is a forcing… in this case you are right!
Either tell me what “results from observations” means, in plain old English, sir, or I conclude you are not able to . . (which is to say, it’s just something that sounded good to you ; )
John, do the links not work or what is your problem?
Can someone show me where SST was measured in 1920, 1940, 1960 etc etc etc?
frankly, Thanks !!
Looks o me like there was less than 20% possible coverage(wide and inconsistent) in the NH before 1960
And well less than 20% possible coverage in the SH before 2003 !!
Could it be that the NH coverage are was mainly the north Atlantic, and therefore HIGHLY dependant on ocean currents such as the AMO ?
Now let me see.
The oceans are about 70-73% of the earth’s surface area, and an even greater percentage of the tropical regions (places for sunlight to land (or sea)).
At these Temperatures, the deep ocean water is a near black body radiator.
Now why with that limited amount of information would anybody imagine that might result in global warming ??
I don’t see the connection !
g
“A long-standing mystery is that, despite the persistently increased greenhouse gases …”
No mystery here, CO2 does nothing to stop natural variability, moreover; the effect of incremental CO2 ion the surface temperature is minor at the most.
I was thinking the same thing… a mystery only to those who have already made up their minds.
Odd they did not notice that the 1908 and 1970s cold periods corresponding to the bottom of the AMO cycle corresponded to the relative lows in the solar magnetic cycle. If they had put 2 and 2 together and come up with something closer to 4 than their apparent conclusion of 3, they might have had a real breakthrough on the sun pumping the AMO cycle. Alas, they have the CO2 fixation.
Actually, they added 1.0 to 0.6 and and came up with about 4.3 which precisely represents the relative error in the absurdly high sensitivity they assume in order to support the IPCC’s agenda of redistributive economics at a global scale.
So when all the oceans are warming we get global warming, when some of the oceans are warming we might get global warming, when some of the oceans are cooling we might get global cooling and when all of the oceans are cooling we get global cooling. And guess what boys and girls since all the oceans are different in size and shape they warm and cool at different intervals, WOW whoda thunk it.
They made it smaller!
Didn’t the authors imply that cooling of the oceans is a slowdown of global warming?
To say it that simply would have been blaspheme.
And currently the SSTs are showing that the ocean cooling is continuing since the El Nino peaked in January 2016.
https://rclutz.wordpress.com/2017/06/13/ocean-cooling-resumes/
The question is, when the ocean oscillations are similar to 1970-1975, will there actually be a step up in temperature from then? One would assume so, given the interglacial trend so far.
It is the understanding of global oceanic thermal cycles which can open the door to properly predicting and adapting to global surface temp changes as an ever-enlightened human race.
Agreed. There appear to be various ocean fluctuations of different lengths and mixtures of interactions, so not sorted out. But the oceans are the key.
Pop, not assuming the step up from today’s plateau. Maybe the recovery from LIA has run its course, or maybe the quiet sun will have an effect. Too many unknowns.
It has never been the back radiation of CO2 warming the oceans. The only force to penetrate deeper is increasing UV radiation.
http://www.aemet.es/es/eltiempo/observacion/radiacion/ultravioleta?l=barcelona&f=anual
https://www.nasa.gov/topics/solarsystem/features/uv-exposure.html
Is Canadian Archipelago freezes again?
ftp://sidads.colorado.edu/DATASETS/NOAA/G02186/plots/4km/r09_Canadian_Archipelago_ts_4km.png
I have now seen it all from the Warmist camp, a graph with no vertical axis whatsoever. I can only assume these are tenths of degree’s they are omitting (paywalled). This must be the graph used for policy makers. What caused the warming from 1900 to 1940, same length, same slope as current?
There is only one period of global cooling on the graph – roughly 1940 to 1978. Otherwise, strong warming leading up to WW2; strong 1980 to 2000; weak warming 2000 to the end of their graph. This suggests that ACO2 warming has been overcoming negative SST somewhere, naturally driven, since 1940. For instance, the Eastern Pacific cooled from 1980 to 2015. A recent paper suggest the warming up to WW2 was caused an alignment of PDO and AMO. Both were trending upward at the same time.
“This suggests that ACO2 warming has been overcoming negative SST somewhere, naturally driven, since 1940”
JCH, don’t you mean over coming since ~1980, not 1940 according to the graph?
I think I found a better graph related to this study (for what it is worth):
https://www.nature.com/nclimate/journal/vaop/ncurrent/fig_tab/nclimate3304_F1.html
This one is interesting also:
It looks to me like there is a little more than just variation in ocean surface temperature changes going on here. Look closely at Siberia. Big change from 75-98 to 01-12. Note that the four time periods are discontinuous and overlapping. I wonder if that is explained in the text?
Duncan, if the rapid warming into WW2 was caused mostly by a combination of the substantial upward trends of the PDO and the AMO, and they both drop out the subsequent period, then I would expect a larger dip… say, down to the 1915 to 1925 level.
Duncan
Here is a graph which might help with some of your queries
http://www.vukcevic.talktalk.net/GT-GMFo.gif
And an even better fit if using unmolested temperature data.
Rapid industrialization in China has massively increased atmospheric particulates over the Pacific, providing attenuation of sunlight absorbed and serving as condensation nuclei for water vapor, increasing cloud albedo and further impairing oceanic sunlight absorption. Much of the current “Pause” can be attributed to this factor, which exacerbates “La Niña” effects and associated Jet Stream perturbations.
As the Chinese install particulate “scrubbers,” improvement should occur.
CO2 has little, if any, relationship to this.
I’ve read that many Chinese power plant managers disable the scrubbers in order to increase the efficiency of their plants.
Soooo, 71% of the surface of the planet does play a role in global temps. Go figure…..
Then, from that 71% of the surface of the planet being covered by ocean, factor in the fact that ice-free open ocean albedo is less than .1, (Similar to new asphalt) thus ice-free open ocean water absorbs more than 90% of the spectrum wide solar energy that reaches the surface of the water. From there, I come up with more than 65% of the solar energy that reaches the surface of the planet being absorbed by the oceans?????? Where have I gone adrift and gotten lost at sea????? Then there are three methods by which the oceans release their latent energy into the atmosphere.
Only if the Sun is directly overhead, which never actually happens in the Arctic.
Most of the Arctic, for most of the year, the incident angle of the Sun is more than 80 degrees, and Albedo is almost equal to ice. Plus open water radiates far more energy that it receives the few hours a day it’s under 80 as long as it’s clear out.
http://journals.ametsoc.org/doi/pdf/10.1175/1520-0493(1979)107%3C0775:TAOWAA%3E2.0.CO%3B2
Just FYI:
1.
http://www.climate-skeptic.com/wp-content/uploads/2012/04/ocean-heat.gif
2.
(Source: https://www.ess.uci.edu/~reeburgh/fig8.html )
What’s not clear is the distribution of the warm and cold pools, as they will impact the air above them, which impacts the jet streams, that changes how water vapor is blown inland to cool, and that regulates daily min temp.
I don’t have data going back that far, but this part matches pretty good.
Plus you can see the impact of changing currents on the extratropics here (Unit’s are Degree F/W/m^2 of clear sky solar average)
https://micro6500blog.wordpress.com/2016/12/01/observational-evidence-for-a-nonlinear-night-time-cooling-mechanism/
That’s excluding connate and magmatic water of course, which are probably the second largest reservoir of water on the planet.
Deserves to be quoted a second time. +10 million
Product shows the average solar radiation absorbed (W/m2) in the earth-atmosphere system. It is derived from AVHRR Channels 1 and 2. The mean is displayed on a one degree equal area map on a seasonal basis. This product is also referred to as Shortwave Absorbed Radiation (SWAR). Absorbed solar radiation is the difference between the incoming solar radiation at the top of the atmosphere and the outgoing reflected flux at the top of the atmosphere.
http://www.ospo.noaa.gov/data/atmosphere/radbud/swar19_prd.gif
http://www.ospo.noaa.gov/data/atmosphere/radbud/gs19_prd.gif
Thanks Janice! good stuff! If you could translate it to Chinese it might get some respect.
I’ve been saying just this for ten years:
Before it is safe to attribute a global warming or a global cooling effect to any other factor (CO2 in particular) it is necessary to disentangle the simultaneous overlapping positive and negative effects of solar variation, PDO/ENSO and the other oceanic cycles. Sometimes they work in unison, sometimes they work against each other and until a formula has been developed to work in a majority of situations all our guesses about climate change must come to nought.
So, to be able to monitor and predict changes in global temperature we need more than information about the past, current and expected future level of solar activity.
We also need to identify all the separate oceanic cycles around the globe and ascertain both the current state of their respective warming or cooling modes and, moreover, the intensity of each, both at the time of measurement and in the future.”
from here:
http://www.newclimatemodel.com/the-real-link-between-solar-energy-ocean-cycles-and-global-temperature/
Published by Stephen Wilde May 21, 2008
and it is the sun, not CO2 that is causing the changes in ocean heat content:
http://www.newclimatemodel.com/is-the-sun-driving-ozone-and-changing-the-climate/
The graph is showing the circa 1940 peak temperature as lower than the 1998 level, which seems doubtful. The temperature records have been stepped on so much. . .
Indeed, Hansen of GISS Nasa still had 1937 higher than 1998 as late as 2007! That was when the really big fix went in. He handwashing that that was only localized and not global, yet the raw data for Canada, Greenland, Scandinavia, Russia ere the same pattern and later Paul Homewood showed the same pattern for Paraguay and Ecuador, an finally, a few months ago, a S African commenter here at WUWT linked to the raw data for Capetown – the same thing. If Hadcrut, GISS, NOAA, BEST, ETC really wanted a test for global temperature series patterns. These are robust support indeed.
I would love to see that if anyone saved a copy, or a link?
Steve Goddard has shown how consistently the books have been cooked. The graphs above provide a better picture of real “climate change” than the heavily and continuously stepped upon so-called temperature “data” series. But even they include the bogus, no longer reporting and made up “data” stations, which now number over 40% of the USHCN stations.
The 1990s versions were even more pronounced: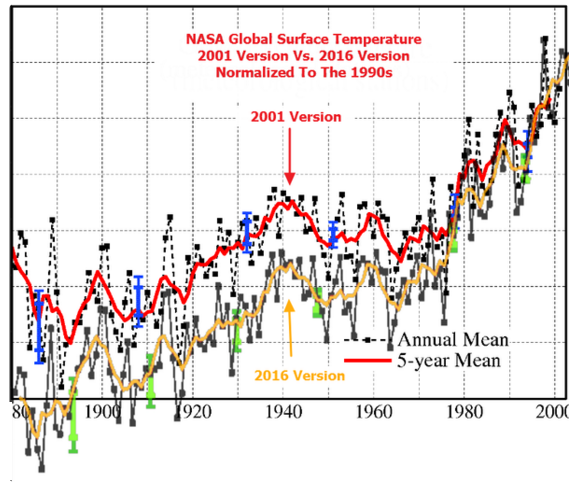
Perhaps Heller’s most famous comparison: ?w=640
“GISS Nasa still had 1937 higher than 1998 as late as 2007”
The stations covering the Arctic were also higher around 1937.
http://i772.photobucket.com/albums/yy8/SciMattG/RSS%20Global_v_RemovedAMO2_zpsssrgab0r.png
Correct link below.
http://i772.photobucket.com/albums/yy8/SciMattG/ArcticTempsSurface1936_zpspod7pd2i.png
Matt G, your Arctic Absolute Temperature graph could be interpreted as showing the beginning and end of a 60 to 70 year cycle. Do you have any pre-1936 data?
There are a dozen stations with data pre-1900 that show warming until around 1937 since around the 1880’s. The timeline before shown has been excluded due to limited number of stations. There is no data before the 1880’s and all show warming up to around 1937.
Dave, a compilation of several Arctic temperature stations.

And some Iceland temperature stations
Here’s what I have for Arctic temps, as well as station count. but most stations are near the coast of where ever they are at.
We have to believe everything here. It says at the top of the graphic: “Global Mean Surface TemperaTRUE Change (degrees Celsius).
So it must be TRUE!!!!!!!
Until they stop dicking around with the temp history…
..all these models, articles, papers, etc are moot
Well I’ve finally gotten proof that I’m a climate scientist. I have been suggesting this simple idea since Tisdale s busy presence here at WUWT. I didn’t think it was ‘novel’, more in the common sense range. Indeed I actually thought that others were of the same persuasion, that enso was just being used as a lazy shortcut to integrating the effect of all the oceans.
I responded to Tisdale on threads concerning the nature of the coming 1916 El Nino, remarking that the Warm layer at the time was thinner than at other times and the temperature was going to drop fairly quickly. I suggested that he calculate how much heat was in this layer, thinning rapidly, and make an estimate of the duration and end behavior of the event.
Also lately I have been arguing that this time ENSO was considerably decoupled from the usual relation. The flip over of major hot spots in both temperate zones into cold spots including a large part of the western Pacific warm pool was going to give a cooler world than would be estimatable from ENSO.
As an old engineer I just didn’t realize this was new strides in climate science. Maybe the Chinese have been watching me! I did make the mistake of giving out a lot of cards at conferences there!
The text and graph highlight the similarity between the early and late twentieth century warming. Lots of people, including Judith Curry, think the alarmists haven’t explained why the early warming should be due to natural variation but the later warming should be due to anthropogenic CO2. link
IMHO, the similarity of the early and late twentieth century warming is one of the big holes in CAGW. The Yao et al paper does a service by highlighting that similarity.
Thanks for that, cBob. That IS a good thing. If he would imitate your writing/analysis, Snarling Frank above also would convince me (at least as to there being SOME merit to the paper — bolstering the conjecture that CO2 drives ocean heat content seems to be the paper’s main purpose, so, it’s mostly junk, imo).
The surface temperature of water/ice will always approach the dew point of the air because both evaporation and condensation occur around the saturation point. This applies as well to the water/ice in clouds. So the amount of water vapor in the air is controlling the surface temperature of water/ice, CO2 concentrations are just following the temperature, not controlling it. These surfaces are radiating at that dew point temperature on the ocean surface as well as the tops of thunder clouds.
“Our results identify multiple ocean surface temperature change as a major driver for global mean surface temperature changes on multi-decadal timescales”. So, now they found the real culprit: a temperature change, which is guilty for a temperature change. Very clear.
Maybe I don’t read so well; They seem to say that overall temperature changes are caused by or track ocean temperature changes. They imply oceans’ temperature change are independent of CO2 concentrations. They do not say what drives ocean temperature changes.
Did I miss the reference to the Stadium Wave and its impact on global climate?
Seriously, the paper looks relevant, but it would be even more relevant if they built on the Stadium Wave. Or, conversely, if they found evidence against it. Instead, mainstream climatologists just ignore it because Judith Curry is associated with it.
Q = U A dT
The insulated walls of your house lose energy/heat (energy is thermal property, heat is thermal process) at a specific rate, Q, Btu/h, determined by U, conductivity, A, area and the temperature difference.
If you raise the thermostat setting the furnace will release more heat into the house and since U does not change the only way for the increased in Q can pass through the walls is for dT to increase, i.e. it gets warmer in the house.
Even Pierrehumbert acknowledged this in his 2011 paper.
This works for the atmosphere, too. The atmospheric “blanket” has a U value which is a composite of conduction, convection, latent and radiative heat processes. If Q increases for whatever reason, e.g. released from the oceans, dT must increase as does the surface temperature. No RGHE “back” radiation thermodynamic hocus pocus needed.
In the case of the atmosphere, U is not necessarily a constant.
Tom,
Is U different? You bet it’s different. It’s ALL different everywhere in the atmosphere and all over the globe.
But first some definitions and ground rules so we are on the same page, i.e. mine.
Thermal resistance, that R value you see in the insulation aisle at Home Depot, is the inverse of conductivity, i.e. high R, low U, low Q and low R, high U, high Q.
Q is Btu/eng h or kJ/SI h. W/m^2 is useless for real heat balances.
I consider the top of the atmosphere, ToA, to be the point where molecules disappear. I have seen it said that 99% of the atmospheric mass is below 32 km. Nothing about the atmosphere or for that matter the earth is average. Above 32 km there are no molecules and the common concept of temperature is meaningless. Above that line radiation runs the energy machine. At that boundary in & out must balance.
The atmospheric R at the equator is relatively high because ToA is relatively thick. But Q is higher because the dT is greater. Which came first, Q or dT?
The atmospheric R at the poles is relatively low because ToA is relatively thin. But Q is lower because the dT is smaller. Which came first, Q or dT?
R might be higher with a sky full of clouds or high relative humidity. Q and dT are different over land, oceans, jungles, snow. Winds, storms, rain, snow, Hadley cells move Q from one place to another. Lit side net heat gain versus dark side heat loss.
So, try to model all of that.
Full consideration of the fluid dynamics, heat transfer, thermodynamics, chemistry, physics, geometry, geology, et. al. requires a climate model thousands of times more complex than the earth as a ball suspended in and evenly heated (342/240 W/m^2) by a bucket of warm poo where GHGS/CO2 and that scientific obscenity of “back” radiation are the sole control knobs for the entire process.
But that’s not how you start to model this. You take the baseline case, in fact for the most part it’s the only one that really counts. Clear calm skies for a 24 hr sun cycle, sunrise to sunrise, because it’s all radiation, as that’s the only thing that leaves the planet. You need to account for a full year at a range of latitudes over a 24 hour cycle. The Sun charges up the ground, atm, water vapor, and then that night it cools quickly down towards dew point, then changes the cooling rate at the surface, using the energy stored as water vapor to keep it warmer. Once we have this, weather just modifies this baseline.
Q of average tropical station is ~72KJ/m^3, drops ~9KJ/m^3 over night. Deserts in SW USA, Q ~35KJ.m^3, drop 18KJ/m^3.
Min T follows/sets dew point at ~98% correlation.
Co2 matters when average temp is -40, once the water cycle starts, the energy involved in both state changes turns the atm/solar cycle a natural heat pump.
micro6500,
At night the air cools rapidly and becomes colder than the ground. The ground does not cool rapidly and stays warmer than and warms the air all night.
I have data to back that up.
The ground DOES NOT radiate at 396 W/m^2 per K-T. Even the IPCC/WMO 15 C “surface” at 1.5 m DOES NOT, because of conduction/convection/latent, radiate at 396 W/m^2. The 333 W/m^2 of “back” radiation is a thermodynamic impossibility.
You are not measuring what you think you are measuring.
The air does not cool faster than the interfacial surface of ground or water. Think a little. Why does dew or frost form on surfaces at night?.
There’s a big optical window to space that only has some of water in it. IR thermometer of this window follows surface temps, and is from 70 to over 100F colder than the surface. But if you follow the rate temps change, it doesn’t follow the exponential decay, it changes, and it changes as air temps near dew point temps. At about 2:30 AM Air temps did not reach freezing, the sky was ~-65F
It takes a long time to cool the ground, but the surface of grass, and cars, exposed to space for cooling, and isolated from the ground get dew or frost. I measured -20F on the frost on my truck.
If there is any moisture in the soil, the temperature at the interface will approach the dew point. The soil underneath will remain hotter because conductivity is low. However, The surface will radiate at the surface temperature. Oceans are water,
I think it really depends on the type of surface, but yes I agree.
Grass acts like insulation, and frosts, while bare ground, or concrete doesn’t even go below freezing.
This was 4 separate measurement, first at about 6PM, twice more later in the evening, then about sunrise.
Remember, most of the surface is either covered with water or ice, Impervious surfaces like asphalt and concrete are what contributes to the heat island effect.
Air temps will still follow dew point until water freezes out, or humidity maxes out, and then as it cools it has to dump 4KJ/kg as sensible heat to condense.
Each range of latitudes would have different versions of this
Sure I am. But the charts from Trenberth are nonsense. You have to go out and measure what is happen all day long, and what you find is the atm acts like a temperature controlled transistor that alters radiation, and surface temps.

You can see net radiation change, the same time the rate temps drop changes.
http://onlinelibrary.wiley.com/doi/10.1029/2003GL019137/pdf
You can easily see the inflection point, that is water vapor regulating cooling rates. That eliminates most of the energy from a day’s worth of extra co2 (whatever amount you think it might be, doesn’t matter).
Water vapor is acting as a regulator, but it only does it at certain times, and conditions, and an average hides the dynamics, to make it look static, to which a linear add of co2 is not unreasonable.
It just doesn’t work like that. It’s so simple, and what most humans already know. They just didn’t recognize it.
I did.
fhhaynie June 14, 2017 at 8:48 am
To understand dew point and frost you need to refer to the psychrometric properties of moist air. Trane’s commercial site charts has a free interactive psychrometric program.
If you follow the enthalpy lines, as air absorbs water it can cross over the freezing point even though the dry bulb is above freezing.
Cold beer on a humid day. No IR hocus pocus required.
its the middle if the night, clear calm skies ocer land, maybe in a desert, air isnt absorbing water.
It’s condensing water vapor to liquid at 4.21KJ/kg emitted. Temps are falling, rel humidity is nearing 90-100% but it is not foggy, I’m still imaging galaxies.
fhhaynie June 14, 2017 at 10:30 am
“The surface will radiate at the surface temperature.”
Not entirely. Maybe in space, but at the earth’s/ground’s surface with molecules present conduction, convection and latent heat processes are in effect. Radiation gets the leftovers so emissivity will be quite low. The ASSUMPTION that the ground has an 0.95 emissivity is just flat wrong.
In K-T the leftover radiation is 63 W/m^2. Insert that and 289K in S-B and emissivity comes out about 0.15.
KT is hiding multiple dynamic processes averaged into a pile, so you can’t tell a thing about it. And you get frost above freezing because the sky is -60F, and when you optically limit the field of view, the SB equation for a small area limited to deep space, gets quite cold. It is an optical thing.
Schroeder where did you drop out of school? There’s no such thing as refractive insulation between any object and fire warming it that makes the object warmer due to it’s presence there.
This is the principle behind placing a blanket between yourself and a fire in emergencies. You’re actually in here claiming you believe there is insulation between a fire and rock that makes the rock emit more light, as it makes less light ever reach it.
You’re speaking as someone unable to correctly answer the question, ”what happens to the temperature of a rock, that has less warming light warm it, due to insulation refracting away part of the warming light?
And global brightening, which is related to the clean up of real air polution.
http://www.iac.ethz.ch/group/climate-and-water-cycle/research/radiation-and-the-hydrological-cycle/global-dimming-and-brightening/_jcr_content/par/fullwidthimage/image.imageformat.lightbox.1744331090.png
I’ve always loved this excuse for the 1945-75 cooling period, but especially the lack of an answer for why and how it brightened from 1880-1940 despite the ever increasing use of unfiltered coal burning. It’s like the soot just magically appeared in 1940. Meh, it cooled from 1945-75 because of natural processes, likely those described in this paper.
Global brightening and dimming by aerosols makes co2 climate sensitivity suspgnificantly lower.
Rising coal use in china implies another cooling cycle, see record winters in mongolia.
https://fallmeeting.agu.org/2015/files/2015/12/Wild-slides.pdf
“Note – the misspelling of temperature in the title is the author’s, not WUWT”. I’m ™ing that — Temperatrue™ is now mine. Covfefe!
I think there is a gap in the cause/effect chain, here. Something is the root cause but just saying energy transfer between the two major fluid mediums in the Earth system is not it. Climate change is a change in trend of the incoming/outgoing energy ratio in the entire Earth system. Moving energy from the oceans to the atmosphere is fiddling energy that is already here.
My first response was … Breathing directly linked to maintaining viability in humans
In other words, just the title seemed to state something so obvious and general as to be yawn worthy.
But, I’ll try to read the paper, just to be fair.
Paywall blockade that I can’t find a way around, … so no go on the article read.
Sunshine directly linked to plant growth
Yet another example of climate scientists exhibiting symptoms of cryptomnesia.
What is with this websites owner? Can you not yet cut the propaganda? Haven’t you already made enough millions from the Heritage Institute that you can’t cut this shite that you personally don’t even believe?
For all you deniers out there the planet just recorded its highest ever temperature of 53.5C in Pakistan. India is going thru a terrible heat wave. We also just recorded 33C at 5000 meters in the Himalayas. I believe that is an altitude higher than any mtn in N. America.
[??? .mod]
Mark,
So make the case/cause/coincidence/connection between 53.5 C and 0.4% CO2
Or not.
Or visit realclimate for real data on India/Pakistan temps.
https://realclimatescience.com/2017/06/more-heatwave-lies-as-funding-dies/
Mark – you are confusing weather and climate.
Firstly 53.5c is not the highest world temperature recorded.
http://www.pmd.gov.pk/FFD/cp/pmaxtemp.asp
Secondly for 13th June the highest temperature was 47.5c.
Maybe cutting down all that tropical forest where the indian tiger used to live has something to do with this ??????
So yes it would be man made.
80.96° S, 67.87° E✕ -68.6 °C
https://earth.nullschool.net/#current/wind/surface/level/overlay=temp/orthographic=101.51,-83.27,1332/loc=67.869,-80.964
Surface ocean cooling (latitude 40 to 60) continues. This is the same region of the planet that has cyclically warmed and cooled, in the past, correlating with solar cycle changes.
http://www.ospo.noaa.gov/data/sst/anomaly/2017/anomnight.6.12.2017.gif
The current cooling correlates with the sudden disappearance of solar coronal holes (Ap, month average, has dropped from 11.7 to 5). The solar wind bursts create a space charge differential in the ionosphere which in turn causes an electric current to flow from high latitude regions (40 to 60 degrees latitude) to the equatorial region. The electric current flow is believed to change cloud properties and cloud lifetimes which in turn causes warming or cooling both locations.
See section 5a) Modulation of the global electrical circuit in this review paper, by solar wind bursts and the process electroscavenging.
http://gacc.nifc.gov/sacc/predictive/SOLAR_WEATHER-CLIMATE_STUDIES/GEC-Solar%20Effects%20on%20Global%20Electric%20Circuit%20on%20clouds%20and%20climate%20Tinsley%202007.pdf
Surface ocean cooling (latitude 40 to 60) continues. This is the same region of the planet that has cyclically warmed and cooled, in the past, correlating with solar cycle changes.
http://www.ospo.noaa.gov/data/sst/anomaly/2017/anomnight.6.12.2017.gif
Maybe they’re looking a little too hard for cause-and-effect relationships. Some things are just random natural variability.
https://papers.ssrn.com/sol3/papers.cfm?abstract_id=2985439
“Our results identify multiple ocean surface temperature change as a major driver for global mean surface temperature changes on multi-decadal timescales.”
One graph showing the AMO already finds ocean surface temperature change as a major driver for global surface temperature changes on multi-decadal timescales. This one is real not assumptions from a unverified model.
http://s772.photobucket.com/user/SciMattG/media/RSS%20Global_v_RemovedAMO2_zpsssrgab0r.png
http://i772.photobucket.com/albums/yy8/SciMattG/RSS%20Global_v_RemovedAMO2_zpsssrgab0r.png
Ahhh! Ain’t that cute!!!!!! Too bad Human Caused Globall Warmining is proved, yet again, still, to be a blatant lie. Humans are not causing the “climate” to “change” and can not stop the “climate” from “changing”. Period. Full Stop. And yet they keep spewing the lies of their fake religion. Just like the [pruned]. Funny how that works.
10 years ago Compo et al found the oceans accounted for most of the warming in the models. So 10 years ago AGW hinged on ocean heating from CO2.
https://www.esrl.noaa.gov/psd/people/gilbert.p.compo/CompoSardeshmukh2007a.pdf
Abstract
Evidence is presented that the recent worldwide land warming has occurred largely in response to a worldwide warming of the oceans rather than as a direct response to increasing greenhouse gases (GHGs) over land.
Atmospheric model simulations of the last half-century with prescribed observed ocean temperature changes, but without prescribed GHG changes, account for most of the land warming. The oceanic influence has occurred through hydrodynamic-radiative teleconnections, primarily by moistening and warming the air over land and increasing the downward longwave radiation at the surface. The oceans may themselves have warmed from a combination of natural and anthropogenic influences.
In the CBC agitprop file, Nicole Mortillaro tells us of potential water shortage in Iqaluit…
http://www.cbc.ca/news/technology/iqaluit-will-run-out-of-water-1.4156559
The lead is dire:
“Iqaluit may face a water shortage within five years, owing to shifting seasons, faster warming in the Arctic than anywhere on Earth and a growing population.”
But the reality is:
“… the average consumption of water in Iqaluit was roughly 350 litres per person per day. That’s much higher than the average Canadian consumption of approximately 250 litres. And in Rankin Inlet the number is astonishingly high: 950 litres per day.
It’s not that people in Iqaluit or Rankin Inlet are water wasters: before the water even makes it into a residence, much of it has leaked or bled out. The problem is aging pipes that crack and leak in the harsh climate.”
So cracked pipes do not make a story but if you add “climate change”, then you get a peer reviewed paper and a sure CBC promote!
We badly need a comprehensive paper that –
1. Shows the observed changes in Surface Sea Temperature SST and at some deeper levels –
2. for scales of water from tiny lakes, to single ocean observation stations to basins to whole oceans, to global –
3. with mechanisms to show which processes can heat and cool the water at the rates and scales detailed in 1. and 2. above, for periods of global warming as well as relative global cooling –
4. leading to rejection of some proposed heat control processes and hopefully, the retention of one process that applies at all rates and scales –
5. or, lacking a single process at 4. , a simple combination of processes able to account for all change.
…………………………
If there has already been a publication that does this, a reference would be nice.
…………………………
There has been too much speculation to date. People should not claim for example, that downwelling IR radiation is a source of ocean heating if it is a physical impossibility to create the scale and rate of observed change. Try to replace speculation with good data and credible deduction.
………………………..
Many papers to date have been too fragmented, in that they address non-representative volumes of water, or study areas, with limited consideration of all possible processes.
……………………….
It is a no-brainer that oceans are involved in climate change. The question is how much, all of it, some of it, insignificant amounts?
Geoff.
Having watched a BBC programme on the formation of planets and their evolution it is SO clear the CO2 as the cause of anything is plain wrong. Let me explain why. Not enough energy in the air to change planetary ocean systems by 12 degrees K or so. Clearly air temperature average is driven largely by ocean temperature, which is driven by larger forces than tiny greenhouse effects , times some dreamed up multiplier. MOST IMPORTANT, the actual planet has NEVER worked like that since there were PLANTS.
We already understand the atmosphere is mostly a consequence of the must larger effects that control it. The Sun and the Ocean. And Ocean variability primarily controls long term atmospheric temperature variation, humidity and the CO2 content of the atmosphere, given the Sun’s relative consistency, and the fact there is a balance between heat in and heat out. There is another heat source, however.
But first let’s nail CO2 and AGW as a dominat cause of climate change. We KNOW the majority effect on CO2 is, of course, plants. Plants provided the major reduction in CO2 from 95% of the atmosphere to trace levels at <0.1%, in the initial "decarbonistion" of the planet's atmosphere, from a CO2 rich volcanic atmosphere to an oxygen and nitrogen rich atmosphere. The plants really went for it. Only enough trace levels of CO2 left to maintain plant (and human) life when plants finally ceased to grow, so first responding actively and massively to the high levels of CO2, and then to their rapidly declining levels. That's a serious long term control mechanism.
Interestingly, Venus never got the plants, maybe because water never condensed to support plants, so it's stuck at 95% CO2 + water vapour plus some serious volcanoes, and no plates (tectonic).
*** It seems very obvious the change to slightly higher trace levels of CO2 from industrialisation will almost certainly be absorbed by increased vegetation, as it always has been, the natural regulator.
Who in climate science explains why this established mechanism would suddenly stop working? It's Lovelock's organic and physical interaction to produce Gaia. Worked for Billions of years. But not any more, per Mann et al. The sky is falling! Nonsense promoted only for profit and fame. Nothing wrong with conservation and being nice to our environment. Denying the real, and in fact very obvious science facts for your own profit and ego is despicable.
So where are the serious smoking guns that CAN drive us from ice ages to short interglacials, still warm enough in the absolute cold of space to support life??
As suggested by others here, I did some numbers and geology. There are a lot more potential drivers under the oceans where the serious heat is, generated by the internal radioactivity and graviational energy of the Sun's variable effect on the Earth's mobile 7Km thick tectonic basalt crust, and the radioactive heat generation of the core itself. 30% gravitational change occurs pa during a Milankovitch eccentricity extreme. The Sun exerts a gravitational force 200 times the Moon on the Earth………
See Jupiter's gravtational effeect on Io for what gravity can do to what would otherwise be a very cold rock.
And, what keeps the planet at stable ice age temperature most of the time, and kicks off the occasional 12 degree rise into a short interglacial, on a consistent 100K year periodicity between pretty repeatable limits? Hot stuff in cold space, perhaps?
Trace Level CO2 is, SeElf Evidently, a Trendy Fake Science Distraction From the Dominant Causes of climate change: I suggest it is clear the plants will eat all the CO2 leaving enough for survival, and adjust to the amount, as they always have. CO2 is simply not able to create the extremes and poiitive feedback hypothesised. The atmosphere is controlled by the oceans and the rocks long term, and shorter term by the Sun, not contolling.
Finally what climate scientists should do is look where the serious potential sources of change are. Not get fixated on what cannot and clearly never has caused global warmin.
what climate scientists should focus on is the Oceans, and what happens under them to change their temperatures. THat requires huge amounts of heat to change the equilibrium condition 12 degrees or so across the planet, but still keep it warm enough to avoid becoming Hoth during ice ages. Where does this heat come from, at the Milankovitch cycle's period, that correlates with the effects and can also produce substantial internal energy changes in the planet's structure, as well as annual solar radiance extremes, but the same net radiant enrgy. It's underneath you! (And the Plant's ate all the CO2).
Just saying.
As the famous last line of the Prisoner should have been "I'm over here!". This is all about real physics and enrgy. Climate scientists are as busy proving what is in reality daft and too weak to account for the physical effects of climate change as renewablists are in promoting what is too weak and intermittent to deliver anything they claim for their so called solutions, in reality to non existent problems.
Real science is in trouble because it got involved with, and allowed itself to be exploited by, extremists, politics and big money. Phlogiston and the fake Science Inquisition rules. The Sun orbits the Earth again. Until climate scientists raise thei gaze and their game, and start looking in more technically credible places for answers, they will never make their models work, because they simply can't. As witt renewables promoted in ther name of of CO2 related AGW, there just isn't enough energy. Get over it. Save us all a fortune and jeopardising a properous future for all the people of our plante with your clearly flawed beliefs. CPhys, CEng, MBA
E&OE Typos excepted. Sensible comment to improve and develop this approach very welcome. Here are some numbers to check relative heat contents and enrgy transfer from magma release for yourself. Peer review on the facts and laws of physics welcome. No unprovabe fake science beliefs please.
No idea how to paste a table into this user hostile UI so hope this good enough format.
WORK IN PROGRESS: GLOBAL HEAT ENERGY NUMBERS
ITEM : Total Mass Kg : S.Heat KJ/Kg Deg K : Planetary Heat Capacity
J/Deg K
Water 1.4×10^21 4.18 5.85×19^24
"Rock" 5.9×10^24 0.84 4.72×10^27
Air 5.1×10^18 1.01 5.65×10^21
Quantity of Magma at 1,000 Degree Delta to deliver 1 degree Ocean heating (i)
M Kg = 5.8×10^24/1,000 Deg x 1×10^3 J/DegKg(SH)
M= 5.8 x 10^18 Kg of Magma per degree K
Quantity to raise Oceans 12 Degrees K 5.8 x 12 x 10^18 = 70 x 10^18 Kg, 70 x 10^15 Tonnes
(i) This assumes Basalt has a SH of 1KJ/KG, this can vary quite a lot with temperature as the rock structure changes. But I needed a working number. It doesn't change the big picture.
A quick check says Mount Fuji contains 3.8×10^11 tonnes, mainly basalt. It is only one ice age old, so has risen in that time. Similar things have happened at sea. But my hypothesis needs a LOT of Mount Fujis, 2 x10^4 in a few hundred years, plus evidence of Milankovitch related cyclic variation in Volcanic activity. Japans would have that on land, with 10% of the worlds volcanoes, those on land I assume.
Free to share but © Brian RL Catt June 2017 for publishing or academic record discovery purposes. Please quote this line with any repost.
They don’t have enough sensors to measure the heat content of the oceans to that degree of accuracy.
What this really boils down to is clouds, and there is no model that can deal with them.
It is reassuring that they have confirmed what every meteorology textbook since the beginning of the last century has taught: the surface warms the air.

SST (red) leads, AT (green) follows.
Latent and sensible heat fluxes, ocean/atmosphere, from Singh et al (2005). Sensible heat is the kind thermometers measure. Areas of negative flux (where the atmosphere is warmer than the ocean) are very rare.